
Preferential Metabolic Improvement by Intermittent Fasting in People with Elevated Baseline Red Cell Distribution Width: A Secondary Analysis of the WONDERFUL Randomized Controlled Trial

 ,
,  ,
, 
Abstract
:1. Introduction
2. Materials and Methods
2.1. Design
2.2. Baseline Study Variables and Outcomes
2.3. Statistical Considerations
3. Results
4. Discussion
4.1. Summary of Findings
4.2. Medical Context of Elevated RDW
4.3. RDW as an Effect Modifier
4.4. Limitations
5. Conclusions
Author Contributions
Funding
Institutional Review Board Statement
Informed Consent Statement
Data Availability Statement
Conflicts of Interest
References
- Trepanowski, J.F.; Kroeger, C.M.; Barnosky, A.; Klempel, M.C.; Bhutani, S.; Hoddy, K.K.; Gabel, K.; Freels, S.; Rigdon, J.; Rood, J.; et al. Effect of alternate-day fasting on weight loss, weight maintenance, and cardioprotection among metabolically healthy obese adults: A randomized clinical trial. JAMA Intern. Med. 2017, 177, 930–938. [Google Scholar] [CrossRef]
- Schübel, R.; Nattenmüller, J.; Sookthai, D.; Nonnenmacher, T.; Graf, M.E.; Riedl, L.; Schlett, C.L.; von Stackelberg, O.; Johnson, T.; Nabers, D.; et al. Effects of intermittent and continuous calorie restriction on body weight and metabolism over 50 wk: A randomized controlled trial. Am. J. Clin. Nutr. 2018, 108, 933–945. [Google Scholar] [CrossRef]
- Carter, S.; Clifton, P.M.; Keogh, J.B. Effect of intermittent compared with continuous energy restricted diet on glycemic control in patients with type 2 diabetes. A randomized noninferiority trial. JAMA Netw. Open 2018, 1, e180756. [Google Scholar] [CrossRef] [PubMed]
- Gray, K.L.; Clifton, P.M.; Keogh, J.B. The effect of intermittent energy restriction on weight loss and diabetes risk markers in women with a history of gestational diabetes: A 12-month randomized control trial. Am. J. Clin. Nutr. 2021, 114, 794–803. [Google Scholar] [CrossRef]
- Sutton, E.F.; Beyl, R.; Early, K.S.; Cefalu, W.T.; Ravussin, E.; Peterson, C.M. Early time-restricted feeding improves insulin sensitivity, blood pressure, and oxidative stress even without weight loss in men with prediabetes. Cell Metab. 2018, 27, 1212–1221.e3. [Google Scholar] [CrossRef] [Green Version]
- Jamshed, H.; Beyl, R.A.; Della Manna, D.L.; Yang, E.S.; Ravussin, E.; Peterson, C.M. Early time-restricted feeding improves 24-h glucose levels and affects markers of the circadian clock, aging, and autophagy in humans. Nutrients 2019, 11, 1234. [Google Scholar] [CrossRef] [Green Version]
- Hutchison, A.T.; Regmi, P.; Manoogian, E.N.C.; Fleischer, J.G.; Wittert, G.A.; Panda, S.; Heilbronn, L.K. Time-restricted feeding improves glucose tolerance in men at risk for type 2 diabetes: A randomized crossover trial. Obesity 2019, 27, 724–732. [Google Scholar] [CrossRef] [PubMed]
- Cai, H.; Qin, Y.L.; Shi, Z.Y.; Chen, J.H.; Zeng, M.J.; Zhou, W.; Chen, R.Q.; Chen, Z.Y. Effects of alternate-day fasting on body weight and dyslipidaemia in patients with non-alcoholic fatty liver disease: A randomised controlled trial. BMC Gastroenterol. 2019, 19, 219. [Google Scholar] [CrossRef] [PubMed]
- Bartholomew, C.L.; Muhlestein, J.B.; May, H.T.; Le, V.T.; Galenko, O.; Garrett, K.D.; Brunker, C.; Hopkins, R.O.; Carlquist, J.F.; Knowlton, K.U.; et al. Randomized controlled trial of once-per-week intermittent fasting for health improvement: The WONDERFUL Trial. Eur. Heart J. Open 2021, 1, oeab026. [Google Scholar] [CrossRef]
- Horne, B.D.; Muhlestein, J.B.; May, H.T.; Carlquist, J.F.; Lappé, D.L.; Bair, T.L.; Anderson, J.L. Relation of routine, periodic fasting to risk of diabetes mellitus and coronary artery disease in patients undergoing coronary angiography. Am. J. Cardiol. 2012, 109, 1558–1562. [Google Scholar] [CrossRef]
- Bartholomew, C.L.; Muhlestein, J.B.; Anderson, J.L.; May, H.T.; Knowlton, K.U.; Bair, T.L.; Le, V.T.; Bailey, B.W.; Horne, B.D. Association of periodic fasting lifestyles with survival and incident major adverse cardiovascular events in patients undergoing cardiac catheterization. Eur. J. Prev. Cardiol. 2021, zwaa050. [Google Scholar] [CrossRef]
- Horne, B.D.; Grajower, M.M.; Anderson, J.L. Limited evidence for the health effects and safety of intermittent fasting among patients with type 2 diabetes mellitus. JAMA 2020, 324, 341–342. [Google Scholar] [CrossRef] [PubMed]
- Anderson, J.L.; Ronnow, B.S.; Horne, B.D.; Carlquist, J.F.; May, H.T.; Bair, T.L.; Jensen, K.R.; Muhlestein, J.B. Usefulness of a complete blood count-derived risk score to predict incident mortality in patients with suspected cardiovascular disease. Am. J. Cardiol. 2007, 99, 169–174. [Google Scholar] [CrossRef] [PubMed]
- Majercik, S.; Fox, J.; Knight, S.; Horne, B.D. Red cell distribution width is predictive of mortality in trauma patients. J. Trauma Acute Care Surg. 2013, 74, 1021–1026. [Google Scholar] [CrossRef] [PubMed]
- Seyhan, E.C.; Özgül, M.A.; Tutar, N.; Ömür, I.; Uysal, A.; Altin, S. Red blood cell distribution and survival in patients with chronic obstructive pulmonary disease. COPD 2013, 10, 416–424. [Google Scholar] [CrossRef] [PubMed]
- Danese, E.; Lippi, G.; Montagnana, M. Red blood cell distribution width and cardiovascular diseases. J. Thorac. Dis. 2015, 7, E402–E411. [Google Scholar]
- Horne, B.D.; Muhlestein, J.B.; Bennett, S.T.; Muhlestein, J.B.; Jensen, K.R.; Marshall, D.; Bair, T.L.; May, H.T.; Carlquist, J.F.; Hegewald, M.; et al. Extreme erythrocyte macrocytic and microcytic percentages are highly predictive of morbidity and mortality. JCI Insight 2018, 3, e120183. [Google Scholar] [CrossRef] [PubMed]
- Patel, K.V.; Ferrucci, L.; Ershler, W.B.; Longo, D.L.; Guralnik, J.M. Red blood cell distribution width and the risk of death in middle-aged and older adults. Arch. Intern. Med. 2009, 169, 515–523. [Google Scholar] [CrossRef] [Green Version]
- Foy, B.H.; Carlson, J.C.T.; Reinertsen, E.; Valls, R.P.I.; Lopez, R.P.; Palanques-Tost, E.; Mow, C.; Westover, M.B.; Aguirre, A.D.; Higgins, J.M. Association of red blood cell distribution width with mortality risk in hospitalized adults with SARS-CoV-2 infection. JAMA Netw. Open 2020, 3, e2022058. [Google Scholar] [CrossRef]
- Perlstein, T.S.; Weuve, J.; Pfeffer, M.A.; Beckman, J.A. Red blood cell distribution width and mortality risk in a community-based prospective cohort. Arch. Intern. Med. 2009, 169, 588–594. [Google Scholar] [CrossRef] [PubMed] [Green Version]
- Horne, B.D.; Muhlestein, J.B.; Lappé, D.L.; May, H.T.; Carlquist, J.F.; Galenko, O.; Brunisholz, K.D.; Anderson, J.L. Randomized cross-over trial of short-term water-only fasting: Metabolic and cardiovascular consequences. Nutr. Metab. Cardiovasc. Dis. 2013, 23, 1050–1057. [Google Scholar] [CrossRef]
- Yčas, J.W.; Horrow, J.C.; Horne, B.D. Persistent increase in red cell size distribution width after acute diseases: A biomarker of hypoxemia? Clin. Chim. Acta 2015, 448, 107–117. [Google Scholar] [CrossRef]
- Patel, H.H.; Patel, H.R.; Higgins, J.M. Modulation of red blood cell population dynamics is a fundamental homeostatic response to disease. Am. J. Hematol. 2015, 90, 422–428. [Google Scholar] [CrossRef] [PubMed] [Green Version]
- Hotamisligil, G.S. Inflammation and metabolic disorders. Nature 2006, 444, 860–867. [Google Scholar] [CrossRef] [PubMed]
- Ruderman, N.B.; Aoki, T.T.; Cahill, G.F., Jr. Gluconeogenesis and its disorders in man. In Gluconeogenesis: Its Regulation in Mammalian Species; Hanson, R.W., Mehlman, M.A., Eds.; Wiley: New York, NY, USA, 1976; pp. 515–530. [Google Scholar]
- Walton, C.M.; Jacobsen, S.M.; Dallon, B.W.; Saito, E.R.; Bennett, S.L.H.; Davidson, L.E.; Thomson, D.M.; Hyldahl, R.D.; Bikman, B.T. Ketones elicit distinct alterations in adipose mitochondrial bioenergetics. Int. J. Mol. Sci. 2020, 21, 6255. [Google Scholar] [CrossRef] [PubMed]


| Characteristic | Overall | RDW-SD < 42.6 fL | RDW-SD ≥ 42.6 fL | p-Value |
|---|---|---|---|---|
| Sample Size | N = 71 | n = 35 | n = 36 | ----- |
| Randomization | ||||
| Intermittent Fasting | 53.5% | 51.4% | 55.6% | 0.73 |
| Demographics | ||||
| Age (years) | 49.1 ± 11.1 | 46.4 ± 10.2 | 51.8 ± 11.4 | 0.042 |
| Age min, max | 27.7, 69.9 | 28.7, 66.7 | 27.7, 69.9 | ----- |
| Sex (female) | 64.8% | 62.9% | 66.7% | 0.74 |
| Race (nonwhite) | 2.8% | 2.9% | 2.8% | 0.98 |
| Ethnicity (Hispanic) | 7.0% | 8.6% | 5.6% | 0.62 |
| Cardiometabolic Risk Factors | ||||
| Insulin (mIU/L) | 11.2 ± 5.9 | 10.6 ± 4.7 | 11.8 ± 6.8 | 0.40 |
| Glucose (mg/dL) | 93.6 ± 12.8 | 93.3 ± 13.9 | 93.9 ± 11.8 | 0.84 |
| HOMA-IR | 2.64 ± 1.53 | 2.46 ± 1.15 | 2.82 ± 1.83 | 0.33 |
| Metabolic Syndrome Score | 4.05 ± 3.76 | 3.47 ± 3.96 | 4.62 ± 3.51 | 0.20 |
| Weight (kg) | 100.7 ± 23.3 | 95.9 ± 21.2 | 105.4 ± 24.6 | 0.09 |
| Body Mass Index (kg/m2) | 33.7 ± 7.5 | 32.3 ± 6.5 | 35.0 ± 8.3 | 0.14 |
| Waist Circumference (cm) | 105 ± 20 | 102 ± 19 | 108 ± 20 | 0.47 |
| Systolic Blood Pressure (mmHg) | 128 ± 12 | 126 ± 13 | 131 ± 10 | 0.06 |
| Diastolic Blood Pressure (mmHg) | 81.4 ± 9.1 | 79.4 ± 10.3 | 83.4 ± 7.4 | 0.07 |
| Total Cholesterol (mg/dL) | 200 ± 26 | 203 ± 27 | 197 ± 26 | 0.38 |
| LDL Cholesterol (mg/dL) | 127 ± 19 | 130 ± 20 | 124 ± 18 | 0.23 |
| HDL Cholesterol (mg/dL) | 46.1 ± 11.2 | 45.3 ± 8.9 | 46.9 ± 13.2 | 0.54 |
| Triglycerides (mg/dL) | 135 ± 72 | 141 ± 77 | 130 ± 67 | 0.54 |
| Complete Blood Count | ||||
| Red Blood Cell Count (×106/μL) | 4.88 ± 0.38 | 4.95 ± 0.43 | 4.81 ± 0.32 | 0.11 |
| Hemoglobin (g/dL) | 14.5 ± 1.0 | 14.6 ± 1.1 | 14.3 ± 0.9 | 0.22 |
| Hematocrit (%) | 43.2 ± 2.7 | 43.3 ± 2.9 | 43.1 ± 2.6 | 0.84 |
| White Blood Cell Count (×103/μL) | 6.26 ± 1.58 | 6.17 ± 1.51 | 6.36 ± 1.67 | 0.62 |
| Platelet Count (×106/μL) | 249 ± 52 | 250 ± 53 | 249 ± 51 | 0.93 |
| Mean Corpuscular Volume (fL) | 88.7 ± 3.8 | 87.6 ± 3.7 | 89.8 ± 3.7 | 0.013 |
| MCH (pg) | 30.1 ± 3.9 | 30.4 ± 5.4 | 29.8 ± 1.5 | 0.53 |
| MCHC (g/dL) | 33.5 ± 1.1 | 33.8 ± 1.1 | 33.2 ± 1.0 | 0.027 |
| RDW-CV (%) | 13.2 ± 0.8 | 12.8 ± 0.6 | 13.7 ± 0.8 | <0.001 |
| Mean Platelet Volume (fL) | 10.2 ± 0.8 | 10.0 ± 0.7 | 10.4 ± 0.8 | 0.02 |
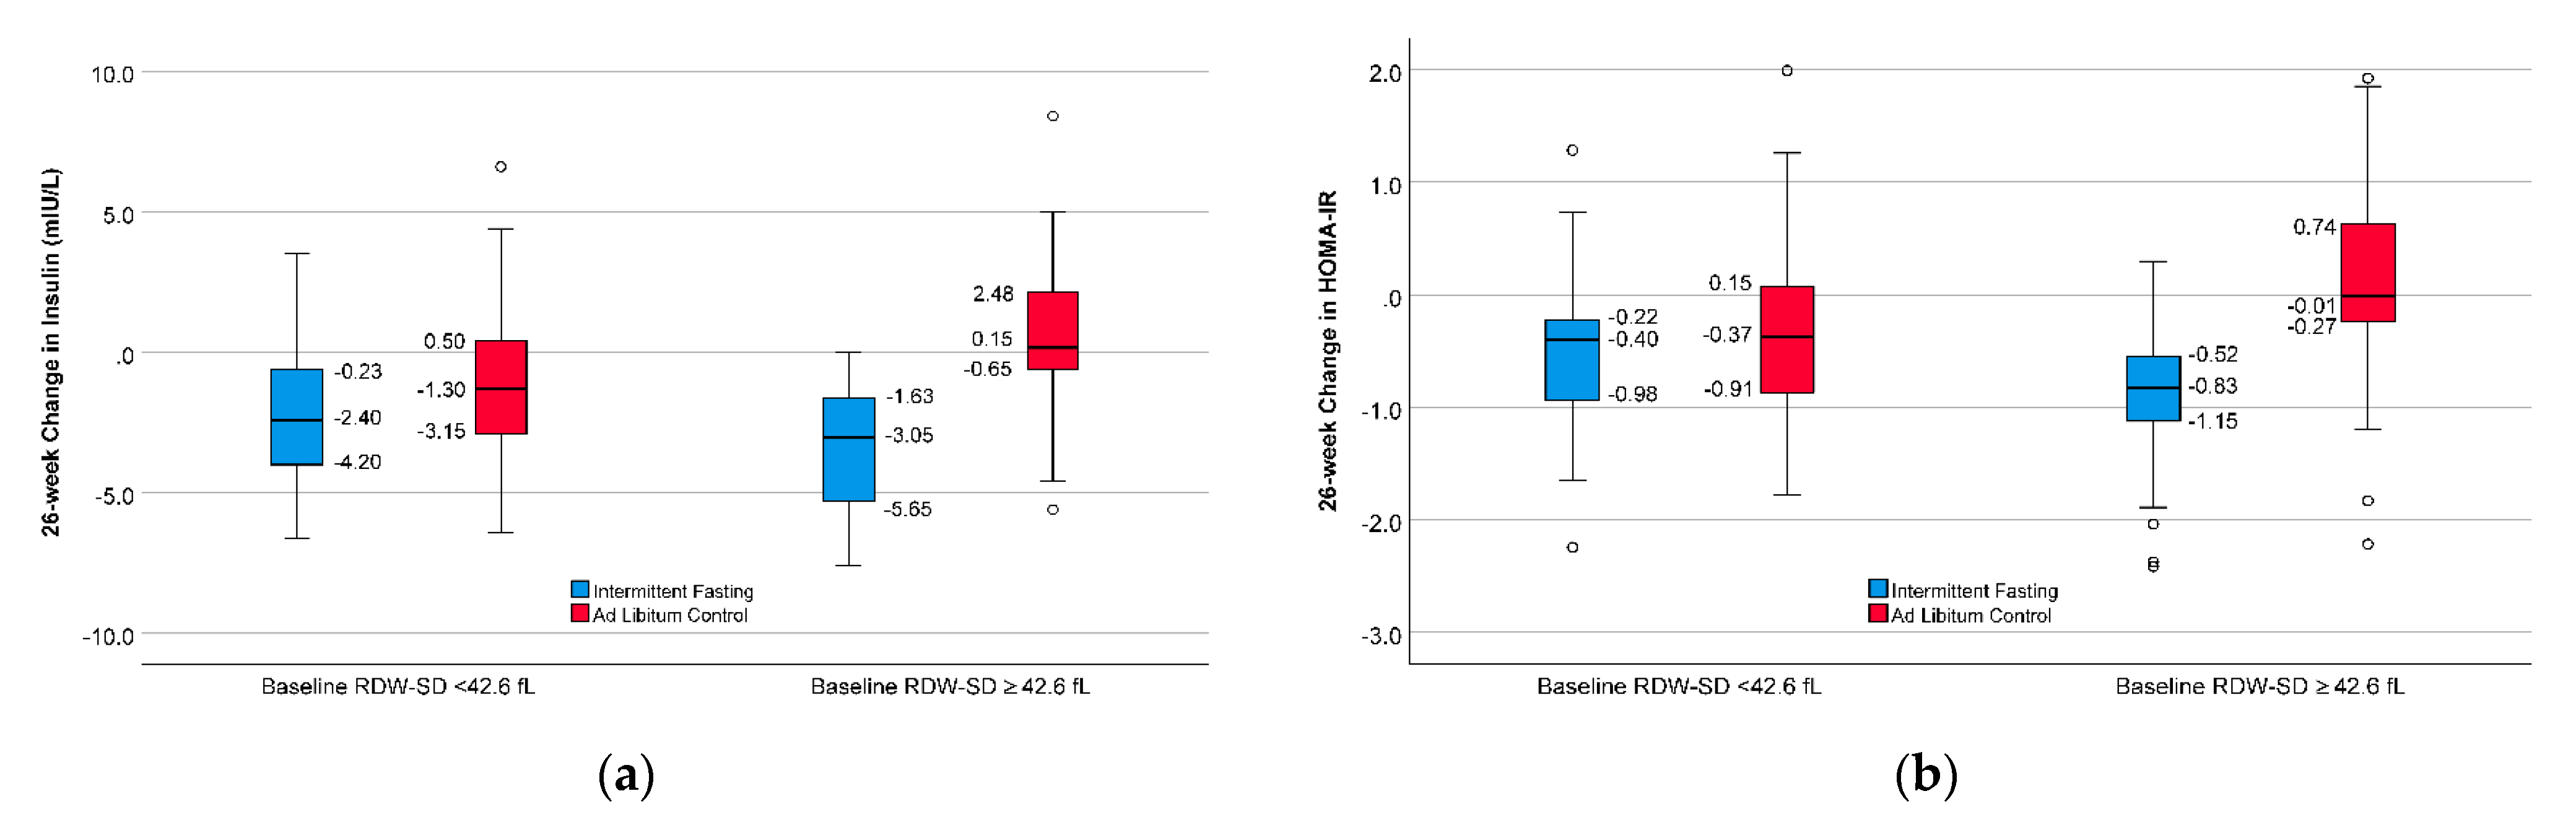
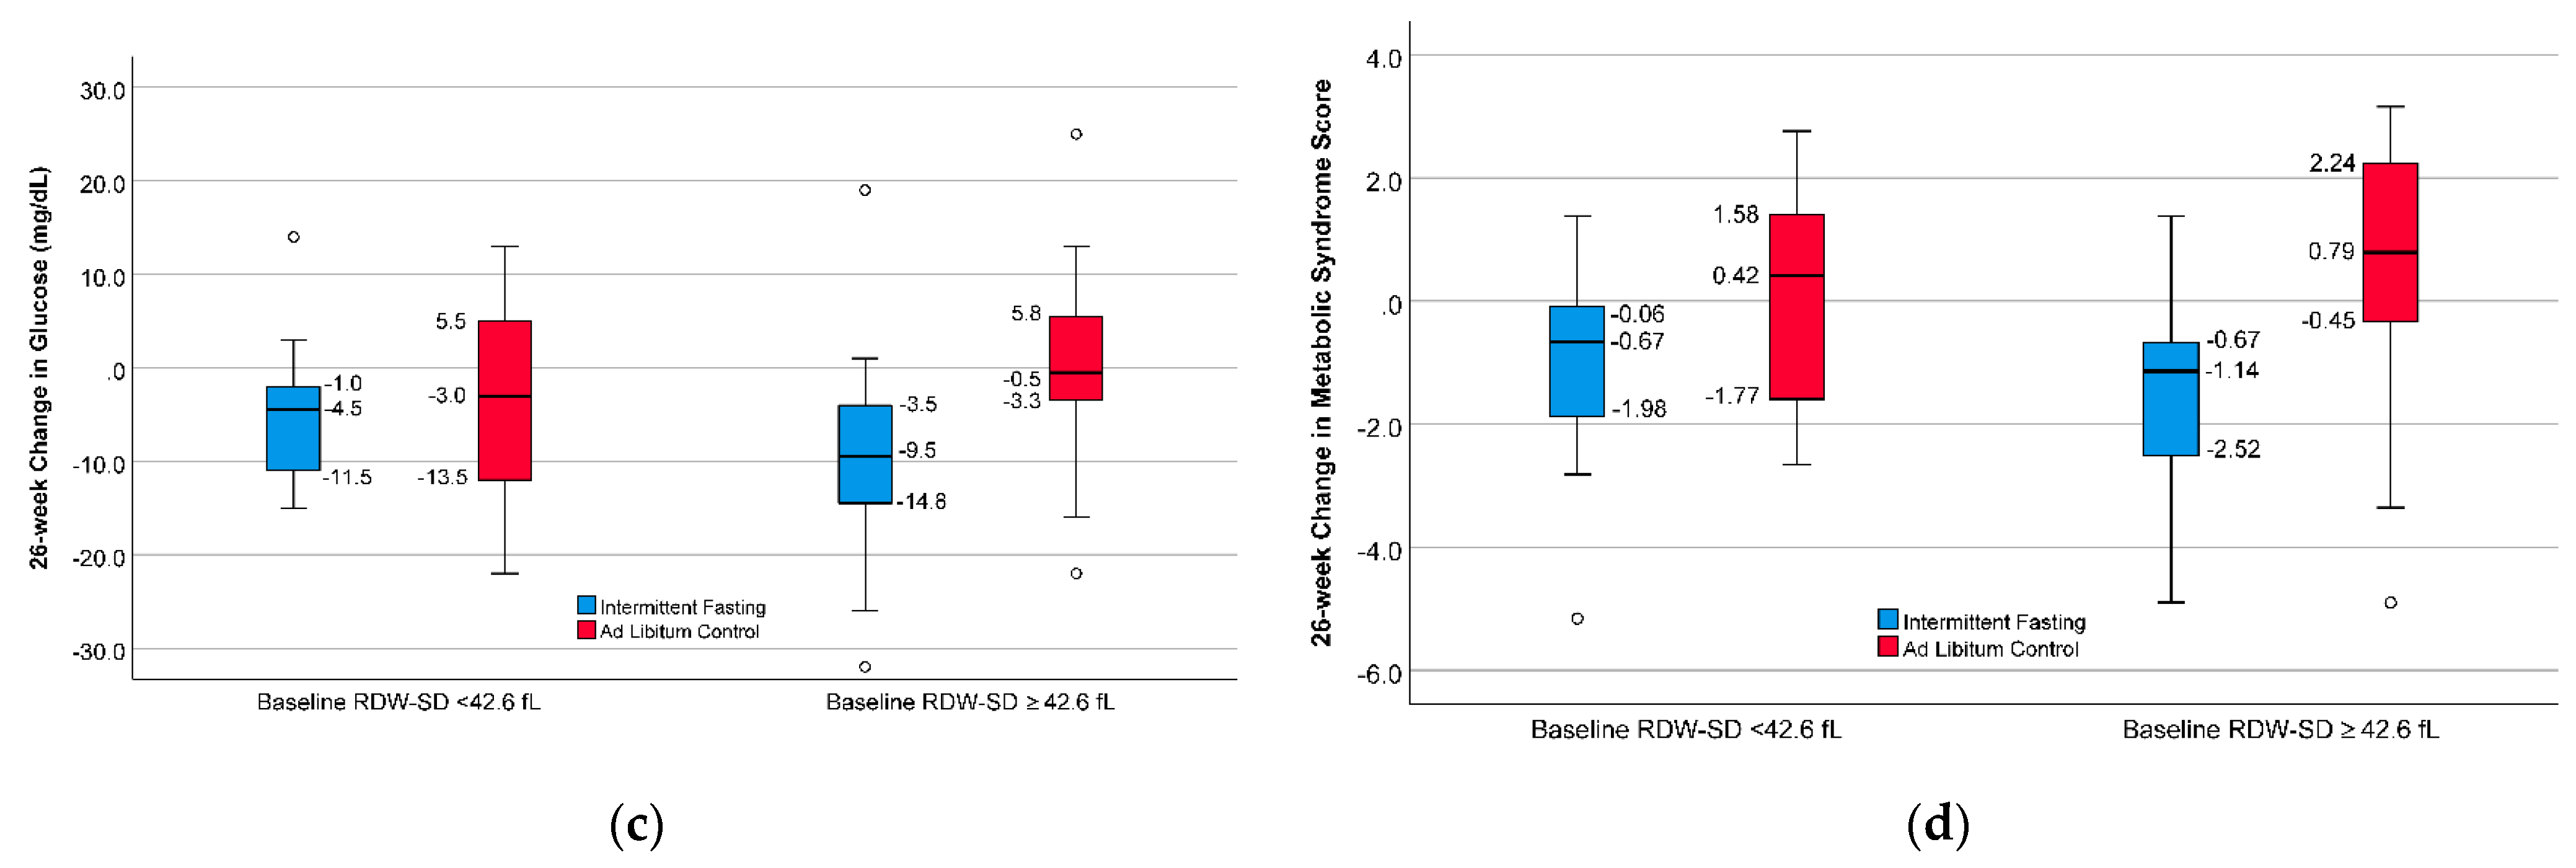
| 26-Week Change Score | RDW-SD Stratum | Intermittent Fasting | Ad Libitum Control | In-Stratum p-Value * | Across-Stratum p-Interaction † |
|---|---|---|---|---|---|
| Insulin (mIU/L) | <42.6 fL | −1.99 ± 2.80 | −1.08 ± 3.40 | 0.39 | ----- |
| ≥42.6 fL | −3.45 ± 2.27 | 0.48 ± 3.55 | <0.001 | 0.039 | |
| Glucose (mg/dL) | <42.6 fL | −5.06 ± 7.47 | −4.24 ± 11.23 | 0.80 | ----- |
| ≥42.6 fL | −9.15 ± 10.49 | 0.13 ± 10.79 | 0.014 | 0.08 | |
| HOMA-IR | <42.6 fL | −0.52 ± 0.82 | −0.28 ± 0.95 | 0.43 | ----- |
| ≥42.6 fL | −0.96 ± 0.73 | 0.09 ± 1.17 | 0.002 | 0.07 | |
| Metabolic Syndrome Score | <42.6 fL | −0.45 ± 2.94 | 0.13 ± 1.74 | 0.49 | ----- |
| ≥42.6 fL | −1.75 ± 2.01 | 0.49 ± 2.26 | 0.003 | 0.13 |
Publisher’s Note: MDPI stays neutral with regard to jurisdictional claims in published maps and institutional affiliations. |
© 2021 by the authors. Licensee MDPI, Basel, Switzerland. This article is an open access article distributed under the terms and conditions of the Creative Commons Attribution (CC BY) license (https://creativecommons.org/licenses/by/4.0/).
Share and Cite
Horne, B.D.; Muhlestein, J.B.; May, H.T.; Le, V.T.; Bair, T.L.; Bennett, S.T.; Knowlton, K.U.; Anderson, J.L. Preferential Metabolic Improvement by Intermittent Fasting in People with Elevated Baseline Red Cell Distribution Width: A Secondary Analysis of the WONDERFUL Randomized Controlled Trial. Nutrients 2021, 13, 4407. https://doi.org/10.3390/nu13124407
Horne BD, Muhlestein JB, May HT, Le VT, Bair TL, Bennett ST, Knowlton KU, Anderson JL. Preferential Metabolic Improvement by Intermittent Fasting in People with Elevated Baseline Red Cell Distribution Width: A Secondary Analysis of the WONDERFUL Randomized Controlled Trial. Nutrients. 2021; 13(12):4407. https://doi.org/10.3390/nu13124407
Chicago/Turabian StyleHorne, Benjamin D., Joseph B. Muhlestein, Heidi T. May, Viet T. Le, Tami L. Bair, Sterling T. Bennett, Kirk U. Knowlton, and Jeffrey L. Anderson. 2021. "Preferential Metabolic Improvement by Intermittent Fasting in People with Elevated Baseline Red Cell Distribution Width: A Secondary Analysis of the WONDERFUL Randomized Controlled Trial" Nutrients 13, no. 12: 4407. https://doi.org/10.3390/nu13124407
APA StyleHorne, B. D., Muhlestein, J. B., May, H. T., Le, V. T., Bair, T. L., Bennett, S. T., Knowlton, K. U., & Anderson, J. L. (2021). Preferential Metabolic Improvement by Intermittent Fasting in People with Elevated Baseline Red Cell Distribution Width: A Secondary Analysis of the WONDERFUL Randomized Controlled Trial. Nutrients, 13(12), 4407. https://doi.org/10.3390/nu13124407