
Underweight, Overweight and Obesity among Reproductive Bangladeshi Women: A Nationwide Survey

 ,
,  , ,
, ,  and
and
Abstract
:1. Introduction
2. Materials and Methods
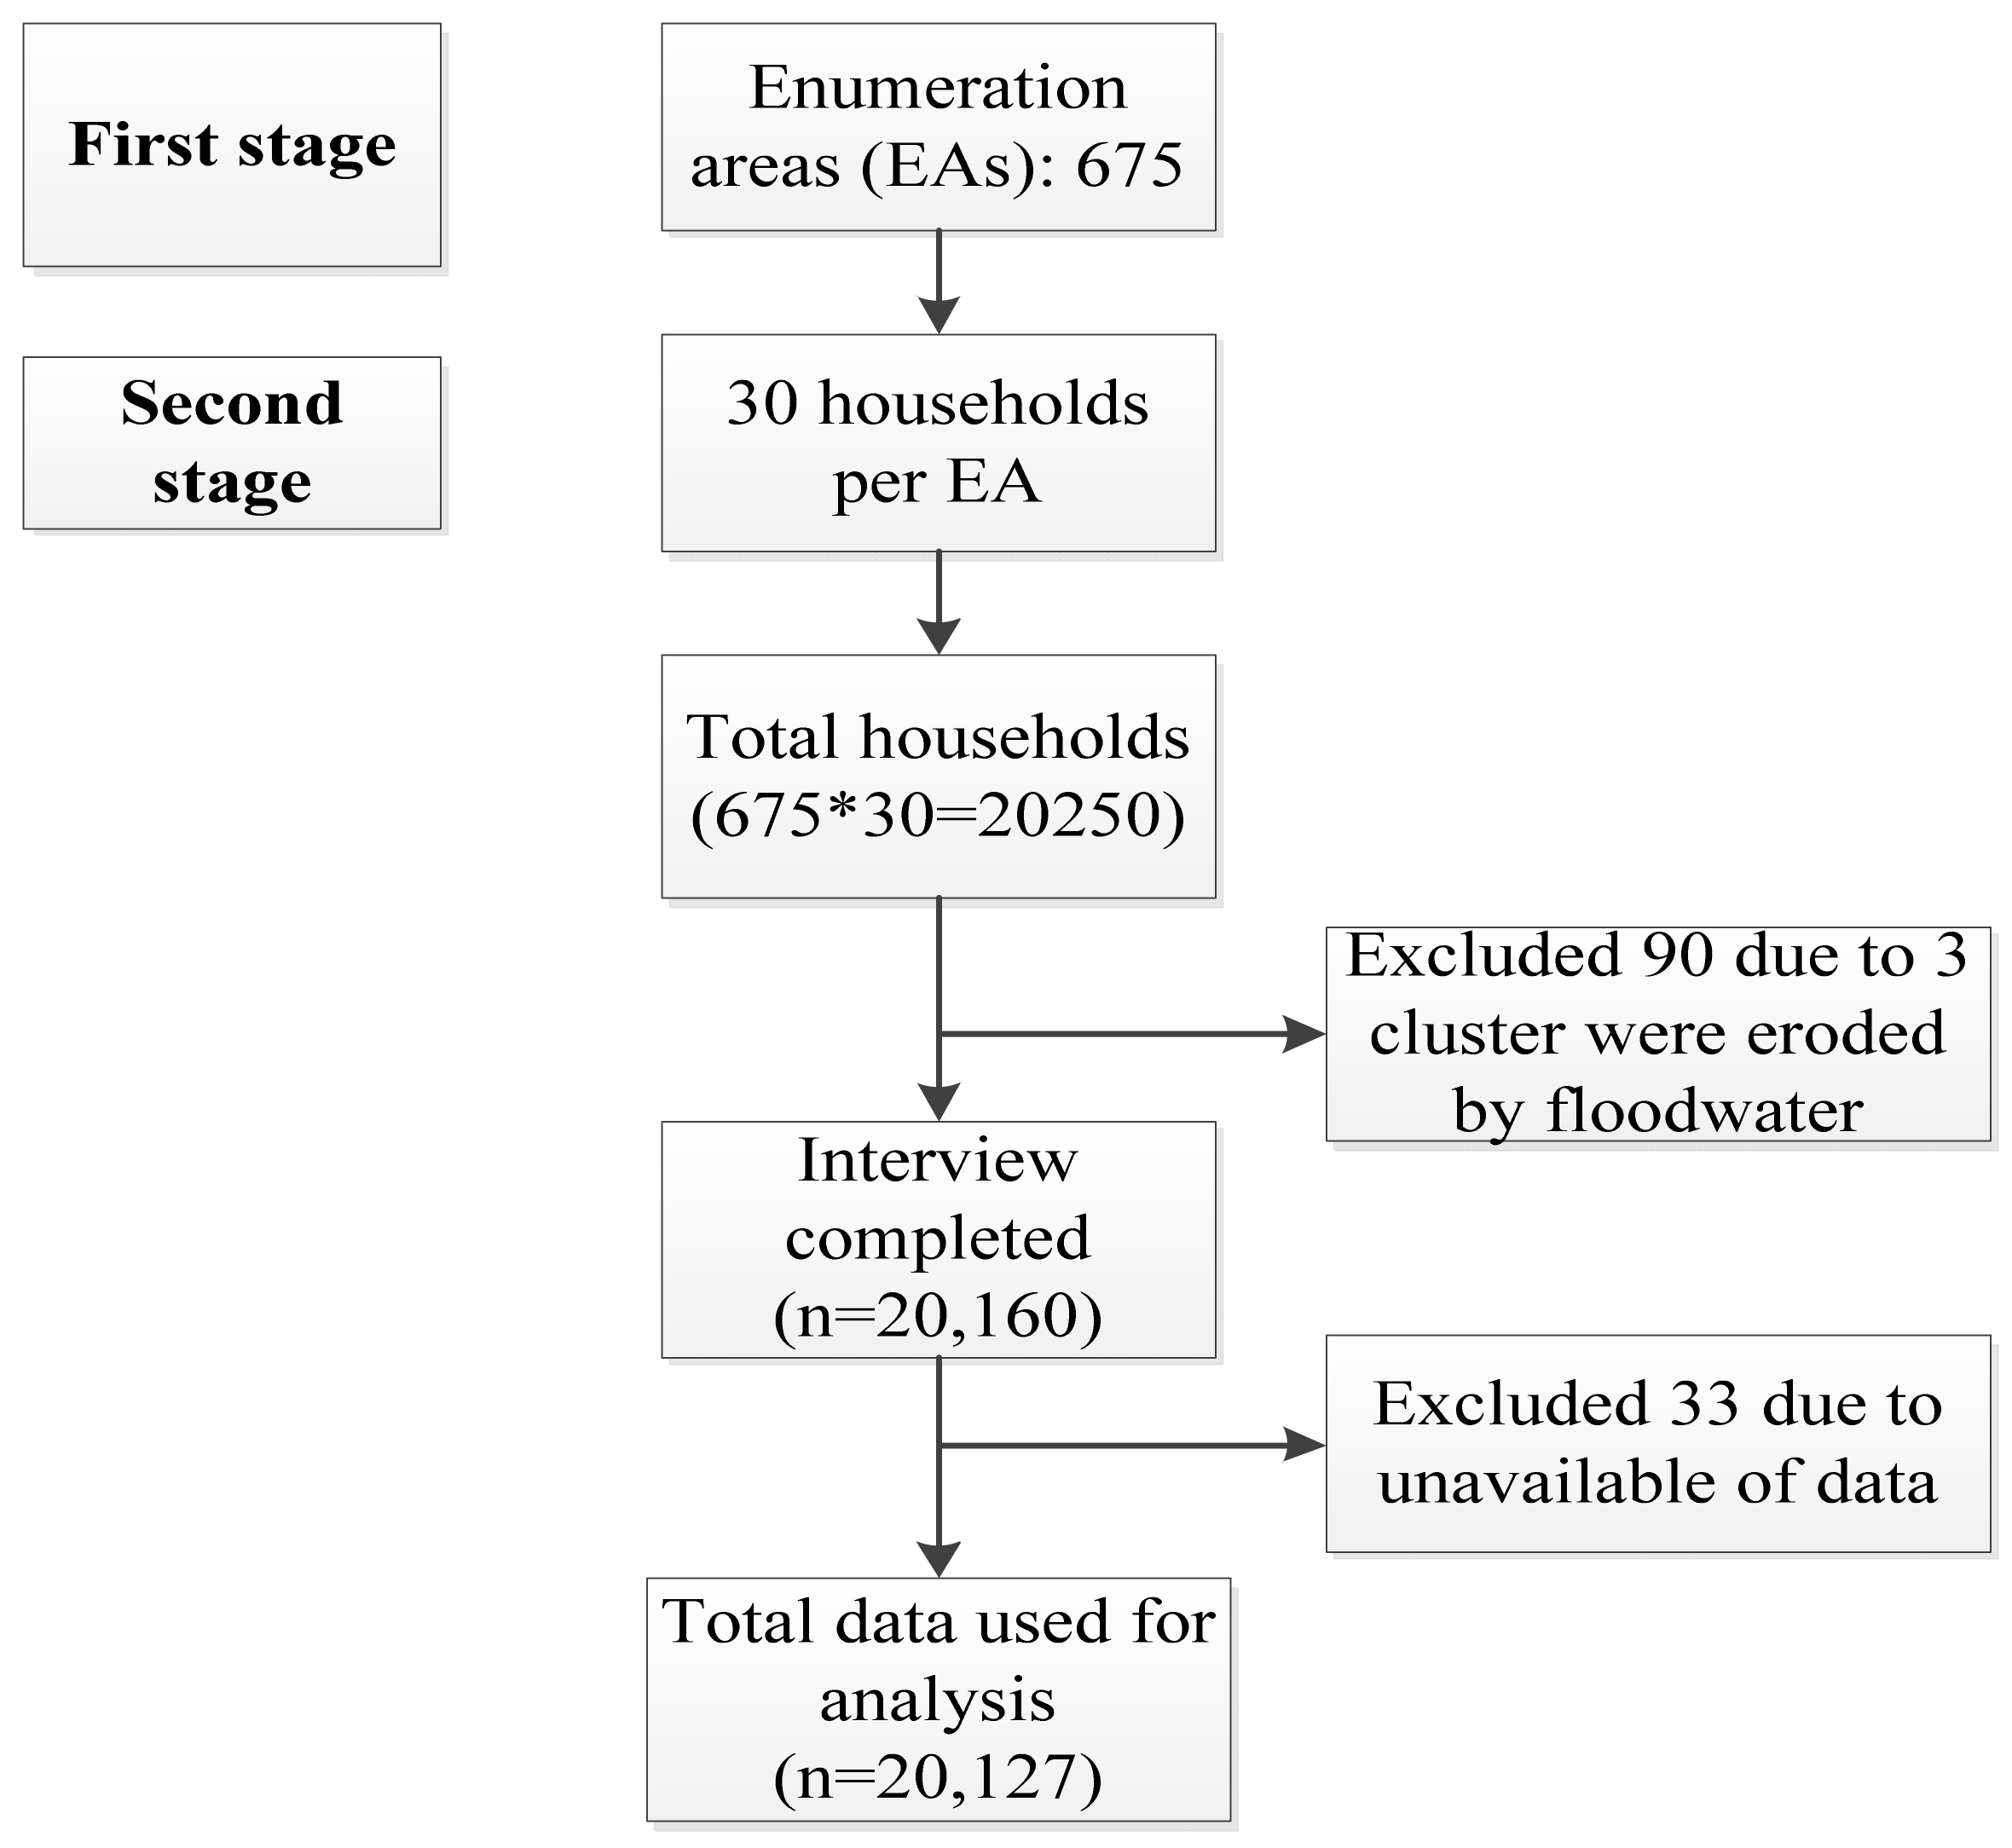
2.1. Data Sources
2.2. Exclusion Criteria
2.3. Dependent Variables
2.4. Independent Variables
2.5. Statistical Analyses
3. Results
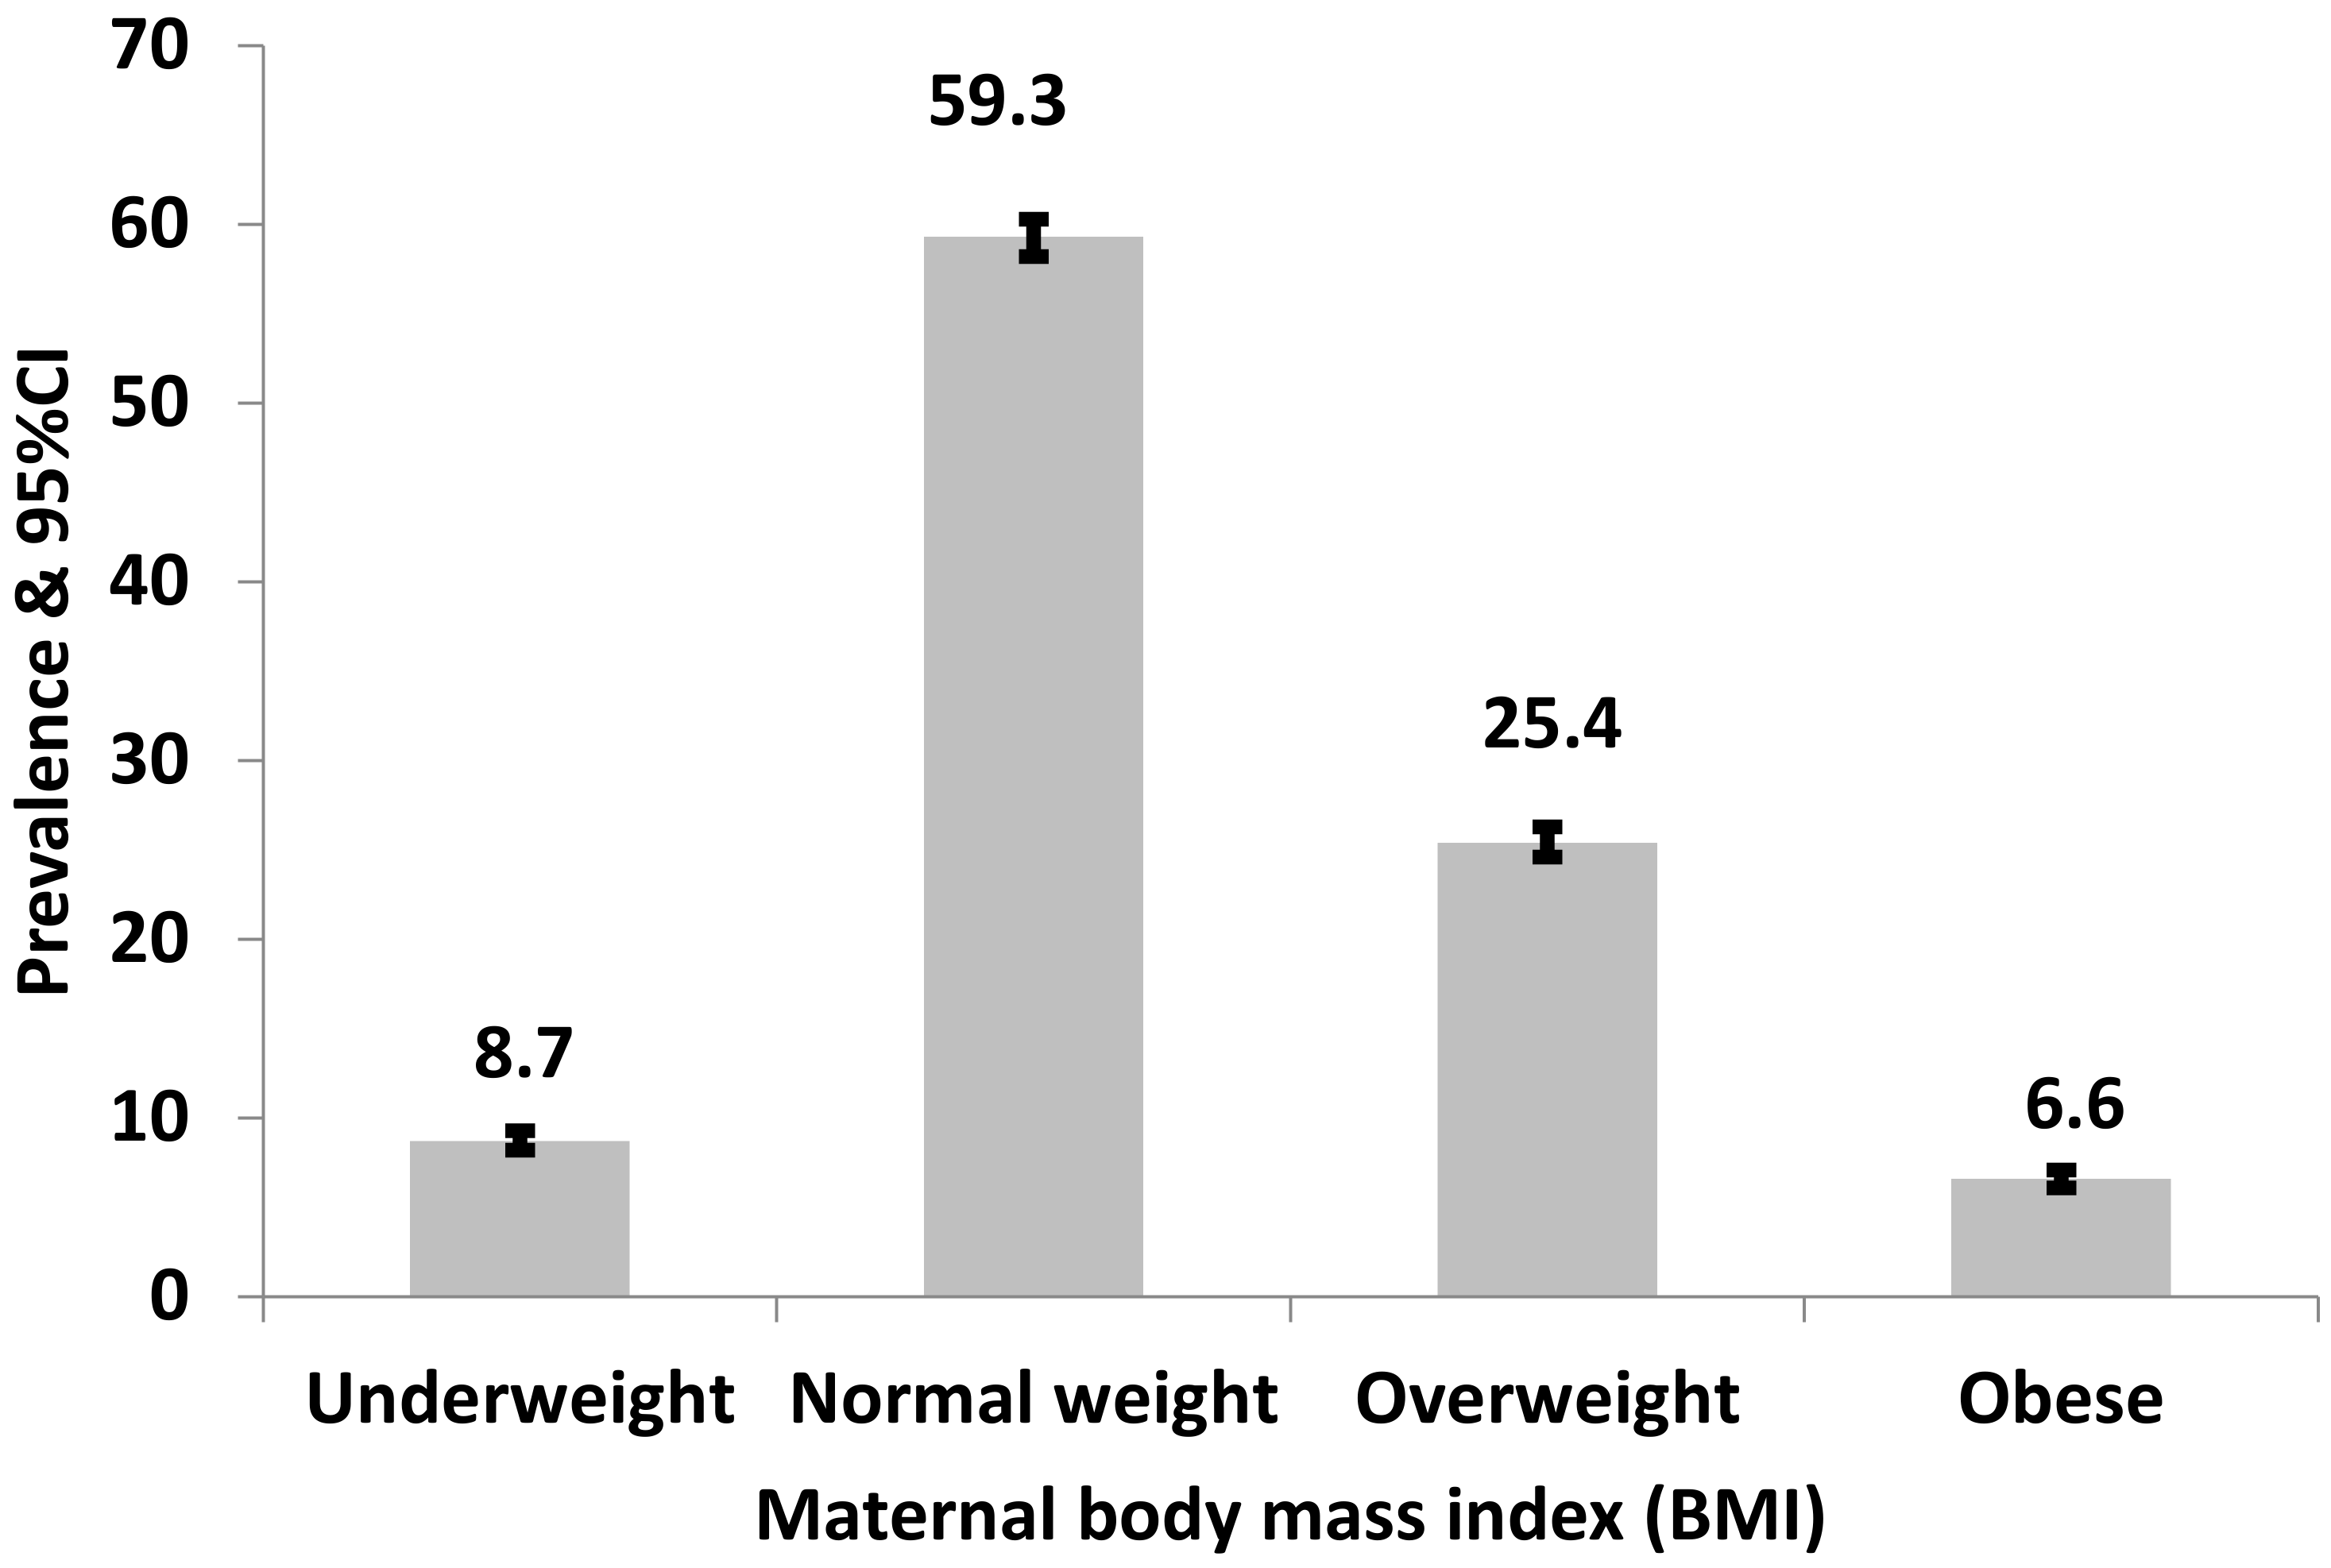
3.1. Prevalence of Underweight, Normal, Overweight and Obesity among Reproductive-Age Women in Bangladesh
3.2. Factors Associated with Underweight among Reproductive Age Women in Bangladesh
3.3. Factors Associated with Overweightamong Reproductive Age Women in Bangladesh
3.4. Factors Associated with Obesity among Reproductive Age Women in Bangladesh
4. Discussion
Strengths and Limitations
5. Conclusions
Author Contributions
Funding
Institutional Review Board Statement and Informed Consent Statement
Data Availability Statement
Acknowledgments
Conflicts of Interest
References
- Kamal, S.M.; Hassan, C.H.; Alam, G.M. Dual burden of underweight and overweight among women in Bangladesh: Patterns, prevalence, and sociodemographic correlates. J. Health Popul. Nutr. 2015, 33, 92. [Google Scholar] [PubMed]
- Kamal, S.M.M. Individual- and community-level factors associated with underweight and overweight among women of reproductive age in Bangladesh: A multilevel analysis. J. Biosoc. Sci. 2021, 1–22. [Google Scholar] [CrossRef]
- Ahmed, T.; Hossain, M.; Sanin, K.I. Global burden of maternal and child undernutrition and micronutrient deficiencies. Ann. Nutr. Metab. 2012, 61, 8–17. [Google Scholar] [CrossRef] [PubMed]
- Ahmed, T.; Mahfuz, M.; Ireen, S.; Ahmed, A.S.; Rahman, S.; Islam, M.M.; Alam, N.; Hossain, M.I.; Rahman, S.M.; Ali, M.M.; et al. Nutrition of children and women in Bangladesh: Trends and directions for the future. J. Health Popul. Nutr. 2012, 30, 1–11. [Google Scholar] [CrossRef] [PubMed] [Green Version]
- National Institute of Population Research, Training (Bangladesh); Mitra and Associates (Firm); Macro International. Bangladesh Demographic and Health Survey 2014; National Institute of Population Research and Training (NIPORT): Dhaka, Bangladesh, 2016.
- Khan, M.M.; Kraemer, A. Factors associated with being underweight, overweight and obese among ever-married non-pregnant urban women in Bangladesh. Singap. Med. J. 2009, 50, 804. [Google Scholar]
- Biswas, T.; Townsend, N.; Magalhaes, R.S.; Hasan, M.; Mamun, A. Patterns and determinants of the double burden of malnutrition at the household level in South and Southeast Asia. Eur. J. Clin. Nutr. 2021, 75, 385–391. [Google Scholar] [CrossRef]
- San-Juan-Rodriguez, A.; Bes-Rastrollo, M.; Martinez-Gonzalez, M.A.; Martín-Moreno, J.M.; Rico-Campà, A.; Gea, A. Oral contraceptives use and development of obesity in a Mediterranean cohort: The sun (Seguimiento Universidad de Navarra) project. Int. J. Obes. 2020, 44, 320–329. [Google Scholar] [CrossRef] [PubMed]
- Hashan, M.R.; Gupta, R.D.; Day, B.; Al Kibria, G.M. Differences in prevalence and associated factors of underweight and overweight/obesity according to rural-urban residence strata among women of reproductive age in Bangladesh: Evidence from a cross-sectional national survey. BMJ Open 2020, 10, e034321. [Google Scholar] [CrossRef] [PubMed]
- International Centre for Diarrheal Diseases Research, Bangladesh. Annual Reports: Solving Public Health Problems through Innovative Scientific Research; Clemens, J.D., Ed.; International Centre for Diarrheal Diseases Research, Bangladesh: Dhaka, Bangladesh, 2019; pp. 1–84. [Google Scholar]
- Tanwi, T.S.; Chakrabarty, S.; Hasanuzzaman, S. Double burden of malnutrition among ever-married women in Bangladesh: A pooled analysis. BMC Womens Health 2019, 19, 24. [Google Scholar] [CrossRef] [PubMed]
- Gouda, J.; Prusty, R.K. Overweight and obesity among women by economic stratum in urban India. J. Health Popul. Nutr. 2014, 32, 79–88. [Google Scholar] [PubMed]
- Alemu, E.; Atnafu, A.; Yitayal, M.; Yimam, K. Prevalence of overweight and/or obesity and associated factors among high school adolescents in Arada Sub-city, Addis Ababa, Ethiopia. J. Nutr. Food Sci. 2014, 4, 1. [Google Scholar] [CrossRef] [Green Version]
- Gallagher, D.; Visser, M.; De Meersman, R.E.; Sepúlveda, D.; Baumgartner, R.N.; Pierson, R.N.; Harris, T.; Heymsfield, S.B. Appendicular skeletal muscle mass: Effects of age, gender, and ethnicity. J. Appl. Physiol. 1997, 83, 229–239. [Google Scholar] [CrossRef] [PubMed]
- Martorell, R.; Martorell, R.; Khan, L.K.; Hughes, M.L.; Grummer-Strawn, L. Obesity in women from developing countries. Eur. J. Clin. Nutr. 2000, 54, 247–252. [Google Scholar] [CrossRef] [PubMed] [Green Version]
- Hu, F.B.; Leitzmann, M.F.; Stampfer, M.J.; Colditz, G.A.; Willett, W.C.; Rimm, E.B. Physical activity and television watching in relation to risk for type 2 diabetes mellitus in men. Arch. Intern. Med. 2001, 161, 1542–1548. [Google Scholar] [CrossRef]
- Hu, F.B.; Li, T.Y.; Colditz, G.A.; Willett, W.C.; Manson, J.E. Television Watching and Other Sedentary Behaviors in Relation to Risk of Obesity and Type 2 Diabetes Mellitus in Women. JAMA 2003, 289, 1785–1791. [Google Scholar] [CrossRef] [Green Version]
- Alblas, M.C.; Mollen, S.; Fransen, M.L.; van den Putte, B. Watch what you watch: The effect of exposure to food-related television content on the accessibility of a hedonic eating goal. Appetite 2019, 134, 204–211. [Google Scholar] [CrossRef]
- Tucker, L.A.; Bagwell, M. Television viewing and obesity in adult females. Am. J. Public Health 1991, 81, 908–911. [Google Scholar] [CrossRef] [Green Version]
- Van den Broek, N.R.; Jean-Baptiste, R.; Neilson, J.P. Factors associated with preterm, early preterm and late preterm birth in Malawi. PLoS ONE 2014, 9, e90128. [Google Scholar]
- Barrett, C.B. Measuring food insecurity. Science 2010, 327, 825–828. [Google Scholar] [CrossRef]
- Ha, D.T.; Feskens, E.J.; Deurenberg, P.; Mai, L.B.; Khan, N.C.; Kok, F.J. Nationwide shifts in the double burden of overweight and underweight in Vietnamese adults in 2000 and 2005: Two national nutrition surveys. BMC Public Health 2011, 11, 62. [Google Scholar] [CrossRef] [PubMed] [Green Version]
- Ruel, M.T.; Alderman, H.; Maternal and Child Nutrition Study Group. Nutrition-sensitive interventions and programmes: How can they help to accelerate progress in improving maternal and child nutrition? Lancet 2013, 382, 536–551. [Google Scholar] [CrossRef] [Green Version]
- Public Health Agency of Canada. Canadian Perinatal Health Report—2008 Edition; Public Health Agency of Canada: Regina, SK, Canada, 2008.
- Khanam, R.; Lee, A.C.; Mitra, D.K.; Ram, M.; Das Gupta, S.; Quaiyum, A.; Choudhury, A.; Christian, P.; Mullany, L.C.; Baqui, A.H. Maternal short stature and underweight status are independent risk factors for preterm birth and small for gestational age in rural Bangladesh. Eur. J. Clin. Nutr. 2019, 73, 733–742. [Google Scholar] [CrossRef] [PubMed]
- Headey, D.D. Developmental drivers of nutritional change: A cross-country analysis. World Dev. 2013, 42, 76–88. [Google Scholar] [CrossRef]
- Jaacks, L.M.; Slining, M.M.; Popkin, B.M. Recent underweight and overweight trends by rural-urban residence among women in low-and middle-income countries. J. Nutr. 2015, 145, 352–357. [Google Scholar] [CrossRef] [Green Version]
- Gregg, E.W.; Cheng, Y.J.; Narayan, K.V.; Thompson, T.J.; Williamson, D.F. The relative contributions of different levels of overweight and obesity to the increased prevalence of diabetes in the United States: 1976–2004. Prev. Med. 2007, 45, 348–352. [Google Scholar] [CrossRef]
- NIPORT. Bangladesh Demographic and Health Survey BDHS 2017–18: Key Indicators; National Institute of Population Research and Training (NIPORT): Dhaka, Bangladesh, 2019.
- Ng, M.; Fleming, T.; Robinson, M.; Thomson, B.; Graetz, N.; Margono, C. Global, regional, and national prevalence of overweight and obesity in children and adults during 1980–2013: A systematic analysis for the Global Burden of Disease Study 2013. Lancet 2014, 384, 766–781. [Google Scholar] [CrossRef] [Green Version]
- Hanandita, W.; Tampubolon, G. The double burden of malnutrition in Indonesia: Social determinants and geographical variations. SSM-Popul. Health 2015, 1, 16–25. [Google Scholar] [CrossRef]
- Filmer, D.; Pritchett, L.H. Estimating Wealth Effects Without Expenditure Data—Or Tears: An Application to Educational Enrollments in States of India*. Demography 2001, 38, 115–132. [Google Scholar]
- Molyneaux, E.; Poston, L.; Ashurst-Williams, S.; Howard, L.M. Obesity and mental disorders during pregnancy and postpartum: A systematic review and meta-analysis. Obstet. Gynecol. 2014, 123, 857. [Google Scholar] [CrossRef] [PubMed] [Green Version]
- Poston, L.; Harthoorn, L.F.; Van Der Beek, E.M. Obesity in Pregnancy: Implications for the Mother and Lifelong Health of the Child. A Consensus Statement. Pediatr. Res. 2011, 69, 175–180. [Google Scholar] [CrossRef]
- Corsi, D.J.; Kyu, H.H.; Subramanian, S. Socioeconomic and geographic patterning of under-and overnutrition among women in Bangladesh. J. Nutr. 2011, 141, 631–638. [Google Scholar] [CrossRef] [PubMed] [Green Version]
- Ackerson, L.K.; Kawachi, I.; Barbeau, E.M.; Subramanian, S.V. Geography of underweight and overweight among women in India: A multilevel analysis of 3204 neighborhoods in 26 states. Econ. Hum. Biol. 2008, 6, 264–280. [Google Scholar] [CrossRef] [PubMed] [Green Version]
- Sarma, H.; Saquib, N.; Hasan, M.M.; Saquib, J.; Rahman, A.S.; Khan, J.R.; Uddin, M.J.; Cullen, M.R.; Ahmed, T. Determinants of overweight or obesity among ever-married adult women in Bangladesh. BMC Obes. 2016, 3, 13. [Google Scholar] [CrossRef] [PubMed] [Green Version]
- Hoque, M.E.; Hasan, M.T.; Rahman, M.; Long, K.Z.; Al Mamun, A. Double burden of underweight and overweight among Bangladeshi adults differs between men and women: Evidence from a nationally representative survey. Public Health Nutr. 2017, 20, 2183–2191. [Google Scholar] [CrossRef] [PubMed] [Green Version]
- Neupane, S.; Prakash, K.; Doku, D.T. Overweight and obesity among women: Analysis of demographic and health survey data from 32 Sub-Saharan African Countries. BMC Public Health 2015, 16, 30. [Google Scholar] [CrossRef] [PubMed] [Green Version]
- Abrha, S.; Shiferaw, S.; Ahmed, K.Y. Overweight and obesity and its socio-demographic correlates among urban Ethiopian women: Evidence from the 2011 EDHS. BMC Public Health 2016, 16, 636. [Google Scholar] [CrossRef] [PubMed] [Green Version]
- Subramanian, S.V.; Perkins, J.M.; Khan, K.T. Do burdens of underweight and overweight coexist among lower socioeconomic groups in India? Am. J. Clin. Nutr. 2009, 90, 369–376. [Google Scholar] [CrossRef] [Green Version]
- Du, S.; Mroz, T.A.; Zhai, F.; Popkin, B.M. Rapid income growth adversely affects diet quality in China—Particularly for the poor! Soc. Sci. Med. 2004, 59, 1505–1515. [Google Scholar] [CrossRef]
- Kandala, N.-B.; Stranges, S. Geographic variation of overweight and obesity among women in Nigeria: A case for nutritional transition in sub-Saharan Africa. PLoS ONE 2014, 9, e101103. [Google Scholar]
- Ogden, C.L.; Carroll, M.D.; Kit, B.K.; Flegal, K.M. Prevalence of childhood and adult obesity in the United States, 2011–2012. JAMA 2014, 311, 806–814. [Google Scholar] [CrossRef] [Green Version]
- Dastgiri, S.; Mahdavi, R.; TuTunchi, H.; Faramarzi, E. Prevalence of obesity, food choices and socio-economic status: A cross-sectional study in the north-west of Iran. Public Health Nutr. 2006, 9, 996–1000. [Google Scholar] [CrossRef] [PubMed] [Green Version]
- Shabuz, J.I.; Bexci, M.S. Dwindling influences of television advertisements on the consumption of branded snacks and beverages. Int. J. Innov. Technol. Explor. Eng. 2019, 8, 686–690. [Google Scholar]
- Van Dam, R.M.; Rimm, E.B.; Willett, W.C.; Stampfer, M.J.; Hu, F.B. Dietary patterns and risk for type 2 diabetes mellitus in US men. Ann. Intern. Med. 2002, 136, 201–209. [Google Scholar] [CrossRef] [PubMed] [Green Version]
- Hong, S.A.; Peltzer, K.; Lwin, K.T.; Aung, L.S. The prevalence of underweight, overweight and obesity and their related socio-demographic and lifestyle factors among adult women in Myanmar, 2015–2016. PLoS ONE 2018, 13, e0194454. [Google Scholar] [CrossRef] [Green Version]

| Characteristics | n (%) | Underweight | Normal | Overweight | Obesity | |
|---|---|---|---|---|---|---|
| % (95% CI) | % (95% CI) | % (95% CI) | % (95% CI) | p* | ||
| Parental level factors | ||||||
| Working status | ||||||
| Non-working | 10,554 (52.4) | 8.1 (4.5–8.7) | 56.3 (54.9–57.7) | 27.7 (26.5–29.0) | 7.9 (7.1–8.6) | <0.001 |
| Working (past 12 months) | 9573 (47.6) | 9.4 (8.7–10.2) | 62.5 (61.3–63.6) | 22.9 (21.9–24.0) | 5.2 (4.7–5.7) | |
| Education | ||||||
| No education | 3333 (16.6) | 11.4 (10.3–12.7) | 63.6 (61.7–65.4) | 21.0 (19.3–22.8) | 4.0 (3.4–4.9) | |
| Primary | 6290 (31.2) | 9.4 (8.6–10.2) | 60.1 (58.6–61.6) | 24.5 (23.2–25.8) | 6.0 (5.3–6.8) | <0.001 |
| Secondary and above | 10,504 (52.2) | 7.5 (6.8–8.2) | 57.4 (56.0–58.7) | 27.4 (26.3–28.6) | 7.7 (7.0–8.5) | |
| Father’s education (n = 18,983) | ||||||
| No education | 4130 (21.8) | 10.7 (9.6–11.8) | 63.7 (62.0–65.4) | 21.2 (19.8–22.7) | 4.3 (3.7–5.1) | |
| Primary | 6080 (32.0) | 9.8 (8.9–10.7) | 61.7 (60.1–63.3) | 22.9 (21.5–24.3) | 5.6 (4.9–6.3) | <0.001 |
| Secondary and above | 8773 (46.2) | 6.7 (6.1–7.3) | 54.9 (53.5–56.3) | 29.9 (28.8–31.1) | 8.5 (7.7–9.3) | |
| Literacy (n = 20,117) | ||||||
| Cannot read at all | 5364 (26.7) | 11.0 (10.1–12.0) | 62.4 (60.9–63.9) | 21.8 (20.5–23.2) | 4.8 (4.1–5.5) | <0.001 |
| Able to read only part of sentence | 14,753 (73.3) | 7.9 (7.3–8.4) | 58.1 (56.9–59.3) | 26.8 (25.8–27.8) | 7.2 (6.7–7.9) | |
| Age | ||||||
| 15–24 years | 4882 (24.2) | 13.3 (12.3–14.5) | 69.3 (67.8–70.8) | 14.7 (13.6–16.0) | 2.6 (2.1–3.2) | |
| 25–34 years | 7785 (38.7) | 6.9 (6.2–7.6) | 58.2 (56.7–59.7) | 27.9 (26.7–29.3) | 6.9 (6.2–7.7) | <0.001 |
| 35–49 years | 7460 (37.0) | 7.6 (6.9–8.4) | 53.7 (52.2–55.2) | 29.8 (28.5–31.2) | 8.8 (8.0–9.7) | |
| Women status | ||||||
| Adolescence (15–19 years) | 2063 (10.3) | 16.7 (14.9–18.6) | 7.8 (7.3–8.3) | 10.2 (8.8–11.8) | 1.0 (0.7–1.7) | <0.001 |
| Non adolescence (20–49 years) | 18,064 (89.7) | 72.0 (69.8–74.2) | 57.8 (56.7–58.9) | 27.2 (26.3–28.1) | 7.2 (6.7–7.8) | |
| Marital status | ||||||
| Currently married | 18,984 (93.3) | 8.5 (8.0–9.1) | 59.1 (58.0–60.1) | 25.8 (24.9–26.7) | 6. 6 (6.1–7.2) | <0.001 |
| Formerly married † | 1143 (5.7) | 11.7 (9.9–13.8) | 62.5 (59.3–65.6) | 20.1 (17.6–22.9) | 5.6 (4.3–7.3) | |
| Births in last 5 years | ||||||
| No birth | 12,517 (62.2) | 7. 9 (7.3–8.5) | 56.9 (55.8–58.1) | 27.9 (26.8–28.9) | 7.3 (6.7–7.9) | <0.001 |
| Yes | 7610 (37.8) | 10.1 (9.3–10.9) | 63.1 (61.6–64.5) | 21.4 (20.2–22.6) | 5.5 (4.8–6.1) | |
| Currently breastfeeding | ||||||
| Yes | 4138 (20.6) | 12.2 (11.2–13.3) | 7.8 (7.3–8.4) | 15.9(14.6–17.3) | 3.9 (3.2–4.7) | <0.001 |
| No | 15,989 (79.4) | 67.9 (66.3–69.7) | 67.9 (66.3–69.7) | 27.9 (27.0–28.9) | 7.28 (6.7–7.9) | |
| Contraceptive use | ||||||
| Use | 11,742 (58.3) | 8.1 (7.5–8.8) | 59.7 (58.6–60.9) | 25.6 (24.7–26.6) | 6.5 (5.9–7.1) | 0.6129 |
| Not using | 8385 (41.7) | 9.6 (8.8–10.3) | 58.6 (57.2–60.0) | 25.1 (23.8–26.4) | 6.7 (6.0–7.4) | |
| Reads newspaper or magazine | ||||||
| At least once a week | 648 (3.2) | 2.8 (1.8–4.4) | 42.0 (37.3–46.9) | 38.5 (34.2–43.0) | 16.7 (13.7–20.1) | |
| Less than once a week | 1218 (6.1) | 4.6 (3.4–6.1) | 54.2 (51.0–57.3) | 30.3 (27.6–33.2) | 10.9 (9.1–13.0) | <0.001 |
| Never | 18,261 (90.7) | 9.2 (8.7–9.7) | 60.2 (59.2–61.2) | 24.7 (23.8–25.6) | 6.0 (5.5–6.4) | |
| Listens to radio (n = 20,125) | ||||||
| At least once a week | 414 (2.0) | 8.3 (5.7–11.9) | 61.7 (56.2–66.8) | 24.9 (20.5–29.9) | 5.1 (3.2–8.0) | |
| Less than once a week | 561 (2.6) | 8.6 (5.8–11.1) | 57.4 (52.0-61.8) | 26.9 (22.9–31.3) | 7.7 (5.7–10.3) | <0.001 |
| Never | 19,150 (95.2) | 8.7 (8.2–9.3) | 59.3 (58.2–60.3) | 25.4 (24.5–26.3) | 6.6 (6.1–7.1) | |
| Watches television | ||||||
| At least once a week | 11,061 (54.9) | 6.3(5.7–6.9) | 54.7 (53.3–56.0) | 29.8 (28.7–30.9) | 9.3 (8.5–10.1) | |
| Less than once a week | 1842 (9.2) | 10.6(9.1–12.3) | 62.7 (60.3–65.1) | 22.2 (20.1–24.5) | 4.4 (3.4–5.8) | <0.001 |
| Never | 7224 (35.9) | 11.9 (11.0–12.9) | 65.3 (64.0–66.6) | 19.7 (18.6–20.8) | 3.1 (2.6–3.5) | |
| Power over earnings | ||||||
| Husband alone | 7119 (35.4) | 9.9 (9.1–10.8) | 61.5 (60.1–62.39) | 22.7 (21.5–23.9) | 5.8 (5.2–6.5) | <0.001 |
| Woman alone or joint decision | 13,008 (64.6) | 8.1 (7.5–8.7) | 58.0 (56.8–59.2) | 26.9 (25.9–28.0) | 7.0 (6.4–7.6) | |
| Autonomy Health Care | ||||||
| Husband alone | 5617 (27.9) | 10.8 (9.8–11.8) | 62.5 (61.0–64.0) | 21.7 (20.5–23.7) | 4.9 (4.3–5.6) | <0.001 |
| Woman alone or joint decision | 14,510 (72.1) | 7.9 (7.4–8.5) | 58.0 (56.8–59.2) | 26.9 (25.9–27.9) | 7.2 (6.6–7.8) | |
| Power over Household Decision making | ||||||
| Husband alone | 3405 (16.9) | 11.6 (10.4–12.9) | 63.5 (61.7–65.3) | 20.1 (18.6–21.7) | 4.8 (4.0–5.6) | <0.001 |
| Woman alone or joint decision | 16,722 (83.1) | 8.1 (7.6–8.7) | 58.4 (57.3–59.5) | 26.5 (25.6–27.5) | 6.9 (6.4–7.5) | |
| Wife beaten for refusing sex | ||||||
| Yes | 634 (3.2) | 10.6 (8.3–13.6) | 60.7 (55.9–65.2) | 22.84 (19.4-26.7) | 5.7 (4.1–8.3) | 0.252 |
| No | 19,493 (96.8) | 8.7 (8.2–9.2) | 59.2 58.2–60.2) | 25.5 (24.6-26.4) | 6.6 (6.1–7.1) | |
| Attitudes to domestic Violence | ||||||
| Yes | 4048 (20.1) | 10.1 (9.0–11.3) | 60.1 (58.1–62.2) | 23.9 (22.2–25.6) | 5.9 (5.0–7.0) | 0.0043 |
| No | 16,079 (79.9) | 8.4 (7.8–8.9) | 59.1 (57.9–60.2) | 25.8 (24.9–26.8) | 6.7 (6.2–7.3) | |
| Household level factors | ||||||
| Household Wealth Index | ||||||
| Poorest | 3743 (18.6) | 14.9 (13.5–16.3) | 68.9 (67.1–70.6) | 14.5 (13.3–15.7) | 1.8 (1.4–2.3) | |
| Poorer | 3957 (19.7) | 11.6 (10.5–12.9) | 66.4 (64.6–68.1) | 19.0 (17.5–20.6) | 3.0 (2.4–3.7) | <0.001 |
| Middle | 4059 (20.2) | 7.9 (7.0–8.9) | 61.9 (60.2–63.7) | 25.1 (23.5–26.8) | 5.0 (4.3–5.7) | |
| Richer | 4184 (20.7) | 6.6 (5.7–7.5) | 56.9 (55.1–58.7) | 29.3 (27.7–31.0) | 7.2 (6.4–8.3 | |
| Richest | 4184 (20.8) | 3.2 (2.6–3.9) | 43.2 (41.2–45.2) | 38.2 (36.4–40.0) | 15.4 (14.1–16.9) | |
| Source of drinking water | ||||||
| Unimproved | 2197 (10.9) | 9.1 (7.7–10.6) | 61.2 (58.5–63.9) | 23.6 (21.3–26.0) | 6.1 (5.0–7.5) | <0.001 |
| Improved | 17,930 (89.1) | 8.7 (8.2–9.2) | 59.0 (57.9–60.1) | 25.7 (24.7–26.6) | 6.6 (6.1–7.2) | |
| Community level factors | ||||||
| Residence | ||||||
| Urban | 5729 (28.5) | 6.2 (5.5–7.0) | 50.8 (49.0–50.6) | 32.2 (30.7–33.8) | 10.8 (9.7–11.9) | <0.001 |
| Rural | 14,398 (71.5) | 9.7 (9.1–10.4) | 62.6 (61.4–63.7) | 22.8 (21.8–23.8) | 4.9 (4.5–5.5) | |
| Geographical region (n = 20,126) | ||||||
| Barishal | 1125 (5.6) | 7.6 (6.2–9.2) | 61.1 (58.6–63.5) | 26.6 (24.4–28.8) | 4.7 (3.7–6.0) | |
| Chattogram | 3622 (18.0) | 5.9 (4.9–7.1) | 56.3 (53.8–58.8) | 29.7 (27.6–31.9) | 8.1 (6.9–9.5) | |
| Dhaka | 5123 (25.5) | 7.0 (6.0–8.2) | 55.9 (53.2–58.6) | 28.3(26.1–30.7) | 8.7 (7.4–10.2) | <0.001 |
| Khulna | 2336 (11.6) | 8.2 (6.9–9.5) | 57.2 (54.5–59.9) | 27.3 (25.1–29.6) | 7.3 (6.2–8.7) | |
| Mymensingh | 1546 (7.7) | 13.1 (11.3–15.1) | 63.9 (61.3–66.4) | 19.4 (15.2–21.7) | 3.7 (2.6–5.3) | |
| Rajshahi | 2802 (13.9) | 9.43 (8.2–10.8) | 61.1 (58.6–63.4) | 23.8 (21.7–26.1) | 5.7 (4.6–6.9) | |
| Rangpur | 2380 (11.8) | 10.1 (8.5–11.9) | 65.5 (62.9–67.9) | 19.9 (17.9–22.2) | 4.5 (3.5–5.8) | |
| Sylhet | 1192 (5.9) | 16.3 (14.4–18.6) | 62.0 (58.8–65.2) | 18.3 (15.8–21.1) | 3.3 (2.4–4.6) |
| Characteristic | Underweight (n = 2367) | |||||
|---|---|---|---|---|---|---|
| Unadjusted | Adjusted | |||||
| OR | 95% CI | p-Value | AOR | 95% CI | p-Value | |
| Maternal education | ||||||
| No education | 1.00 | 1.00 | ||||
| Primary | 0.80 | 0.69, 0.93 | 0.004 | 0.80 | 0.68, 0.94 | 0.007 |
| Secondary and above | 0.63 | 0.54, 0.72 | <0.001 | 0.76 | 0.65, 0.90 | 0.001 |
| Watches television | ||||||
| At least once a week | 1.00 | 1.00 | ||||
| Less than once a week | 1.77 | 1.45, 2.16 | <0.001 | 1.29 | 1.05, 1.59 | 0.015 |
| Never | 2.02 | 1.79, 2.30 | <0.001 | 1.23 | 1.06, 1.43 | 0.006 |
| Currently breastfeeding | ||||||
| No | 1.00 | 1.00 | ||||
| Yes | 0.61 | 0.54, 0.68 | <0.001 | 0.68 | 0.60, 0.76 | <0.001 |
| Women status | ||||||
| Adolescence (15–19 years) | 1.00 | 1.00 | ||||
| Non adolescence (20–49 years) | 0.42 | 0.37, 0.49 | <0.001 | 0.44 | 0.37, 0.51 | <0.001 |
| Marital status | ||||||
| Currently married | 1.00 | 1.00 | ||||
| Formerly married † | 1.42 | 1.16, 1.73 | 0.001 | 1.31 | 1.05, 1.64 | 0.017 |
| Contraceptive use | ||||||
| Using | 1.00 | 1.00 | ||||
| Not using | 1.19 | 1.07, 1.33 | 0.001 | 1.17 | 1.04, 1.32 | 0.008 |
| Division | ||||||
| Barishal | 1.00 | 1.00 | ||||
| Chattogram | 0.77 | 0.58, 1.02 | 0.068 | 1.00 | 0.76, 1.31 | 0.973 |
| Dhaka | 0.92 | 0.70, 1.22 | 0.575 | 1.42 | 1.08, 1.88 | 0.013 |
| Khulna | 1.08 | 0.83, 1.42 | 0.558 | 1.41 | 1.08, 1.84 | 0.013 |
| Mymensingh | 1.83 | 1.40, 2.41 | <0.001 | 1.86 | 1.44, 2.41 | <0.001 |
| Rajshahi | 1.27 | 0.98, 1.65 | 0.074 | 1.50 | 1.17, 1.93 | 0.002 |
| Rangpur | 1.37 | 1.03, 1.81 | 0.032 | 1.33 | 1.01, 1.75 | 0.045 |
| Sylhet | 2.38 | 1.83, 3.09 | <0.001 | 2.67 | 2.07, 3.45 | <0.001 |
| Wealth Index | ||||||
| Richest | 1.00 | 1.00 | ||||
| Richer | 2.11 | 1.63, 2.73 | <0.001 | 1.89 | 1.46, 2.46 | <0.001 |
| Middle | 2.60 | 2.00, 3.37 | <0.001 | 2.28 | 1.74, 2.97 | <0.001 |
| Poorer | 3.94 | 3.11, 4.99 | <0.001 | 3.11 | 2.40, 4.04 | <0.001 |
| Poorest | 5.25 | 4.12, 6.69 | <0.001 | 3.86 | 2.94, 5.07 | <0.001 |
| Characteristic | Overweight (n = 5164) | |||||
|---|---|---|---|---|---|---|
| Unadjusted | Adjusted | |||||
| OR | 95% CI | p-Value | AOR | 95% CI | p-Value | |
| Maternal education | ||||||
| No education | 1.00 | 1.00 | ||||
| Primary | 1.22 | 1.09, 1.38 | 0.001 | 1.19 | 1.06, 1.34 | 0.004 |
| Secondary and above | 1.43 | 1.27, 1.60 | <0.001 | 1.18 | 1.05, 1.33 | 0.006 |
| Watches television | ||||||
| At least once a week | 1.00 | 1.00 | ||||
| Less than once a week | 0.67 | 0.59, 0.77 | <0.001 | 0.89 | 0.77, 1.02 | 0.106 |
| Never | 0.58 | 0.53, 0.63 | <0.001 | 0.90 | 0.81, 0.99 | 0.031 |
| Currently breastfeeding | ||||||
| No | 1.00 | 1.00 | ||||
| Yes | 2.05 | 1.85, 2.26 | <0.001 | 1.91 | 1.72, 2.12 | <0.001 |
| Women status | ||||||
| Adolescence (15–19 years) | 1.00 | 1.00 | ||||
| Non adolescence (20–49 years) | 3.29 | 2.79, 3.87 | <0.001 | 3.14 | 2.64, 3.72 | <0.001 |
| Marital status | ||||||
| Currently married | 1.00 | 1.00 | ||||
| Formerly married † | 0.73 | 0.62, 0.86 | <0.001 | 0.76 | 0.63, 0.92 | <0.001 |
| Power over earnings | ||||||
| Husband alone | 1.00 | 1.00 | ||||
| Woman alone or joint decision | 1.25 | 1.16, 1.35 | <0.001 | 1.16 | 1.06, 1.26 | 0.001 |
| Division | ||||||
| Barishal | 1.00 | 1.00 | ||||
| Chattogram | 1.17 | 1.00, 1.36 | 0.048 | 0.89 | 0.78, 1.03 | 0.111 |
| Dhaka | 1.09 | 0.93, 1.28 | 0.274 | 0.74 | 0.64, 0.86 | <0.001 |
| Khulna | 1.04 | 0.88, 1.22 | 0.658 | 0.85 | 0.74, 0.99 | 0.033 |
| Mymensingh | 0.66 | 0.55, 0.80 | 0.000 | 0.65 | 0.55, 0.76 | <0.001 |
| Rajshahi | 0.87 | 0.73, 1.02 | 0.091 | 0.77 | 0.66, 0.89 | <0.001 |
| Rangpur | 0.69 | 0.58, 0.82 | <0.001 | 0.73 | 0.62, 0.86 | <0.001 |
| Sylhet | 0.62 | 0.50, 0.76 | <0.001 | 0.53 | 0.44, 0.63 | <0.001 |
| Wealth Index | ||||||
| Richest | 1.00 | 1.00 | ||||
| Richer | 0.67 | 0.60, 075 | <0.001 | 0.73 | 0.65, 0.81 | <0.001 |
| Middle | 0.54 | 0.49, 0.61 | <0.001 | 0.59 | 0.52, 0.67 | <0.001 |
| Poorer | 0.38 | 0.33, 0.43 | <0.001 | 0.45 | 0.39, 0.52 | <0.001 |
| Poorest | 0.27 | 0.24, 0.31 | <0.001 | 0.34 | 0.29, 0.40 | <0.001 |
| Characteristic | Obesity (n = 1362) | |||||
|---|---|---|---|---|---|---|
| Unadjusted | Adjusted | |||||
| OR | 95% CI | p-Value | AOR | 95% CI | p-Value | |
| Maternal education | ||||||
| No education | 1.00 | 1.00 | ||||
| Primary | 1.53 | 1.22, 1.91 | <0.001 | 1.58 | 1.25, 1.99 | <0.001 |
| Secondary and above | 1.99 | 1.61, 2.46 | <0.001 | 1.50 | 1.16, 1.94 | <0.001 |
| Watches television | ||||||
| At least once a week | 1.00 | 1.00 | ||||
| Less than once a week | 0.45 | 0.34, 0.61 | <0.001 | 0.72 | 0.54, 0.97 | 0.029 |
| Never | 0.31 | 0.26, 0.37 | <0.001 | 0.63 | 0.51, 0.77 | <0.001 |
| Currently breastfeeding | ||||||
| No | 1.00 | 1.00 | ||||
| Yes | 1.94 | 1.61, 2.35 | <0.001 | 1.33 | 1.09, 1.63 | <0.001 |
| Women status | ||||||
| Adolescence(15–19 years) | 1.00 | 1.00 | ||||
| Non adolescence (20–49 years) | 7.02 | 4.40, 11.19 | <0.001 | 3.26 | 1.93, 5.49 | <0.001 |
| Age | ||||||
| 15–24 years | 1.00 | 1.00 | ||||
| 25–34 years | 2.76 | 2.19, 3.48 | <0.001 | 1.94 | 1.49, 2.52 | <0.001 |
| 35–49 years | 3.57 | 2.85, 4.48 | <0.001 | 2.73 | 2.10, 3.56 | <0.001 |
| Autonomy Health Care | ||||||
| Husband alone | 1.00 | 1.00 | ||||
| Woman alone or joint decision | 1.50 | 1.29, 1.73 | <0.001 | 1.25 | 1.08, 1.45 | 0.003 |
| Working status | ||||||
| Non-working | 1.00 | 1.00 | ||||
| Working (past 12 months) | 0.64 | 0.56, 0.73 | <0.001 | 0.74 | 0.64, 0.85 | <0.001 |
| Reads newspaper or magazine | ||||||
| At least once a week | 1.00 | 1.00 | ||||
| Less than once a week | 0.61 | 0.46, 0.82 | 0.001 | 0.89 | 0.66, 1.19 | 0.439 |
| Never | 0.32 | 0.25, 0.40 | <0.001 | 0.75 | 0.59, 0.95 | 0.017 |
| Division | ||||||
| Barishal | 1.00 | 1.00 | ||||
| Chattogram | 1.77 | 1.31, 2.39 | <0.001 | 1.14 | 0.87, 1.49 | 0.332 |
| Dhaka | 1.91 | 1.41, 2.59 | <0.001 | 1.03 | 0.79, 1.35 | 0.813 |
| Khulna | 1.59 | 1.16, 2.17 | 0.004 | 1.15 | 0.88, 1.51 | 0.308 |
| Mymensingh | 0.77 | 0.49, 1.20 | 0.248 | 0.74 | 0.50, 1.08 | 0.121 |
| Rajshahi | 1.20 | 0.87, 1.67 | 0.266 | 1.00 | 1.75, 1.33 | 0.992 |
| Rangpur | 0.96 | 0.67, 1.37 | 0.805 | 1.07 | 0.78, 1.47 | 0.679 |
| Sylhet | 0.69 | 0.45, 1.05 | 0.082 | 0.51 | 0.37, 0.71 | <0.001 |
| Wealth Index | ||||||
| Richest | 1.00 | 1.00 | ||||
| Richer | 0.43 | 0.36, 0.51 | <0.001 | 0.52 | 0.44, 0.62 | <0.001 |
| Middle | 0.29 | 0.24, 0.34 | <0.001 | 0.37 | 0.30, 0.46 | <0.001 |
| Poorer | 0.17 | 0.13, 0.21 | <0.001 | 0.26 | 0.20, 0.35 | <0.001 |
| Poorest | 0.10 | 0.07, 0.13 | <0.001 | 0.19 | 0.13, 0.27 | <0.001 |
Publisher’s Note: MDPI stays neutral with regard to jurisdictional claims in published maps and institutional affiliations. |
© 2021 by the authors. Licensee MDPI, Basel, Switzerland. This article is an open access article distributed under the terms and conditions of the Creative Commons Attribution (CC BY) license (https://creativecommons.org/licenses/by/4.0/).
Share and Cite
Khanam, M.; Osuagwu, U.L.; Sanin, K.I.; Haque, M.A.; Rita, R.S.; Agho, K.E.; Ahmed, T. Underweight, Overweight and Obesity among Reproductive Bangladeshi Women: A Nationwide Survey. Nutrients 2021, 13, 4408. https://doi.org/10.3390/nu13124408
Khanam M, Osuagwu UL, Sanin KI, Haque MA, Rita RS, Agho KE, Ahmed T. Underweight, Overweight and Obesity among Reproductive Bangladeshi Women: A Nationwide Survey. Nutrients. 2021; 13(12):4408. https://doi.org/10.3390/nu13124408
Chicago/Turabian StyleKhanam, Mansura, Uchechukwu Levi Osuagwu, Kazi Istiaque Sanin, Md. Ahshanul Haque, Razia Sultana Rita, Kingsley Emwinyore Agho, and Tahmeed Ahmed. 2021. "Underweight, Overweight and Obesity among Reproductive Bangladeshi Women: A Nationwide Survey" Nutrients 13, no. 12: 4408. https://doi.org/10.3390/nu13124408
APA StyleKhanam, M., Osuagwu, U. L., Sanin, K. I., Haque, M. A., Rita, R. S., Agho, K. E., & Ahmed, T. (2021). Underweight, Overweight and Obesity among Reproductive Bangladeshi Women: A Nationwide Survey. Nutrients, 13(12), 4408. https://doi.org/10.3390/nu13124408