
Affordability of Heathy, Equitable and More Sustainable Diets in Low-Income Households in Brisbane before and during the COVID-19 Pandemic

 ,
,  , ,
, ,
Abstract
:1. Introduction
2. Materials and Methods
2.1. Diet Pricing Tools
2.2. Store Location and Sampling
2.3. Calculation of Household Incomes
2.4. Price Data Collection
2.5. Analysis and Reporting
3. Results
3.1. Selected Locations and Stores
3.2. Cost of Current and Recommended Diets
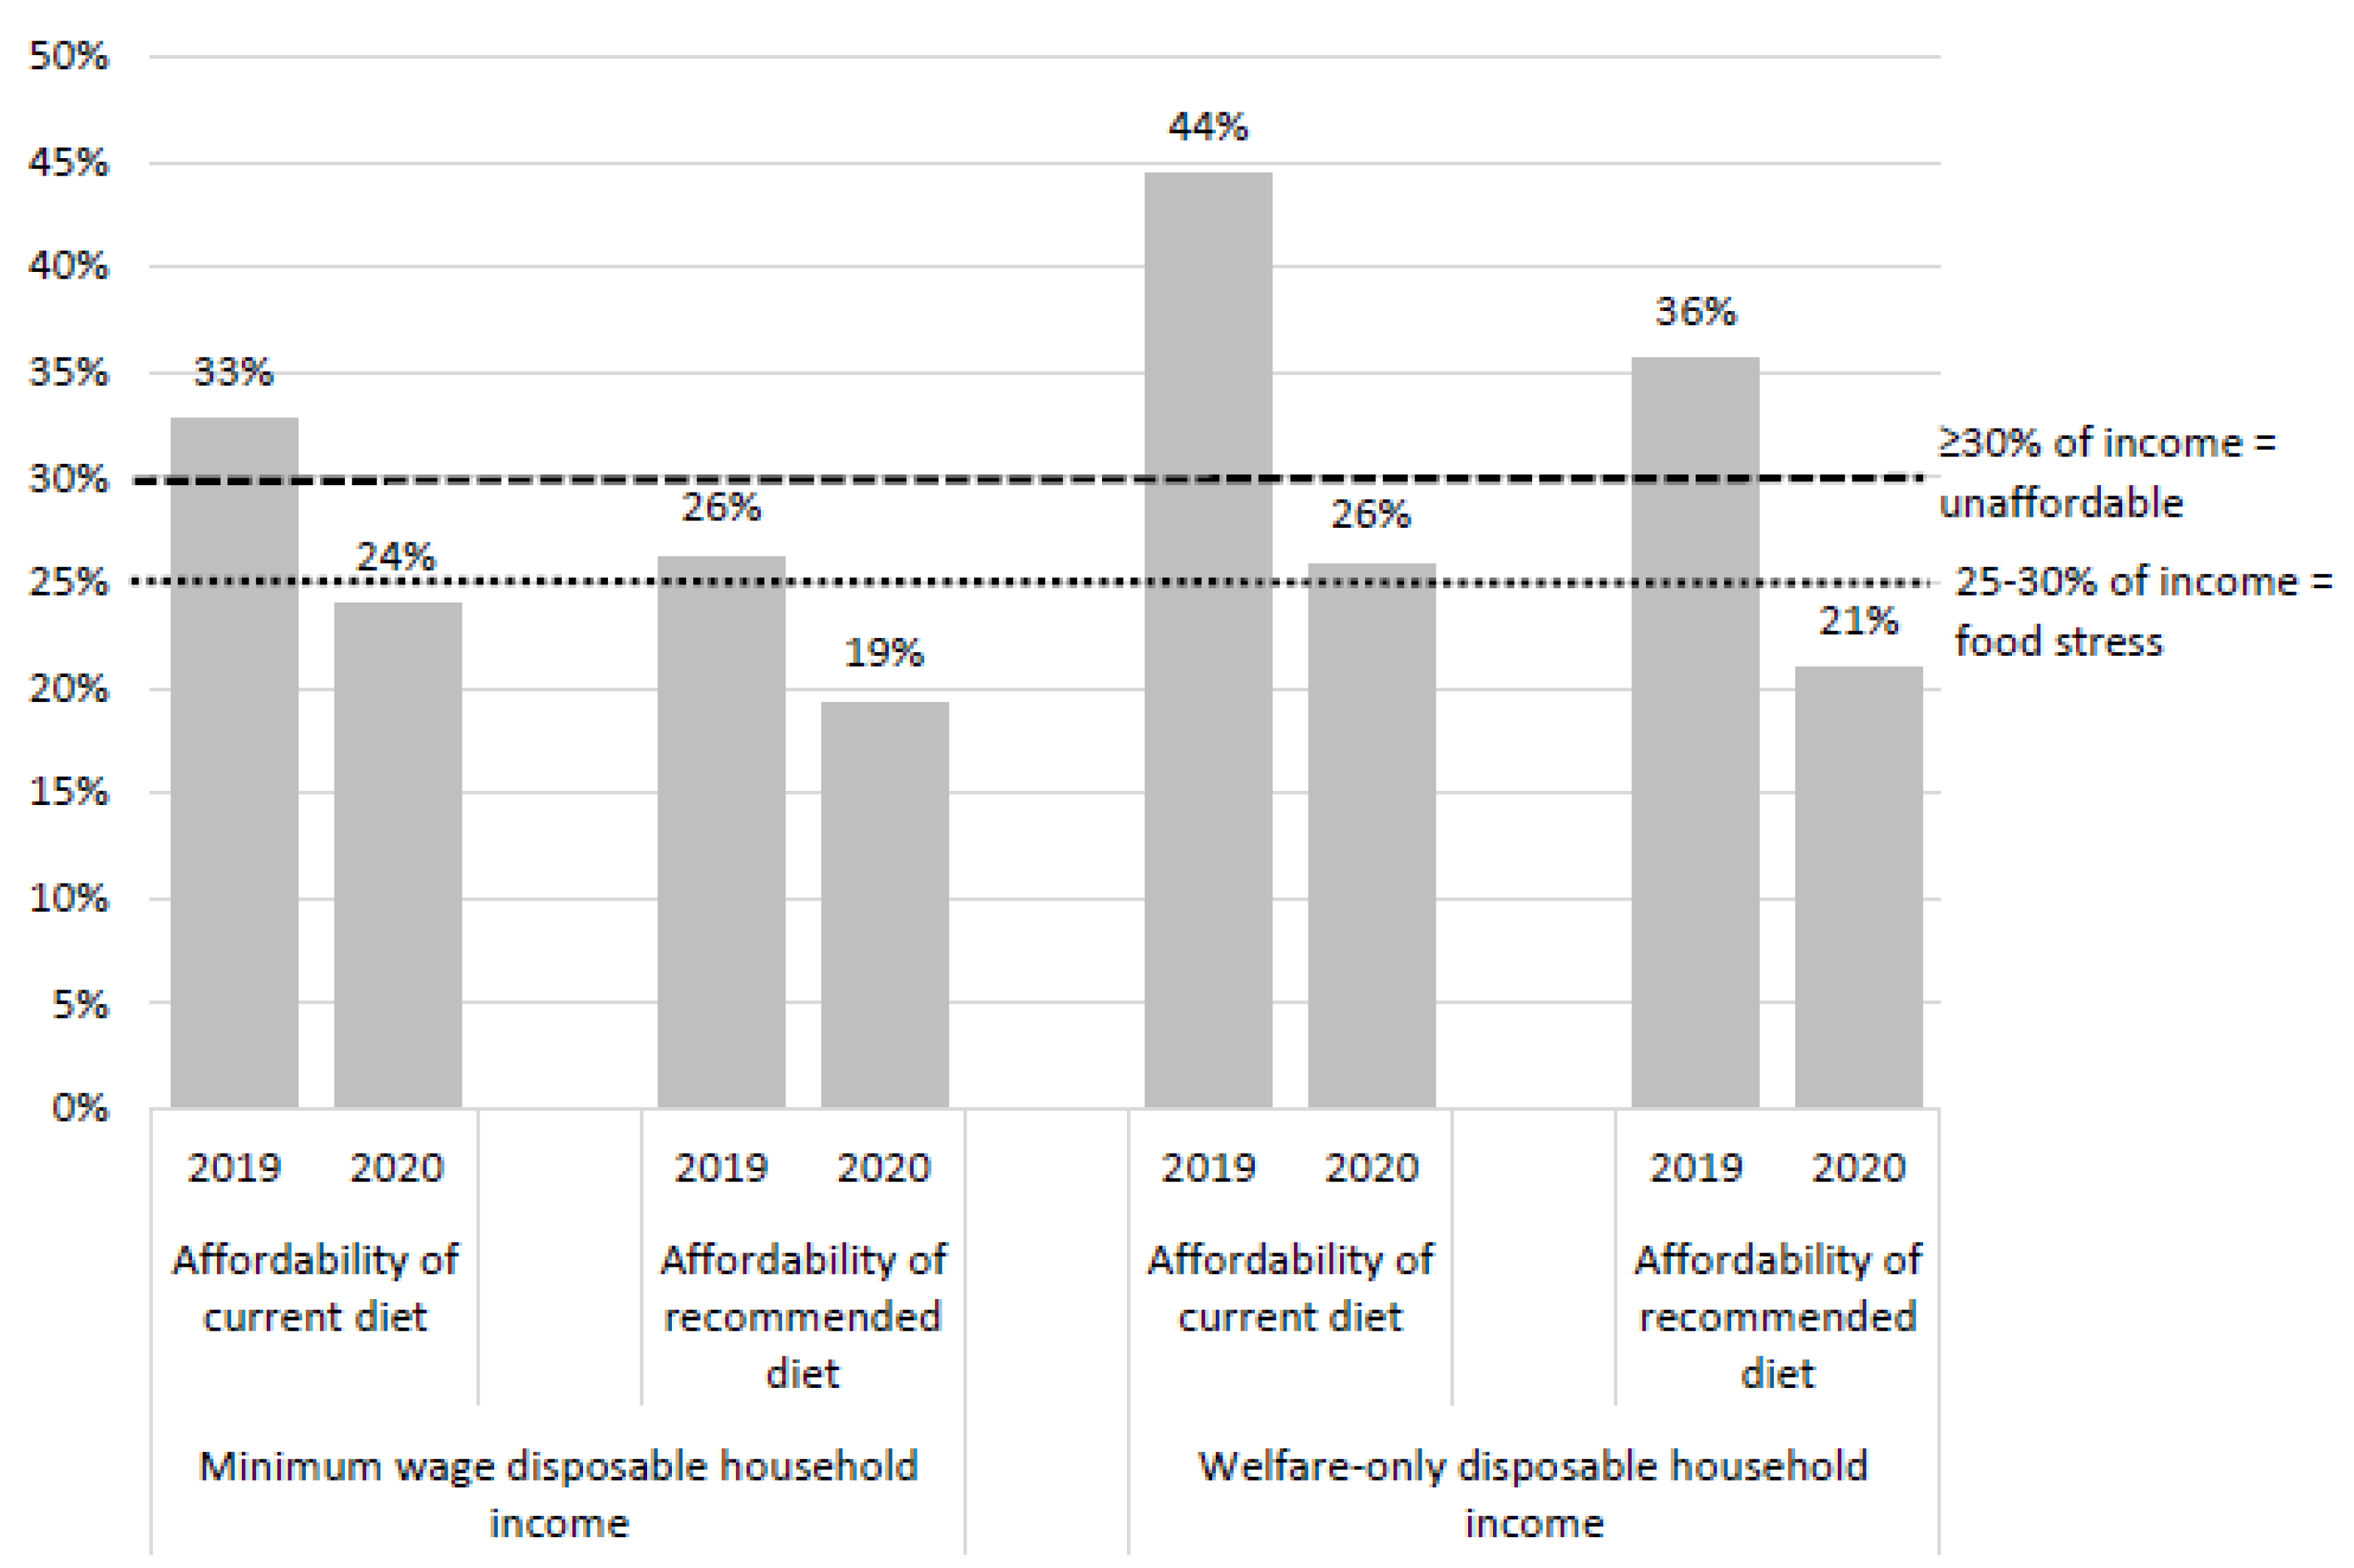
3.3. Affordability of Current and Recommended Diets
4. Discussion
5. Limitations
6. Conclusions
Supplementary Materials
Author Contributions
Funding
Institutional Review Board Statement
Informed Consent Statement
Data Availability Statement
Conflicts of Interest
References
- Penne, T.; Goedemé, T. Can low-income households afford a healthy diet? Insufficient income as a driver of food insecurity in Europe. Food Policy 2020, 99, 101978. [Google Scholar] [CrossRef]
- GBD 2019 Risk Factors Collaborators. Global burden of 87 risk factors in 204 countries and territories, 1990–2019: A systematic analysis for the Global Burden of Disease Study 2019. Lancet 2020, 396, 1223–1249. [Google Scholar] [CrossRef]
- FAO; IFAD; UNICEF; WFP; WHO. The State of Food Security and Nutrition in the World 2021. Transforming Food Systems for Food Security, Improved Nutrition and Affordable Healthy Diets for All; Food and Agriculture Organization of the United Nations (FAO): Rome, Italy, 2021. [Google Scholar]
- Food and Agriculture Organization of the United Nations and the World Health Organization. Sustainable Healthy Diets–Guiding Principles; FAO; WHO: Rome, Italy, 2019. [Google Scholar]
- World Food Programme and Food and Agricultural Organization. Hunger Hotspots. FAO-WFP Early Warnings on Acute Food Insecurity: March to July 2021 Outlook; Food and Agriculture Organization of the United Nations: Rome, Italy, 2021. [Google Scholar]
- Kent, K.; Murray, S.; Penrose, B.; Auckland, S.; Visentin, D.; Godrich, S.; Lester, E. Prevalence and Socio-Demographic Predictors of Food Insecurity in Australia during the COVID-19 Pandemic. Nutrients 2020, 12, 2682. [Google Scholar] [CrossRef]
- National Health and Medical Research Council. Australian Dietary Guidelines-Providing the Scientific Evidence for Healthier Australian Diets; National Health and Medical Research Council: Canberra, Australia, 2013. [Google Scholar]
- Lee, A.; Lewis, M. Testing the Price of Healthy and Current Diets in Remote Aboriginal Communities to Improve Food Security: Development of the Aboriginal and Torres Strait Islander Healthy Diets ASAP (Australian Standardised Affordability and Pricing) Methods. Int. J. Environ. Res. Public Health 2018, 15, 2912. [Google Scholar] [CrossRef] [Green Version]
- Lee, A.; Patay, D.; Herron, L.; Parnell Harrison, E.; Lewis, M. Affordability of current, and healthy, more equitable, sustainable diets by area of socioeconomic disadvantage and remoteness in Queensland: Insights into food choice. Int. J. Equity Health 2021, 20, 1. [Google Scholar] [CrossRef]
- Lee, A.J.; Kane, S.; Herron, L.M.; Matsuyama, M.; Lewis, M. A tale of two cities: The cost, price-differential and affordability of current and healthy diets in Sydney and Canberra, Australia. Int. J. Behav. Nutr. Phys. Act. 2020, 17, 80. [Google Scholar] [CrossRef] [PubMed]
- Lee, A.J.; Kane, S.; Lewis, M.; Good, E.; Pollard, C.M.; Landrigan, T.J.; Dick, M. Healthy diets ASAP-Australian Standardised Affordability and Pricing methods protocol. Nutr. J. 2018, 17, 88. [Google Scholar] [CrossRef] [PubMed]
- Lee, A.J.; Kane, S.; Ramsey, R.; Good, E.; Dick, M. Testing the price and affordability of healthy and current (unhealthy) diets and the potential impacts of policy change in Australia. BMC Public Health 2016, 16, 315. [Google Scholar] [CrossRef] [PubMed] [Green Version]
- Love, P.; Whelan, J.; Bell, C.; Grainger, F.; Russell, C.; Lewis, M.; Lee, A. Healthy Diets in Rural Victoria-Cheaper than unhealthy alternatives, yet unaffordable. Int. J. Environ. Res. Public Health 2018, 15, 2469. [Google Scholar] [CrossRef] [Green Version]
- Zorbas, C.; Brooks, R.; Bennett, R.; Lee, A.; Marshall, J.; Naughton, S.; Lewis, M.; Peeters, A.; Backholer, K. Costing recommended (healthy) and current (unhealthy) diets in urban and inner regional areas of Australia using remote price collection methods. Public Health Nutr. 2021, 1–10. [Google Scholar] [CrossRef] [PubMed]
- The Treasury of the Australian Government. Economic Response to the Coronavirus. 2020. Available online: https://treasury.gov.au/coronavirus (accessed on 7 August 2021).
- Lee, A.; Mhurchu, C.N.; Sacks, G.; Swinburn, B.; Snowdon, W.; Vandevijvere, S.; Hawkes, C.; L’ Abbé, M.; Rayner, M.; Sanders, D.; et al. Monitoring the price and affordability of foods and diets globally. Obes. Rev. 2013, 14, 82–95. [Google Scholar] [CrossRef] [Green Version]
- Lewis, M.; Lee, A. Costing ‘healthy’ food baskets in Australia-a systematic review of food price and affordability monitoring tools, protocols and methods. Public Health Nutr. 2016, 19, 2872–2886. [Google Scholar] [CrossRef] [PubMed]
- Seal, J. Monitoring the price and availability of healthy food-time for a national approach. Nutr. Diet. 2004, 61, 197–198. [Google Scholar]
- Australian Bureau of Statistics. Australian Health Survey: Consumption of Food Groups from the Australian Dietary Guidelines, 2011–2012. Available online: http://www.abs.gov.au/AUSSTATS/abs@.nsf/Lookup/4364.0.55.012Main+Features100032011-12?OpenDocument (accessed on 7 August 2021).
- Hendrie, G.; Ridoutt, B.; Wiedmann, T.; Noakes, M. Greenhouse Gas Emissions and the Australian Diet—Comparing Dietary Recommendations with Average Intakes. Nutrients 2014, 6, 289–303. [Google Scholar] [CrossRef] [Green Version]
- Australian Bureau of Statistics. Socio-Economic Indexes for Areas. Available online: https://www.abs.gov.au/websitedbs/censushome.nsf/home/seifa (accessed on 7 August 2021).
- Zorbas, C.; Lee, A.; Peeters, A.; Lewis, M.; Landrigan, T.; Backholer, K. Streamlined data-gathering techniques to estimate the price and affordability of healthy and unhealthy diets under different pricing scenarios. Public Health Nutr. 2020, 24, 1–11. [Google Scholar] [CrossRef] [PubMed]
- The Australian Government. Government Payments and Services. Available online: https://www.servicesaustralia.gov.au/ (accessed on 7 August 2021).
- Ward, P.R.; Verity, F.; Carter, P.; Tsourtos, G.; Coveney, J.; Wong, K.C. Food stress in Adelaide: The relationship between low income and the affordability of healthy food. J. Environ. Public Health 2013, 2013, 968078. [Google Scholar] [CrossRef] [PubMed]
- Buse, K.; Tanaka, S.; Hawkes, S. Healthy people and healthy profits? Elaborating a conceptual framework for governing the commercial determinants of non-communicable diseases and identifying options for reducing risk exposure. Glob. Health 2017, 13, 34. [Google Scholar] [CrossRef] [PubMed] [Green Version]
- Department of Health. Northern Territory Market Basket Survey 2017; Northern Territory Government of Australia: Darwin, Australia, 2017. [Google Scholar]
- Goulding, T.; Lindberg, R.; Russell, C.G. The affordability of a healthy and sustainable diet: An Australian case study. Nutr. J. 2020, 19, 1–109. [Google Scholar] [CrossRef]
- Mackay, S.; Buch, T.; Vandevijvere, S.; Goodwin, R.; Korohina, E.; Funaki-Tahifote, M.; Lee, A.; Swinburn, B. Cost and affordability of diets modelled on current eating patterns and on dietary guidelines, for New Zealand total population, Māori and Pacific Households. Int. J. Environ. Res. Public Health 2018, 15, 1255. [Google Scholar] [CrossRef] [Green Version]
- Batis, C.; Marrón-Ponce, J.A.; Stern, D.; Vandevijvere, S.; Barquera, S.; Rivera, J.A. Adoption of healthy and sustainable diets in Mexico does not imply higher expenditure on food. Nat. Food 2021. [Google Scholar] [CrossRef]
- Rao, M.; Afshin, A.; Singh, G.; Mozaffarian, D. Do healthier foods and diet patterns cost more than less healthy options? A systematic review and meta-analysis. BMJ Open 2013, 3, e004277. [Google Scholar] [CrossRef] [PubMed]
- Barosh, L.; Friel, S.; Engelhardt, K.; Chan, L. The cost of a healthy and sustainable diet--who can afford it? Aust. N. Z. J. Public Health 2014, 38, 7–12. [Google Scholar] [CrossRef]
- Vandevijvere, S.; Pedroni, C.; De Ridder, K.; Castetbon, K. The Cost of Diets According to Their Caloric Share of Ultraprocessed and Minimally Processed Foods in Belgium. Nutrients 2020, 12, 2787. [Google Scholar] [CrossRef] [PubMed]
- Australian Bureau of Statistics. 6401.0-Consumer Price Index, Australia, March 2020; Australian Bureau of Statistics (ABS): Canberra, Australia, 2020. [Google Scholar]
- Department of Agriculture Water and the Environment. African Swine Fever. Available online: https://www.agriculture.gov.au/abares/research-topics/agricultural-outlook/african-swine-fever (accessed on 7 August 2021).
- Bennett, G.; Young, E.; Butler, I.; Coe, S. The Impact of Lockdown during the COVID-19 Outbreak on Dietary Habits in Various Population Groups: A Scoping Review. Front. Nutr. 2021, 8, 626432. [Google Scholar] [CrossRef] [PubMed]
- Brindal, E. A Wellbeing Survey of the CSIRO Total Wellbeing Diet Database during the COVID-19 Pandemic. Available online: https://www.csiro.au/en/news/news-releases/2020/csiro-study-reveals-covid-19s-impact-on-weight-and-emotional-wellbeing (accessed on 28 August 2021).
- Neira, C.; Godinho, R.; Rincón, F.; Mardones, R.; Pedroso, J. Consequences of the covid-19 syndemic for nutritional health: A systematic review. Nutrients 2021, 13, 1168. [Google Scholar] [CrossRef]
- Australian Council of Social Service (ACOSS). Survey of 955 People Receiving the New Rate of Jobseeker and Other Allowances Australian Council of Social Service; ACOSS: Sydney, Australia, 2020. [Google Scholar]
- Baker, E.; Daniels, L. Rental Insights: A COVID-19 Collection; The Australian Housing and Urban Research Institute Limited: Melbourne, Australia, 2020. [Google Scholar]
- Baker, E.; Bentley, R.; Beer, A.; Daniel, L. Renting in the time of COVID-19: Understanding the impacts, AHURI Final Report No. 340; Australian Housing and Urban Research Institute Limited: Melbourne, Australia, 2020. [Google Scholar]
- Tingle, L. COVID Gave Us a Once-in-a-Lifetime Natural Experiment–but Scott Morrison Has Turned His Back on the Lessons [Cites Unpublished Data Reported by Economist Andrew Charlton at a National Press Club Address in Canberra, Australia]. ABC News, 27 November 2021. [Google Scholar]
- Lee, A.J.; Cullerton, K.; Herron, L.-M. Achieving Food System Transformation: Insights From A Retrospective Review of Nutrition Policy (In)Action in High-Income Countries. Int. J. Health Policy Manag. 2020, 10, 766–783. [Google Scholar] [CrossRef]
- FAO; WFP; UNECE; UNICEF; WHO; WMO. Regional Overview of Food Security and Nutrition in Europe and Central Asia 2020: Affordable Healthy Diets to Address All forms of Malnutrition for Better Health; FAO; WFP; UN; UNICEF; WHO; WMO: Budapest, Hungary, 2021. [Google Scholar]
- Raifman, J.; Bor, J.; Venkataramani, A. Association between receipt of unemployment insurance and food insecurity among people who lost employment during the COVID-19 pandemic in the United States. JAMA Netw. Open 2021, 4, e2035884. [Google Scholar] [CrossRef]
- United States Census Bureau. Economic Hardship Declined in Households with Children as Child Tax Credit Payments Arrived. Available online: https://www.census.gov/library/stories/2021/08/economic-hardship-declined-in-households-with-children-as-child-tax-credit-payments-arrived.html (accessed on 20 September 2021).
- Koltai, J.; Toffolutti, V.; McKee, M.; Stuckler, D. Prevalence and changes in food-related hardships by socioeconomic and demographic groups during the COVID-19 pandemic in the UK: A longitudinal panel study. Lancet Reg. Health. Eur. 2021, 6, 100125. [Google Scholar] [CrossRef] [PubMed]
- Australian Council of Social Service. Cuts Will Plunge Millions Further into Poverty (Media Release). 28 March 2021. Available online: https://www.acoss.org.au/media_release/cuts-will-plunge-millions-further-into-poverty/ (accessed on 4 November 2021).
- Foodbank Australia. Foodbank Hunger Report 2021; Foodbank Australia Ltd.: North Ryde, Australia, 2021. [Google Scholar]
- Grudnoff, M. Opportunity Lost: Half a Million Australians in Poverty without the Coronavirus Supplement. Discussion Paper; The Australia Institute: Canberra, Australia, March 2021. [Google Scholar]
- Thow, A.M.; Downs, S.; Jan, S. A systematic review of the effectiveness of food taxes and subsidies to improve diets: Understanding the recent evidence. Nutr. Rev. 2014, 72, 551–565. [Google Scholar] [CrossRef]
- Lannin, S. OECD Calls on Australia to Raise GST, Lift Jobless Benefits and Review the Reserve Bank to Deal with Economic Fallout from COVID. Available online: https://www.abc.net.au/news/2021-09-15/oecd-australia-economy-gst-rba-jobs-covid-climate/100462798 (accessed on 7 October 2021).
- Australian Bureau of Statistics. Australian Health Survey, National Health Survey, 2011–2012; Australian Bureau of Statistics (ABS): Canberra, Australia, 2013. [Google Scholar]
- Lewis, M.; McNaughton, S.A.; Rychetnik, L.; Lee, A.J. Cost and Affordability of Healthy, Equitable and Sustainable Diets in Low Socioeconomic Groups in Australia. Nutrients 2021, 13, 2900. [Google Scholar] [CrossRef] [PubMed]
- Dana, L.M.; Hart, E.; McAleese, A.; Bastable, A.; Pettigrew, S. Factors associated with ordering food via online meal ordering services. Public Health Nutr. 2021, 1–18. [Google Scholar] [CrossRef] [PubMed]
- Roy Morgan Research. Meal Delivery Services Uber Eats, Menulog, Deliveroo and DoorDash Experienced Rapid Growth during 2020–A Year of Lockdowns and Work from Home. Available online: http://www.roymorgan.com/findings/8713-food-delivery-services-may-2021-202105280627 (accessed on 11 October 2021).
- O’Kane, G. COVID-19 puts the spotlight on food insecurity in rural and remote Australia. Aust. J. Rural. Health 2020, 28, 319–320. [Google Scholar] [CrossRef] [PubMed]
- Whelan, J.; Brown, A.D.; Coller, L.; Strugnell, C.; Allender, S.; Alston, L.; Hayward, J.; Brimblecombe, J.; Bell, C. The Impact of COVID-19 on Rural Food Supply and Demand in Australia: Utilising Group Model Building to Identify Retailer and Customer Perspectives. Nutrients 2021, 13, 417. [Google Scholar] [CrossRef] [PubMed]
- Fredericks, B.; Bradfield, A. Indigenous Australians and COVID-19: Highlighting ongoing food security issues. Int. J. Home Econ. 2021, 14, 53–65. [Google Scholar]


| Total Diet and Food Group Costs of the Current Diet for a Reference Household Per Fortnight | Total Diet and Food Group Costs of the Recommended Diet for a Reference Household Per Fortnight | |||||||||||
|---|---|---|---|---|---|---|---|---|---|---|---|---|
| 2019 | 2020 | Change in Cost from 2019 to 2020 (AUD) | Change in Cost from 2019 to 2020 (%) | 2019 | 2020 | Change in Cost from 2019 to 2020 (AUD) | Change in Cost (%) | |||||
| Food/Food Groups | Mean Cost ± SD (AUD) (n = 30 Locations) | Proportion of Total Diet Cost (%) | Mean Cost ± SD (AUD) (n = 30 Locations) | Proportion of Total Diet Cost (%) | Mean Cost ± SD (AUD) (n = 30 locations) | Proportion of Total Diet cost (%) | Mean Cost ± SD (AUD) (n = 30 Locations) | Proportion of Total Diet Cost (%) | ||||
| Water, bottled | AUD 20.35 ± 1.64 | 2.64% | AUD 19.04 ± 1.75 | 2.39% | −AUD 1.32 | −6.47% | AUD 20.35 ± 1.64 | 3.29% | AUD 19.04 ± 1.75 | 2.96% | −AUD 1.32 | −6.47% |
| Fruits | AUD 53.38 ± 4.08 | 6.91% | AUD 57.44 ± 2.26 | 7.20% | +AUD 4.06 * | +7.60% | AUD 72.81 ± 7.97 | 11.76% | AUD 88.31 ± 6.16 | 13.72% | +AUD 15.50 ** | +21.29% |
| Vegetables (and legumes) | AUD 43.59 ± 1.88 | 5.65% | AUD 40.51 ± 1.69 | 5.08% | −AUD 3.08 ** | −7.07% | AUD 110.36 ± 5.38 | 17.83% | AUD 96.97 ± 4.52 | 15.07% | −AUD 13.39 ** | −12.13% |
| Grain (cereal) foods | AUD 44.34 ± 1.98 | 5.74% | AUD 46.17 ± 1.64 | 5.79% | +AUD 1.83 | +4.12% | AUD 109.99 ± 2.36 | 17.77% | AUD 113.86 ± 3.95 | 17.69% | +AUD 3.87 | +3.52% |
| Lean meats, poultry, fish, eggs, nuts, seeds and alternatives | AUD 96.45 ± 3.63 | 12.49% | AUD 101.86 ± 4.14 | 12.77% | +AUD 5.41 * | +5.61% | AUD 184.52 ± 8.71 | 29.81% | AUD 195.83 ± 7.56 | 30.43% | +AUD 11.31 ** | +6.13% |
| Milk, yoghurt, cheese and alternatives | AUD 47.93 ± 2.75 | 6.21% | AUD 55.02 ± 1.33 | 6.90% | +AUD 7.08 ** | +14.78% | AUD 112.59 ± 8.35 | 18.19% | AUD 120.88 ± 5.35 | 18.79% | +AUD 8.28 * | +7.36% |
| Unsaturated oils and spreads | AUD 1.27 ± 0.06 | 0.17% | AUD 1.30 ± 0.06 | 0.16% | +AUD 0.02 | +1.86% | AUD 8.42 ± 0.38 | 1.36% | AUD 8.59 ± 0.39 | 1.33% | +AUD 0.17 | +1.98% |
| Artificially sweetened beverages | AUD 5.64 ± 0.43 | 0.73% | AUD 6.14 ± 0.21 | 0.77% | +AUD 0.50 ** | +8.82% | - | - | - | - | - | - |
| Sugar sweetened beverages | AUD 31.14 ± 1.57 | 4.03% | AUD 30.82 ± 1.00 | 3.87% | −AUD 0.32 | −1.04% | - | - | - | - | - | - |
| Takeaway foods | AUD 149.31 ± 7.01 | 19.34% | AUD 157.76 ± 7.40 | 19.79% | +AUD 8.44 ** | +5.65% | - | - | - | - | - | - |
| Alcoholic beverages | AUD 96.36 ± 6.05 | 12.48% | AUD 97.93 ± 2.87 | 12.28% | +AUD 1.57 | +1.63% | - | - | - | - | - | - |
| All other discretionary choices | AUD 182.42 ± 9.50 | 23.62% | AUD 183.38 ± 6.62 | 23.00% | +AUD 0.96 | +0.53% | - | - | - | - | - | - |
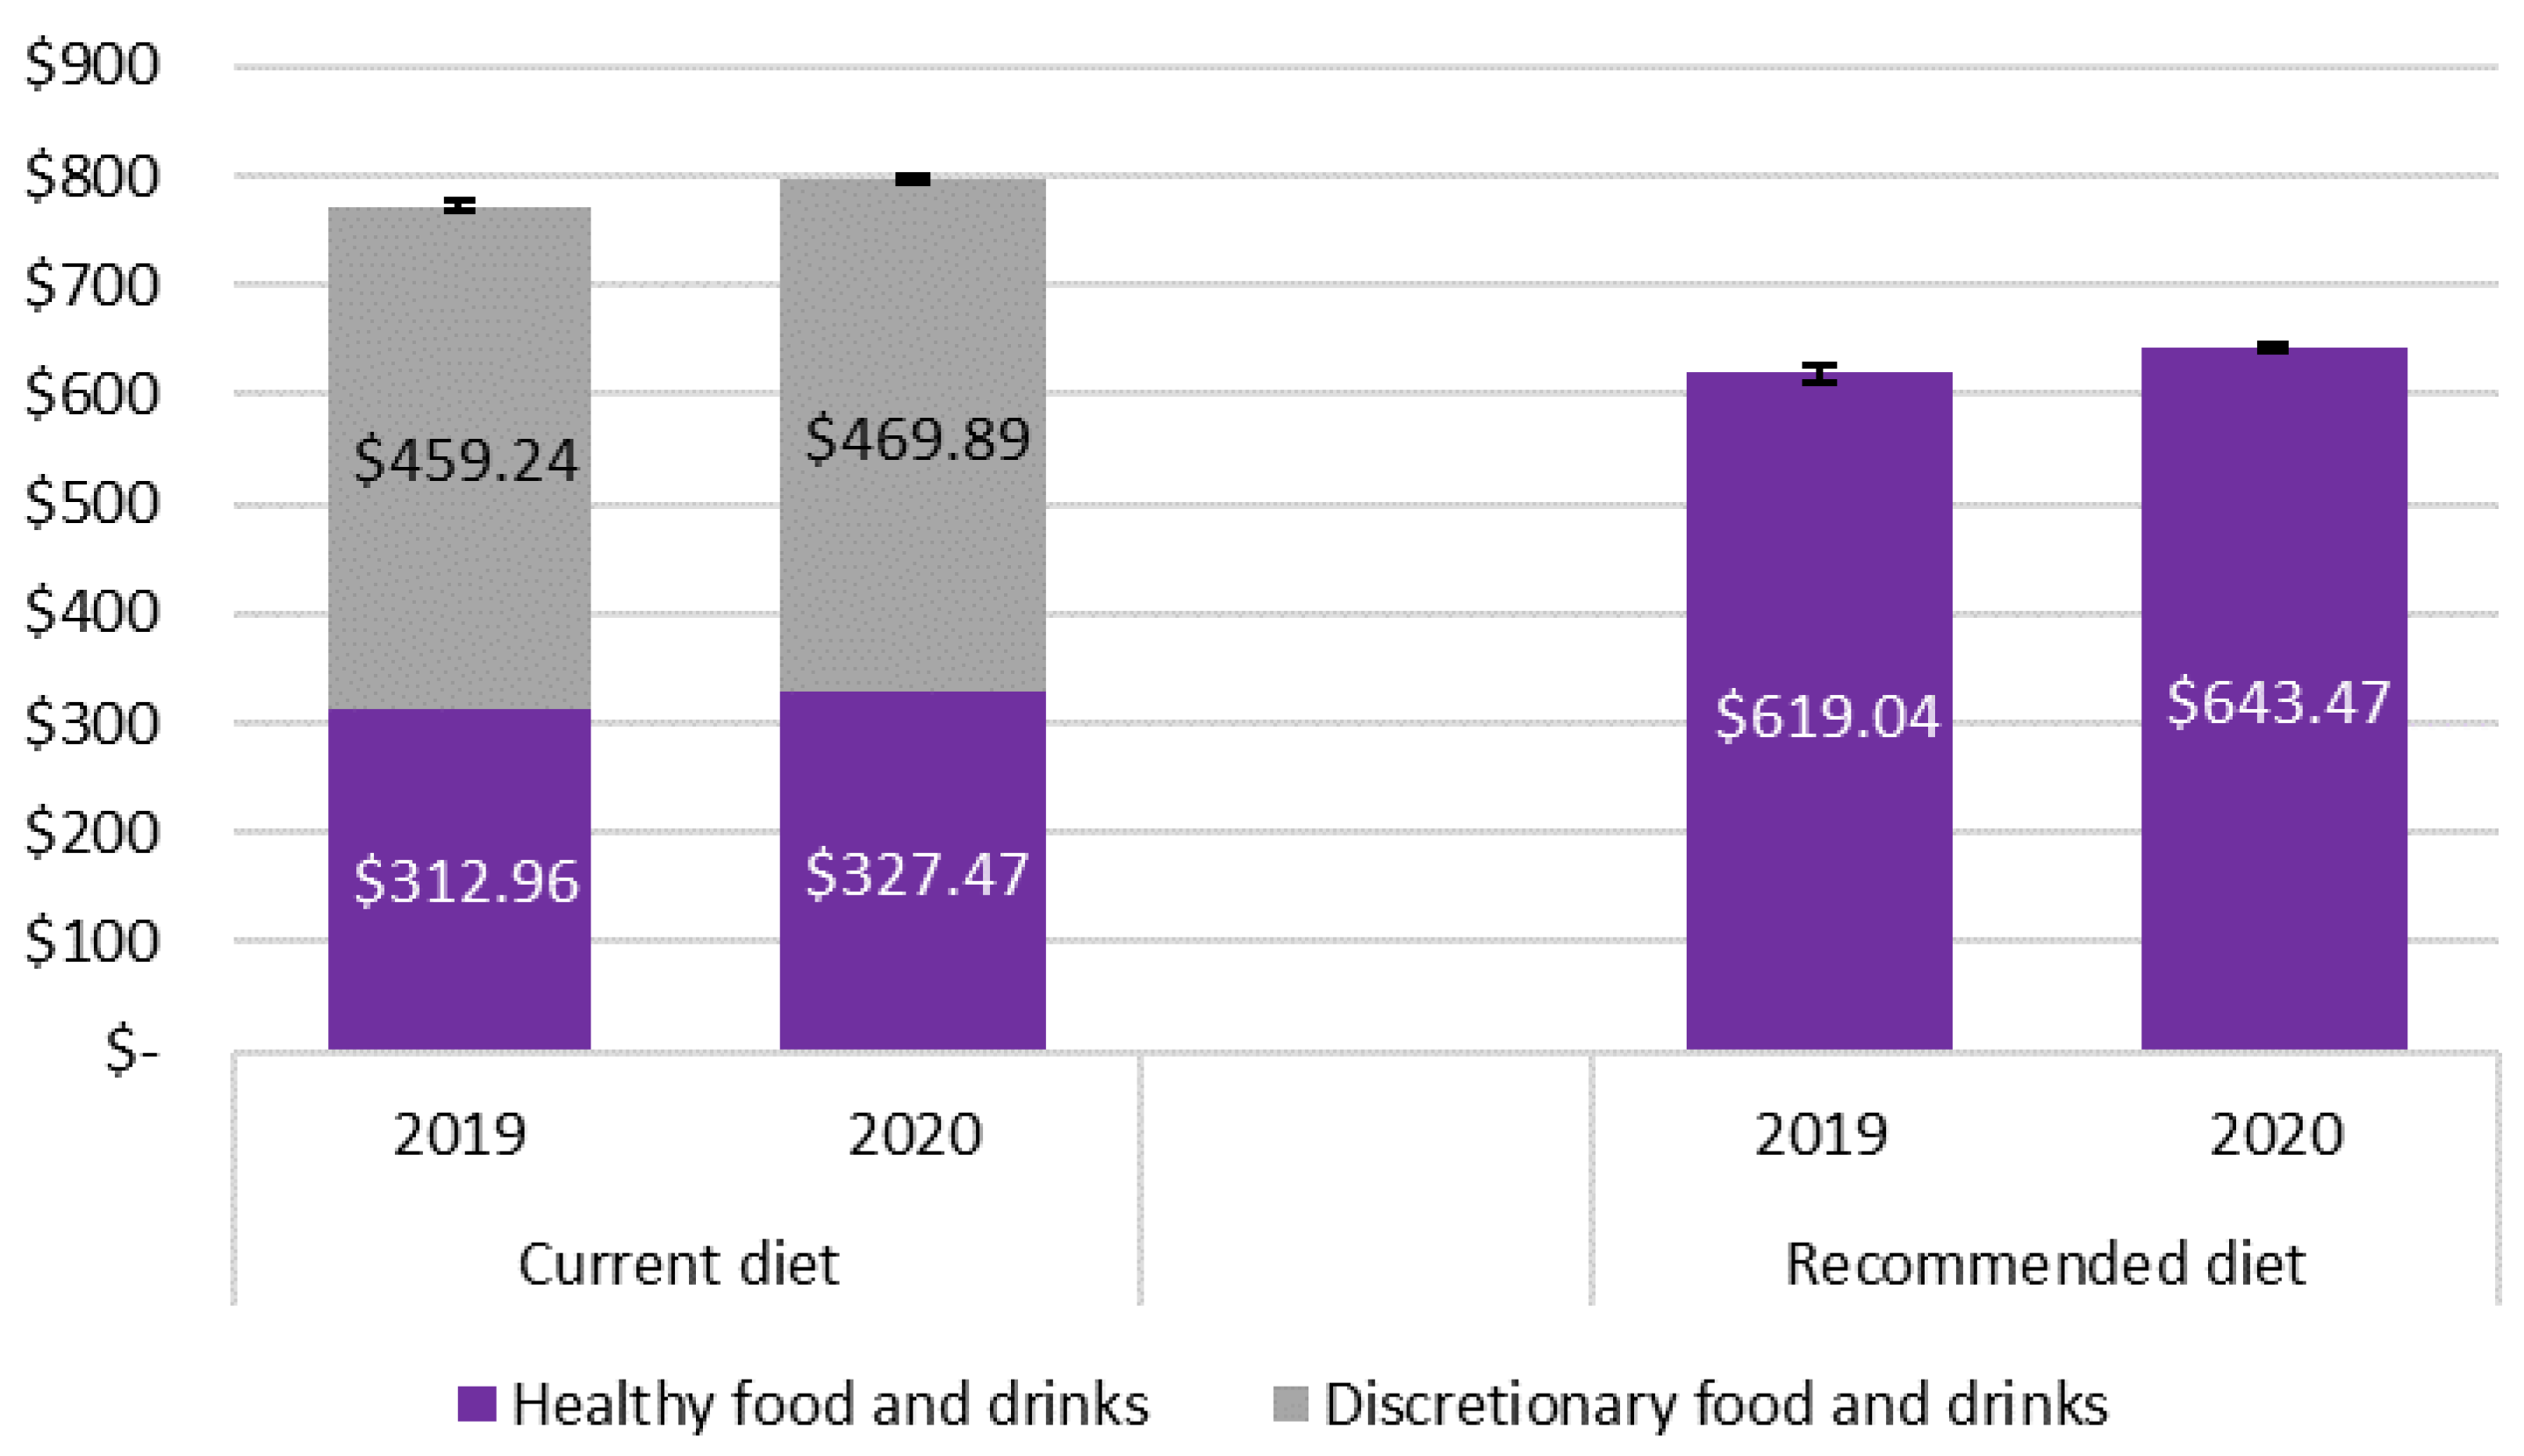
| Total diet | AUD 772.20 ± 14.18 | 100% | AUD 797.36 ± 12.00 | 100.00% | +AUD 25.15 * | +3.26% | AUD 619.04 ± 22.66 | 100% | AUD 643.47 ± 18.48 | 100% | +AUD 24.42 * | +3.95% |
| Healthy foods and drinks in total diet | AUD 312.96 ± 10.21 | 40.53% | AUD 327.47 ± 8.06 | 41.07% | +AUD 10.65 ** | +4.63% | AUD 619.04 ± 22.66 | 100% | AUD 643.47 ± 18.48 | 100% | +AUD 24.42 * | +3.95% |
| Discretionary foods and drinks in total diet | AUD 459.24 ± 7.54 | 59.47% | AUD 469.89 ± 9.16 | 58.93% | +AUD 14.50 | +2.32% | - | - | - | - | - | - |
Publisher’s Note: MDPI stays neutral with regard to jurisdictional claims in published maps and institutional affiliations. |
© 2021 by the authors. Licensee MDPI, Basel, Switzerland. This article is an open access article distributed under the terms and conditions of the Creative Commons Attribution (CC BY) license (https://creativecommons.org/licenses/by/4.0/).
Share and Cite
Lee, A.J.; Patay, D.; Herron, L.-M.; Tan, R.C.; Nicoll, E.; Fredericks, B.; Lewis, M. Affordability of Heathy, Equitable and More Sustainable Diets in Low-Income Households in Brisbane before and during the COVID-19 Pandemic. Nutrients 2021, 13, 4386. https://doi.org/10.3390/nu13124386
Lee AJ, Patay D, Herron L-M, Tan RC, Nicoll E, Fredericks B, Lewis M. Affordability of Heathy, Equitable and More Sustainable Diets in Low-Income Households in Brisbane before and during the COVID-19 Pandemic. Nutrients. 2021; 13(12):4386. https://doi.org/10.3390/nu13124386
Chicago/Turabian StyleLee, Amanda J., Dori Patay, Lisa-Maree Herron, Ru Chyi Tan, Evelyn Nicoll, Bronwyn Fredericks, and Meron Lewis. 2021. "Affordability of Heathy, Equitable and More Sustainable Diets in Low-Income Households in Brisbane before and during the COVID-19 Pandemic" Nutrients 13, no. 12: 4386. https://doi.org/10.3390/nu13124386
APA StyleLee, A. J., Patay, D., Herron, L.-M., Tan, R. C., Nicoll, E., Fredericks, B., & Lewis, M. (2021). Affordability of Heathy, Equitable and More Sustainable Diets in Low-Income Households in Brisbane before and during the COVID-19 Pandemic. Nutrients, 13(12), 4386. https://doi.org/10.3390/nu13124386