
Oral Intake of Enzymatically Decomposed AP Collagen Peptides Improves Skin Moisture and Ceramide and Natural Moisturizing Factor Contents in the Stratum Corneum

 ,
,
Abstract
1. Introduction
2. Materials and Methods
2.1. Supplement Preparation
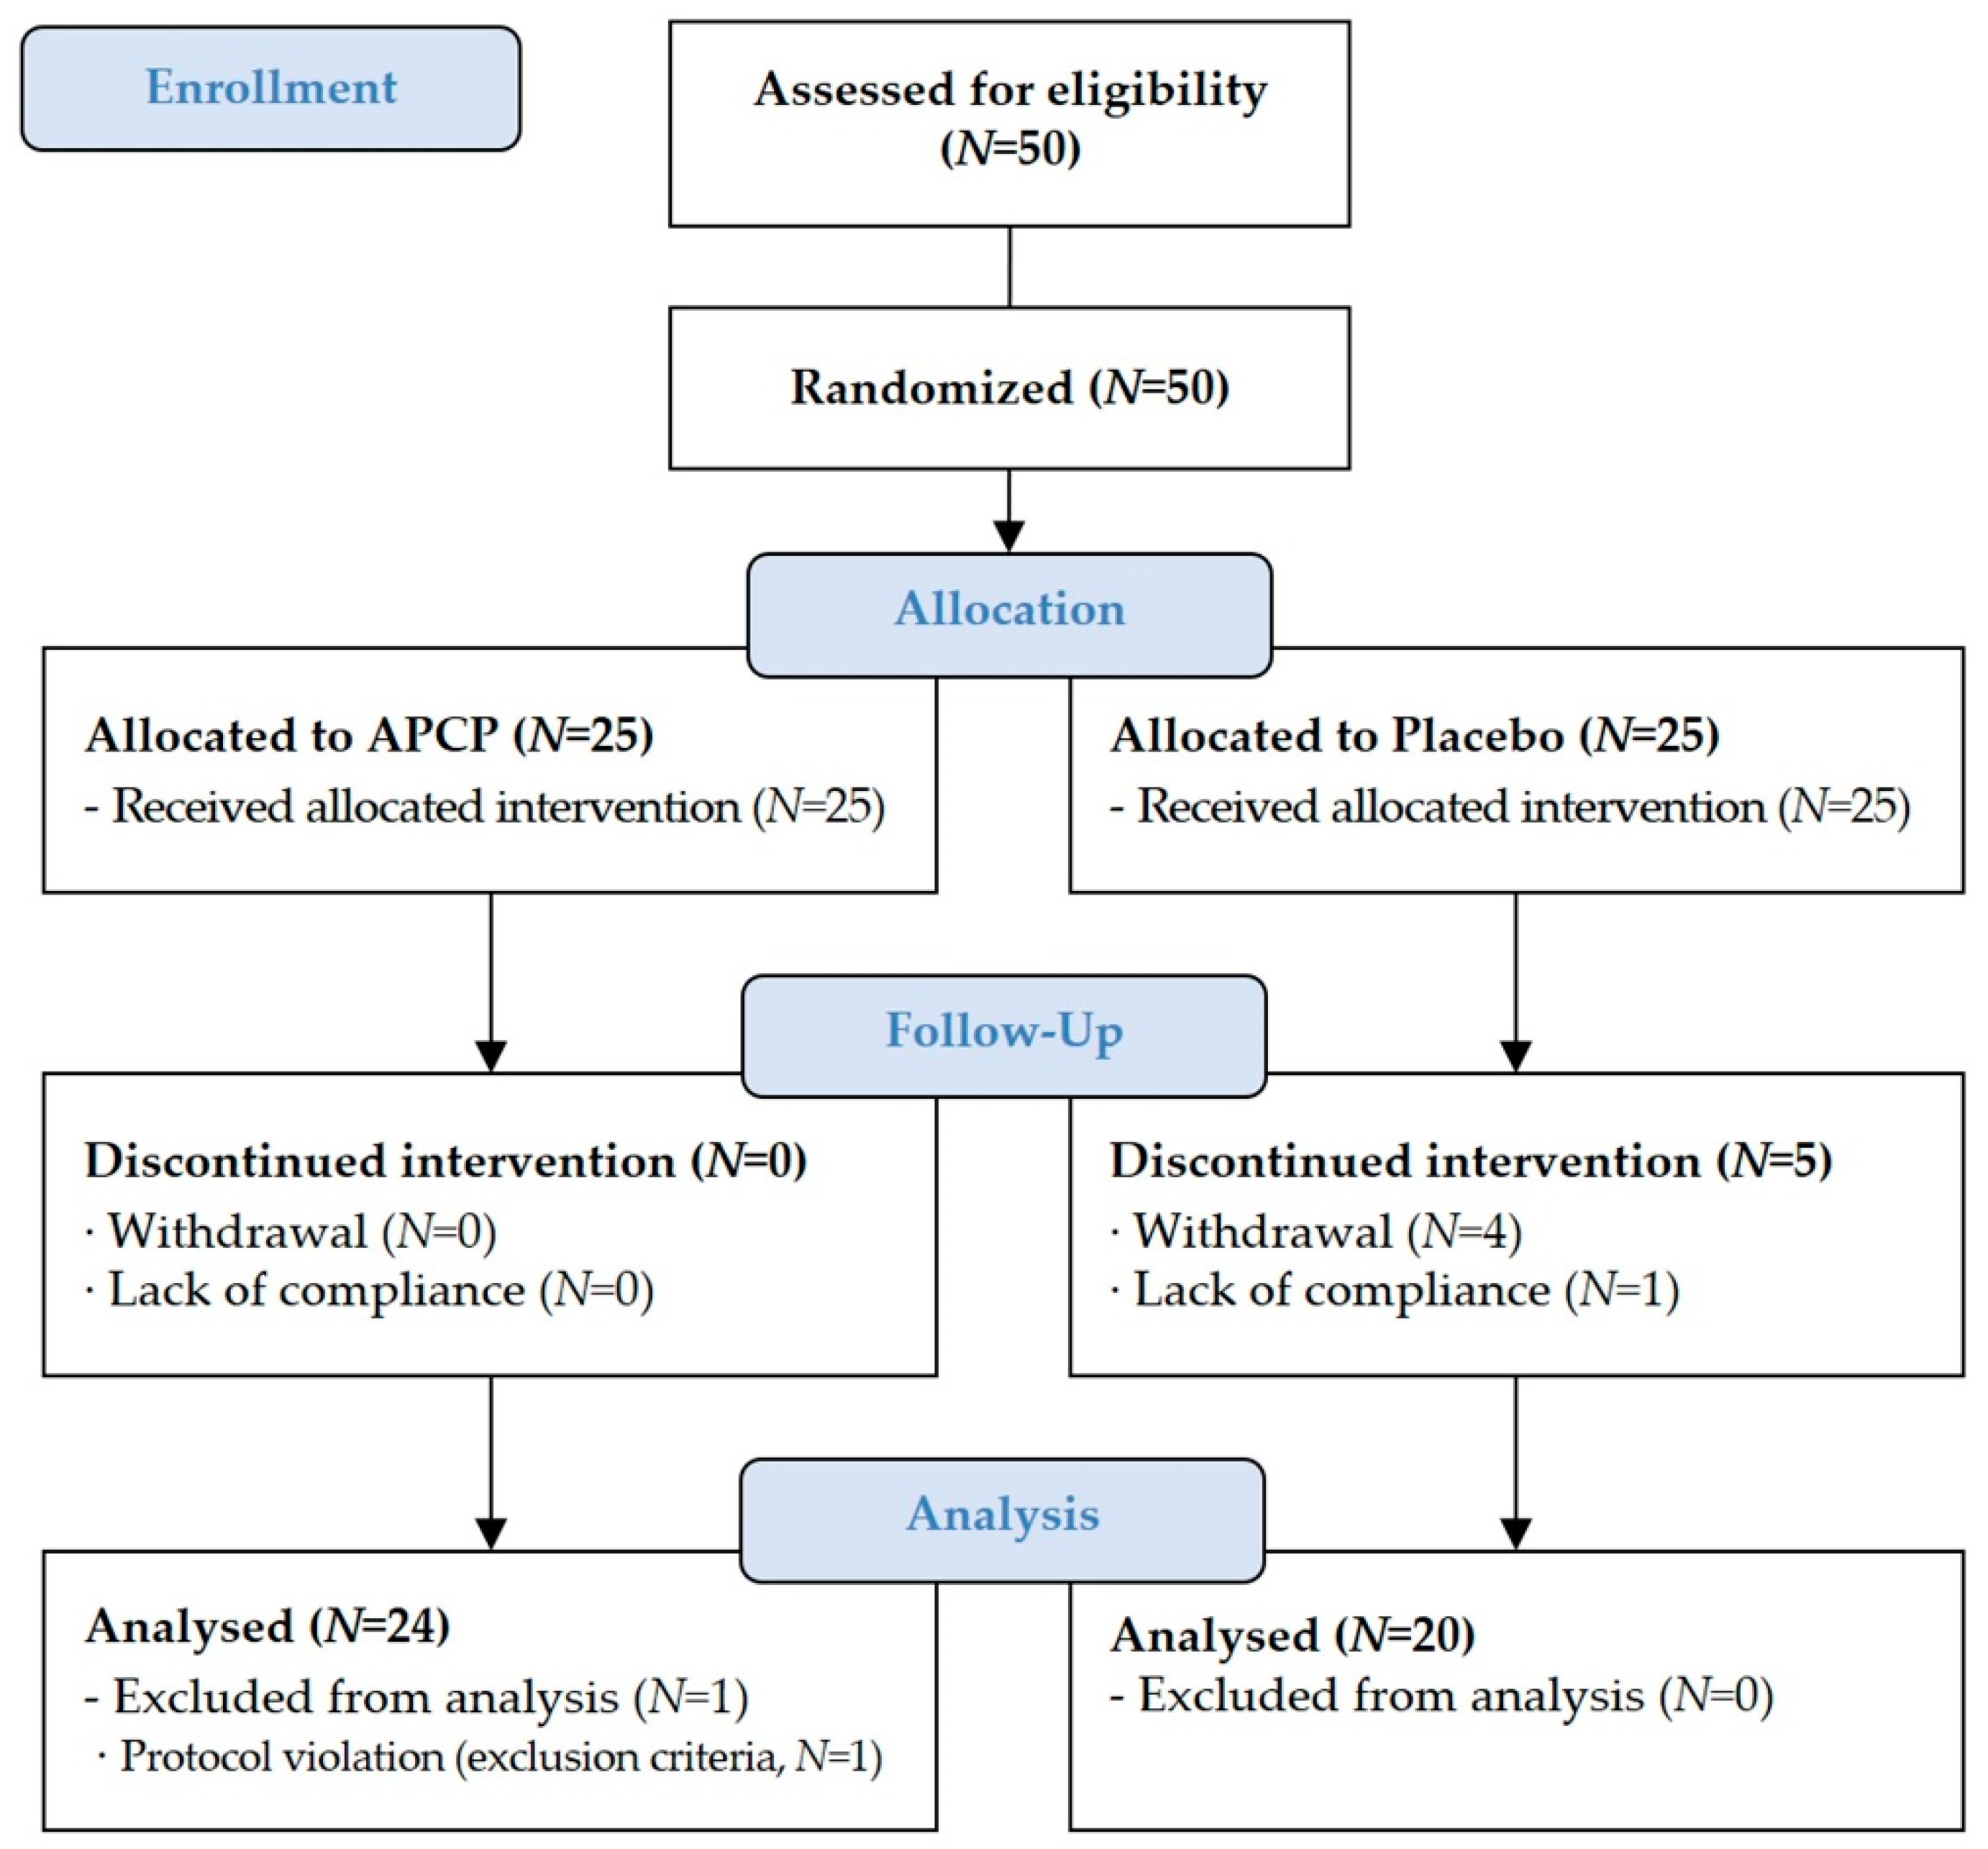
2.2. Study Design and Ethics
2.3. Study Participants
2.4. Study Procedure
2.5. Evaluation of Skin Hydration and Transepidermal Water Loss
2.6. Evaluation of Skin Texture
2.7. Evaluation of SC Flexibility
2.8. Protein Analysis Using the Tape Strips
2.9. Analysis of AAs in the SC
2.10. Analysis of AADs in the SC
2.11. Lipid Extraction and Analysis of the Ceramide Content in the SC
2.12. Statistical Analysis
3. Results
3.1. Study Participants
3.2. Skin Hydration
3.2.1. Skin Moisture
3.2.2. TEWL
3.3. Skin Texture
3.3.1. Skin Roughness
3.3.2. Skin Gloss
3.3.3. Flexibility of the SC
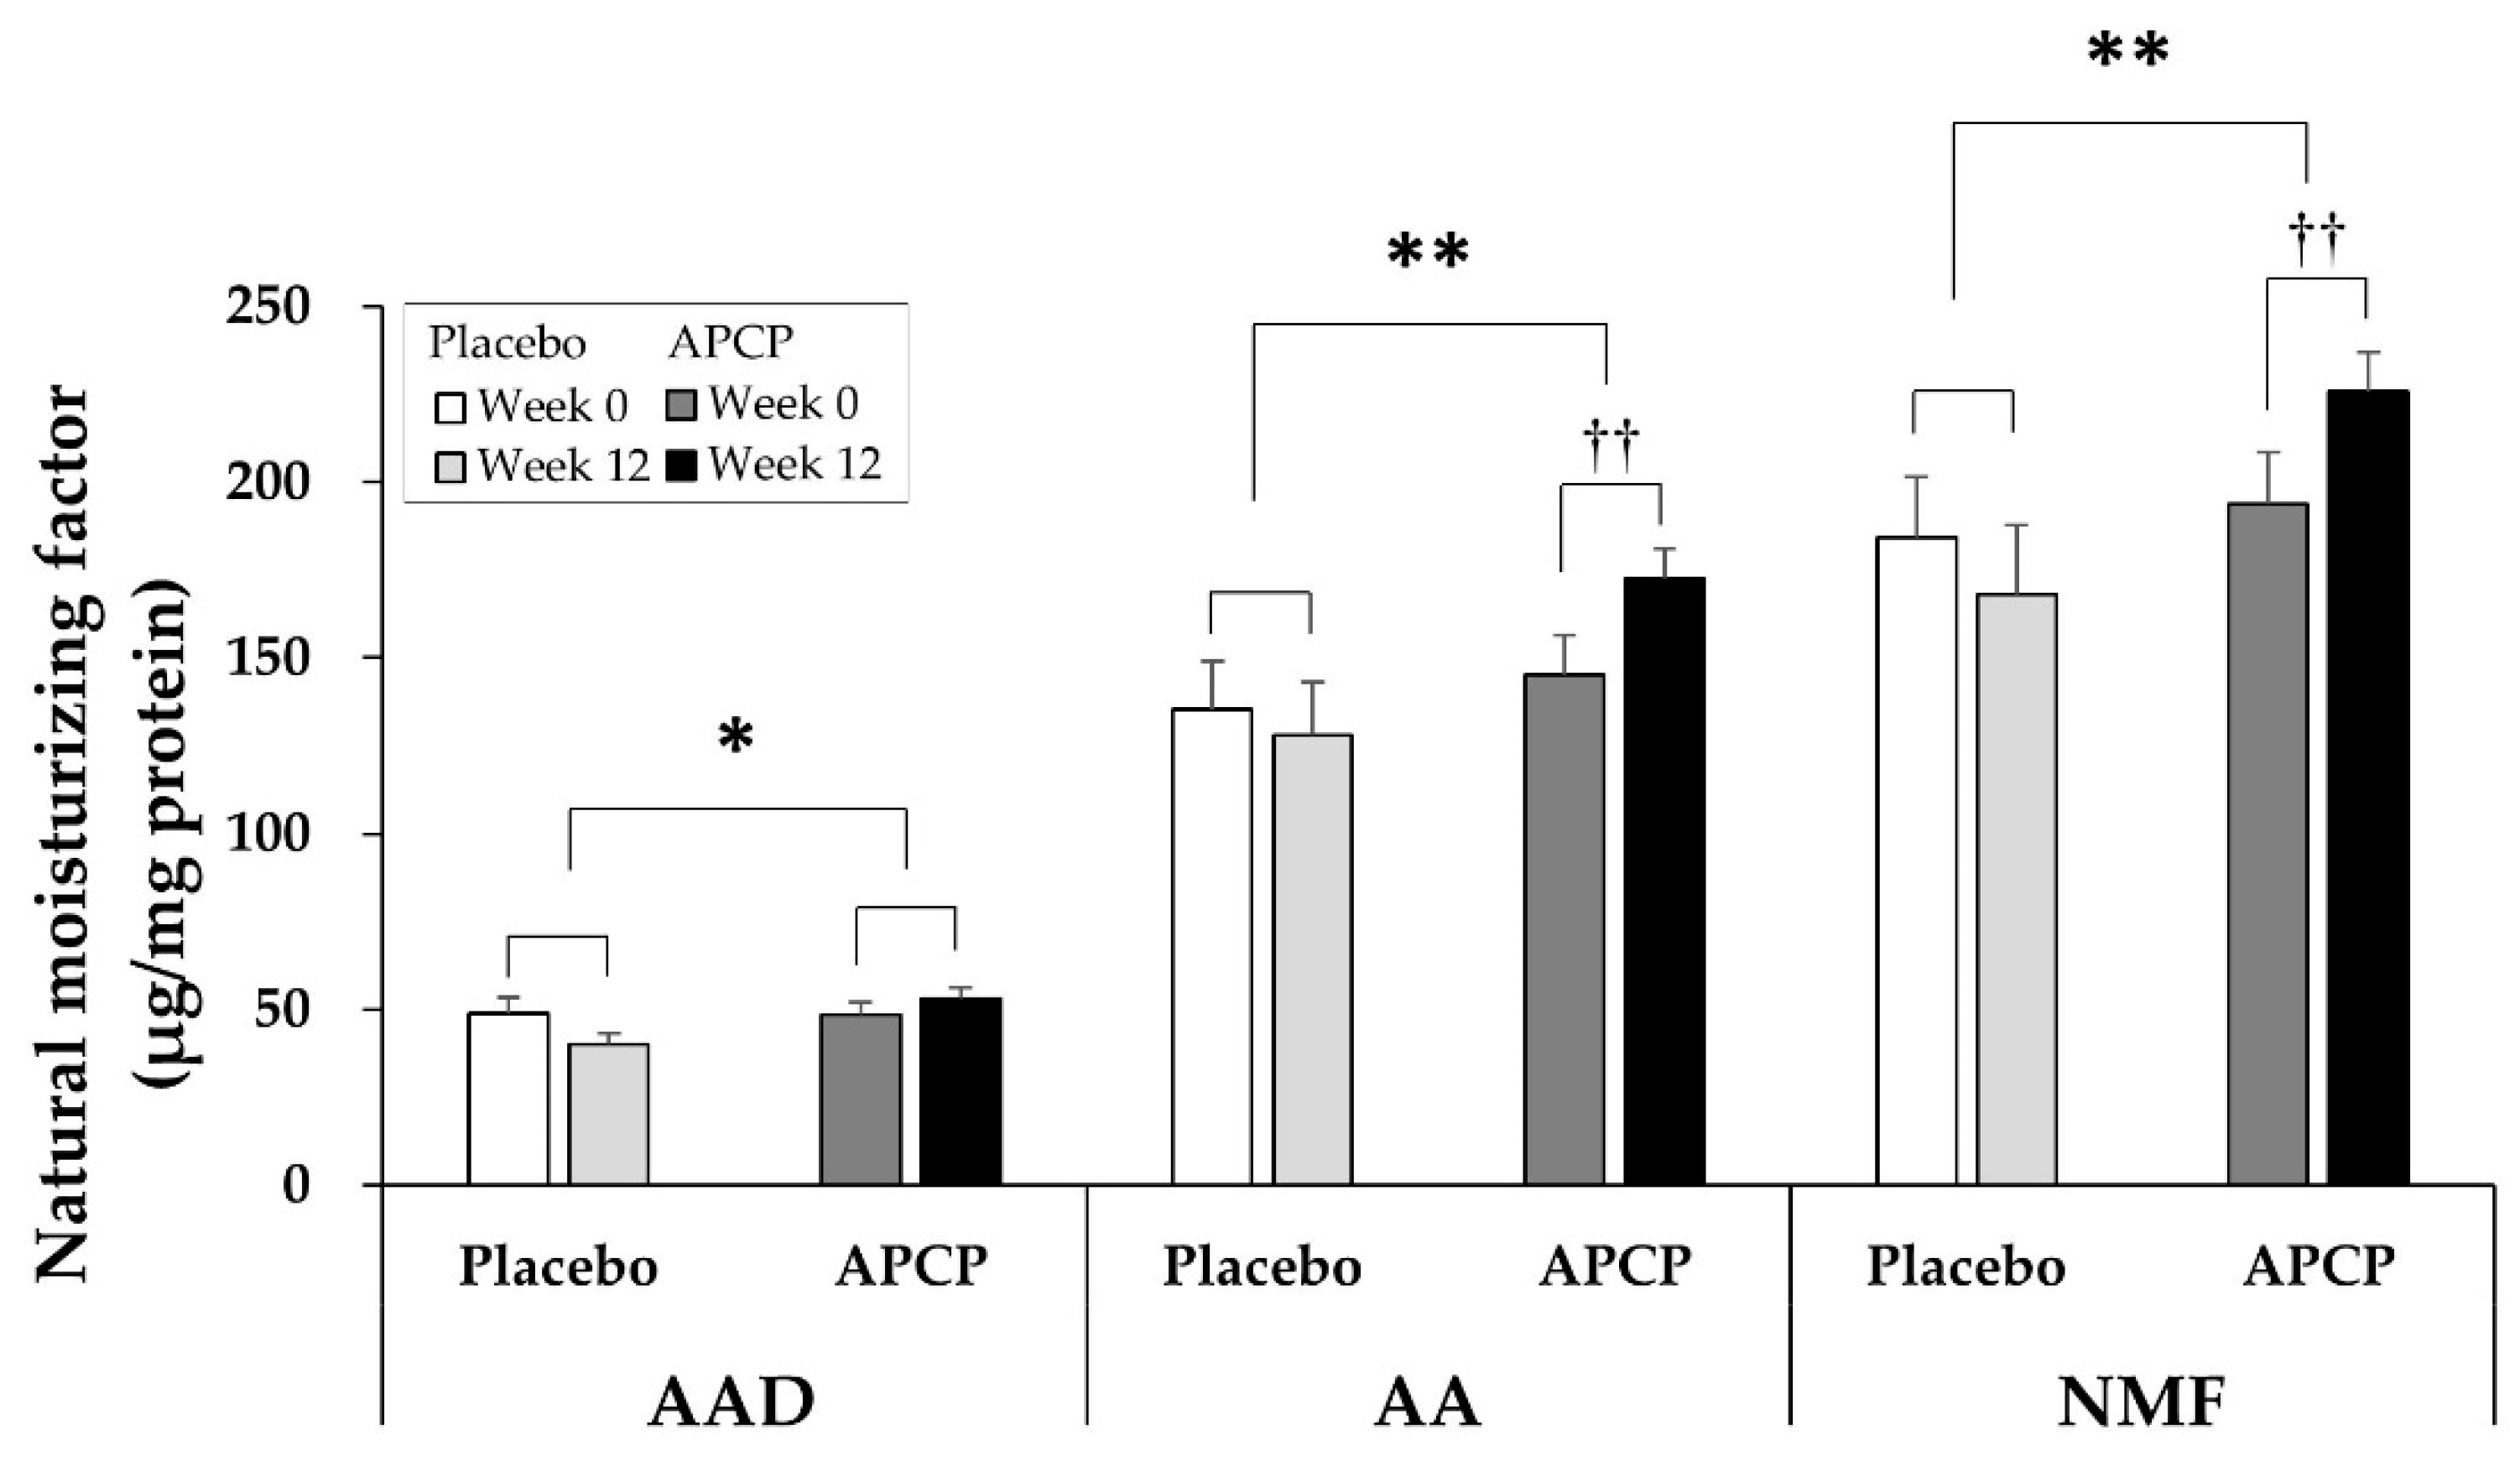
3.4. NMF
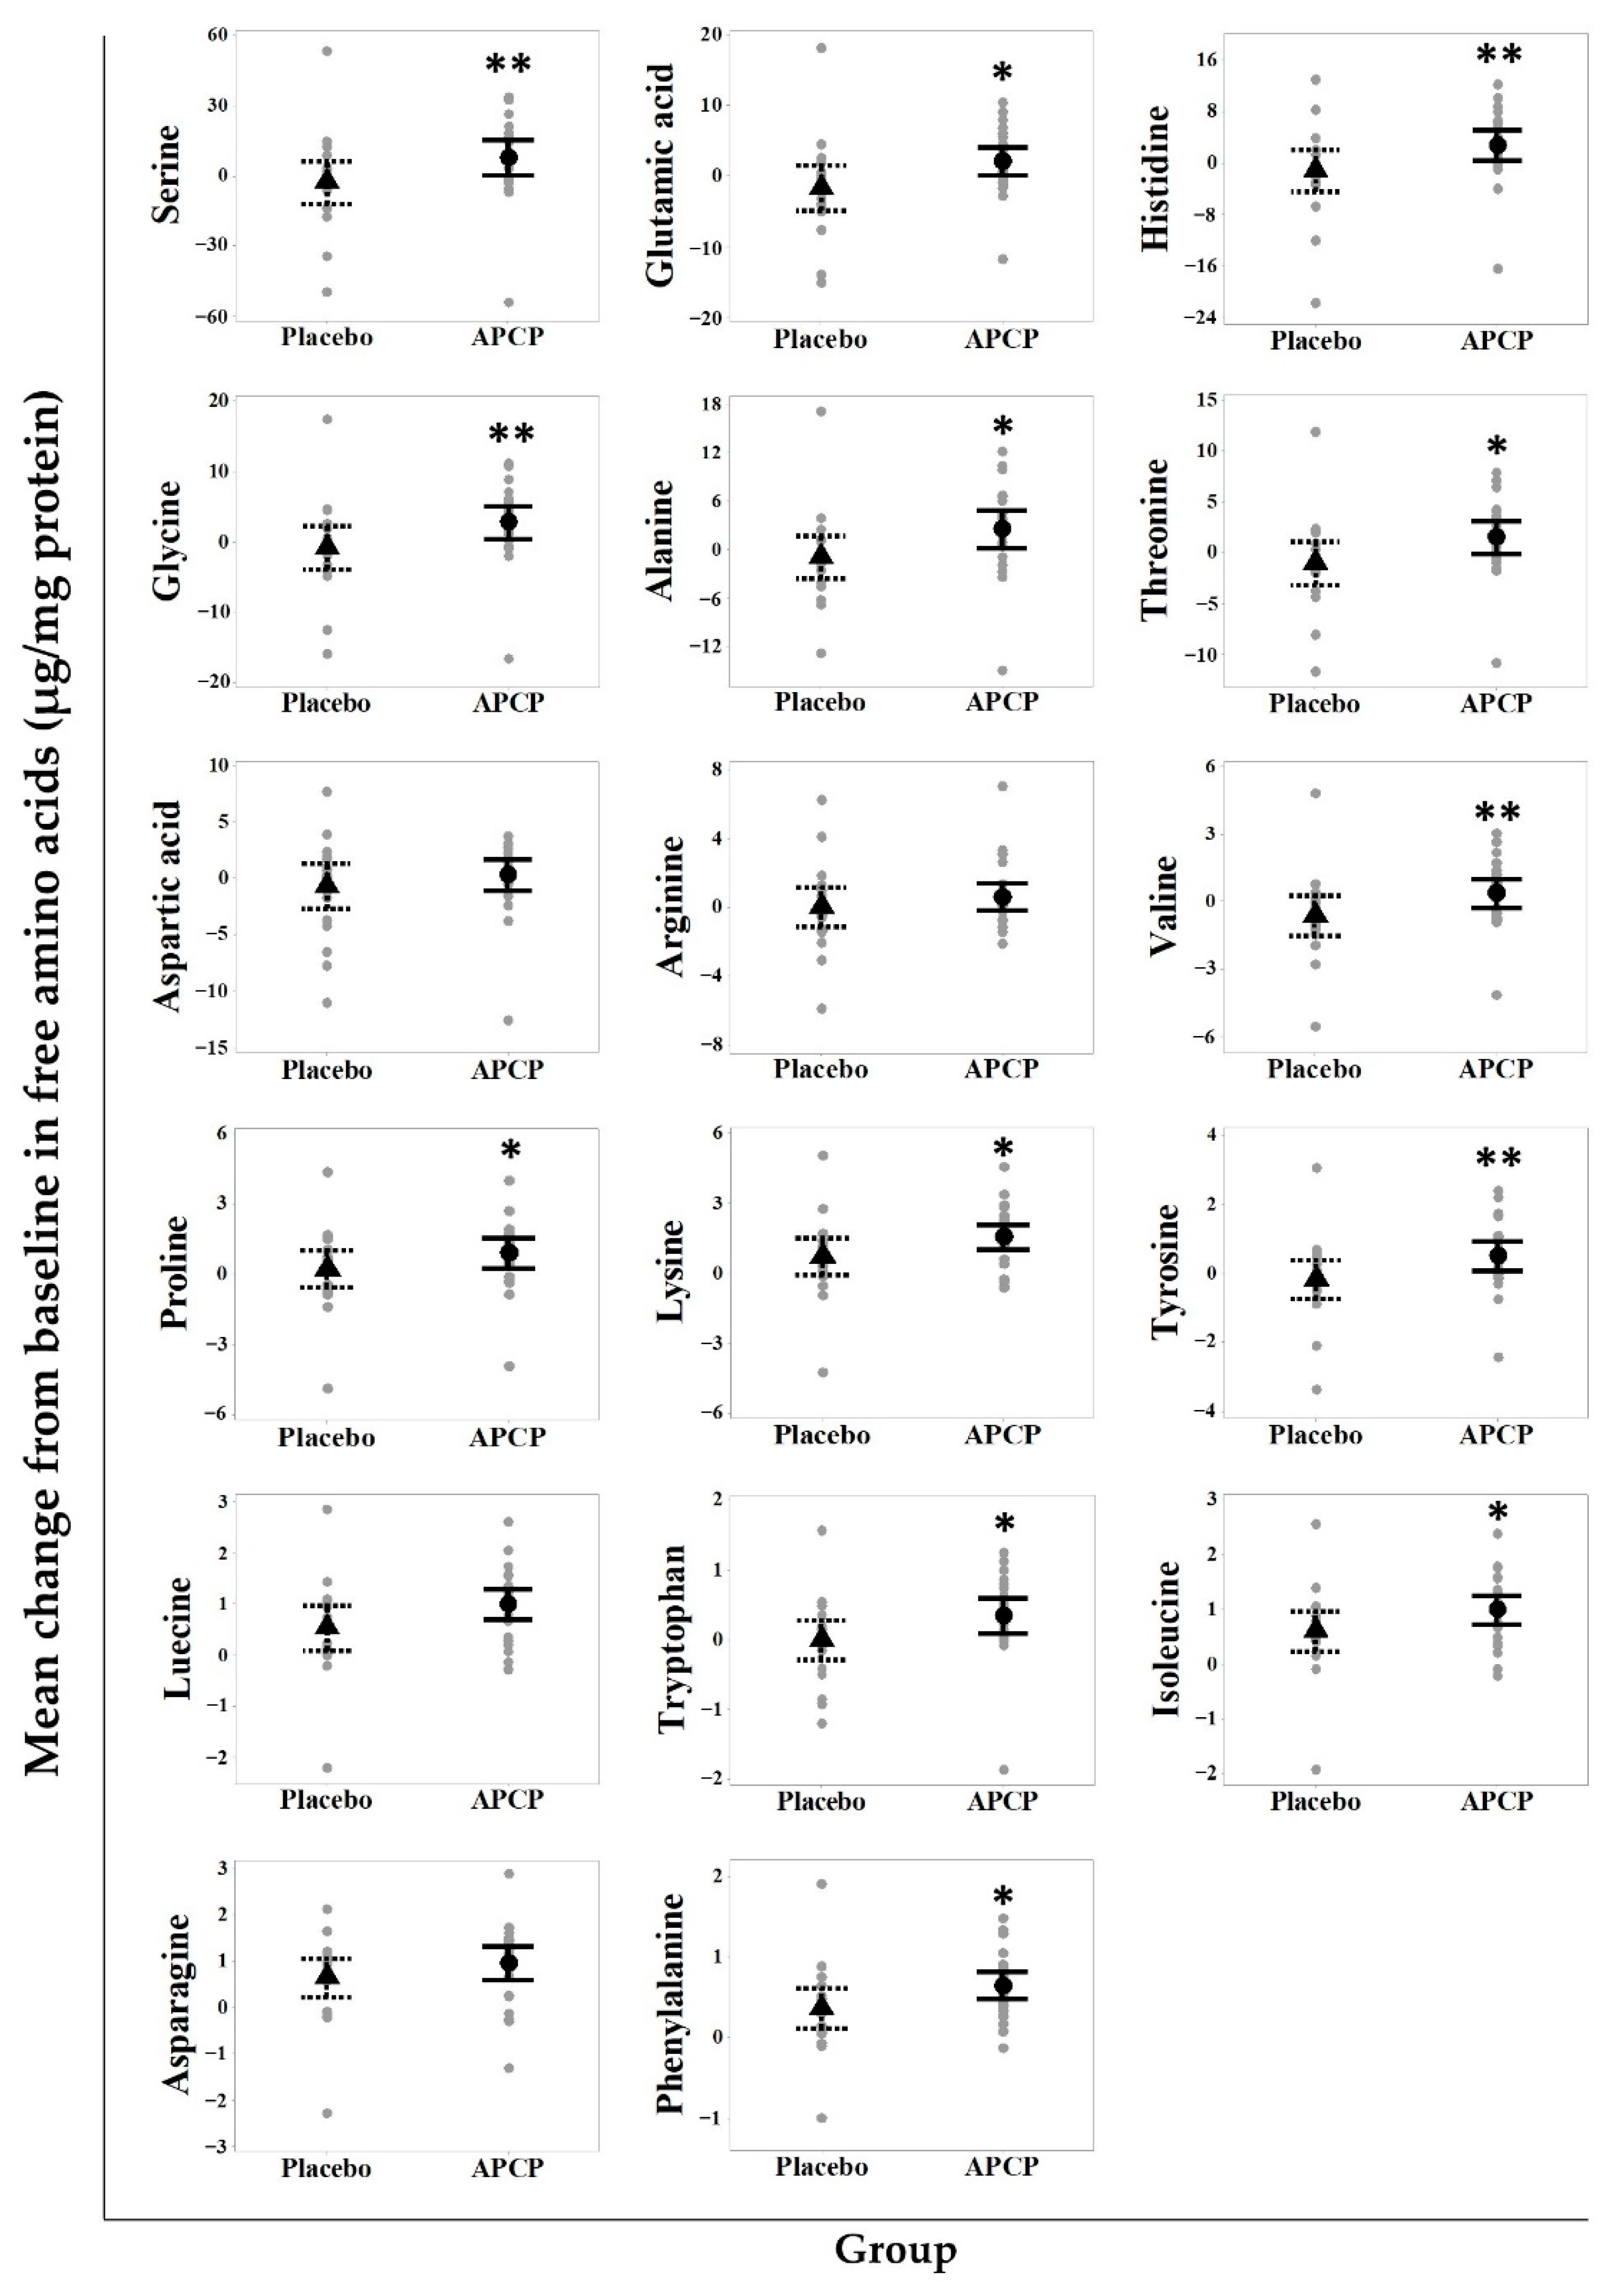
3.4.1. AAs
3.4.2. AADs
3.4.3. NMF
3.5. Ceramides
4. Discussion
5. Conclusions
Author Contributions
Funding
Institutional Review Board Statement
Informed Consent Statement
Data Availability Statement
Conflicts of Interest
References
- Elias, P.M. Epidermal lipids, barrier function and desquamation. J. Investig. Derm. 1983, 80, 44s–49s. [Google Scholar] [CrossRef]
- Norlén, L. Stratum corneum keratin structure, function and formation–a comprehensive review. Int. J. Cosmet. Sci. 2006, 28, 397–425. [Google Scholar] [CrossRef] [PubMed]
- Tabachnick, J.; Labadie, J.H. Studies on the biochemistry of epidermis. IV. The free amino acids, ammonia, urea and pyrrolidone carboxylic acid content of conventional and germ free albino guinea pig epidermis. J. Investig. Derm. 1970, 54, 24–31. [Google Scholar] [CrossRef][Green Version]
- Scott, I.R.; Harding, C.R. Filaggrin breakdown to water binding compounds during development of the rat stratum corneum is controlled by the water activity of the environment. Dev. Biol. 1986, 115, 84–92. [Google Scholar] [CrossRef]
- Clive, R.H.; Anthony, V.R. Dry Skin and Moisturizers, 2nd ed.; CRC Press: Boca Raton, FL, USA, 2013; pp. 187–209. [Google Scholar]
- Bouwstra, J.A.; Dubbelaar, F.E.; Gooris, G.S.; Weerheim, A.M.; Ponec, M. The role of ceramide composition in the lipid organisation of the skinbarrier. Biochim. Biophys. Acta. 1999, 1419, 127–136. [Google Scholar] [CrossRef]
- Holleran, W.M.; Takagi, Y.; Uchida, Y. Epidermal sphingolipids: Metabolism, function, and roles in skin disorders. FEBS Lett. 2006, 580, 5456–5466. [Google Scholar] [CrossRef]
- Horii, I.; Nakayama, Y.; Obata, M.; Tagami, H. Stratum corneum hydration and amino acid content in xerotic skin. Br. J. Derm. 1989, 121, 587–592. [Google Scholar] [CrossRef]
- Mozukoshi, K. Effects of lactic acid on the flexibility of the stratum corneum. Skin Res. Technol. 2020, 26, 599–607. [Google Scholar] [CrossRef]
- Gilchrest, B.A. A review of skin ageing and its medical therapy. Br. J. Derm. 1996, 135, 867–875. [Google Scholar] [CrossRef] [PubMed]
- Imokawa, G.; Abe, A.; Jin, K.; Higaki, Y.; Kawashima, M.; Hidano, A. Decreased level of ceramides in stratum corneum of atopic dermatitis: An etiologic factor in atopic dry skin. J. Investig. Derm. 1991, 96, 523–526. [Google Scholar] [CrossRef]
- Rerknimitr, P.; Otsuka, A.; Nakashima, C.; Kabashima, K. Skin Barrier Function and Atopic Dermatitis. Curr. Derm. Rep. 2018, 7, 209–220. [Google Scholar] [CrossRef]
- Montero-Vilchez, T.; Segura-Fernández-Nogueras, M.-V.; Pérez-Rodríguez, I.; Soler-Gongora, M.; Martinez-Lopez, A.; Fernández-González, A.; Molina-Leyva, A.; Arias-Santiago, S. Skin Barrier Function in Psoriasis and Atopic Dermatitis: Transepidermal Water Loss and Temperature as Useful Tools to Assess Disease Severity. J. Clin. Med. 2021, 10, 359. [Google Scholar] [CrossRef]
- Rogers, J.; Harding, C.; Mayo, A.; Banks, J.; Rawlings, A. Stratum corneum lipids: The effect of ageing and the seasons. Arch. Derm. Res. 1996, 288, 765–770. [Google Scholar] [CrossRef]
- Bissonnette, R.; Maari, C.; Provost, N.; Bolduc, C.; Nigen, S.; Rougier, A.; Seite, S. A double-blind study of tolerance and efficacy of a new urea-containing moisturizer in patients with atopic dermatitis. J. Cosmet. Derm. 2010, 9, 16–21. [Google Scholar] [CrossRef] [PubMed]
- Wiren, K.; Nohlgard, C.; Nyberg, F.; Holm, L.; Svensson, M.; Johannesson, A.; Wallberg, P.; Berne, B.; Edlund, F.; Lodén, M. Treatment with a barrier-strengthening moisturizing cream delays relapse of atopic dermatitis: A prospective and randomized controlled clinical trial. J. Eur. Acad. Derm. Venereol. 2009, 23, 1267–1272. [Google Scholar] [CrossRef]
- Danby, S.G.; Brown, K.; Higgs-Bayliss, T.; Chittock, J.; Albenali, L.; Cork, M.J. The Effect of an Emollient Containing Urea, Ceramide NP, and Lactate on Skin Barrier Structure and Function in Older People with Dry Skin. Skin Pharm. Physiol. 2016, 29, 135–147. [Google Scholar] [CrossRef]
- Aguirre-Cruz, G.; León-López, A.; Cruz-Gómez, V.; Jiménez-Alvarado, R.; Aguirre-Álvarez, G. Collagen Hydrolysates for Skin Protection: Oral Administration and Topical Formulation. Antioxidants 2020, 9, 181. [Google Scholar] [CrossRef]
- Kim, D.U.; Chung, H.C.; Choi, J.; Sakai, Y.; Lee, B.Y. Oral Intake of Low-Molecular-Weight Collagen Peptide Improves Hydration, Elasticity, and Wrinkling in Human Skin: A Randomized, Double-Blind, Placebo-Controlled Study. Nutrients 2018, 10, 826. [Google Scholar] [CrossRef]
- Bolke, L.; Schlippe, G.; Gerß, J.; Voss, W. A Collagen Supplement Improves Skin Hydration, Elasticity, Roughness, and Density: Results of a Randomized, Placebo-Controlled, Blind Study. Nutrients 2019, 11, 2494. [Google Scholar] [CrossRef]
- Tak, Y.J.; Shin, D.K.; Kim, A.H.; Kim, J.I.; Lee, Y.L.; Ko, H.C.; Kim, Y.W.; Lee, S.Y. Effect of Collagen Tripeptide and Adjusting for Climate Change on Skin Hydration in Middle-Aged Women: A Randomized, Double-Blind, Placebo-Controlled Trial. Front. Med. 2021, 7, 608903. [Google Scholar] [CrossRef]
- Silva, T.H.; Moreira-Silva, J.; Marques, A.L.; Domingues, A.; Bayon, Y.; Reis, R.L. Marine origin collagens and its potential applications. Mar. Drugs 2014, 12, 5881–5901. [Google Scholar] [CrossRef]
- El-Domyati, M.; Attia, S.; Saleh, F.; Brown, D.; Birk, D.E.; Gasparro, F.; Ahmad, H.; Uitto, J. Intrinsic aging vs. photoaging: A comparative histopathological, immunohistochemical, and ultrastructural study of skin. Exp. Derm. 2002, 11, 398–405. [Google Scholar] [CrossRef]
- McCabe, M.C.; Hill, R.C.; Calderone, K.; Cui, Y.; Yan, Y.; Quan, T.; Fisher, G.J.; Hansen, K.C. Alterations in extracellular matrix composition during aging and photoaging of the skin. Matrix Biol. Plus 2020, 8, 100041. [Google Scholar] [CrossRef] [PubMed]
- Iwai, K.; Hasegawa, T.; Taguchi, Y.; Morimatsu, F.; Sato, K.; Nakamura, Y.; Higashi, A.; Kido, Y.; Nakabo, Y.; Ohtsuki, K. Identification of food-derived collagen peptides in human blood after oral ingestion of gelatin hydrolysates. J. Agric. Food Chem. 2005, 53, 6531–6536. [Google Scholar] [CrossRef]
- Ohara, H.; Ichikawa, S.; Matsumoto, H.; Akiyama, M.; Fujimoto, N.; Kobayashi, T.; Tajima, S. Collagen-derived dipeptide, proline-hydroxyproline, stimulates cell proliferation and hyaluronic acid synthesis in cultured human dermal fibroblasts. J. Derm. 2010, 37, 330–338. [Google Scholar] [CrossRef]
- Daniel, H. Molecular and integrative physiology of intestinal peptide transport. Annu. Rev. Physiol. 2004, 66, 361–384. [Google Scholar] [CrossRef]
- Oesser, S.; Adam, M.; Babel, W.; Seifert, J. Oral administration of (14)C labeled gelatin hydrolysate leads to an accumulation of radioactivity in cartilage of mice (C57/BL). J. Nutr. 1999, 129, 1891–1895. [Google Scholar] [CrossRef]
- Postlethwaite, A.E.; Seyer, J.M.; Kang, A.H. Chemotactic attraction of human fibroblasts to type I, II, and III collagens and collagen-derived peptides. Proc. Natl. Acad. Sci. USA 1978, 75, 871–875. [Google Scholar] [CrossRef]
- Shimizu, J.; Asami, N.; Kataoka, A.; Sugihara, F.; Inoue, N.; Kimira, Y.; Wada, M.; Mano, H. Oral collagen-derived dipeptides, prolyl-hydroxyproline and hydroxyprolyl-glycine, ameliorate skin barrier dysfunction and alter gene expression profiles in the skin. Biochem. Biophys. Res. Commun. 2015, 456, 626–630. [Google Scholar] [CrossRef]
- Zague, V.; de Freitas, V.; da Costa Rosa, M.; de Castro, G.A.; Jaeger, R.G.; Machado-Santelli, G.M. Collagen Hydrolysate Intake Increases Skin Collagen Expression and Suppresses Matrix Metalloproteinase 2 Activity. J. Med. Food. 2011, 14, 618–624. [Google Scholar] [CrossRef]
- Shigemura, Y.; Iwai, K.; Morimatsu, F.; Iwamoto, T.; Mori, T.; Oda, C.; Taira, T.; Park, E.Y.; Nakamura, Y.; Sato, K. Effect of prolyl-hydroxyproline (Pro-Hyp), a food-derived collagen peptide in human blood, on growth of fibroblasts from mouse skin. J. Agric. Food Chem. 2009, 57, 444–449. [Google Scholar] [CrossRef]
- Matsuda, N.; Koyama, Y.; Hosaka, Y.; Ueda, H.; Watanabe, T.; Araya, T.; Irie, S.; Takehana, K. Effects of ingestion of collagen peptide on collagen fibrils and glycosaminoglycans in the dermis. J. Nutr. Sci. Vitam. 2006, 52, 211–215. [Google Scholar] [CrossRef]
- Murata, Y.; Ogata, J.; Higaki, Y.; Kawashima, M.; Yada, Y.; Higuchi, K.; Tsuchiya, T.; Kawainami, S.; Imokawa, G. Abnormal expression of sphingomyelin acylase in atopic dermatitis: An etiologic factor for ceramide deficiency? J. Investig. Derm. 1996, 106, 1242–1249. [Google Scholar] [CrossRef]
- Zhuang, Y.; Hou, H.; Zhao, X.; Zhang, Z.; Li, B. Effects of collagen and collagen hydrolysate from jellyfish (Rhopilema esculentum) on mice skin photoaging induced by UV irradiation. J. Food Sci. 2009, 74, H183–H188. [Google Scholar] [CrossRef] [PubMed]
- Maeda, K. Skin moisturizing effect of collagen peptides taking orally. J. Nutr. Food Sci. 2018, 8, 2. [Google Scholar] [CrossRef]
- Kang, M.C.; Yumnam, S.; Kim, S.Y. Oral Intake of Collagen Peptide Attenuates Ultraviolet B Irradiation-Induced Skin Dehydration in Vivo by Regulating Hyaluronic Acid Synthesis. Int. J. Mol. Sci. 2018, 19, 3551. [Google Scholar] [CrossRef]
- Scott, I.R.; Harding, C.R.; Barrett, J.G. Histidine-rich protein of the keratohyalin granules. Source of the free amino acids, urocanic acid and pyrrolidone carboxylic acid in the stratum corneum. Biochim. Biophys. Acta. 1982, 719, 110–117. [Google Scholar] [CrossRef]
- Kubilus, J.; Scott, I.; Harding, C.R.; Yendle, J.; Kvedar, J.; Baden, H.P. The occurrence of profilaggrin and its processing in cultured keratinocytes. J. Investig. Derm. 1985, 85, 513–517. [Google Scholar] [CrossRef]
- Masae, T.; Tadashi, T. The content of free amino acids in the stratum corneum is increased in senile xerosis. Arch. Derm. Res. 2004, 295, 448–452. [Google Scholar]
- Chung, J.H.; Lee, S.H.; Youn, C.S.; Park, B.J.; Kim, K.H.; Park, K.C.; Cho, K.H.; Eun, H.C. Cutaneous photodamage in Koreans: Influence of sex, sun exposure, smoking, and skin color. Arch. Derm. 2001, 137, 1043–1051. [Google Scholar]
- Joo, K.M.; Han, J.Y.; Son, E.D.; Nam, G.W.; Chung, H.Y.; Jeong, H.J.; Cho, J.C.; Lim, K.M. Rapid, simultaneous and nanomolar determination of pyroglutamic acid and cis-/trans-urocanic acid in human stratum corneum by hydrophilic interaction liquid chromatography (HILIC)–electrospray ionization tandem mass spectrometry. J. Chromatogr. B Anal. Technol. Biomed. Life Sci. 2012, 897, 55–63. [Google Scholar] [CrossRef]
- Joo, K.M.; Kim, A.R.; Kim, S.N.; Kim, B.M.; Lee, H.K.; Bae, S.J.; Lim, K.M. Metabolomic analysis of amino acids and lipids in human hair altered by dyeing, perming and bleaching. Exp. Derm. 2016, 25, 729–731. [Google Scholar] [CrossRef] [PubMed]
- Eastoe, J.E. The amino acid composition of fish collagen and gelatin. Biochem. J. 1957, 65, 363–368. [Google Scholar] [CrossRef]
- Rawlings, A.V.; Harding, C.R. Moisturization and skin barrier function. Derm. Ther. 2004, 17 (Suppl. 1), 43–48. [Google Scholar] [CrossRef]
- Gibbs, N.K.; Norval, M. Urocanic Acid in the Skin: A Mixed Blessing? J. Investig. Derm. 2011, 131, 14–17. [Google Scholar] [CrossRef]
- Senshu, T.; Akiyama, K.; Kan, S.; Asaga, H.; Ishigami, A.; Manabe, M. Detection of deiminated proteins in rat skin: Probing with a monospecific antibody after modification of citrulline residues. J. Investig. Derm. 1995, 105, 163–169. [Google Scholar] [CrossRef] [PubMed]
- Miyanaga, M.; Uchiyama, T.; Motoyama, A.; Ochiai, N.; Ueda, O.; Ogo, M. Oral Supplementation of Collagen Peptides Improves Skin Hydration by Increasing the Natural Moisturizing Factor Content in the Stratum Corneum: A Randomized, Double-Blind, Placebo-Controlled Clinical Trial. Skin Pharm. Physiol. 2021, 34, 115–127. [Google Scholar] [CrossRef]
- Motta, S.; Monti, M.; Sesana, S.; Caputo, R.; Carelli, S.; Ghidoni, R. Ceramide composition of the psoriatic scale. Biochim. Biophys. Acta. 1993, 1182, 147–151. [Google Scholar] [CrossRef]
- Matsumoto, M.; Umemoto, N.; Sugiura, H.; Uehara, M. Difference in ceramide composition between “dry” and “normal” skin in patients with atopic dermatitis. Acta. Derm. Venereol. 1999, 79, 246–247. [Google Scholar] [CrossRef]
- Pilgram, G.S.; Vissers, D.C.; van der Meulen, H.; Pavel, S.; Lavrijsen, S.P.; Bouwstra, J.A.; Koerten, H.K. Aberrant lipid organization in stratum corneum of patients with atopic dermatitis and lamellar ichthyosis. J. Investig. Derm. 2001, 117, 710–717. [Google Scholar] [CrossRef] [PubMed]
- Ishikawa, J.; Narita, H.; Kondo, N.; Hotta, M.; Takagi, Y.; Masukawa, Y.; Kitahara, T.; Takema, Y.; Koyano, S.; Yamazaki, S.; et al. Changes in the ceramide profile of atopic dermatitis patients. J. Investig. Derm. 2010, 130, 2511–2514. [Google Scholar] [CrossRef]
- Ishikawa, J.; Shimotoyodome, Y.; Ito, S.; Miyauchi, Y.; Fujimura, T.; Kitahara, T.; Hase, T. Variations in the ceramide profile in different seasons and regions of the body contribute to stratum corneum functions. Arch. Derm. Res. 2013, 305, 151–162. [Google Scholar] [CrossRef] [PubMed]
- Ito, S.; Ishikawa, J.; Naoe, A.; Yoshida, H.; Hachiya, A.; Fujimura, T.; Kitahara, T.; Takema, Y. Ceramide synthase 4 is highly expressed in involved skin of patients with atopic dermatitis. J. Eur. Acad. Derm. Venereol. 2017, 31, 135–141. [Google Scholar] [CrossRef]
- Yokose, U.; Ishikawa, J.; Morokuma, Y.; Naoe, A.; Inoue, Y.; Yasuda, Y.; Tsujimura, H.; Fujimura, T.; Murase, T.; Hatamochi, A. The ceramide [NP]/[NS] ratio in the stratum corneum is a potential marker for skin properties and epidermal differentiation. BMC Derm. 2020, 20, 6. [Google Scholar] [CrossRef] [PubMed]
- Kim, J.K.; Lee, J.H.; Bae, I.H.; Seo, D.B.; Lee, S.J. Beneficial effect of a collagen peptide supplement on the epidermal skin barrier. Korean J. Food Sci. Technol. 2011, 43, 458–463. [Google Scholar] [CrossRef]


| Placebo (N = 25) | APCP (N = 25) | p | |
|---|---|---|---|
| Sex–Female (%) | 14 (56.00%) | 14 (56.00%) | 1.000 2 |
| Male (%) | 11 (44.00%) | 11 (44.00%) | |
| Age (years) | 47.80 ± 5.82 1 | 48.40 ± 5.41 | 0.708 3 |
| BMI 4 (kg/m2) | 24.08 ± 2.99 | 24.09 ± 4.07 | 0.994 3 |
| Skin moisture (%) | 39.45 ± 6.64 | 39.49 ± 5.37 | 0.981 3 |
| TEWL 4 (g/m2h) | 8.59 ± 1.69 | 8.19 ± 1.68 | 0.408 3 |
| Skin texture (Ra) | 14.77 ± 2.62 | 15.95 ± 2.59 | 0.114 3 |
| Skin gloss (SGU) | 64.01 ± 7.47 | 64.39 ± 7.59 | 0.857 3 |
| AAD. | Week | Placebo (N = 20) | APCP (N = 24) |
|---|---|---|---|
| PCA | 0 | 25.18 ± 11.04 | 26.41 ± 10.43 |
| 12 | 20.21 ± 9.44 | 28.27 ± 8.16 | |
| change | −4.97 ± 9.43 | 1.86 ± 9.64 * | |
| trans-UCA | 0 | 8.78 ± 4.96 | 9.18 ± 3.87 |
| 12 | 7.67 ± 4.44 | 10.69 ± 3.99 | |
| change | −1.11 ± 3.54 | 1.51 ± 4.43 * | |
| cis-UCA | 0 | 0.03 ± 0.05 | 0.05 ± 0.09 |
| 12 | 0.11 ± 0.10 | 0.15 ± 0.18 | |
| change | 0.08 ± 0.10 | 0.10 ± 0.20 | |
| Citrulline | 0 | 14.86 ± 6.65 | 12.99 ± 3.91 |
| 12 | 12.04 ± 6.90 | 14.04 ± 4.51 | |
| change | −2.82 ± 6.60 | 1.05 ± 4.77 * | |
| Sum of AADs | 0 | 48.85 ± 20.04 | 48.62 ± 17.54 |
| 12 | 40.04 ± 14.71 | 53.15 ± 14.71 | |
| change | −8.74 ± 18.50 | 4.68 ± 17.78 * |
Publisher’s Note: MDPI stays neutral with regard to jurisdictional claims in published maps and institutional affiliations. |
© 2021 by the authors. Licensee MDPI, Basel, Switzerland. This article is an open access article distributed under the terms and conditions of the Creative Commons Attribution (CC BY) license (https://creativecommons.org/licenses/by/4.0/).
Share and Cite
Jung, K.; Kim, S.-H.; Joo, K.-M.; Lim, S.-H.; Shin, J.-H.; Roh, J.; Kim, E.; Park, C.W.; Kim, W. Oral Intake of Enzymatically Decomposed AP Collagen Peptides Improves Skin Moisture and Ceramide and Natural Moisturizing Factor Contents in the Stratum Corneum. Nutrients 2021, 13, 4372. https://doi.org/10.3390/nu13124372
Jung K, Kim S-H, Joo K-M, Lim S-H, Shin J-H, Roh J, Kim E, Park CW, Kim W. Oral Intake of Enzymatically Decomposed AP Collagen Peptides Improves Skin Moisture and Ceramide and Natural Moisturizing Factor Contents in the Stratum Corneum. Nutrients. 2021; 13(12):4372. https://doi.org/10.3390/nu13124372
Chicago/Turabian StyleJung, Kyoungmi, Seung-Hun Kim, Kyung-Mi Joo, Sung-Hwan Lim, Jin-Hee Shin, Jonghwa Roh, Eunjoo Kim, Chan Woong Park, and Wangi Kim. 2021. "Oral Intake of Enzymatically Decomposed AP Collagen Peptides Improves Skin Moisture and Ceramide and Natural Moisturizing Factor Contents in the Stratum Corneum" Nutrients 13, no. 12: 4372. https://doi.org/10.3390/nu13124372
APA StyleJung, K., Kim, S.-H., Joo, K.-M., Lim, S.-H., Shin, J.-H., Roh, J., Kim, E., Park, C. W., & Kim, W. (2021). Oral Intake of Enzymatically Decomposed AP Collagen Peptides Improves Skin Moisture and Ceramide and Natural Moisturizing Factor Contents in the Stratum Corneum. Nutrients, 13(12), 4372. https://doi.org/10.3390/nu13124372