
Dietary Habits and Relationship with the Presence of Main and Trace Elements, Bisphenol A, Tetrabromobisphenol A, and the Lipid, Microbiological and Immunological Profiles of Breast Milk

 ,
,  , ,
, ,  , , ,
, , ,  , and
, and
Abstract
:
1. Introduction
2. Materials and Methods
2.1. Demographic Characteristics
2.2. Food Frequency Questionnaires
2.3. Milk Sampling
2.4. Bacteriological Analyses of Milk Samples
2.5. DNA Extraction from Milk Samples and PCR Amplification and Sequencing
2.6. Immunological Analysis of Milk Samples
2.7. Main and Trace Elements, BPA, TBBPA and FAs Analysis of Milk Samples
2.8. Statistical Analysis
3. Results
3.1. Microbiological, Immunological, Lipid, Main and Trace Elements, BPA, and TBBPA Contents in Milk Samples
3.1.1. Microbial Profile of Milk Samples
3.1.2. Immunological Profile of Milk Samples
3.1.3. Lipid, Main and Trace Elements, BPA and TBBPA in Milk Samples
3.2. Dietary Habits of the Participant Women
3.2.1. Variation of the Milk Bacterial Profile with the Women’s Dietary Habits
3.2.2. Variation of the Milk Immunological Profile with the Women’s Dietary Habits
3.2.3. Variation of the Milk Main and Trace Elements Content, Fatty Acids Profile, and BPA and TBBPA Content in Milk with the Women’s Dietary Habits
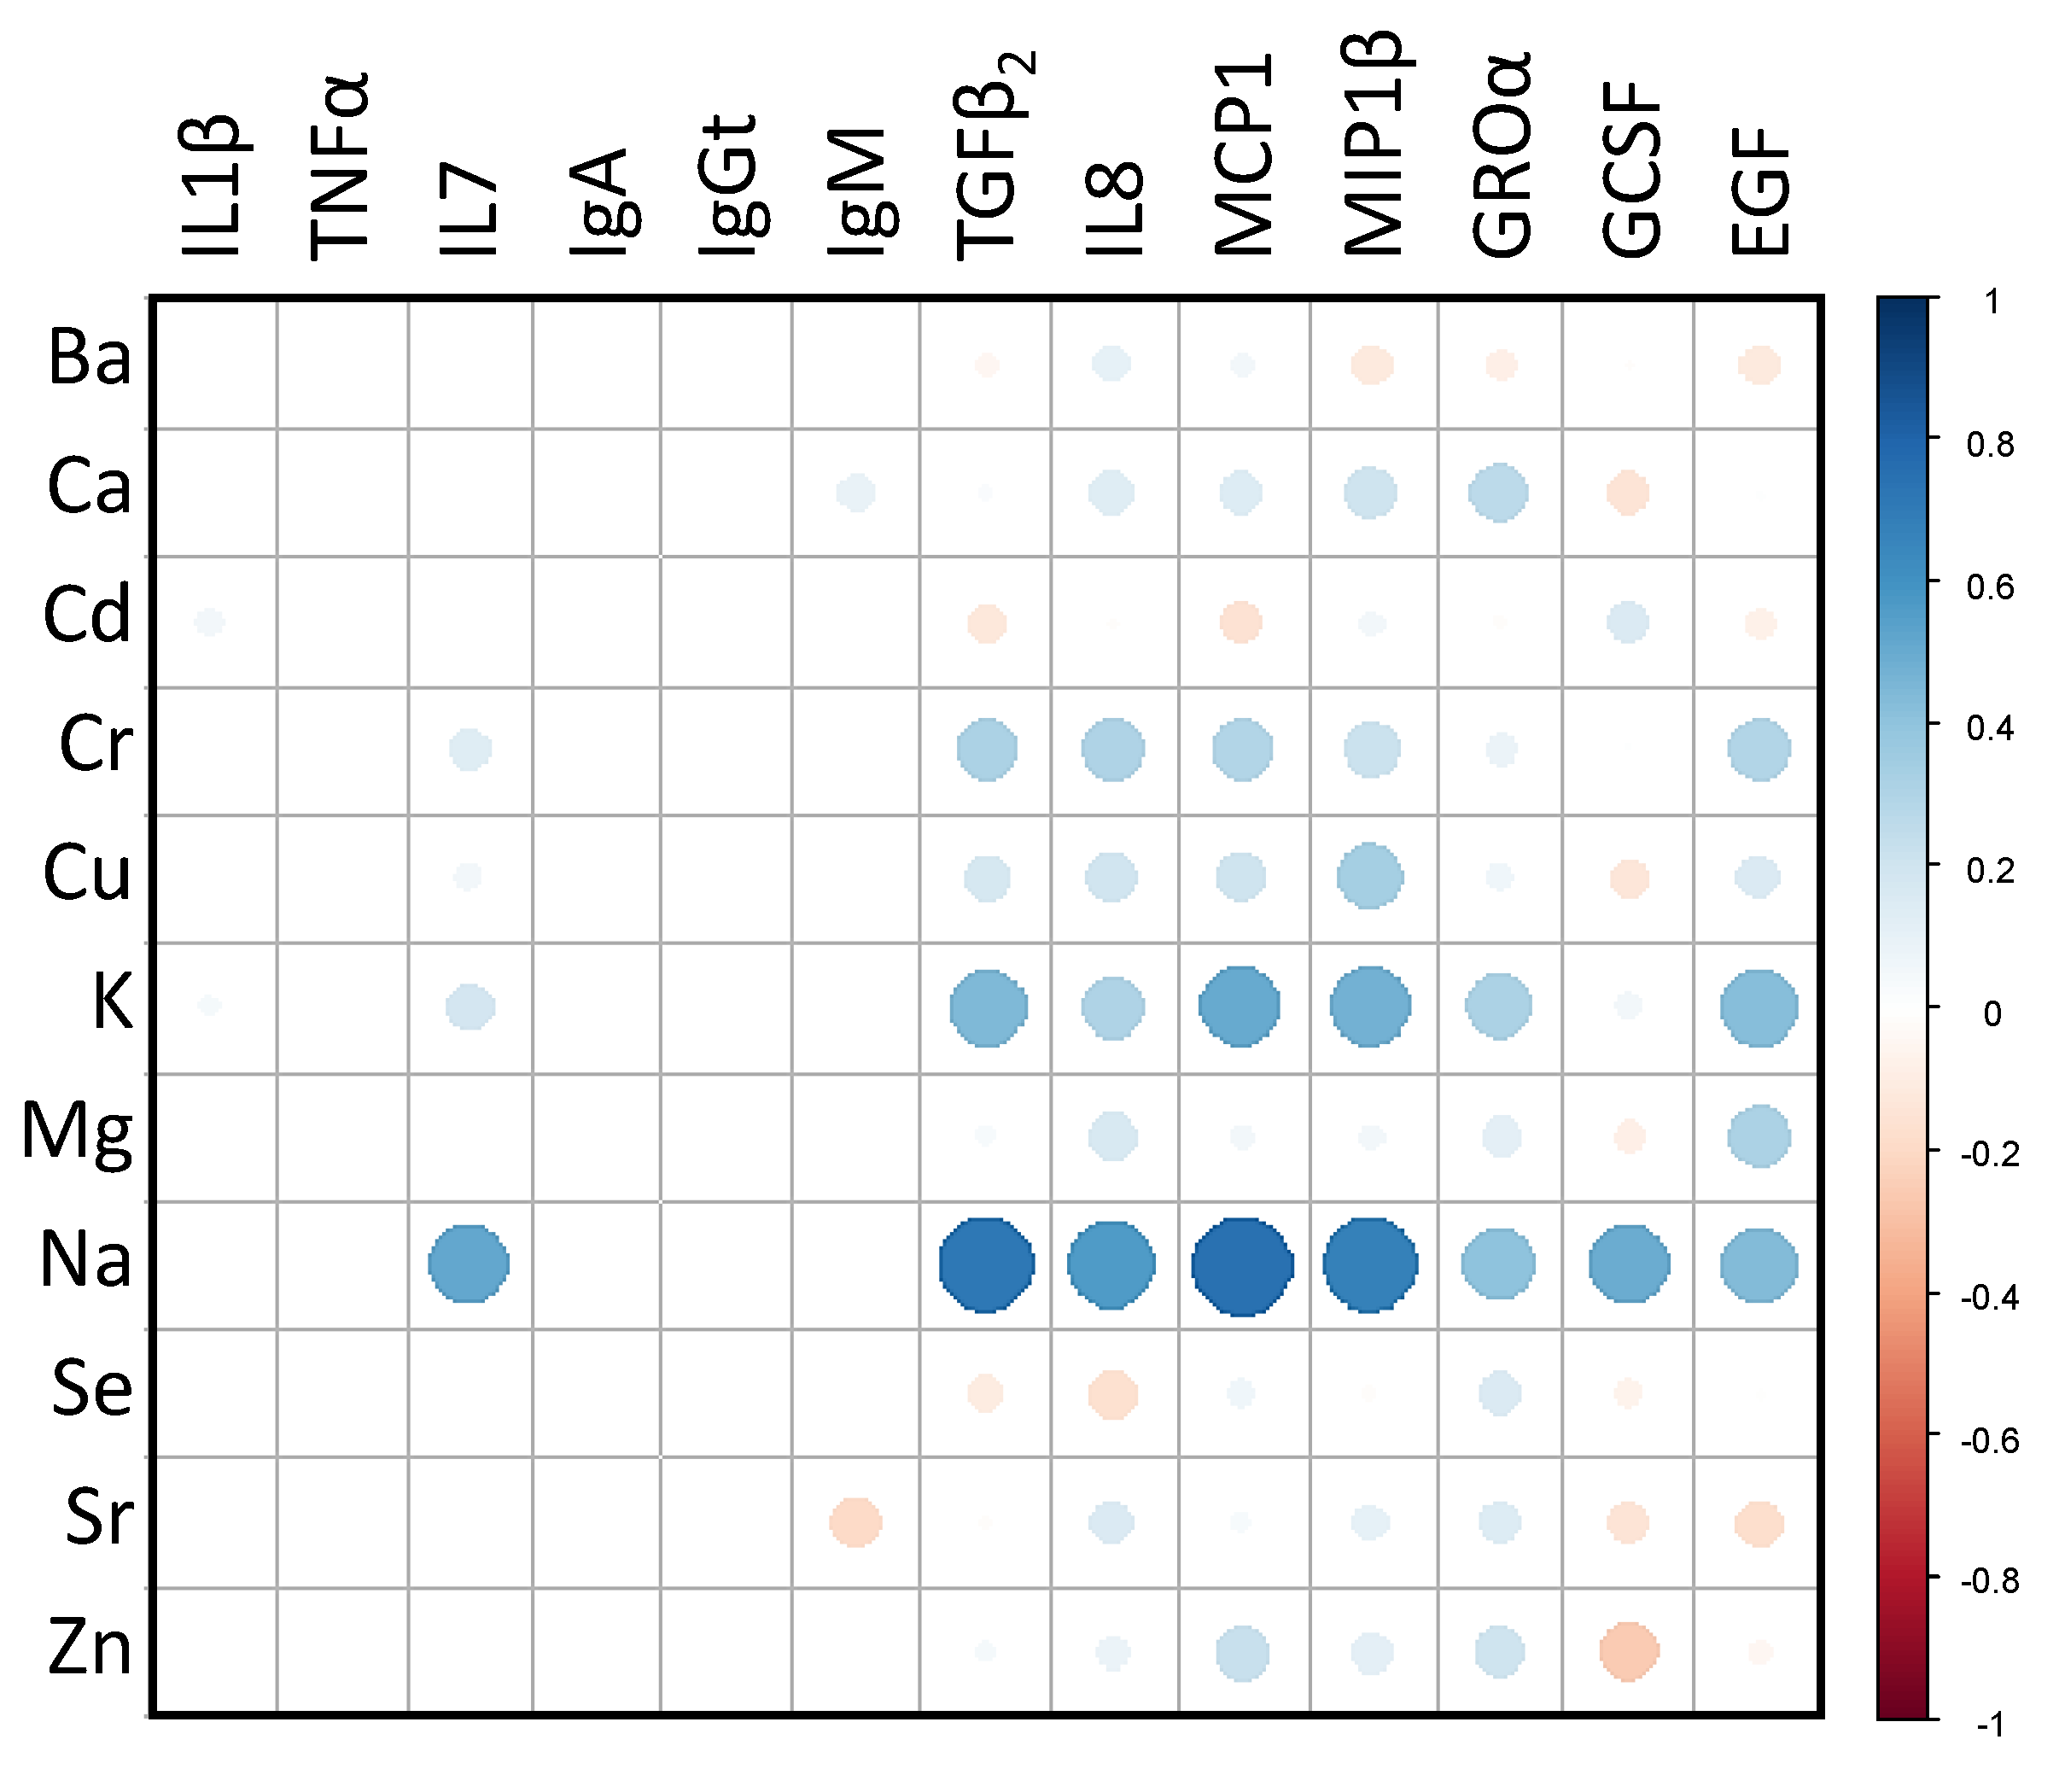
3.3. Relationships between the Main and Trace Elements Content and the Microbiological and Immunological Profiles of Milk
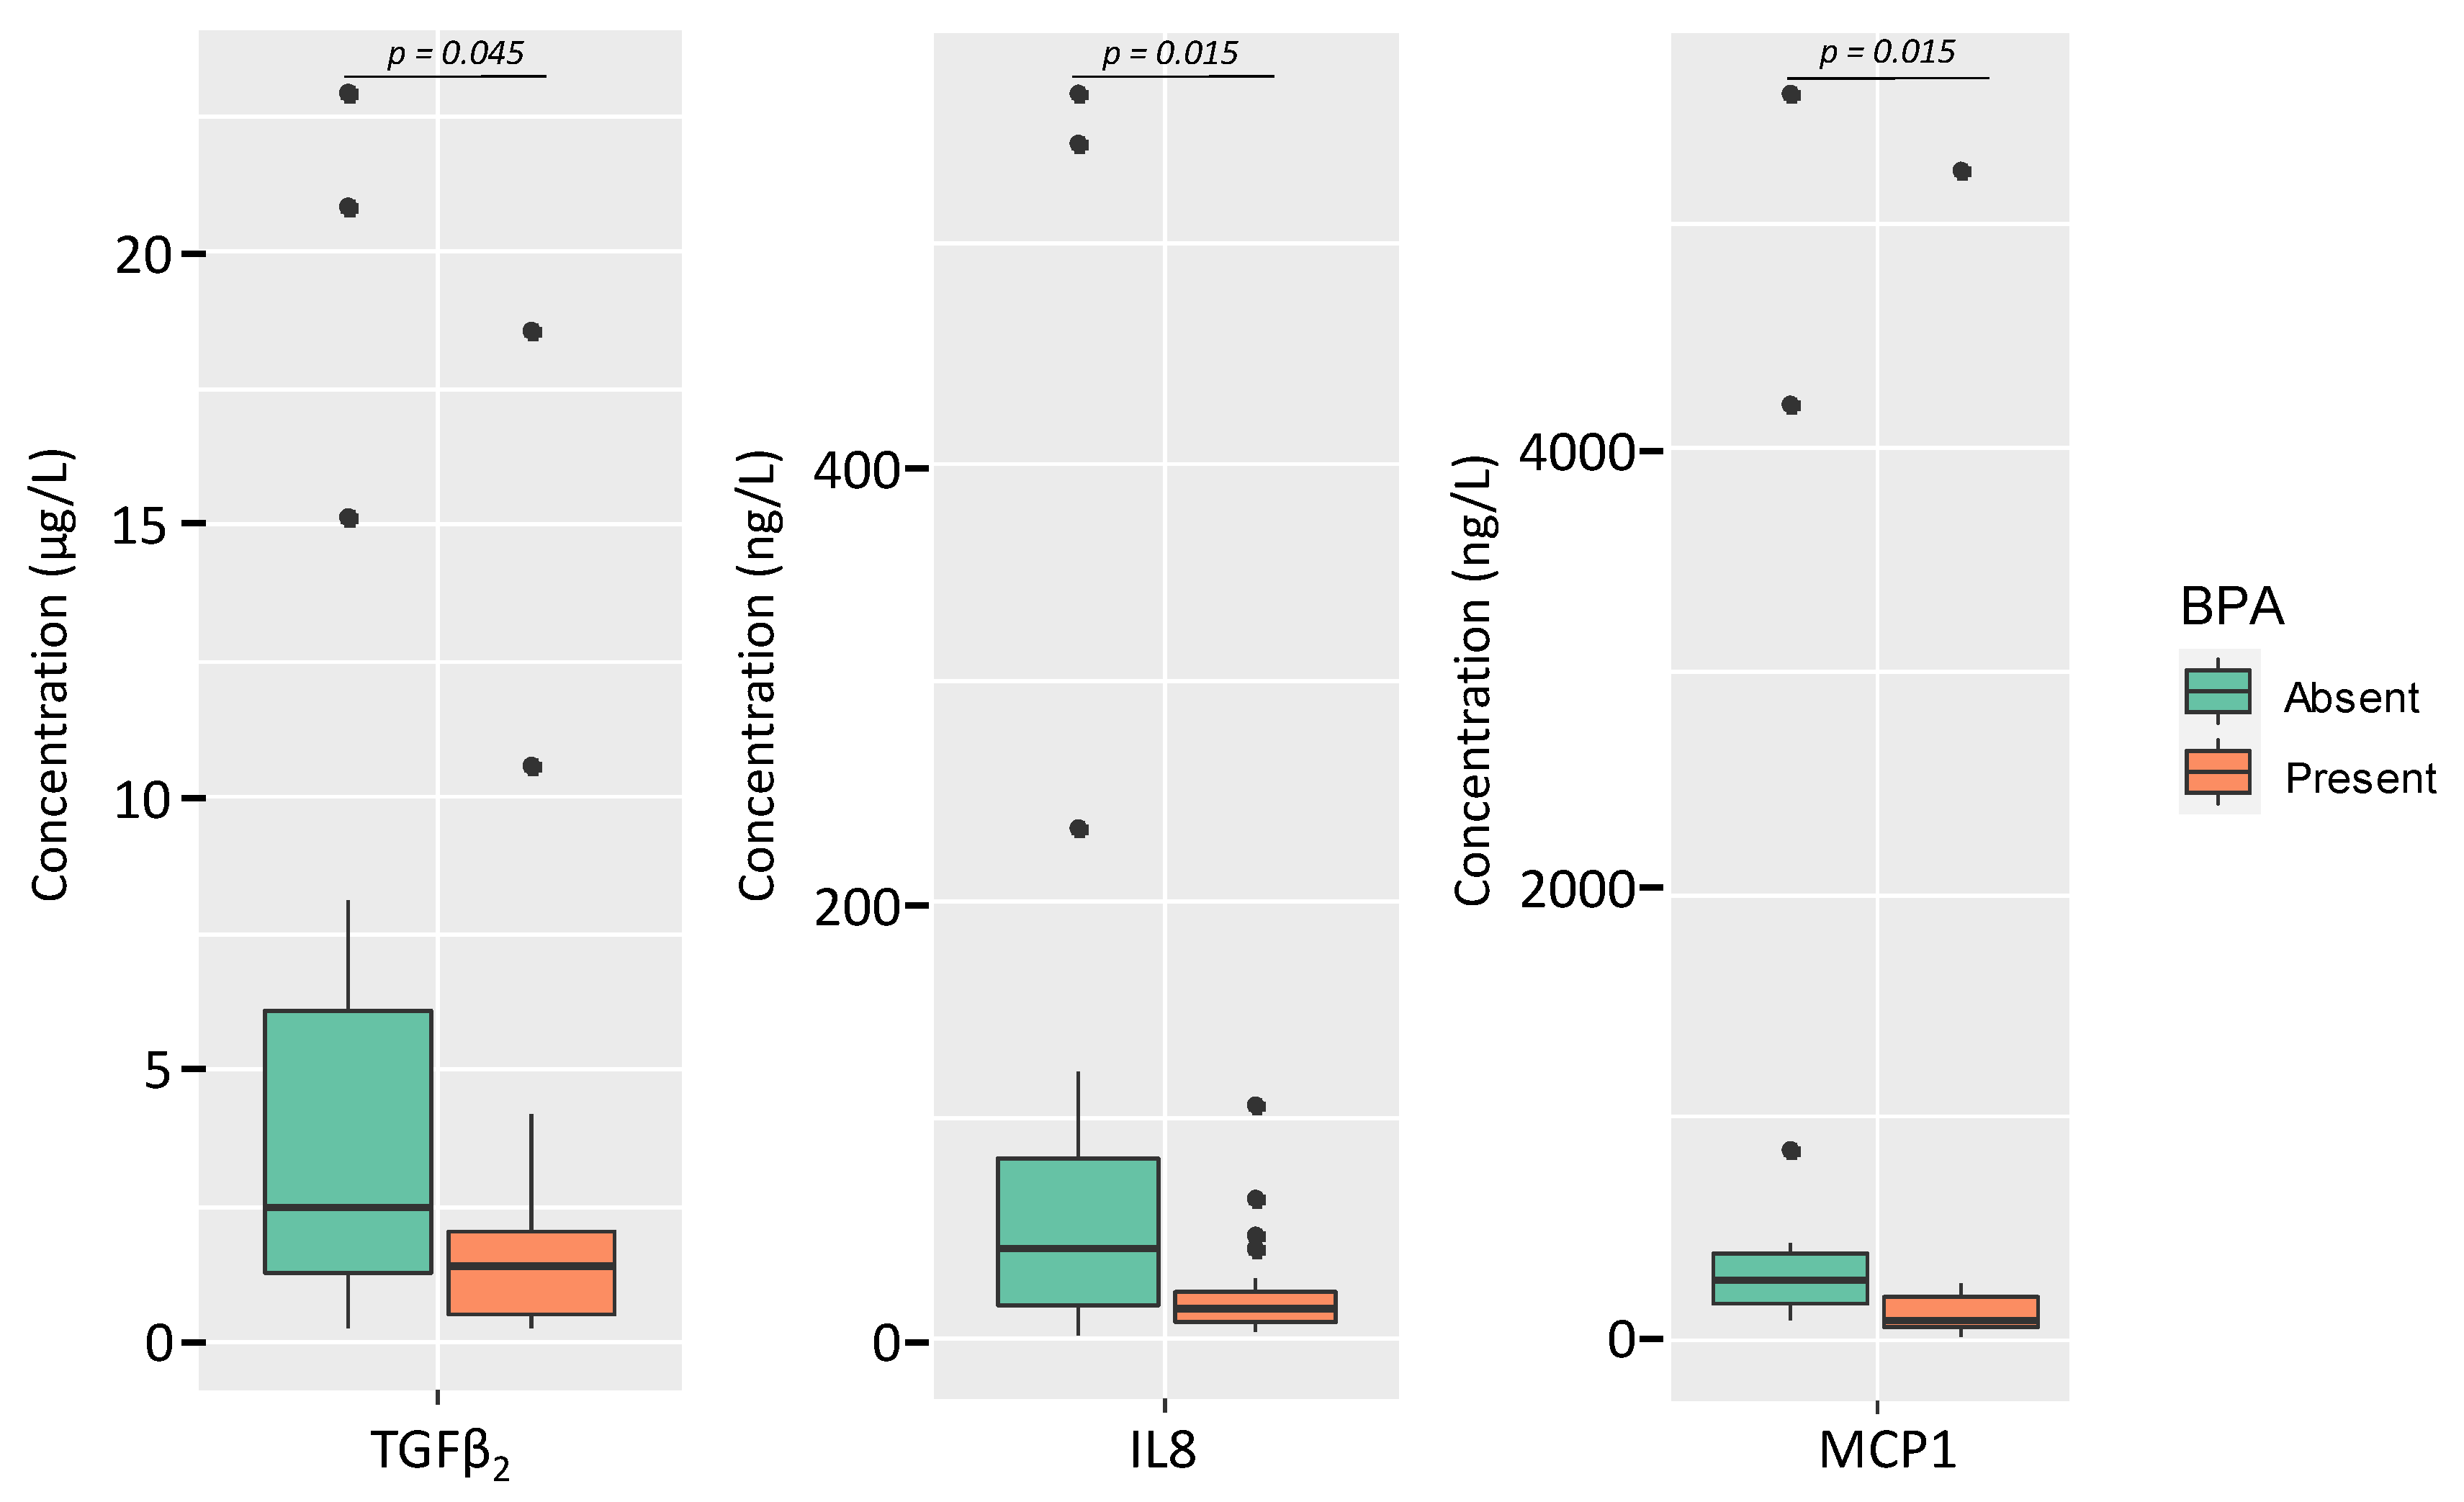
3.4. Relationships between Free and Total BPA and TBBPA Content in Milk and the Microbial and Immunological Profiles
4. Discussion
5. Conclusions
Supplementary Materials
Author Contributions
Funding
Institutional Review Board Statement
Informed Consent Statement
Data Availability Statement
Acknowledgments
Conflicts of Interest
References
- Eidelman, A.I.; Schanler, R.J. Breastfeeding and the use of human milk. Pediatrics 2012, 129, e827–e841. [Google Scholar] [CrossRef] [Green Version]
- Horta, B.L.; Victoria, C.G.; World Health Organization. Long-Term Effects of Breastfeeding: A Systematic Review; World Health Organization: Geneva, Switzerland, 2013; Available online: https://apps.who.int/iris/handle/10665/79198 (accessed on 29 October 2021).
- Global Breastfeeding Collective; UNICEF. Nurturing the Health and Wealth of Nations: The Investment Case for Breastfeeding; UNICEF: New York, NY, USA, 2017.
- Cao, X.-L.; Popovic, S.; Arbuckle, T.E.; Fraser, W.D. Determination of free and total bisphenol A in human milk samples from Canadian women using a sensitive and selective GC-MS method. Food Addit. Contam. Part A 2015, 32, 120–125. [Google Scholar] [CrossRef]
- Cardoso, O.O.; Julião, F.C.; Alves, R.I.S.; Baena, A.R.; Díez, I.G.; Suzuki, M.N.; Celere, B.S.; Nadal, M.; Domingo, J.L.; Segura-Muñoz, S.I. Concentration profiles of metals in breast milk, drinking water, and soil: Relationship between matrices. Biol. Trace Elem. Res. 2014, 160, 116–122. [Google Scholar] [CrossRef] [PubMed]
- LaKind, J.S.; Amina Wilkins, A.; Berlin, C.M. Environmental chemicals in human milk: A review of levels, infant exposures and health, and guidance for future research. Toxicol. Appl. Pharmacol. 2004, 198, 184–208. [Google Scholar] [CrossRef] [PubMed]
- Lopes, B.R.; Barreiro, J.C.; Cass, Q.B. Bioanalytical challenge: A review of environmental and pharmaceuticals contaminants in human milk. J. Pharm. Biomed. Anal. 2016, 130, 318–325. [Google Scholar] [CrossRef] [PubMed]
- Stefanidou, M.; Maravelias, C.; Spiliopoulou, C. Human exposure to endocrine disruptors and breast milk. Endocr. Metab. Immune Disord.-Drug Targets 2009, 9, 269–276. [Google Scholar] [CrossRef]
- Andersson, A.-M.; Söder, O.; Toppari, J.; Oehlmann, J.; Pottinger, T.; Sumpter, J.; Gray, L.; Sharpe, R.; Vinggaard, A.-M.; Kortenkamp, A. The Impacts of Endocrine Disrupters on Wildlife, People and Their Environments; Publications Office of the European Union: Luxemburg, 2012; Volume 15, ISBN 9789292133078.
- Gil, F.; Hernández, A.F. Toxicological importance of human biomonitoring of metallic and metalloid elements in different biological samples. Food Chem. Toxicol. 2015, 80, 287–297. [Google Scholar] [CrossRef]
- Fujii, Y.; Kato, Y.; Masuda, N.; Harada, K.H.; Koizumi, A.; Haraguchi, K. Contamination trends and factors affecting the transfer of hexabromocyclododecane diastereomers, tetrabromobisphenol A, and 2,4,6-tribromophenol to breast milk in Japan. Environ. Pollut. 2018, 237, 936–943. [Google Scholar] [CrossRef]
- Huang, M.; Li, J.; Xiao, Z.; Shi, Z. Tetrabromobisphenol A and hexabromocyclododecane isomers in breast milk from the general population in Beijing, China: Contamination levels, temporal trends, nursing infant’s daily intake, and risk assessment. Chemosphere 2020, 244, 125524. [Google Scholar] [CrossRef]
- Anwer, F.; Chaurasia, S.; Khan, A.A. Hormonally active agents in the environment: A state-of-the-art review. Rev. Environ. Health 2016, 31, 415–433. [Google Scholar] [CrossRef] [PubMed]
- Meeker, J.D. Exposure to environmental endocrine disruptors and child development. Arch. Pediatr. Adolesc. Med. 2012, 166, 952–958. [Google Scholar] [CrossRef] [PubMed] [Green Version]
- Walker, D.M.; Gore, A.C. Epigenetic impacts of endocrine disruptors in the brain. Front. Neuroendocrinol. 2017, 44, 1–26. [Google Scholar] [CrossRef] [PubMed] [Green Version]
- Ballard, O.; Morrow, A.L. Human Milk composition. nutrients and bioactive factors. Pediatr. Clin. N. Am. 2013, 60, 49–74. [Google Scholar] [CrossRef] [Green Version]
- Bhakta, J.N.; Ohnishi, K.; Munekage, Y.; Iwasaki, K.; Wei, M.Q. Characterization of lactic acid bacteria-based probiotics as potential heavy metal sorbents. J. Appl. Microbiol. 2012, 112, 1193–1206. [Google Scholar] [CrossRef] [PubMed]
- Chen, L.; Guo, Y.; Hu, C.; Lam, P.K.S.; Lam, J.C.W.; Zhou, B. Dysbiosis of gut microbiota by chronic coexposure to titanium dioxide nanoparticles and bisphenol A: Implications for host health in zebrafish. Environ. Pollut. 2018, 234, 307–317. [Google Scholar] [CrossRef]
- Lai, K.-P.; Chung, Y.-T.; Li, R.; Wan, H.-T.; Wong, C.K.-C. Bisphenol A alters gut microbiome: Comparative metagenomics analysis. Environ. Pollut. 2016, 218, 923–930. [Google Scholar] [CrossRef] [PubMed]
- Xiong, S.; Wang, Y.; Li, H.; Zhang, X. Low Dose of Bisphenol A Activates NF-κB/IL-6 signals to increase malignancy of neuroblastoma cells. Cell. Mol. Neurobiol. 2017, 37, 1095–1103. [Google Scholar] [CrossRef]
- Martínez, M.Á.; Castro, I.; Rovira, J.; Ares, S.; Rodríguez, J.M.; Cunha, S.C.; Casal, S.; Fernandes, J.O.; Schuhmacher, M.; Nadal, M. Early-life intake of major trace elements, bisphenol A, tetrabromobisphenol A and fatty acids: Comparing human milk and commercial infant formulas. Environ. Res. 2019, 169, 246–255. [Google Scholar] [CrossRef]
- Martín, V.; Mediano, P.; Del Campo, R.; Rodríguez, J.M.; Marín, M. Streptococcal diversity of human milk and comparison of different methods for the taxonomic identification of streptococci. J. Hum. Lact. 2016, 32, NP84–NP94. [Google Scholar] [CrossRef]
- Lackey, K.A.; Williams, J.E.; Meehan, C.L.; Zachek, J.A.; Benda, E.D.; Price, W.J.; Foster, J.A.; Sellen, D.W.; Kamau-Mbuthia, E.W.; Kamundia, E.W. What’s normal? Microbiomes in human milk and infant feces are related to each other but vary geographically: The INSPIRE Study. Front. Nutr. 2019, 6, 45. [Google Scholar] [CrossRef] [Green Version]
- Klindworth, A.; Pruesse, E.; Schweer, T.; Peplies, J.; Quast, C.; Horn, M.; Glöckner, F.O. Evaluation of general 16S ribosomal RNA gene PCR primers for classical and next-generation sequencing-based diversity studies. Nucleic Acids Res. 2013, 41, e1. [Google Scholar] [CrossRef] [PubMed]
- Davis, N.M.; Proctor, D.M.; Holmes, S.P.; Relman, D.A.; Callahan, B.J. Simple statistical identification and removal of contaminant sequences in marker-gene and metagenomics data. Microbiome 2018, 6, 226. [Google Scholar] [CrossRef] [PubMed] [Green Version]
- R Core Team. R: A Language and Environment for Statistical Computing; R Foundation for Statistical Computing: Vienna, Austria, 2021; Available online: https://www.R-project.org/ (accessed on 29 October 2021).
- Lê, S.; Josse, J.; Husson, F. FactoMineR: An R package for multivariate analysis. J. Stat. Softw. 2008, 25, 1–18. [Google Scholar] [CrossRef] [Green Version]
- Kassambara, A.; Mundt, F. Factoextra: Extract and Visualize the Results of Multivariate Data Analyses. R Packag. Version. 2017. Available online: https://rpkgs.datanovia.com/factoextra/ (accessed on 29 October 2021).
- Wei, T.; Simko, V.; Levy, M.; Xie, Y.; Jin, Y.; Zemla, J. Package ‘corrplot’. Statistician 2017, 56, e24. [Google Scholar]
- Ruiz, L.; Espinosa-Martos, I.; García-Carral, C.; Manzano, S.; McGuire, M.K.; Meehan, C.L.; McGuire, M.A.; Williams, J.E.; Foster, J.; Sellen, D.W.; et al. What’s normal? Immune profiling of human milk from healthy women living in different geographical and socioeconomic settings. Front. Immunol. 2017, 8, 1–17. [Google Scholar] [CrossRef]
- Fernández, L.; Rodríguez, J.M. Human milk microbiota: Origin and potential uses. Nestle Nutr. Inst. Workshop Ser. 2020, 94, 75–85. [Google Scholar] [CrossRef] [PubMed]
- Mehta, R.V.; Sreenivasa, M.A.; Mathew, M.; Girard, A.W.; Taneja, S.; Ranjan, S.; Ramakrishnan, U.; Martorell, R.; Ryan, P.B.; Young, M.F. A mixed-methods study of pesticide exposures in Breastmilk and Community & Lactating Women’s perspectives from Haryana, India. BMC Public Health 2020, 20, 1877. [Google Scholar] [CrossRef]
- Anderson, H.A.; Wolff, M.S. Environmental contaminants in human milk. J. Expo. Anal. Environ. Epidemiol. 2000, 10, 755–760. [Google Scholar] [CrossRef] [PubMed] [Green Version]
- Canipari, R.; De Santis, L.; Cecconi, S. Female fertility and environmental pollution. Int. J. Environ. Res. Public Health 2020, 17, 8802. [Google Scholar] [CrossRef]
- DeWitt, J.C.; Patisaul, H.B. Endocrine disruptors and the developing immune system. Curr. Opin. Toxicol. 2018, 10, 31–36. [Google Scholar] [CrossRef]
- Fudvoye, J.; Lopez-Rodriguez, D.; Franssen, D.; Parent, A.S. Endocrine disrupters and possible contribution to pubertal changes. Best Pract. Res. Clin. Endocrinol. Metab. 2019, 33, 101300. [Google Scholar] [CrossRef]
- Mustieles, V.; Pérez-Lobato, R.; Olea, N.; Fernández, M.F. Bisphenol A: Human exposure and neurobehavior. Neurotoxicology 2015, 49, 174–184. [Google Scholar] [CrossRef] [PubMed]
- Jiménez, E.; De Andrés, J.; Manrique, M.; Pareja-Tobes, P.; Tobes, R.; Martínez-Blanch, J.F.; Codoñer, F.M.; Ramón, D.; Fernández, L.; Rodríguez, J.M. Metagenomic analysis of milk of healthy and mastitis-suffering women. J. Hum. Lact. 2015, 31, 406–415. [Google Scholar] [CrossRef] [PubMed]
- Mediano, P.; Fernández, L.; Jiménez, E.; Arroyo, R.; Espinosa-Martos, I.; Rodríguez, J.M.; Marín, M. Microbial diversity in milk of women with mastitis: Potential role of coagulase-negative staphylococci, viridans group streptococci, and corynebacteria. J. Hum. Lact. 2017, 33, 309–318. [Google Scholar] [CrossRef]
- Marín, M.; Arroyo, R.; Espinosa-Martos, I.; Fernández, L.; Rodríguez, J.M. Identification of emerging human mastitis pathogens by MALDI-TOF and assessment of their antibiotic resistance patterns. Front. Microbiol. 2017, 8. [Google Scholar] [CrossRef] [PubMed] [Green Version]
- Jiménez, E.; Arroyo, R.; Cárdenas, N.; Marín, M.; Serrano, P.; Fernández, L.; Rodríguez, J.M. Mammary candidiasis: A medical condition without scientific evidence? PLoS ONE 2017, 12, e0181071. [Google Scholar] [CrossRef]
- Contreras, G.A.; Rodríguez, J.M. Mastitis: Comparative etiology and epidemiology. J. Mammary Gland Biol. Neoplasia 2011, 16, 339–356. [Google Scholar] [CrossRef] [PubMed]
- Fetherston, C.M.; Lai, C.T.; Hartmann, P.E. Relationships between symptoms and changes in breast physiology during lactation mastitis. Breastfeed. Med. 2006, 1, 136–145. [Google Scholar] [CrossRef]
- Samuel, T.M.; Zhou, Q.; Giuffrida, F.; Munblit, D.; Verhasselt, V.; Thakkar, S.K. Nutritional and non-nutritional composition of human milk is modulated by maternal, infant, and methodological factors. Front. Nutr. 2020, 7. [Google Scholar] [CrossRef]
- Aitken, S.L.; Corl, C.M.; Sordillo, L.M. Immunopathology of mastitis: Insights into disease recognition and resolution. J. Mammary Gland Biol. Neoplasia 2011, 16, 291–304. [Google Scholar] [CrossRef]
- Li, C.; Solomons, N.W.; Scott, M.E.; Koski, K.G. Subclinical mastitis (SCM) and proinflammatory cytokines are associated with mineral and trace element concentrations in human breast milk. J. Trace Elem. Med. Biol. 2018, 46, 55–61. [Google Scholar] [CrossRef]
- ATSDR Agency for Toxic Substances and Disease Registry. Available online: https://www.atsdr.cdc.gov/ (accessed on 1 March 2021).
- Hobman, J.L.; Crossman, L.C. Bacterial antimicrobial metal ion resistance. J. Med. Microbiol. 2015, 64, 471–497. [Google Scholar] [CrossRef]
- Jacob, J.M.; Karthik, C.; Saratale, R.G.; Kumar, S.S.; Prabakar, D.; Kadirvelu, K.; Pugazhendhi, A. Biological approaches to tackle heavy metal pollution: A survey of literature. J. Environ. Manag. 2018, 217, 56–70. [Google Scholar] [CrossRef] [PubMed]
- Monachese, M.; Burton, J.P.; Reid, G. Bioremediation and tolerance of humans to heavy metals through microbial processes: A potential role for probiotics? Appl. Environ. Microbiol. 2012, 78, 6397–6404. [Google Scholar] [CrossRef] [Green Version]
- Kinoshita, H.; Sohma, Y.; Ohtake, F.; Ishida, M.; Kawai, Y.; Kitazawa, H.; Saito, T.; Kimura, K. Biosorption of heavy metals by lactic acid bacteria and identification of mercury binding protein. Res. Microbiol. 2013, 164, 701–709. [Google Scholar] [CrossRef]
- Mrvčić, J.; Stanzer, D.; Solić, E.; Stehlik-Tomas, V. Interaction of lactic acid bacteria with metal ions: Opportunities for improving food safety and quality. World J. Microbiol. Biotechnol. 2012, 28, 2771–2782. [Google Scholar] [CrossRef] [PubMed]
- Schut, S.; Zauner, S.; Hampel, G.; König, H.; Claus, H. Biosorption of copper by wine-relevant lactobacilli. Int. J. Food Microbiol. 2011, 145, 126–131. [Google Scholar] [CrossRef] [PubMed]
- Teemu, H.; Seppo, S.; Jussi, M.; Raija, T.; Kalle, L. Reversible surface binding of cadmium and lead by lactic acid and bifidobacteria. Int. J. Food Microbiol. 2008, 125, 170–175. [Google Scholar] [CrossRef]
- Astolfi, M.L.; Protano, C.; Schiavi, E.; Marconi, E.; Capobianco, D.; Massimi, L.; Ristorini, M.; Baldassarre, M.E.; Laforgia, N.; Vitali, M.; et al. A prophylactic multi-strain probiotic treatment to reduce the absorption of toxic elements: In-vitro study and biomonitoring of breast milk and infant stools. Environ. Int. 2019, 130, 104818. [Google Scholar] [CrossRef]
- Bilal, M.; Shah, J.A.; Ashfaq, T.; Gardazi, S.M.H.; Tahir, A.A.; Pervez, A.; Haroon, H.; Mahmood, Q. Waste biomass adsorbents for copper removal from industrial wastewater—A review. J. Hazard. Mater. 2013, 263 Pt 2, 322–333. [Google Scholar] [CrossRef] [PubMed]
- Srinath, T.; Verma, T.; Ramteke, P.W.; Garg, S.K. Chromium (VI) biosorption and bioaccumulation by chromate resistant bacteria. Chemosphere 2002, 48, 427–435. [Google Scholar] [CrossRef]
- Catron, T.R.; Keely, S.P.; Brinkman, N.E.; Zurlinden, T.J.; Wood, C.E.; Wright, J.R.; Phelps, D.; Wheaton, E.; Kvasnicka, A.; Gaballah, S.; et al. Host developmental toxicity of BPA and BPA alternatives is inversely related to microbiota disruption in zebrafish. Toxicol. Sci. 2019, 167, 468–483. [Google Scholar] [CrossRef] [PubMed]
- Liu, Y.; Yao, Y.; Li, H.; Qiao, F.; Wu, J.; Du, Z.-Y.; Zhang, M. Influence of endogenous and exogenous estrogenic endocrine on intestinal microbiota in zebrafish. PLoS ONE 2016, 11, e0163895. [Google Scholar] [CrossRef]
- Javurek, A.B.; Spollen, W.G.; Johnson, S.A.; Bivens, N.J.; Bromert, K.H.; Givan, S.A.; Rosenfeld, C.S. Effects of exposure to bisphenol A and ethinyl estradiol on the gut microbiota of parents and their offspring in a rodent model. Gut Microbes 2016, 7, 471–485. [Google Scholar] [CrossRef] [PubMed] [Green Version]
- Jensen, R.C.; Lammi-Keefe, C.J.; Koletzko, B. Representative sampling of human milk and the extraction of fat for analysis of environmental lipophilic contaminants. Toxicol. Environ. Chem. 1997, 62, 229–247. [Google Scholar] [CrossRef]


| Characteristic | n (%) | Mean (95% CI) or Median (IQR) |
|---|---|---|
| Age (years) | 49 | 35 (34,36) 1 |
| BMI (kg/m2) | 50 | 24.47 (20.89–27.19) |
| Time of lactation (months) | 43 | 2 (1–5) |
| 1 | 16 (37) | 1 (0–1) |
| 1 to 6 | 19 (44) | 3.00 (2.00–4.25) |
| >6 | 8 (19) | 15.00 (8.25–21.75) |
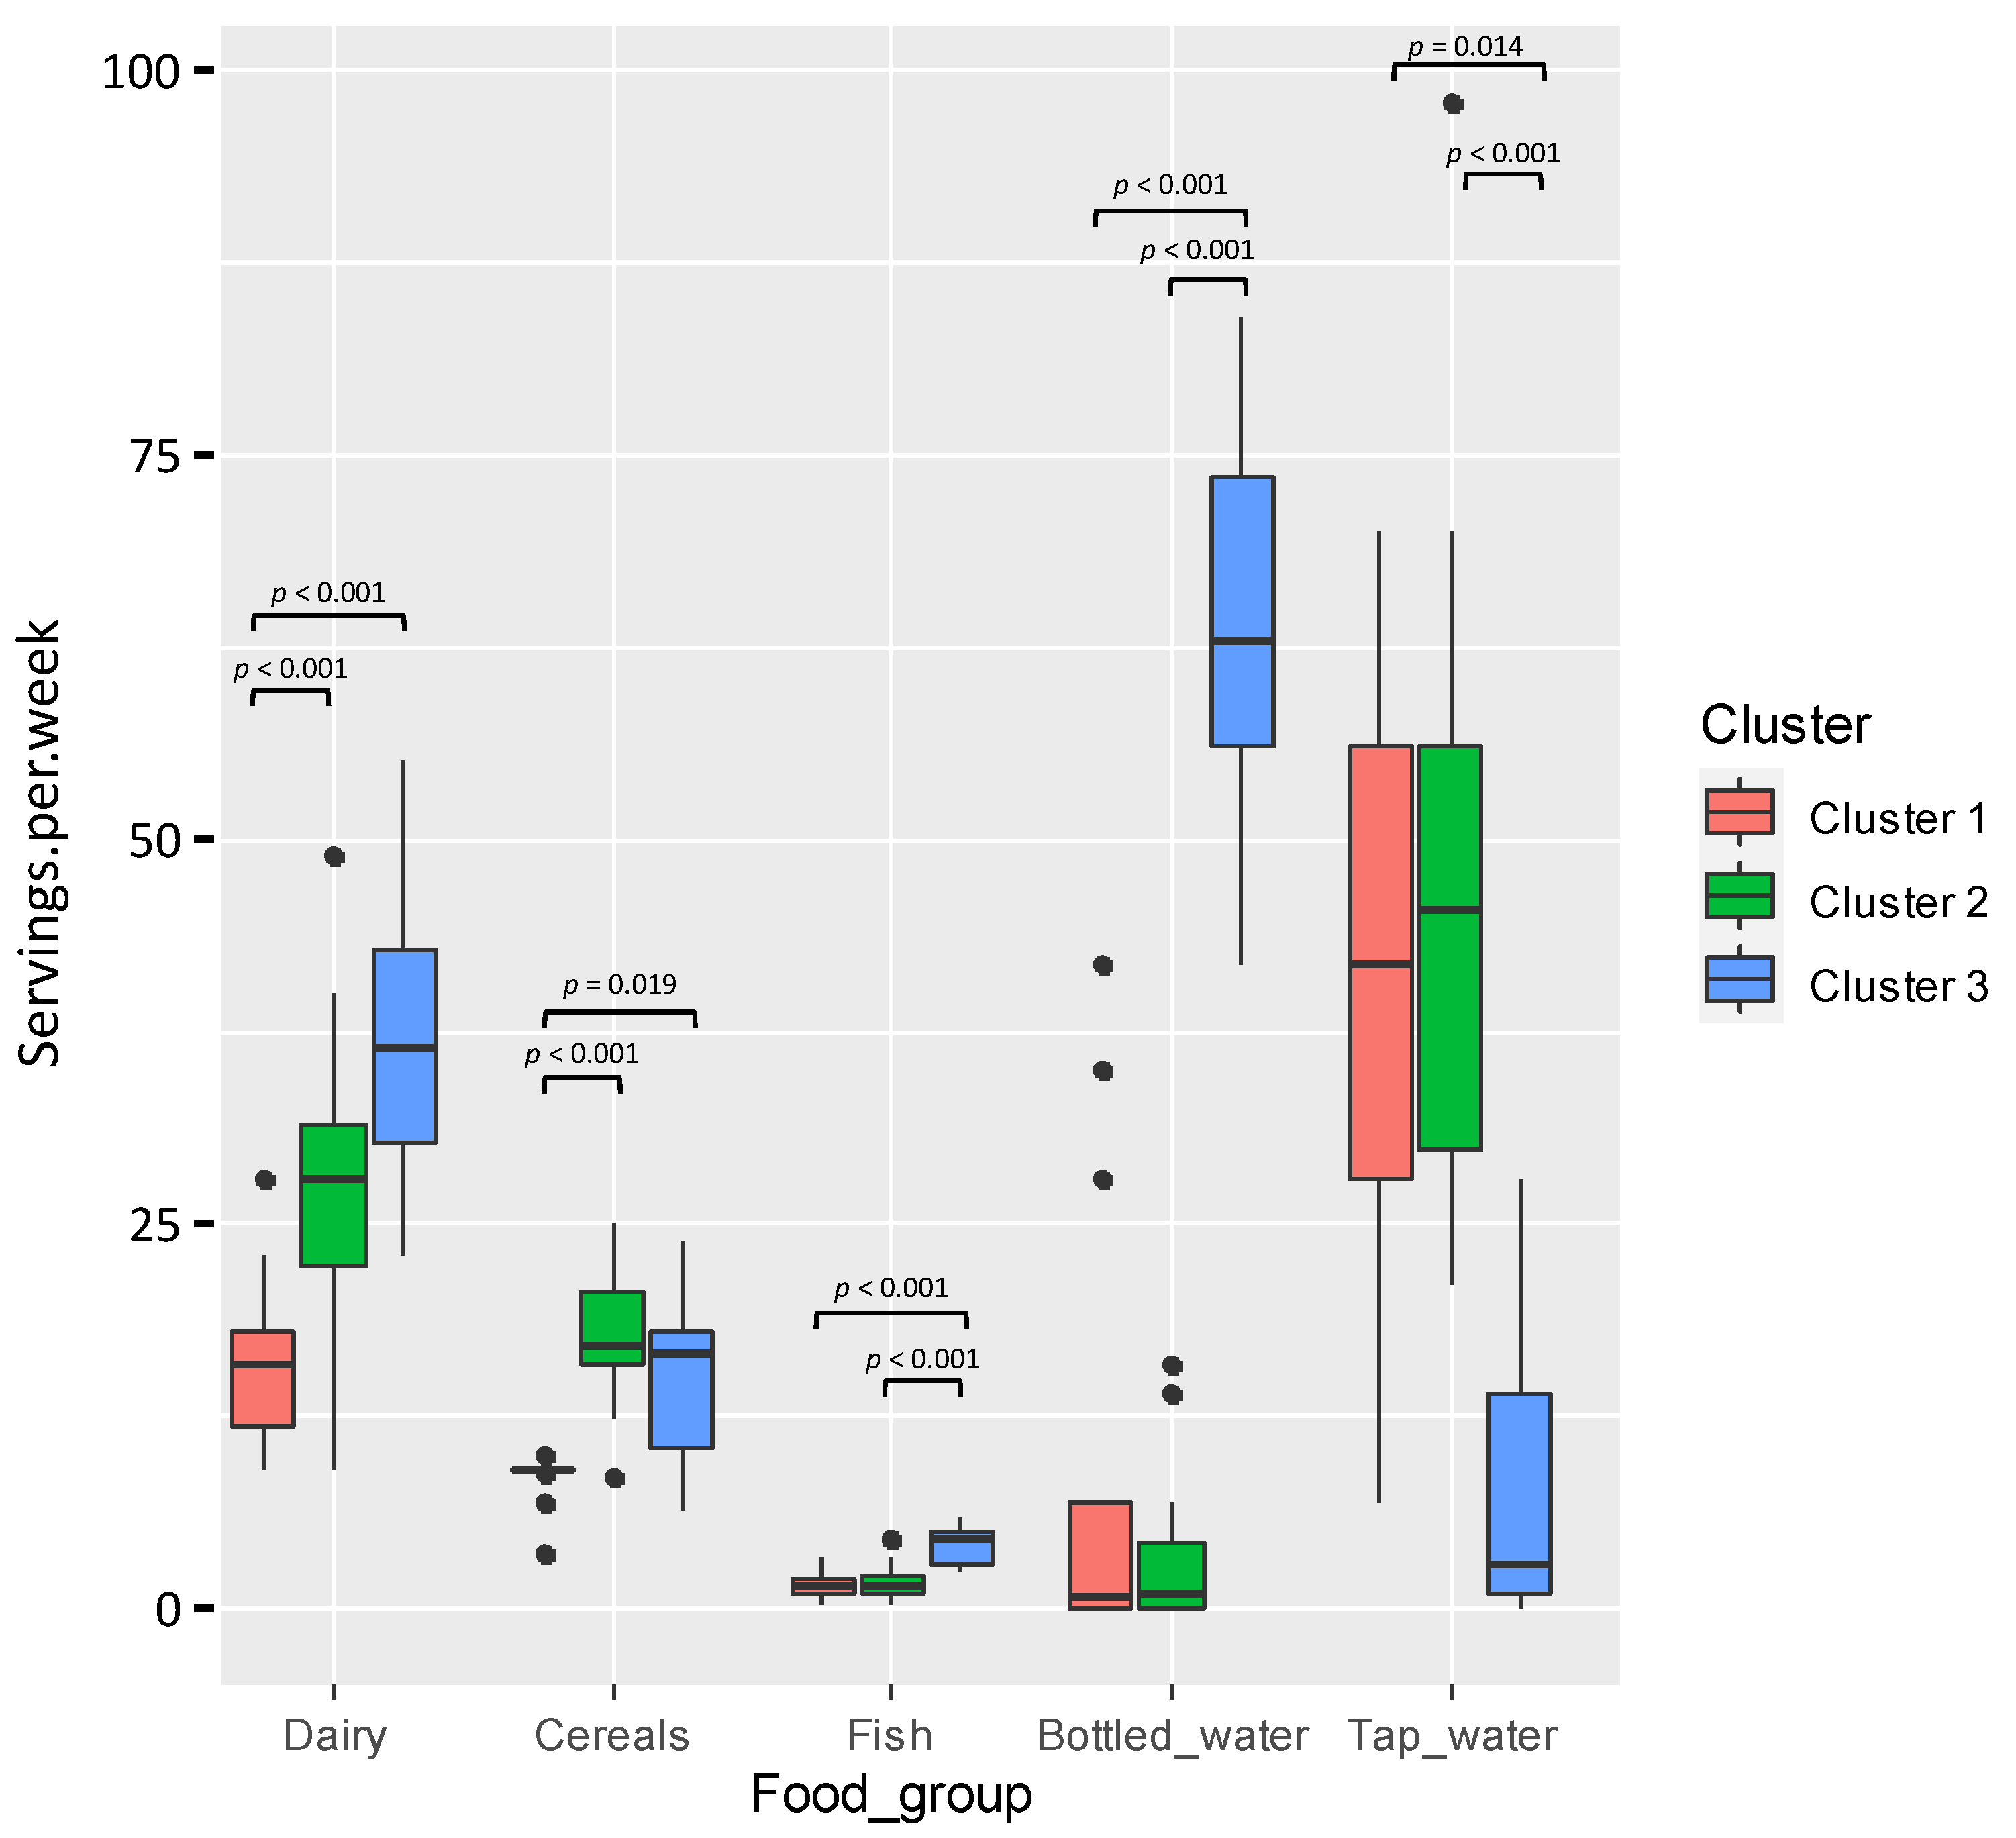
| Food Group | Weekly Consumption |
|---|---|
| Dairy products | 23 (16.23–31.00) |
| Cereals | 16 (9.00–18.00) |
| Fish | 1.5 (1.00–2.57) |
| Nuts | 1 (0.40–3.00) |
| Microwavable food | 0 (0.00–0.11) |
| Tap water | 42 (28.00–56.00) |
| Canned drinks | 2 (1.00–4.25) |
| Bottled water | 1.5 (0.07–19.00) |
| Cluster 1 (n = 19) | Cluster 2 (n = 22) | Cluster 3 (n = 8) | p-Value 1 | p-Value 2 | ||||
|---|---|---|---|---|---|---|---|---|
| BPA (free) | 5 (26)a | 0.61 (0.18–0.95) | 0 (0)b | - | 4 (50)a | 1.93 (0.19–3.78) | < 0.010 | 0.462 |
| Total BPA | 11 (58) | 1.03 (0.60–1.63) a | 9 (41) | 0.32 (0.20–0.36) b | 4 (50) | 0.45 (0.34–4.53) a | 0.553 | 0.048 |
| TBBPA | 2 (10) | 1.60 (1.30–1.90) | 0 (0) | - | 1 (12) | 2.30 | 0.192 | 0.221 |
| Na < 130 mg/L | Na ≥ 130 mg/L | |||||
|---|---|---|---|---|---|---|
| n (%) | Median (IQR) | n (%) | (Median IQR) | p-Value 1 | p-Value 2 | |
| Bacterial counts (culture-dependent analysis) (n = 45) | ||||||
| Total counts (log10 CFU/mL) | 23 (100) | 2.75 (1.30–3.15) | 22 (100) | 3.27 (2.25–4.16) | 1.000 | 0.021 |
| Total staphylococci (log10 CFU/mL) | 22 (100) | 2.53 (1.30–3.02) | 21 (93) | 3.20 (2.00–4.04) | 0.448 | 0.009 |
| Relative abundance of bacterial genera (culture-independent analysis) (n = 48) | ||||||
| Clostridium (%) | 23 (100) | 0.07 (0.06–0.09) | 25 (100) | 0.04 (0.03–0.05) | 1.000 | 0.001 |
| Pseudomonas (%) | 23 (100) | 0.21 (0.08–0.53) | 25 (100) | 0.06 (0.01–0.19) | 1.000 | 0.021 |
| Minor genera (%) | 23 (100) | 13.92 (8.36–30.55) | 25 (100) | 6.50 (2.27–19.14) | 1.000 | 0.036 |
| Immunological compound (n = 48) | ||||||
| IgM (mg/L) | 23 (100) | 24.26 (14.88–51.62) | 25 (100) | 72.79 (41.03–147.19) | 1.000 | < 0.001 |
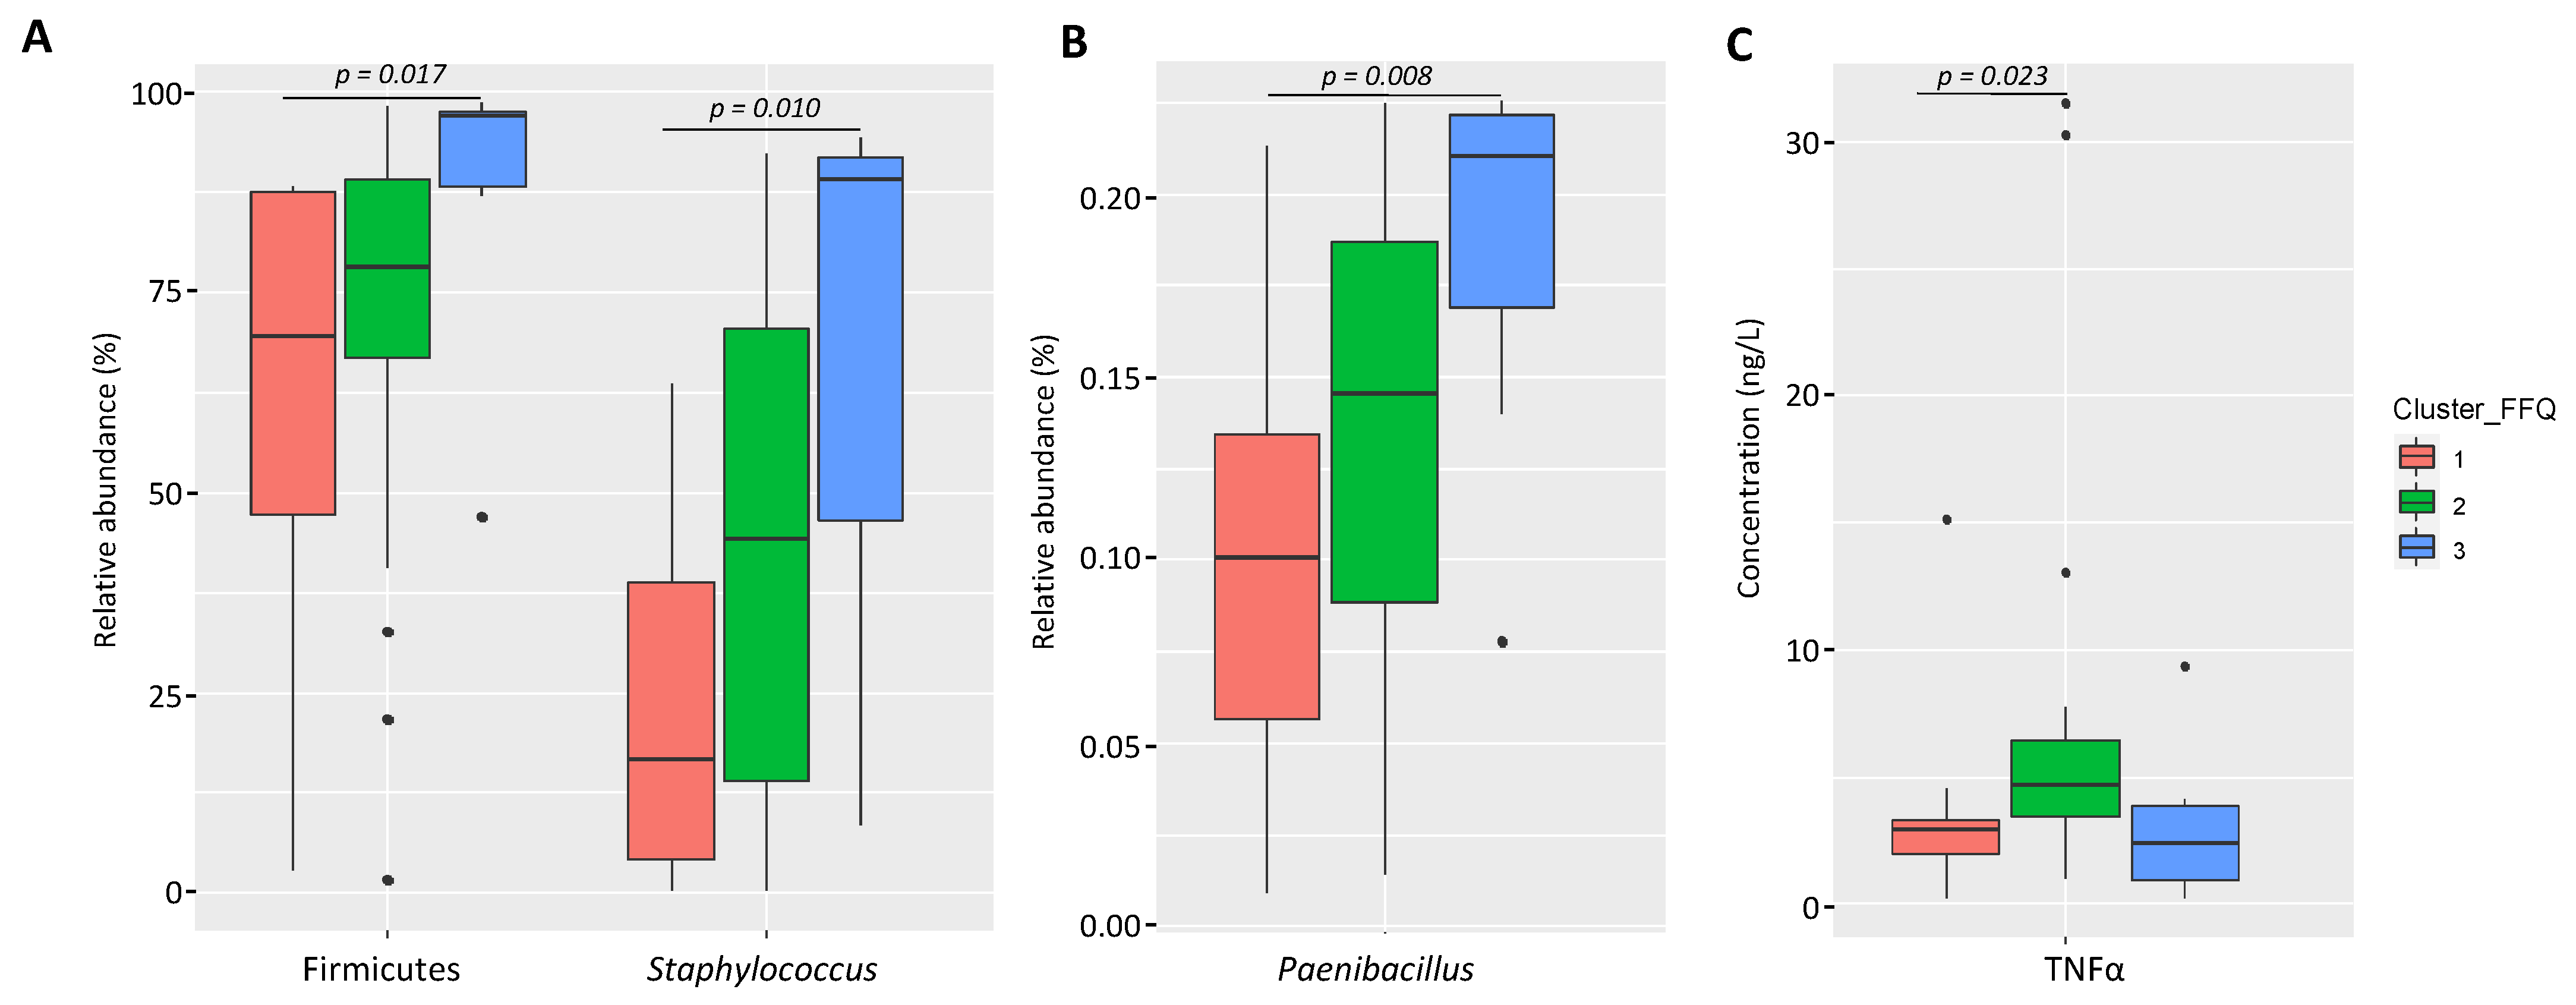
| TNFα (ng/L) | 18 (78) | 3.13 (1.87–4.02) | 24 (96) | 4.72 (2.84–10.29) | 0.091 | 0.031 |
| IL8 (ng/L) | 23 (100) | 13.70 (5.50–21.19) | 25 (100) | 41.30 (13.38–88.63) | 1.000 | 0.002 |
| GROα (µg/L) | 23 (100) | 0.29 (0.04–2.85) | 25 (100) | 3.52 (1.59–7.69) | 1.000 | 0.002 |
| MCP1 (ng/L) | 8 (35) | 94.31 (56–102.10) | 20 (80) | 275.24 (195.43–539.59) | 0.003 | 0.001 |
| MIP1b (ng/L) | 18 (78) | 5.24 (1.95–8.25) | 25 (100) | 20.97 (13.43–67.89) | 0.019 | < 0.001 |
| EGF (µg/L) | 23 (100) | 4.96 (4.55–5.97) | 25 (100) | 6.08 (5.33–7.39) | 1.000 | 0.031 |
| GCSF (ng/L) | 9 (39) | 2.33 (1.67–6.54) | 16 (64) | 12.18 (4.55–21.86) | 0.147 | 0.029 |
| TGFβ2 (µg/L) | 23 (100) | 0.62 (0.31–1.76) | 25 (100) | 3.47 (1.61–6.23) | 1.000 | < 0.001 |
| Cr content | ||||||
|---|---|---|---|---|---|---|
| n (%) | <0.32 mg/L | n (%) | ≥0.32 mg/L | p-Value 1 | p-Value 2 | |
| Bacillus (%) | 23 (100) | 0.16 (0.10-0.52) | 25 (100) | 0.08 (0.05-0.16) | 1.000 | 0.022 |
| Rothia (%) | 23 (100) | 0.39 (0.06-2.24) | 25 (100) | 1.99 (0.59-4.11) | 1.000 | 0.041 |
| Cu content | ||||||
| n (%) | <0.35 mg/L | n (%) | ≥0.35 mg/L | |||
| Lactobacillus (%) | 23 (100) | 0.32 (0.06-0.68) | 25 (100) | 0.10 (0.03-0.21) | 1.000 | 0.046 |
| Clostridium (%) | 23 (100) | 0.06 (0.05-0.09) | 25 (100) | 0.04 (0.03-0.05) | 1.000 | 0.005 |
| Bifidobacterium (%) | 23 (100) | 0.12 (0.05–0.71) | 25 (100) | 0.06 (0.01–0.10) | 1.000 | 0.029 |
| IgM (mg/L) | 23 (100) | 32.70 (17.74–69.70) | 25 (100) | 67.78 (34.27–138.88) | 1.000 | 0.042 |
| K content | ||||||
| n (%) | <499.03 mg/L | n (%) | ≥499.03 mg/L | |||
| IgM (mg/L) | 26 (100) | 31.44 (17.57–69.22) | 22 (100) | 69.18 (40.85–130.15) | 1.000 | 0.011 |
| EGF (µg/L) | 26 (100) | 5.29 (4.38–6.06) | 22 (100) | 6.25 (5.26–7.65) | 1.000 | 0.007 |
| TGFβ2 (µg/L) | 26 (100) | 0.88 (0.32–3.10) | 22 (100) | 2.22 (1.64–4.06) | 1.000 | 0.011 |
| Mg content | ||||||
| n (%) | <32.12 mg/L | n (%) | ≥32.12 mg/L | |||
| IgGt (mg/L) | 20 (100) | 49.85 (36.00–59.98) | 24 (100) | 90.75 (57.58–110.73) | 1.000 | 0.001 |
| IL8 (ng/L) | 20 (100) | 8.79 (4.76–26.73) | 24 (100) | 23.32 (14.59–70.39) | 1.000 | 0.004 |
Publisher’s Note: MDPI stays neutral with regard to jurisdictional claims in published maps and institutional affiliations. |
© 2021 by the authors. Licensee MDPI, Basel, Switzerland. This article is an open access article distributed under the terms and conditions of the Creative Commons Attribution (CC BY) license (https://creativecommons.org/licenses/by/4.0/).
Share and Cite
Castro, I.; Arroyo, R.; Aparicio, M.; Martínez, M.Á.; Rovira, J.; Ares, S.; Cunha, S.C.; Casal, S.; Oliveira Fernandes, J.; Schuhmacher, M.; et al. Dietary Habits and Relationship with the Presence of Main and Trace Elements, Bisphenol A, Tetrabromobisphenol A, and the Lipid, Microbiological and Immunological Profiles of Breast Milk. Nutrients 2021, 13, 4346. https://doi.org/10.3390/nu13124346
Castro I, Arroyo R, Aparicio M, Martínez MÁ, Rovira J, Ares S, Cunha SC, Casal S, Oliveira Fernandes J, Schuhmacher M, et al. Dietary Habits and Relationship with the Presence of Main and Trace Elements, Bisphenol A, Tetrabromobisphenol A, and the Lipid, Microbiological and Immunological Profiles of Breast Milk. Nutrients. 2021; 13(12):4346. https://doi.org/10.3390/nu13124346
Chicago/Turabian StyleCastro, Irma, Rebeca Arroyo, Marina Aparicio, María Ángeles Martínez, Joaquim Rovira, Susana Ares, Sara Cristina Cunha, Susana Casal, Jose Oliveira Fernandes, Marta Schuhmacher, and et al. 2021. "Dietary Habits and Relationship with the Presence of Main and Trace Elements, Bisphenol A, Tetrabromobisphenol A, and the Lipid, Microbiological and Immunological Profiles of Breast Milk" Nutrients 13, no. 12: 4346. https://doi.org/10.3390/nu13124346
APA StyleCastro, I., Arroyo, R., Aparicio, M., Martínez, M. Á., Rovira, J., Ares, S., Cunha, S. C., Casal, S., Oliveira Fernandes, J., Schuhmacher, M., Nadal, M., Rodríguez, J. M., & Fernández, L. (2021). Dietary Habits and Relationship with the Presence of Main and Trace Elements, Bisphenol A, Tetrabromobisphenol A, and the Lipid, Microbiological and Immunological Profiles of Breast Milk. Nutrients, 13(12), 4346. https://doi.org/10.3390/nu13124346