
Association between Dietary Patterns and Chronic Obstructive Pulmonary Disease in Korean Adults: The Korean Genome and Epidemiology Study

 ,
,
Abstract
:1. Introduction
2. Methods
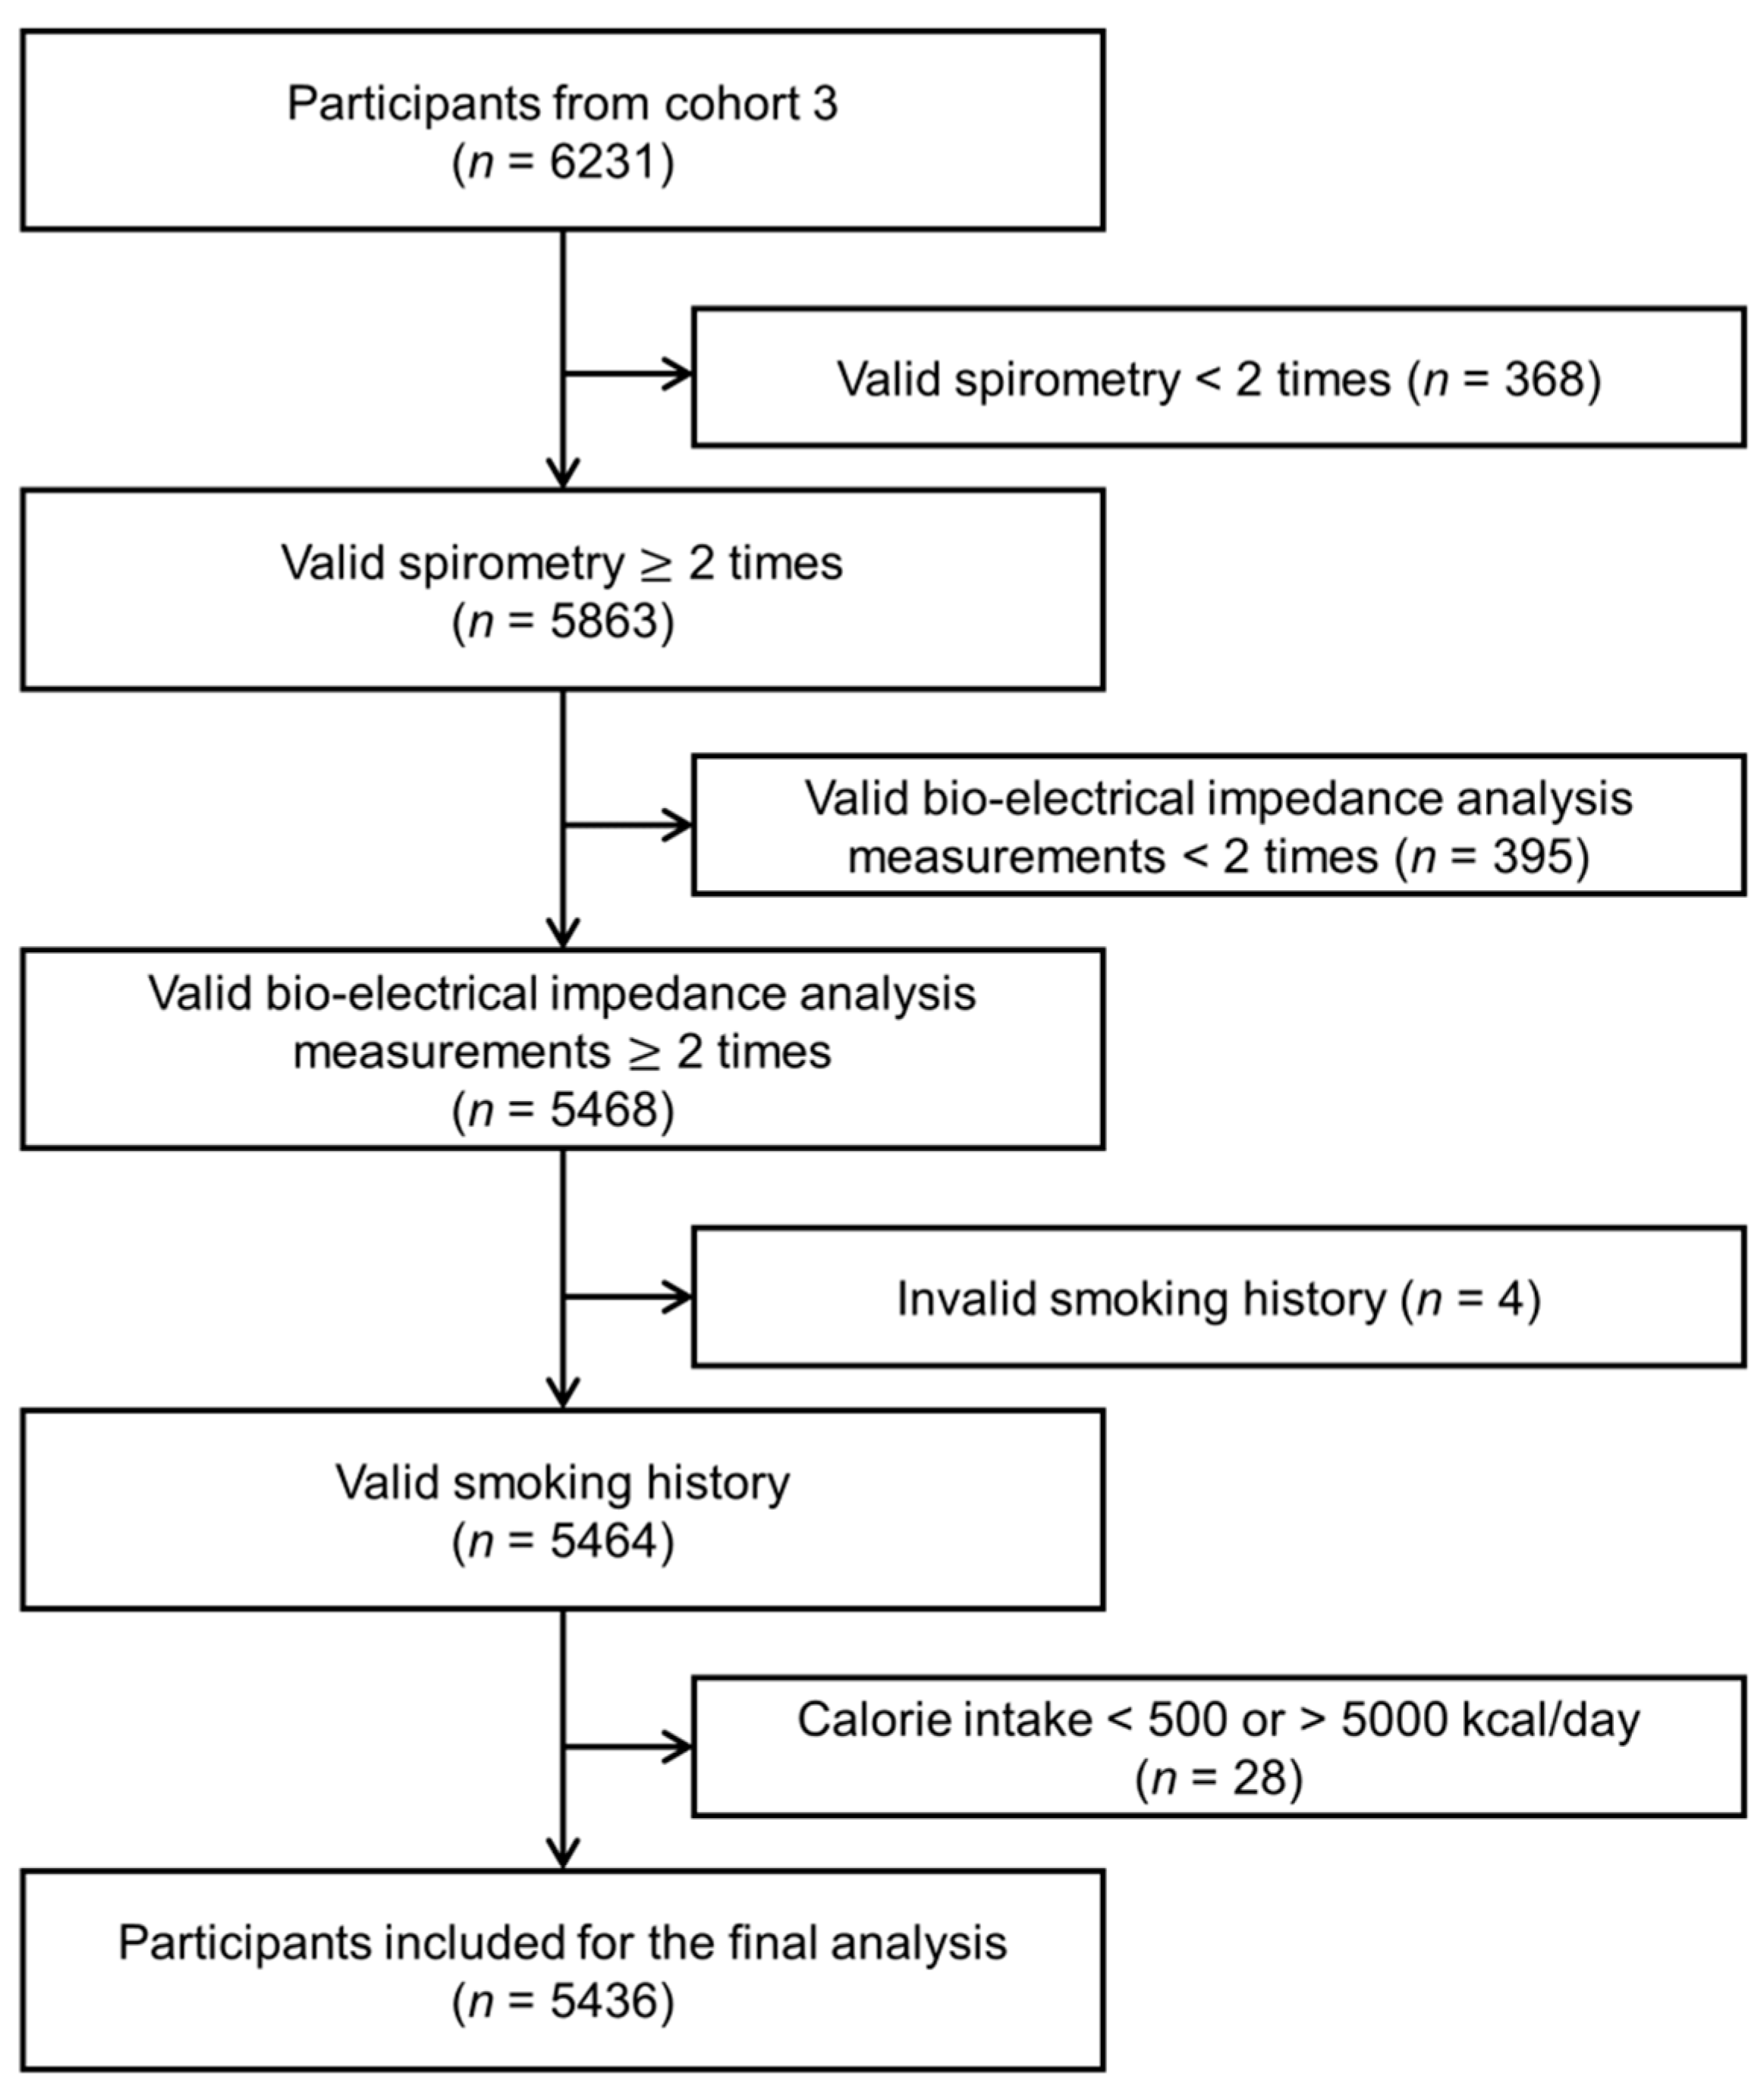
2.1. Study Population
2.2. Dietary Assessment
2.3. Identification of Dietary Patterns
2.4. Assessment of Lung Function
2.5. Statistical Analysis
3. Results
3.1. Baseline Characteristics
3.2. Dietary Patterns among Men and Women
3.3. Dietary Patterns and Lung Function Measurements
3.4. Dietary Patterns and COPD
4. Discussion
5. Conclusions
Supplementary Materials
Author Contributions
Funding
Institutional Review Board Statement
Informed Consent Statement
Data Availability Statement
Conflicts of Interest
References
- Ahn, Y.; Kwon, E.; Shim, J.E.; Park, M.K.; Joo, Y.; Kimm, K.; Park, C.; Kim, D.H. Validation and reproducibility of food frequency questionnaire for Korean genome epidemiologic study. Eur. J. Clin. Nutr. 2007, 61, 1435–1441. [Google Scholar] [CrossRef]
- Lange, P.; Ahmed, E.; Lahmar, Z.M.; Martinez, F.J.; Bourdin, A. Natural history and mechanisms of COPD. Respirology 2021, 26, 298–321. [Google Scholar] [CrossRef]
- Rabe, K.F. Global initiative for chronic obstructive lung disease. Global strategy for the diagnosis, management, and prevention of chronic obstructive pulmonary disease. Gold executive summary. Am. J. Respir. Crit. Care Med. 2007, 176, 532–555. [Google Scholar] [CrossRef]
- Mannino, D.M.; Buist, A.S. Global burden of COPD: Risk factors, prevalence, and future trends. Lancet 2007, 370, 765–773. [Google Scholar] [CrossRef]
- World Health Organization. Global Action Plan for the Prevention and Control of Noncommunicable Diseases 2013–2020; World Health Organization: Geneva, Switzerland, 2013. [Google Scholar]
- Behrendt, C.E. Mild and moderate-to-severe copd in nonsmokers: Distinct demographic profiles. Chest 2005, 128, 1239–1244. [Google Scholar] [CrossRef] [Green Version]
- Celli, B.R.; Halbert, R.; Nordyke, R.J.; Schau, B. Airway obstruction in never smokers: Results from the Third National Health and Nutrition Examination Survey. Am. J. Med. 2005, 118, 1364–1372. [Google Scholar] [CrossRef]
- Schulze, M.B.; A Martínez-González, M.; Fung, T.T.; Lichtenstein, A.H.; Forouhi, N. Food based dietary patterns and chronic disease prevention. BMJ 2018, 361, k2396. [Google Scholar] [CrossRef] [Green Version]
- Panagiotakos, D.B.; Pitsavos, C.; Skoumas, Y.; Stefanadis, C. The association between food patterns and the metabolic syn-drome using principal components analysis: The attica study. J. Am. Diet. Assoc. 2007, 107, 979–987. [Google Scholar] [CrossRef] [PubMed]
- Rumawas, M.E.; Meigs, J.B.; Dwyer, J.; McKeown, N.M.; Jacques, P.F. Mediterranean-style dietary pattern, reduced risk of metabolic syndrome traits, and incidence in the Framingham Offspring Cohort. Am. J. Clin. Nutr. 2009, 90, 1608–1614. [Google Scholar] [CrossRef] [Green Version]
- Scoditti, E.; Massaro, M.; Garbarino, S.; Toraldo, D.M. Role of Diet in Chronic Obstructive Pulmonary Disease Prevention and Treatment. Nutrients 2019, 11, 1357. [Google Scholar] [CrossRef] [Green Version]
- Lee, S.-A.; Joshi, P.; Kim, W.J. The effect of dietary antioxidant on the COPD risk: The community-based KoGES (Ansan–Anseong) cohort. Int. J. Chronic Obstr. Pulm. Dis. 2015, 10, 2159–2168. [Google Scholar] [CrossRef] [PubMed] [Green Version]
- Kelly, Y.; Sacker, A.; Marmot, M. Nutrition and respiratory health in adults: Findings from the Health Survey for Scotland. Eur. Respir. J. 2003, 21, 664–671. [Google Scholar] [CrossRef] [PubMed] [Green Version]
- Santos, R.D.O.; Gorgulho, B.M.; De Castro, M.A.; Fisberg, R.M.; Marchioni, D.M.; Baltar, V.T. Principal Component Analysis and Factor Analysis: Differences and similarities in Nutritional Epidemiology application. Rev. Bras. Epidemiol. 2019, 22, e190041. [Google Scholar] [CrossRef] [Green Version]
- Hu, F.B. Dietary pattern analysis: A new direction in nutritional epidemiology. Curr. Opin. Lipidol. 2002, 13, 3–9. [Google Scholar] [CrossRef]
- Datta, A.; Matlock, M.K.; Le Dang, N.; Moulin, T.; Woeltje, K.F.; Yanik, E.L.; Swamidass, S.J. ‘Black box’to ‘conversation-al’machine learning: Ondansetron reduces risk of hospital-acquired venous thromboembolism. IEEE J. Biomed. Health Inform. 2020, 25, 2204–2214. [Google Scholar] [CrossRef] [PubMed]
- Parvizian, M.K.; Dhaliwal, M.; Li, J.; Satia, I.; Kurmi, O.P. Relationship between dietary patterns and COPD: A systematic review and meta-analysis. ERJ Open Res. 2020, 6. [Google Scholar] [CrossRef]
- Cho, Y.; Chung, H.-K.; Kim, S.-S.; Shin, M.-J. Dietary patterns and pulmonary function in Korean women: Findings from the Korea National Health and Nutrition Examination Survey 2007–2011. Food Chem. Toxicol. 2014, 74, 177–183. [Google Scholar] [CrossRef] [PubMed]
- Kim, Y.; Han, B.-G.; Group, K. Cohort profile: The Korean Genome and Epidemiology Study (KOGES) consortium. Int. J. Epidemiol. 2017, 46, e20. [Google Scholar] [CrossRef]
- Chung, S.; Kim, M.S.; Kwock, C.K. Dietary Patterns May Be Nonproportional Hazards for the Incidence of Type 2 Diabetes: Evidence from Korean Adult Females. Nutrients 2019, 11, 2522. [Google Scholar] [CrossRef] [PubMed] [Green Version]
- Son, J.W.; Lee, S.S.; Kim, S.R.; Yoo, S.J.; Cha, B.Y.; Son, H.Y.; Cho, N.H. Low muscle mass and risk of type 2 diabetes in middle-aged and older adults: Findings from the KoGES. Diabetologia 2017, 60, 865–872. [Google Scholar] [CrossRef] [Green Version]
- Lee, J.; Kim, J. Association between Dietary Pattern and Incidence of Cholesterolemia in Korean Adults: The Korean Genome and Epidemiology Study. Nutrients 2018, 10, 53. [Google Scholar] [CrossRef] [Green Version]
- Ahn, Y.-J.; Park, Y.-J.; Park, S.-J.; Min, H.-S.; Kwak, H.-K.; Oh, K.-S.; Park, C. Dietary patterns and prevalence odds ratio in middle-aged adults of rural and mid-size city in korean genome epidemiology study. J. Nutr. Health 2007, 40, 259–269. [Google Scholar]
- Shin, M.-K.; Kim, Y.-S.; Kim, J.-H.; Kim, S.-H.; Kim, Y. Dietary patterns and their associations with the diet quality in-dex-international (dqi-i) in korean women with gestational diabetes mellitus. Clin. Nutr. Res. 2015, 4, 216. [Google Scholar] [CrossRef] [Green Version]
- Miller, M.R.; Hankinson, J.; Brusasco, V.; Burgos, F.; Casaburi, R.; Coates, A.; Crapo, R.; Enright, P.; Van Der Grinten, C.; Gus-tafsson, P. Standardisation of spirometry. Eur. Respir. J. 2005, 26, 319–338. [Google Scholar] [CrossRef] [Green Version]
- Vestbo, J.; Hurd, S.S.; Agustí, A.G.; Jones, P.W.; Vogelmeier, C.; Anzueto, A.; Barnes, P.J.; Fabbri, L.M.; Martinez, F.J.; Nishi-mura, M. Global strategy for the diagnosis, management, and prevention of chronic obstructive pulmonary disease: Gold ex-ecutive summary. Am. J. Respir. Crit. Care Med. 2013, 187, 347–365. [Google Scholar] [CrossRef] [PubMed]
- Varraso, R.; Fung, T.T.; Hu, F.B.; Willett, W.; Camargo, C.A. Prospective study of dietary patterns and chronic obstructive pulmonary disease among US men. Thorax 2007, 62, 786–791. [Google Scholar] [CrossRef] [PubMed] [Green Version]
- Varraso, R.; Fung, T.T.; Barr, R.G.; Hu, F.B.; Willett, W.; Camargo Jr, C.A. Prospective study of dietary patterns and chronic obstructive pulmonary disease among us women. Am. J. Clin. Nutr. 2007, 86, 488–495. [Google Scholar] [CrossRef] [PubMed] [Green Version]
- Zheng, P.-F.; Shu, L.; Si, C.-J.; Zhang, X.-Y.; Yu, X.-L.; Gao, W. Dietary Patterns and Chronic Obstructive Pulmonary Disease: A Meta-analysis. COPD J. Chronic Obstr. Pulm. Dis. 2015, 13, 515–522. [Google Scholar] [CrossRef]
- McKeever, T.M.; Lewis, S.A.; Cassano, P.A.; Ocke, M.; Burney, P.; Britton, J.; Smit, H.A. Patterns of dietary intake and relation to respiratory disease, forced expiratory volume in 1 s, and decline in 5-y forced expiratory volume. Am. J. Clin. Nutr. 2010, 92, 408–415. [Google Scholar] [CrossRef] [Green Version]
- Hagander, B.; Asp, N.-G.; Efendić, S.; Nilsson-Ehle, P.; Scherstén, B. Dietary fiber decreases fasting blood glucose levels and plasma ldl concentration in noninsulin-dependent diabetes mellitus patients. Am. J. Clin. Nutr. 1988, 47, 852–858. [Google Scholar] [CrossRef] [Green Version]
- King, D.E. Dietary fiber, inflammation, and cardiovascular disease. Mol. Nutr. Food Res. 2005, 49, 594–600. [Google Scholar] [CrossRef] [PubMed]
- Lin, Y.-C.; Wu, T.-C.; Chen, P.-Y.; Hsieh, L.-Y.; Yeh, S.-L. Comparison of plasma and intake levels of antioxidant nutrients in patients with chronic obstructive pulmonary disease and healthy people in Taiwan: A case-control study. Asia Pac. J. Clin. Nutr. 2010, 19, 393–401. [Google Scholar]
- Laudisio, A.; Costanzo, L.; Di Gioia, C.; Delussu, A.S.; Traballesi, M.; Gemma, A.; Incalzi, R.A. Dietary intake of elderly outpatients with chronic obstructive pulmonary disease. Arch. Gerontol. Geriatr. 2016, 64, 75–81. [Google Scholar] [CrossRef] [PubMed]
- Rodríguez-Rodríguez, E.; Ortega, R.M.; Andrés, P.; Aparicio, A.; González-Rodríguez, L.G.; López-Sobaler, A.M.; Navia, B.; Perea, J.M.; Rodríguez-Rodríguez, P. Antioxidant status in a group of institutionalised elderly people with chronic obstructive pulmonary disease. Br. J. Nutr. 2016, 115, 1740–1747. [Google Scholar] [CrossRef] [PubMed] [Green Version]
- Walda, I.C.; Tabak, C.; Smit, H.A.; Räsänen, L.; Fidanza, F.; Menotti, A.; Nissinen, A.; Feskens, E.J.M.; Kromhout, D. Diet and 20-year chronic obstructive pulmonary disease mortality in middle-aged men from three European countries. Eur. J. Clin. Nutr. 2002, 56, 638–643. [Google Scholar] [CrossRef] [PubMed] [Green Version]
- Kaluza, J.; Harris, H.R.; Linden, A.; Wolk, A. Long-term consumption of fruits and vegetables and risk of chronic obstructive pulmonary disease: A prospective cohort study of women. Int. J. Epidemiol. 2018, 47, 1897–1909. [Google Scholar] [CrossRef] [PubMed]
- De Filippis, F.; Pellegrini, N.; Vannini, L.; Jeffery, I.B.; La Storia, A.; Laghi, L.; Serrazanetti, D.I.; Di Cagno, R.; Ferrocino, I.; Lazzi, C.; et al. High-level adherence to a Mediterranean diet beneficially impacts the gut microbiota and associated metabolome. Gut 2016, 65, 1812–1821. [Google Scholar] [CrossRef]
- Wood, L.G.; Attia, J.; McElduff, P.; McEvoy, M.; Gibson, P. Assessment of dietary fat intake and innate immune activation as risk factors for impaired lung function. Eur. J. Clin. Nutr. 2010, 64, 818–825. [Google Scholar] [CrossRef] [PubMed] [Green Version]
- Brigham, E.P.; Steffen, L.M.; London, S.; Boyce, D.; Diette, G.B.; Hansel, N.N.; Rice, J.; McCormack, M.C. Diet Pattern and Respiratory Morbidity in the Atherosclerosis Risk in Communities Study. Ann. Am. Thorac. Soc. 2018, 15, 675–682. [Google Scholar] [CrossRef]
- McClean, K.; Kee, F.; Young, I.; Elborn, J. Obesity and the lung: 1 epidemiology. Thorax 2008, 63, 649–654. [Google Scholar] [CrossRef] [Green Version]
- Mancuso, P. Obesity and lung inflammation. J. Appl. Physiol. 2010, 108, 722–728. [Google Scholar] [CrossRef] [PubMed] [Green Version]
- Salome, C.M.; King, G.G.; Berend, N. Physiology of obesity and effects on lung function. J. Appl. Physiol. 2010, 108, 206–211. [Google Scholar] [CrossRef] [PubMed] [Green Version]
- Lange, P.; Groth, S.; Kastrup, J.; Mortensen, J.; Appleyard, M.; Nyboe, J.; Jensen, G.; Schnohr, P. Diabetes mellitus, plasma glucose and lung function in a cross-sectional population study. Eur. Respir. J. 1989, 2, 14–19. [Google Scholar]
- Lange, P.; Groth, S.; Mortensen, J.; Appleyard, M.; Nyboe, J.; Schnohr, P.; Jensen, G. Diabetes mellitus and ventilatory capacity: A five year follow-up study. Eur. Respir. J. 1990, 3, 288–292. [Google Scholar]
- Enright, P.L.; Kronmal, R.A.; Higgins, M.; Schenker, M.; Haponik, E.F. Spirometry Reference Values for Women and Men 65 to 85 Years of Age: Cardiovascular Health Study. Am. Rev. Respir. Dis. 1993, 147, 125–133. [Google Scholar] [CrossRef] [PubMed]
- Walter, R.E.; Beiser, A.; Givelber, R.J.; O’Connor, G.T.; Gottlieb, D.J. Association between glycemic state and lung function: The framingham heart study. Am. J. Respir. Crit. Care Med. 2003, 167, 911–916. [Google Scholar] [CrossRef] [PubMed]
- Esposito, K.; Nappo, F.; Marfella, R.; Giugliano, G.; Giugliano, F.; Ciotola, M.; Quagliaro, L.; Ceriello, A.; Giugliano, D. In-flammatory cytokine concentrations are acutely increased by hyperglycemia in humans: Role of oxidative stress. Circulation 2002, 106, 2067–2072. [Google Scholar] [CrossRef] [Green Version]
- Forgiarini Junior, L.A.; Kretzmann, N.A.; Porawski, M.; Dias, A.S.; Marroni, N.A.P. Experimental diabetes mellitus: Oxidative stress and changes in lung structure. J. Bras. Pneumol. 2009, 35, 788–791. [Google Scholar] [CrossRef] [PubMed] [Green Version]
- Hirayama, F.; Lee, A.H.; Yasukawa, K.; Ishihara, Y.; Shinjo, M. Caffeine Intake and the Risk of Chronic Obstructive Pulmonary Disease in Japanese Adults. J. Caffeine Res. 2012, 2, 176–179. [Google Scholar] [CrossRef] [Green Version]
- Lopes, P.; Alfaro, T.; Cunha, R.; Cordeiro, C.R. Caffeine consumption and exacerbations of chronic obstructive pulmonary disease: Retrospective study. Rev. Port. Pneumol. Engl. Ed. 2015, 21, 271–275. [Google Scholar] [CrossRef] [PubMed]
- Holmen, T.; Barrett-Connor, E.; Clausen, J.; Langhammer, A.; Holmen, J.; Bjermer, L. Gender differences in the impact of adolescent smoking on lung function and respiratory symptoms. The Nord-Trøndelag Health Study, Norway, 1995–1997. Respir. Med. 2002, 96, 796–804. [Google Scholar] [CrossRef] [Green Version]
- Fenger, R.V.; González-Quintela, A.; Vidal, C.; Husemoen, L.-L.; Skaaby, T.; Thuesen, B.H.; Aadahl, M.; Madsen, F.; Linneberg, A. The longitudinal relationship of changes of adiposity to changes in pulmonary function and risk of asthma in a general adult population. BMC Pulm. Med. 2014, 14, 208. [Google Scholar] [CrossRef] [PubMed] [Green Version]
- Lee, S.-A.; Joshi, P.; Kim, Y.; Kang, D.; Kim, W.J. The Association of Dietary Macronutrients with Lung Function in Healthy Adults Using the Ansan-Ansung Cohort Study. Nutrients 2020, 12, 2688. [Google Scholar] [CrossRef] [PubMed]
- Thorpe, M.G.; Milte, C.M.; Crawford, D.; McNaughton, S.A. Education and lifestyle predict change in dietary patterns and diet quality of adults 55 years and over. Nutr. J. 2019, 18, 67. [Google Scholar] [CrossRef] [PubMed] [Green Version]
- Cespedes, E.M.; Hu, F.B. Dietary patterns: From nutritional epidemiologic analysis to national guidelines. Am. J. Clin. Nutr. 2015, 101, 899–900. [Google Scholar] [CrossRef] [Green Version]
- McGuire, S. Scientific report of the 2015 dietary guidelines advisory committee. Washington, dc: Us departments of agriculture and health and human services, 2015. Adv. Nutr. 2016, 7, 202–204. [Google Scholar] [CrossRef] [Green Version]
- Datta, A.; Flynn, N.R.; Barnette, D.A.; Woeltje, K.F.; Miller, G.P.; Swamidass, S.J. Machine learning liver-injuring drug in-teractions with non-steroidal anti-inflammatory drugs (nsaids) from a retrospective electronic health record (ehr) cohort. PLoS Comput. Biol. 2021, 17, e1009053. [Google Scholar] [CrossRef]


| Food Groups | Food Items |
|---|---|
| White rice | White rice |
| Whole grains | Cooked rice with beans, cooked rice with other cereals, cereal powder |
| Noodles and Dumplings | Ramyun, noodles, jajangmyeon/jjamppong, dumplings, starch vermicelli |
| Rice cakes | Rice cakes, rice-cake soup |
| Cereals and Snacks | Cornflakes, cookie/cracker/snacks |
| Bread | Bread, cake/chocopie |
| Pizza and hamburger | Pizza/hamburger |
| Potatoes and sweet potatoes | Sweet potatoes, potatoes |
| Starch jelly | Starch jelly |
| Sweets | Candy/chocolate, coffee sugar |
| Nuts | Nuts, seeds |
| Legumes | Beans, tofu, soy milk |
| Vegetables | Radish/salted radish, cabbages, spinach, lettuce, perilla leaf, salad, green vegetables, doraji/deoduck (kind of white root), bean sprouts, bracken/sweet potato stalk, red pepper leaves, leek/water dropwort, cucumber, carrot/carrot juice, onion, green pepper, pumpkin, pumpkin gruel/pumpkin juice |
| Kimchi | Kimchi, kkakduki/small radish Kimchi, Kimchi with liquid, other Kimchi, Korean style pickles |
| Mushrooms | Mushrooms |
| Fruits | Strawberry, muskmelon/melon, watermelon, peach, banana, persimmon, tangerine, pear, apple/apple juice, orange/orange juice, grape/grape juice, tomato/tomato juice |
| Meat products | Pork, beef, ham/sausage, chicken |
| Eggs | Eggs |
| Fish and shellfish | Mackerel/pacific saury/Spanish mackerel, hair tail, eel, yellow croaker, Alaska pollack, crab, clam, oyster, shrimp, dried anchovy, canned tuna, salted-fermented fish, fish paste, sushi |
| Seaweeds | Brown seaweed, sea mustard, dried laver |
| Dairy products | Milk, yoghourt, cheese, ice cream |
| Soups | Soybean paste/stew with soybean paste |
| Seasoning | Jam/honey/butter/margarine |
| Oils and fats | Coffee cream |
| Coffee | Coffee |
| Carbonated beverages | Carbonated beverages |
| Other beverages | Green tea, other drinks |
| Variables | Total (n = 5436) | Men (n = 2599) | Women (n = 2837) | p-Value |
|---|---|---|---|---|
| Age, years | 54.6 8.2 | 54.2 8.0 | 55.0 8.4 | <0.0001 |
| Smoking history, n (%) | 1690 (31.1) | 1656 (63.7) | 34 (1.2) | <0.0001 |
| Height, cm | 160.5 8.5 | 167.2 5.7 | 154.3 5.5 | <0.0001 |
| Weight, kg | 63.4 9.8 | 68.2 9.1 | 58.9 8.1 | <0.0001 |
| Waist circumference, cm | 83.9 8.5 | 85.0 7.4 | 82.9 9.3 | <0.0001 |
| Body mass index, kg/m2 | 24.6 2.9 | 24.4 2.7 | 24.8 3.1 | <0.0001 |
| <18.5, n (%) | 61 (1.1) | 35 (1.4) | 26 (0.9) | 0.060 |
| 18.5–25, n (%) | 3048 (56.1) | 1488 (57.3) | 1560 (55.0) | |
| ≥25, n (%) | 2327 (42.8) | 1076 (41.4) | 1251 (44.1) | |
| Fat mass index, kg/m2 | 6.6 2.3 | 5.2 1.6 | 7.8 2.2 | <0.0001 |
| Muscle mass index, kg/m2 | 17.0 1.7 | 18.1 1.5 | 16.0 1.2 | <0.0001 |
| Fat mass, kg | 16.7 5.2 | 14.7 4.6 | 18.5 5.1 | <0.0001 |
| Lean mass, kg | 44.3 8.1 | 50.9 5.8 | 38.2 4.1 | <0.0001 |
| hsCRP, mg/L | 1.5 3.3 | 1.6 3.7 | 1.4 2.9 | 0.006 |
| Lung function parameters | ||||
| FEV1, L | 2.8 0.7 | 3.3 0.6 | 2.4 0.4 | <0.0001 |
| FVC, L | 3.6 0.8 | 4.2 0.6 | 3.0 0.5 | <0.0001 |
| FEV1, % Pred. | 111.5 15.7 | 106.5 14.3 | 116.1 15.6 | <0.0001 |
| FVC, % Pred. | 104.4 12.7 | 102.1 12.1 | 106.5 13.0 | <0.0001 |
| FEV1/FVC ratio | 79.1 6.4 | 77.0 6.9 | 81.0 5.2 | <0.0001 |
| Total energy, kcal/day | 1797.8 534.4 | 1918.0 537.0 | 1687.7 507.7 | <0.0001 |
| % of energy from carbohydrate | 72.4 6.5 | 71.3 6.3 | 73.4 6.4 | <0.0001 |
| % of energy from protein | 13.0 2.3 | 13.1 2.2 | 12.9 2.4 | 0.060 |
| % of energy from fat | 13.4 5.1 | 14.4 5.0 | 12.6 5.1 | <0.0001 |
| Protein, g/day | 59.0 23.0 | 63.1 22.6 | 55.2 22.8 | <0.0001 |
| Fat, g/day | 27.9 16.7 | 31.6 17.2 | 24.5 15.4 | <0.0001 |
| Carbohydrate, g/day | 322.6 89.7 | 339.3 90.6 | 307.4 86.0 | <0.0001 |
| Calcium, mg/day | 431.6 242.1 | 425.8 228.0 | 436.8 254.3 | 0.090 |
| Iron, mg/day | 9.8 4.3 | 10.0 4.1 | 9.5 4.4 | <0.0001 |
| Vitamin A, RE/day | 466.9 330.0 | 472.1 307.4 | 462.1 349.4 | 0.260 |
| Sodium, mg/day | 2667.2 1461.2 | 2819.7 1442.2 | 2527.5 1464.7 | <0.0001 |
| Vitamin B1, mg/day | 1.0 0.4 | 1.1 0.4 | 0.9 0.4 | <0.0001 |
| Vitamin B2, mg/day | 0.9 0.4 | 0.9 0.4 | 0.9 0.4 | <0.0001 |
| Vitamin C, mg/day | 104.0 61.8 | 99.1 57.0 | 108.5 65.6 | <0.0001 |
| Zinc, mg/day | 7.8 3.1 | 8.3 3.3 | 7.3 2.9 | <0.0001 |
| Vitamin B6, mg/day | 1.6 0.6 | 1.6 0.6 | 1.5 0.6 | <0.0001 |
| Folate, ug/day | 218.0 115.6 | 218.2 109.8 | 217.7 120.7 | 0.870 |
| Fiber, g/day | 5.9 2.7 | 5.9 2.6 | 5.9 2.7 | 0.370 |
| Vitamin E, mg/day | 8.1 4.1 | 8.3 3.9 | 7.9 4.2 | <0.0001 |
| Cholesterol, mg/day | 150.6 115.0 | 162.6 114.5 | 139.6 114.4 | <0.0001 |
| Foods or Food Groups | Pattern 1 (Prudent) | Pattern 2 (Coffee, Fat, and Sweet) | Pattern 3 (Westernized) | Pattern 4 (White Rice) |
|---|---|---|---|---|
| Men | ||||
| White rice | −0.048 | 0.043 | 0.011 | 0.937 |
| Whole grains | 0.088 | −0.026 | −0.037 | −0.934 |
| Noodles and Dumplings | 0.120 | 0.015 | 0.301 | 0.162 |
| Rice cakes | 0.070 | −0.049 | 0.268 | −0.036 |
| Cereals and Snacks | 0.021 | 0.087 | 0.486 | −0.008 |
| Bread | −0.018 | 0.034 | 0.616 | 0.041 |
| Pizza and hamburger | −0.040 | 0.129 | 0.405 | 0.068 |
| Potatoes and sweet potatoes | 0.356 | −0.073 | 0.182 | −0.052 |
| Starch jelly | 0.374 | 0.036 | −0.039 | −0.001 |
| Sweets | 0.062 | 0.917 | 0.066 | 0.018 |
| Nuts | 0.124 | 0.016 | 0.314 | −0.056 |
| Legumes | 0.485 | −0.015 | 0.105 | −0.024 |
| Vegetables | 0.767 | −0.026 | 0.086 | −0.002 |
| Kimchi | 0.495 | 0.059 | −0.205 | 0.065 |
| Mushrooms | 0.513 | 0.033 | 0.223 | −0.083 |
| Fruits | 0.366 | 0.095 | 0.371 | −0.172 |
| Meat products | 0.458 | 0.045 | 0.179 | 0.138 |
| Eggs | 0.198 | 0.016 | 0.332 | 0.000 |
| Fish and shellfish | 0.592 | 0.056 | 0.300 | −0.031 |
| Seaweeds | 0.563 | −0.003 | 0.067 | −0.018 |
| Dairy products | 0.140 | −0.064 | 0.427 | −0.122 |
| Soups | 0.467 | 0.019 | −0.087 | −0.003 |
| Seasoning | −0.081 | 0.0003 | 0.465 | 0.049 |
| Oils and fats | 0.026 | 0.915 | 0.067 | 0.019 |
| Coffee | 0.062 | 0.915 | 0.044 | 0.037 |
| Carbonated beverages | 0.089 | 0.014 | 0.288 | 0.175 |
| Other beverages | 0.302 | 0.032 | 0.164 | −0.071 |
| Variance Explained by Each Factor | 3.05 | 2.58 | 2.09 | 1.91 |
| Women | ||||
| White rice | −0.043 | 0.046 | −0.009 | 0.929 |
| Whole grains | 0.041 | −0.050 | −0.062 | −0.907 |
| Noodles & Dumplings | 0.068 | 0.082 | 0.395 | 0.135 |
| Rice cakes | 0.145 | −0.031 | 0.293 | 0.013 |
| Cereals and Snacks | −0.059 | 0.109 | 0.548 | 0.014 |
| Bread | 0.011 | 0.073 | 0.645 | 0.023 |
| Pizza and hamburger | −0.060 | 0.047 | 0.427 | −0.065 |
| Potatoes and sweet potatoes | 0.503 | −0.037 | 0.045 | −0.009 |
| Starch jelly | 0.146 | −0.035 | 0.392 | 0.006 |
| Sweets | 0.047 | 0.869 | 0.038 | 0.005 |
| Nuts | 0.142 | 0.075 | 0.312 | −0.049 |
| Legumes | 0.447 | −0.016 | 0.155 | −0.051 |
| Vegetables | 0.801 | −0.026 | 0.109 | 0.016 |
| Kimchi | 0.520 | 0.081 | −0.177 | 0.126 |
| Mushrooms | 0.474 | −0.037 | 0.269 | −0.066 |
| Fruits | 0.301 | 0.017 | 0.371 | −0.185 |
| Meat products | 0.422 | 0.049 | 0.373 | 0.065 |
| Eggs | 0.292 | 0.131 | 0.231 | −0.103 |
| Fish and shellfish | 0.602 | 0.041 | 0.338 | −0.051 |
| Seaweeds | 0.630 | −0.007 | 0.013 | 0.020 |
| Dairy products | 0.268 | 0.041 | 0.293 | −0.089 |
| Soups | 0.469 | 0.030 | −0.169 | −0.0001 |
| Seasoning | 0.008 | −0.044 | 0.428 | 0.014 |
| Oils and fats | −0.039 | 0.883 | 0.029 | 0.013 |
| Coffee | 0.046 | 0.851 | 0.081 | 0.019 |
| Carbonated beverages | 0.029 | 0.132 | 0.125 | 0.069 |
| Other beverages | 0.288 | 0.100 | 0.179 | −0.103 |
| Variance Explained by Each Factor | 3.16 | 2.36 | 2.33 | 1.81 |
| Pattern 1 (Prudent) | Pattern 2 (Coffee, Fat, and Sweet) | Pattern 3 (Westernized) | Pattern 4 (White Rice) | |||||||||
|---|---|---|---|---|---|---|---|---|---|---|---|---|
| ß | 95% CI | p | ß | 95% CI | p | ß | 95% CI | p | ß | 95% CI | p | |
| FEV1/FVC, % | ||||||||||||
| Model 1 | 0.0006 | −0.006 to 0.007 | 0.860 | −0.014 | −0.020 to −0.008 | <0.0001 | 0.007 | 0.001 to 0.013 | 0.030 | −0.006 | −0.012 to −0.00006 | 0.050 |
| Model 2 | −0.0001 | −0.006 to 0.006 | 0.980 | −0.007 | −0.013 to −0.0005 | 0.030 | 0.005 | −0.001 to 0.011 | 0.100 | −0.005 | −0.011 to 0.002 | 0.150 |
| Model 3 | −0.002 | −0.007 to 0.003 | 0.450 | −0.007 | −0.013 to −0.001 | 0.020 | 0.004 | −0.002 to 0.009 | 0.180 | −0.004 | −0.010 to 0.002 | 0.230 |
| Model 4 | −0.002 | −0.007 to 0.003 | 0.470 | −0.007 | −0.013 to −0.001 | 0.020 | 0.004 | −0.001 to 0.009 | 0.190 | −0.004 | −0.010 to 0.003 | 0.250 |
| FEV1, % Pred. | ||||||||||||
| Model 1 | 0.0003 | −0.002 to 0.003 | 0.850 | −0.003 | −0.006 to −0.0002 | 0.040 | 0.003 | 0.001 to 0.006 | 0.020 | −0.0004 | −0.003 to 0.002 | 0.780 |
| Model 2 | 0.0001 | −0.003 to 0.003 | 0.970 | −0.0004 | −0.003 to 0.002 | 0.770 | 0.003 | 0.0001 to 0.006 | 0.040 | 0.0002 | −0.002 to 0.003 | 0.870 |
| Model 3 | −0.0008 | −0.003 to 0.002 | 0.480 | −0.0007 | −0.003 to 0.002 | 0.580 | 0.002 | −0.0005 to 0.004 | 0.120 | 0.0003 | −0.002 to 0.003 | 0.830 |
| Model 4 | −0.0007 | −0.003 to 0.002 | 0.530 | −0.0007 | −0.003 to 0.002 | 0.580 | 0.002 | −0.0006 to 0.004 | 0.140 | 0.0005 | −0.002 to 0.003 | 0.730 |
| FVC, % Pred. | ||||||||||||
| Model 1 | −0.0007 | −0.004 to 0.003 | 0.680 | 0.001 | −0.002 to 0.004 | 0.410 | 0.002 | −0.001 to 0.005 | 0.290 | 0.002 | −0.0008 to 0.003 | 0.140 |
| Model 2 | −0.0007 | −0.004 to 0.002 | 0.660 | 0.002 | −0.001 to 0.005 | 0.220 | 0.002 | −0.002 to 0.005 | 0.330 | 0.003 | −0.0006 to 0.006 | 0.120 |
| Model 3 | −0.0009 | −0.004 to 0.002 | 0.530 | 0.002 | −0.001 to 0.005 | 0.230 | 0.001 | −0.002 to 0.004 | 0.410 | 0.002 | −0.0008 to 0.006 | 0.150 |
| Model 4 | −0.0008 | −0.004 to 0.002 | 0.570 | 0.002 | −0.001 to 0.005 | 0.230 | 0.001 | −0.002 to 0.004 | 0.440 | 0.003 | −0.0007 to 0.006 | 0.120 |
| Pattern 1 (Prudent) | Pattern 2 (Coffee, Fat, and Sweet) | Pattern 3 (Westernized) | Pattern 4 (White Rice) | |||||||||
|---|---|---|---|---|---|---|---|---|---|---|---|---|
| ß | 95% CI | p | ß | 95% CI | p | ß | 95% CI | p | ß | 95% CI | p | |
| FEV1/FVC, % | ||||||||||||
| Model 1 | −0.004 | −0.011 to 0.003 | 0.290 | 0.0002 | −0.007 to 0.007 | 0.960 | −0.006 | −0.013 to 0.001 | 0.090 | 0.002 | −0.005 to 0.010 | 0.540 |
| Model 2 | −0.004 | −0.011 to 0.004 | 0.340 | 0.0009 | −0.006 to 0.008 | 0.810 | −0.006 | −0.013 to 0.001 | 0.100 | 0.002 | −0.005 to 0.010 | 0.520 |
| Model 3 | −0.002 | −0.008 to 0.005 | 0.600 | 0.002 | −0.006 to 0.009 | 0.650 | −0.002 | −0.008 to 0.004 | 0.450 | 0.0009 | −0.006 to 0.008 | 0.800 |
| Model 4 | −0.002 | −0.008 to 0.005 | 0.580 | 0.001 | −0.006 to 0.009 | 0.700 | −0.002 | −0.008 to 0.004 | 0.450 | 0.0008 | −0.006 to 0.008 | 0.840 |
| FEV1, % Pred. | ||||||||||||
| Model 1 | −0.001 | −0.004 to 0.001 | 0.260 | 0.0004 | −0.002 to 0.0029 | 0.720 | −0.0002 | −0.002 to 0.002 | 0.890 | 0.0008 | −0.002 to 0.003 | 0.540 |
| Model 2 | −0.0013 | −0.004 to 0.001 | 0.290 | 0.0007 | −0.002 to 0.003 | 0.560 | −0.0001 | −0.002 to 0.002 | 0.900 | 0.0008 | −0.002 to 0.003 | 0.530 |
| Model 3 | −0.0004 | −0.003 to 0.002 | 0.700 | 0.001 | −0.001 to 0.003 | 0.410 | 0.0005 | −0.001 to 0.003 | 0.610 | 0.0005 | −0.002 to 0.003 | 0.680 |
| Model 4 | −0.0004 | −0.003 to 0.002 | 0.700 | 0.001 | −0.001 to 0.004 | 0.360 | 0.0005 | −0.002 to 0.003 | 0.630 | 0.0006 | −0.002 to 0.003 | 0.630 |
| FVC, % Pred. | ||||||||||||
| Model 1 | −0.0006 | −0.003 to 0.002 | 0.700 | 0.0005 | −0.002 to 0.003 | 0.750 | 0.001 | −0.002 to 0.004 | 0.400 | 0.0002 | −0.003 to 0.003 | 0.910 |
| Model 2 | −0.0005 | −0.003 to 0.002 | 0.720 | 0.0007 | −0.002 to 0.004 | 0.640 | 0.001 | −0.002 to 0.004 | 0.390 | 0.0002 | −0.003 to 0.003 | 0.910 |
| Model 3 | 0.0001 | −0.002 to 0.003 | 0.960 | 0.0008 | −0.002 to 0.004 | 0.560 | 0.001 | −0.001 to 0.004 | 0.330 | 0.0002 | −0.003 to 0.003 | 0.900 |
| Model 4 | 0.0001 | −0.002 to 0.003 | 0.950 | 0.001 | −0.002 to 0.004 | 0.470 | 0.001 | −0.001 to 0.004 | 0.340 | 0.0003 | −0.003 to 0.003 | 0.830 |
| Quartiles of Dietary Pattern Score | ||||||||
|---|---|---|---|---|---|---|---|---|
| Q1 (Lowest) | Q2 | Q3 | Q4 (Highest) | p for Trend | ||||
| OR | 95% CI | OR | 95% CI | OR | 95% CI | |||
| Pattern 1 (Prudent) | ||||||||
| No. of COPD case/subjects | 124/649 | 121/650 | 87/650 | 95/650 | ||||
| Model 1 | 1 (ref.) | 1.11 | 0.83 to 1.50 | 0.83 | 0.61 to 1.15 | 0.89 | 0.65 to 1.22 | 0.290 |
| Model 2 | 1 (ref.) | 1.16 | 0.86 to 1.58 | 0.83 | 0.60 to 1.15 | 0.91 | 0.66 to 1.25 | 0.200 |
| Model 3 | 1 (ref.) | 1.14 | 0.83 to 1.55 | 0.80 | 0.57 to 1.12 | 0.85 | 0.59 to 1.21 | 0.150 |
| Model 4 | 1 (ref.) | 1.12 | 0.82 to 0.82 | 0.79 | 0.56 to 1.10 | 0.84 | 0.59 to 1.20 | 0.150 |
| Pattern 2 (Coffee, Fat, and Sweet) | ||||||||
| No. of COPD case/subjects | 93/649 | 104/650 | 119/650 | 111/650 | ||||
| Model 1 | 1 (ref.) | 1.30 | 0.94 to 1.80 | 1.74 | 1.27 to 2.40 | 1.85 | 1.34 to 2.56 | 0.001 |
| Model 2 | 1 (ref.) | 1.20 | 0.87 to 1.67 | 1.55 | 1.12 to 2.14 | 1.52 | 1.09 to 2.12 | 0.030 |
| Model 3 | 1 (ref.) | 1.25 | 0.90 to 1.74 | 1.59 | 1.15 to 2.21 | 1.56 | 1.11 to 2.19 | 0.020 |
| Model 4 | 1 (ref.) | 1.27 | 0.91 to 1.77 | 1.61 | 1.16 to 2.24 | 1.57 | 1.11 to 2.21 | 0.020 |
| Pattern 3 (Westernized) | ||||||||
| No. of COPD case/subjects | 145/649 | 102/650 | 90/650 | 90/650 | ||||
| Model 1 | 1 (ref.) | 0.83 | 0.62 to 1.13 | 0.79 | 0.58 to 1.07 | 0.84 | 0.62 to 1.15 | 0.440 |
| Model 2 | 1 (ref.) | 0.65 | 0.66 to 1.21 | 0.82 | 0.60 to 1.12 | 0.88 | 0.65 to 1.21 | 0.650 |
| Model 3 | 1 (ref.) | 0.89 | 0.66 to 1.21 | 0.81 | 0.59 to 1.12 | 0.84 | 0.59 to 1.20 | 0.620 |
| Model 4 | 1 (ref.) | 0.89 | 0.66 to 1.21 | 0.82 | 0.59 to 1.13 | 0.85 | 0.59 to 1.21 | 0.660 |
| Pattern 4 (White rice) | ||||||||
| No. of COPD case/subjects | 79/649 | 120/650 | 113/650 | 115/650 | ||||
| Model 1 | 1 (ref.) | 1.47 | 1.06 to 2.03 | 1.40 | 1.01 to 1.95 | 1.57 | 1.13 to 2.18 | 0.040 |
| Model 2 | 1 (ref.) | 1.42 | 1.02 to 1.98 | 1.32 | 0.94 to 1.83 | 1.48 | 1.06 to 2.06 | 0.100 |
| Model 3 | 1 (ref.) | 1.51 | 1.06 to 2.13 | 1.41 | 1.00 to 1.99 | 1.52 | 1.08 to 2.14 | 0.070 |
| Model 4 | 1 (ref.) | 1.48 | 1.05 to 2.10 | 1.39 | 0.98 to 1.96 | 1.50 | 1.07 to 2.11 | 0.090 |
| Quartiles of Dietary Pattern Score | ||||||||
|---|---|---|---|---|---|---|---|---|
| Q1 (Lowest) | Q2 | Q3 | Q4 (Highest) | p for Trend | ||||
| OR | 95% CI | OR | 95% CI | OR | 95% CI | |||
| Pattern 1 (Prudent) | ||||||||
| No. of COPD case/subjects | 20/709 | 24/709 | 27/710 | 31/709 | ||||
| Model 1 | 1 (ref.) | 1.34 | 0.73 to 2.46 | 1.51 | 0.83 to 2.74 | 1.85 | 1.03 to 3.30 | 0.220 |
| Model 2 | 1 (ref.) | 1.34 | 0.73 to 2.47 | 1.51 | 0.83 to 2.73 | 1.85 | 1.03 to 3.30 | 0.220 |
| Model 3 | 1 (ref.) | 1.37 | 0.74 to 2.53 | 1.62 | 0.88 to 2.97 | 2.12 | 1.12 to 4.00 | 0.140 |
| Model 4 | 1 (ref.) | 1.37 | 0.75 to 2.53 | 1.62 | 0.88 to 2.97 | 2.12 | 1.12 to 4.00 | 0.140 |
| Pattern 2 (Coffee, Fat, and Sweet) | ||||||||
| No. of COPD case/subjects | 27/709 | 22/709 | 28/710 | 25/709 | ||||
| Model 1 | 1 (ref.) | 0.86 | 0.48 to 1.52 | 1.19 | 0.69 to 2.05 | 0.96 | 0.55 to 1.68 | 0.720 |
| Model 2 | 1 (ref.) | 0.85 | 0.47 to 1.51 | 1.18 | 0.69 to 2.04 | 0.95 | 0.54 to 1.67 | 0.710 |
| Model 3 | 1 (ref.) | 0.85 | 0.48 to 1.52 | 1.20 | 0.69 to 2.07 | 0.95 | 0.54 to 1.67 | 0.690 |
| Model 4 | 1 (ref.) | 0.85 | 0.48 to 1.52 | 1.20 | 0.69 to 2.07 | 0.95 | 0.54 to 1.67 | 0.700 |
| Pattern 3 (Westernized) | ||||||||
| No. of COPD case/subjects | 45/709 | 21/709 | 15/710 | 21/709 | ||||
| Model 1 | 1 (ref.) | 0.60 | 0.35 to 1.02 | 0.54 | 0.29 to 1.00 | 0.89 | 0.50 to 1.58 | 0.100 |
| Model 2 | 1 (ref.) | 0.60 | 0.35 to 1.02 | 0.54 | 0.29 to 0.99 | 0.89 | 0.50 to 1.57 | 0.100 |
| Model 3 | 1 (ref.) | 0.60 | 0.35 to 1.02 | 0.54 | 0.29 to 1.00 | 0.88 | 0.47 to 1.67 | 0.100 |
| Model 4 | 1 (ref.) | 0.60 | 0.35 to 1.02 | 0.53 | 0.29 to 1.00 | 0.88 | 0.47 to 1.67 | 0.100 |
| Pattern 4 (White rice) | ||||||||
| No. of COPD case/subjects | 21/709 | 26/709 | 34/710 | 21/709 | ||||
| Model 1 | 1 (ref.) | 1.02 | 0.56 to 1.84 | 1.40 | 0.80 to 2.45 | 0.88 | 0.47 to 1.64 | 0.370 |
| Model 2 | 1 (ref.) | 1.02 | 0.56 to 1.84 | 1.40 | 0.80 to 2.45 | 0.88 | 0.47 to 1.63 | 0.370 |
| Model 3 | 1 (ref.) | 1.01 | 0.55 to 1.88 | 1.39 | 0.77 to 2.51 | 0.87 | 0.45 to 1.70 | 0.370 |
| Model 4 | 1 (ref.) | 1.01 | 0.55 to 1.88 | 1.39 | 0.77 to 2.50 | 0.87 | 0.45 to 1.69 | 0.360 |
Publisher’s Note: MDPI stays neutral with regard to jurisdictional claims in published maps and institutional affiliations. |
© 2021 by the authors. Licensee MDPI, Basel, Switzerland. This article is an open access article distributed under the terms and conditions of the Creative Commons Attribution (CC BY) license (https://creativecommons.org/licenses/by/4.0/).
Share and Cite
Shin, M.-K.; Kwak, S.H.; Park, Y.; Jung, J.Y.; Kim, Y.S.; Kang, Y.A. Association between Dietary Patterns and Chronic Obstructive Pulmonary Disease in Korean Adults: The Korean Genome and Epidemiology Study. Nutrients 2021, 13, 4348. https://doi.org/10.3390/nu13124348
Shin M-K, Kwak SH, Park Y, Jung JY, Kim YS, Kang YA. Association between Dietary Patterns and Chronic Obstructive Pulmonary Disease in Korean Adults: The Korean Genome and Epidemiology Study. Nutrients. 2021; 13(12):4348. https://doi.org/10.3390/nu13124348
Chicago/Turabian StyleShin, Moon-Kyung, Se Hyun Kwak, Youngmok Park, Ji Ye Jung, Young Sam Kim, and Young Ae Kang. 2021. "Association between Dietary Patterns and Chronic Obstructive Pulmonary Disease in Korean Adults: The Korean Genome and Epidemiology Study" Nutrients 13, no. 12: 4348. https://doi.org/10.3390/nu13124348
APA StyleShin, M.-K., Kwak, S. H., Park, Y., Jung, J. Y., Kim, Y. S., & Kang, Y. A. (2021). Association between Dietary Patterns and Chronic Obstructive Pulmonary Disease in Korean Adults: The Korean Genome and Epidemiology Study. Nutrients, 13(12), 4348. https://doi.org/10.3390/nu13124348