
Rapid and Effective Vitamin D Supplementation May Present Better Clinical Outcomes in COVID-19 (SARS-CoV-2) Patients by Altering Serum INOS1, IL1B, IFNg, Cathelicidin-LL37, and ICAM1

 , , , ,
  ,
,  ,
,
Abstract
1. Introduction
2. Materials and Methods
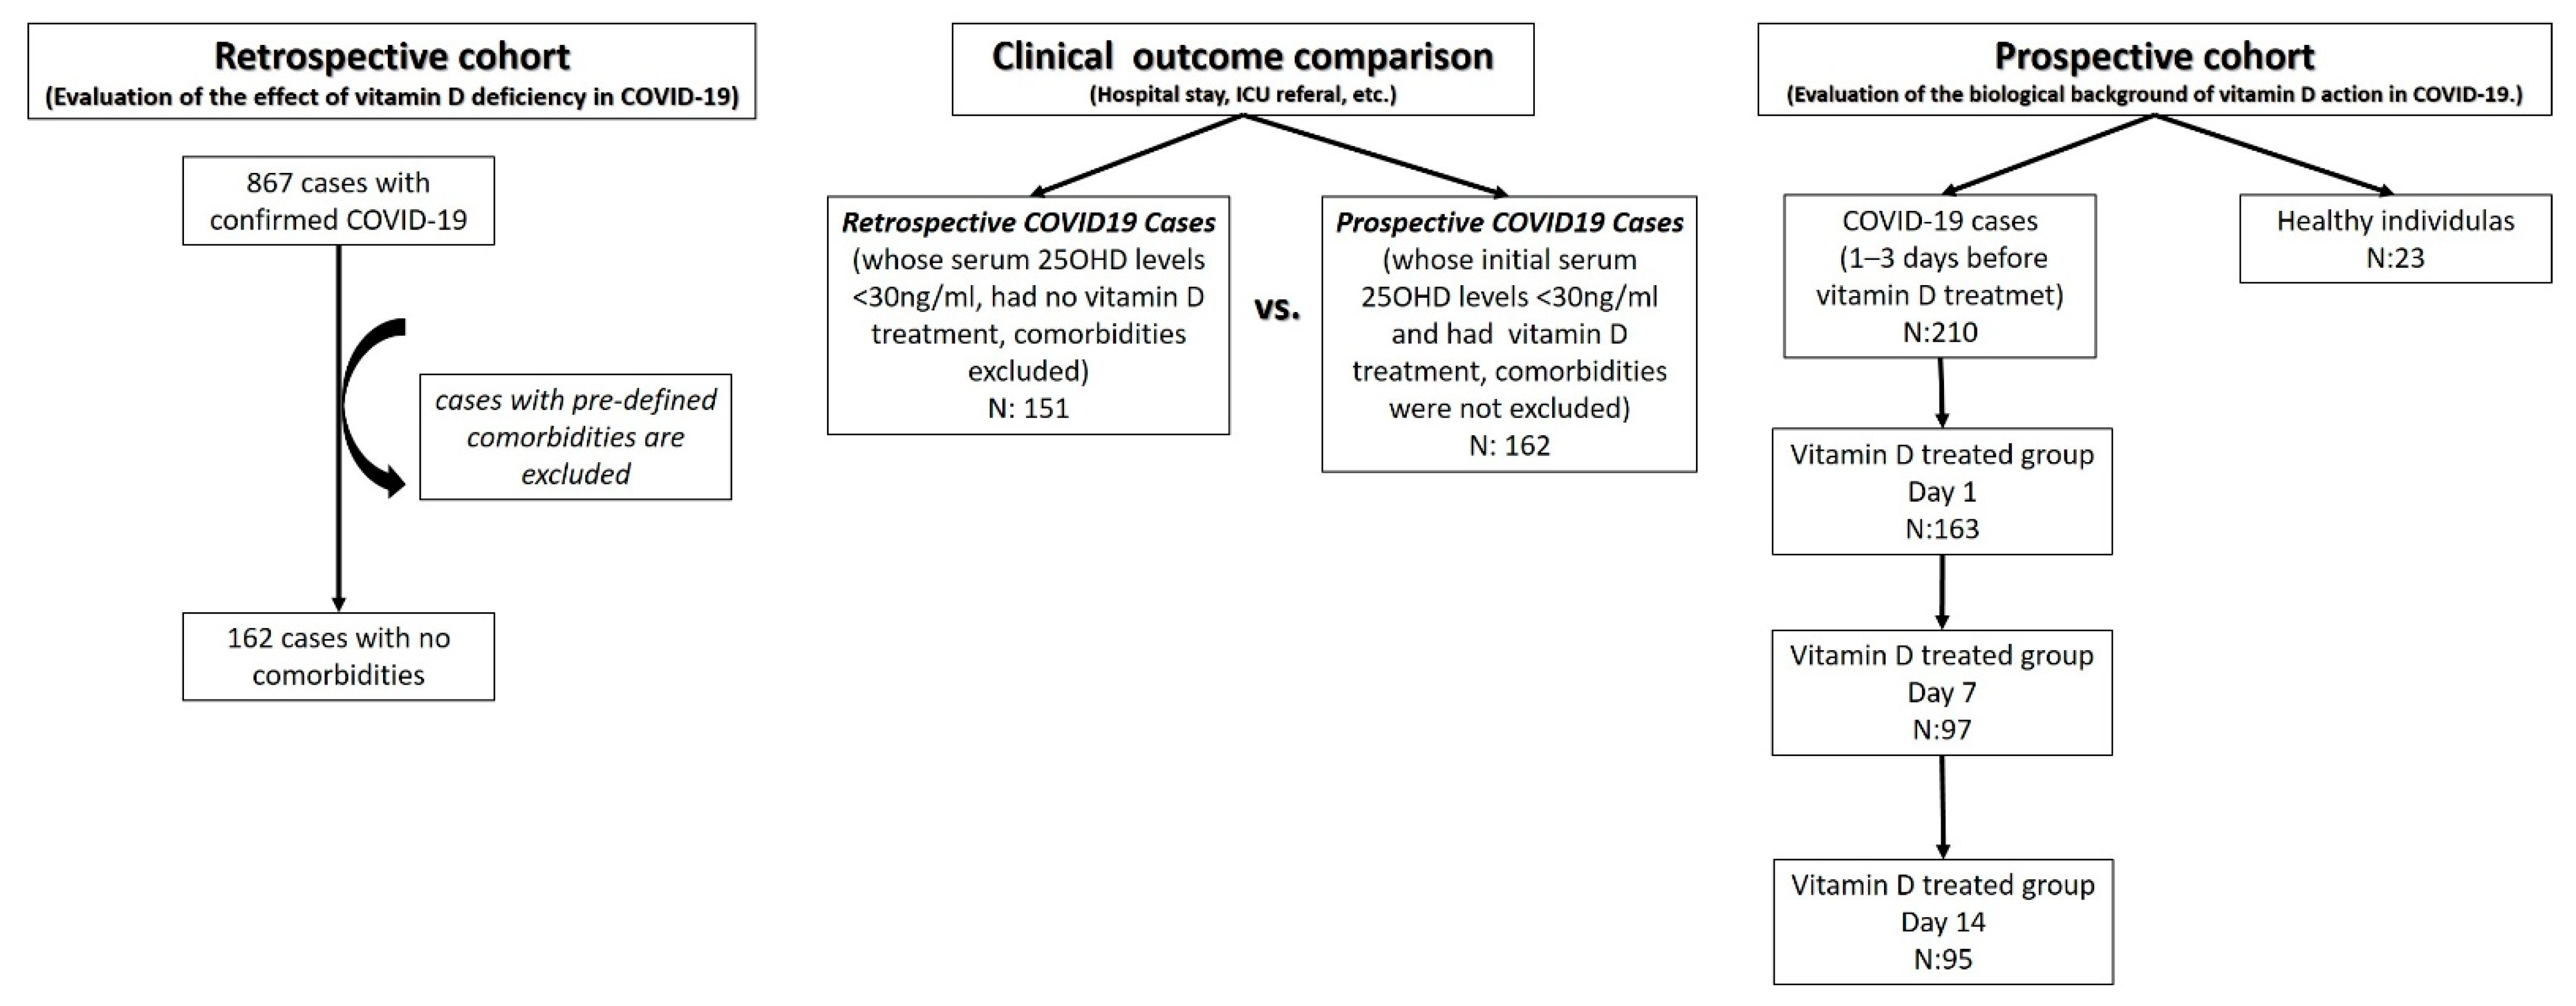
2.1. Study Design and Patient Groups
2.2. Target Parameters
2.3. Statistics
3. Results
3.1. The Effect of Serum Vitamin D Status on Clinical Outcomes of Retrospective Cases
3.2. Retrospective Study
3.3. The Effect of Vitamin D Treatment on Clinical Outcomes: Untreated Retrospective Cases vs. Vitamin D Treated Prospective Cases
3.4. Prospective Study (the Biological Background of Vitamin D Treatment)
3.4.1. Vitamin D Treatment Formula
3.4.2. Mean Comparisons
3.4.3. Correlation Analysis
4. Discussion
4.1. The Efficiency of Vitamin D Supplementation
4.2. Vitamin D, Iron, and Hemoglobin
4.3. Vitamin D and Sepsis
4.4. Vitamin D and COVID-19
5. Conclusions
Author Contributions
Funding
Institutional Review Board Statement
Informed Consent Statement
Data Availability Statement
Acknowledgments
Conflicts of Interest
References
- Wan, S.; Yi, Q.; Fan, S.; Lv, J.; Zhang, X.; Guo, L.; Lang, C.; Xiao, Q.; Xiao, K.; Yi, Z.; et al. Relationships among lymphocyte subsets, cytokines, and the pulmonary inflammation index in coronavirus (COVID-19) infected patients. Br. J. Haematol. 2020, 189, 428–437. [Google Scholar] [CrossRef] [PubMed]
- Huang, C.; Wang, Y.; Li, X.; Ren, L.; Zhao, J.; Hu, Y.; Zhang, L.; Fan, G.; Xu, J.; Gu, X.; et al. Clinical features of patients infected with 2019 novel coronavirus in wuhan, china. Lancet 2020, 395, 497–506. [Google Scholar] [CrossRef]
- Cao, W.; Li, T. COVID-19: Towards understanding of pathogenesis. Cell Res. 2020, 30, 367–369. [Google Scholar] [CrossRef]
- Dos Santos, W.G. Natural history of COVID-19 and current knowledge on treatment therapeutic options. Biomed. Pharmacother. 2020, 129, 110493. [Google Scholar] [CrossRef] [PubMed]
- Dursun, E.; Alaylioglu, M.; Bilgic, B.; Hanagasi, H.; Lohmann, E.; Atasoy, I.L.; Candas, E.; Araz, O.S.; Onal, B.; Gurvit, H.; et al. Vitamin d deficiency might pose a greater risk for apo-evarepsilon4 non-carrier alzheimer’s disease patients. Neurol. Sci. 2016, 37, 1633–1643. [Google Scholar] [CrossRef]
- Holick, M.F. Vitamin D: A millenium perspective. J. Cell. Biochem. 2003, 88, 296–307. [Google Scholar] [CrossRef] [PubMed]
- Holick, M. Vitamin D: A D-lightful solution for good health. J. Med. Biochem. 2012, 31, 263–264. [Google Scholar] [CrossRef]
- Holick, M.F. Cancer, sunlight and vitamin D. J. Clin. Transl. Endocrinol. 2014, 1, 179–186. [Google Scholar] [CrossRef][Green Version]
- Visweswaran, R.K.; Lekha, H. Extraskeletal effects and manifestations of Vitamin D deficiency. Indian J. Endocrinol. Metab. 2013, 17, 602–610. [Google Scholar] [CrossRef]
- Gezen-Ak, D.; Dursun, E. Molecular basis of vitamin D action in neurodegeneration: The story of a team perspective. Hormones 2018, 18, 17–21. [Google Scholar] [CrossRef]
- Gezen-Ak, D.; Yilmazer, S.; Dursun, E. Why vitamin d in alzheimer’s disease? The hypothesis. J. Alzheimers Dis. 2014, 40, 257–269. [Google Scholar] [CrossRef]
- Annweiler, C.; Dursun, E.; Feron, F.; Gezen-Ak, D.; Kalueff, A.V.; Littlejohns, T.; Llewellyn, D.; Millet, P.; Scott, T.; Tucker, K.L.; et al. Vitamin d and cognition in older adults: Internation-al consensus guidelines. Geriatr. Psychol. Neuropsychiatr. Vieil. 2016, 14, 265–273. [Google Scholar] [CrossRef]
- Dursun, E.; Gezen-Ak, D. Vitamin D basis of Alzheimer’s disease: From genetics to biomarkers. Hormones 2019, 18, 7–15. [Google Scholar] [CrossRef] [PubMed]
- Aranow, C. Vitamin D and the Immune System. J. Investig. Med. 2011, 59, 881–886. [Google Scholar] [CrossRef] [PubMed]
- Cannell, J.J.; Vieth, R.; Umhau, J.C.; Holick, M.F.; Grant, W.B.; Madronich, S.; Garland, C.F.; Giovannucci, E. Epidemic influenza and vitamin D. Epidemiol. Infect. 2006, 134, 1129–1140. [Google Scholar] [CrossRef] [PubMed]
- Bodnar, L.M.; Krohn, M.A.; Simhan, H.N. Maternal Vitamin D Deficiency Is Associated with Bacterial Vaginosis in the First Trimester of Pregnancy. J. Nutr. 2009, 139, 1157–1161. [Google Scholar] [CrossRef]
- Villamor, E. A potential role for vitamin d on hiv infection? Nutr. Rev. 2006, 64, 226–233. [Google Scholar] [CrossRef]
- Rodríguez, M.; Daniels, B.; Gunawardene, S.; Robbins, G.K. High Frequency of Vitamin D Deficiency in Ambulatory HIV-Positive Patients. AIDS Res. Hum. Retrovir. 2009, 25, 9–14. [Google Scholar] [CrossRef] [PubMed]
- Joshi, S.; Pantalena, L.C.; Liu, X.K.; Gaffen, S.L.; Liu, H.; Rohowsky-Kochan, C.; Ichiyama, K.; Yoshimura, A.; Steinman, L.; Christakos, S.; et al. 1,25-dihydroxyvitamin d(3) ameliorates th17 autoimmunity via transcriptional modulation of interleukin-17a. Mol. Cell Biol. 2011, 31, 3653–3669. [Google Scholar] [CrossRef]
- Fernandes de Abreu, D.A.; Eyles, D.; Féron, F. Vitamin d, a neuro-immunomodulator: Implications for neurodegenerative and autoimmune diseases. Psychoneuroendocrinology 2009, 34, 265–277. [Google Scholar] [CrossRef]
- Golpour, A.; Bereswill, S.; Heimesaat, M.M. Antimicrobial and immune-modulatory effects of vitamin D provide promising antibiotics-independent approaches to tackle bacterial infections—lessons learnt from a literature survey. Eur. J. Microbiol. Immunol. 2019, 9, 80–87. [Google Scholar] [CrossRef] [PubMed]
- Kumar, R.; Rathi, H.; Haq, A.; Wimalawansa, S.J.; Sharma, A. Putative roles of vitamin D in modulating immune response and immunopathology associated with COVID-19. Virus Res. 2021, 292, 198235. [Google Scholar] [CrossRef]
- Azizi-Soleiman, F.; Vafa, M.; Abiri, B.; Safavi, M. Effects of iron on Vitamin D metabolism: A systematic review. Int. J. Prev. Med. 2016, 7, 126. [Google Scholar] [CrossRef]
- Blanco-Rojo, R.; Pérez-Granados, A.M.; Toxqui, L.; Zazo, P.; De La Piedra, C.; Vaquero, M.P. Relationship between vitamin D deficiency, bone remodelling and iron status in iron-deficient young women consuming an iron-fortified food. Eur. J. Nutr. 2012, 52, 695–703. [Google Scholar] [CrossRef]
- Heldenberg, D.; Tenenbaum, G.; Weisman, Y. Effect of iron on serum 25-hydroxyvitamin D and 24,25-dihydroxyvitamin D concentrations. Am. J. Clin. Nutr. 1992, 56, 533–536. [Google Scholar] [CrossRef]
- Wright, I.; Blanco-Rojo, R.; Fernández, M.C.; Toxqui, L.; Moreno, G.; Pérez-Granados, A.M.; de la Piedra, C.; Remacha, Á.F.; Vaquero, M.P. Bone remodelling is reduced by recovery from iron-deficiency anaemia in premenopausal women. J. Physiol. Biochem. 2013, 69, 889–896. [Google Scholar] [CrossRef] [PubMed]
- Hayden, S.J.; Albert, T.J.; Watkins, T.R.; Swenson, E.R. Anemia in critical illness: Insights into etiology, consequences, and management. Am. J. Respir. Crit. Care Med. 2012, 185, 1049–1057. [Google Scholar] [CrossRef] [PubMed]
- Yang, C.; Liu, Y.; Wan, W. Role and mechanism of vitamin D in sepsis. Zhonghua Wei Zhong Bing Ji Jiu Yi Xue 2019, 31, 1170–1173. [Google Scholar]
- Parekh, D.; Patel, J.; Scott, A.; Lax, S.; Dancer, R.C.A.; D’Souza, V.; Greenwood, H.; Fraser, W.D.; Gao, F.; Sapey, E.; et al. Vitamin D Deficiency in Human and Murine Sepsis. Crit. Care Med. 2017, 45, 282–289. [Google Scholar] [CrossRef]
- Alipio, M.M. Vitamin D Supplementation Could Possibly Improve Clinical Outcomes of Patients Infected with Coronavirus-2019 (COVID-2019); Elsevier BV: Amsterdam, The Netherlands, 2020. [Google Scholar]
- Radujkovic, A.; Hippchen, T.; Tiwari-Heckler, S.; Dreher, S.; Boxberger, M.; Merle, U. Vitamin D Deficiency and Outcome of COVID-19 Patients. Nutrients 2020, 12, 2757. [Google Scholar] [CrossRef]
- AlSafar, H.; Grant, W.B.; Hijazi, R.; Uddin, M.; Alkaabi, N.; Tay, G.; Mahboub, B.; Al Anouti, F. COVID-19 disease severity and death in relation to vitamin d status among SARS-CoV-2-positive uae residents. Nutrients 2021, 13, 1714. [Google Scholar] [CrossRef]
- Kazemi, A.; Mohammadi, V.; Aghababaee, S.K.; Golzarand, M.; Clark, C.C.T.; Babajafari, S. Association of vitamin d status with SARS-CoV-2 infection or COVID-19 severity: A systematic review and meta-analysis. Adv. Nutr. 2021, 12, 1636–1658. [Google Scholar] [CrossRef]
- Sanchez-Zuno, G.A.; Gonzalez-Estevez, G.; Matuz-Flores, M.G.; Macedo-Ojeda, G.; Hernandez-Bello, J.; Mora-Mora, J.C.; Perez-Guerrero, E.E.; Garcia-Chagollan, M.; Vega-Magana, N.; Turrubiates-Hernandez, F.J.; et al. Vitamin d levels in COVID-19 outpatients from western mexico: Clinical correlation and effect of its supplementation. J. Clin. Med. 2021, 10, 2378. [Google Scholar] [CrossRef]
- Durlak, J.A. How to Select, Calculate, and Interpret Effect Sizes. J. Pediatric Psychol. 2009, 34, 917–928. [Google Scholar] [CrossRef] [PubMed]
- Gezen-Ak, D.; Alaylıoğlu, M.; Genç, G.; Şengül, B.; Keskin, E.; Sordu, P.; Güleç, Z.E.K.; Apaydın, H.; Bayram-Gürel, Ç.; Ulutin, T.; et al. Altered Transcriptional Profile of Mitochondrial DNA-Encoded OXPHOS Subunits, Mitochondria Quality Control Genes, and Intracellular ATP Levels in Blood Samples of Patients with Parkinson’s Disease. J. Alzheimer’s Dis. 2020, 74, 287–307. [Google Scholar] [CrossRef]
- Corwin, H.L.; Gettinger, A.; Pearl, R.G.; Fink, M.P.; Levy, M.M.; Abraham, E.; MacIntyre, N.R.; Shabot, M.M.; Duh, M.-S.; Shapiro, M.J. The CRIT Study: Anemia and blood transfusion in the critically ill—Current clinical practice in the United States *. Crit. Care Med. 2004, 32, 39–52. [Google Scholar] [CrossRef]
- Vincent, J.L.; Baron, J.-F.; Reinhart, K.; Gattinoni, L.; Thijs, L.; Webb, A.; Meier-Hellmann, A.; Nollet, G.; Peres-Bota, D. For the ABC Investigators Anemia and Blood Transfusion in Critically Ill Patients. JAMA 2002, 288, 1499–1507. [Google Scholar] [CrossRef]
- Amrein, K.; Schnedl, C.; Holl, A.; Riedl, R.; Christopher, K.B.; Pachler, C.; Urbanic Purkart, T.; Waltensdorfer, A.; Munch, A.; Warnkross, H.; et al. Effect of high-dose vitamin d3 on hospi-tal length of stay in critically ill patients with vitamin d deficiency: The vitdal-icu randomized clinical trial. JAMA 2014, 312, 1520–1530. [Google Scholar] [CrossRef]
- Smith, E.M.; Jones, J.L.; Han, J.E.; Alvarez, J.A.; Sloan, J.H.; Konrad, R.J.; Zughaier, S.M.; Martin, G.S.; Ziegler, T.R.; Tangpricha, V. High-dose vitamin d3 administration is associated with increases in hemoglobin concentrations in mechanically ventilated critically ill adults: A pilot double-blind, randomized, placebo-controlled trial. J. Parenter Enter. Nutr. 2018, 42, 87–94. [Google Scholar] [CrossRef] [PubMed]
- Pizzini, A.; Aichner, M.; Sahanic, S.; Bohm, A.; Egger, A.; Hoermann, G.; Kurz, K.; Widmann, G.; Bellmann-Weiler, R.; Weiss, G.; et al. Impact of vitamin d deficiency on COVID-19-a pro-spective analysis from the covild registry. Nutrients 2020, 12, 2775. [Google Scholar] [CrossRef] [PubMed]
- Mazziotti, G.; Lavezzi, E.; Brunetti, A.; Mirani, M.; Favacchio, G.; Pizzocaro, A.; Sandri, M.T.; Di Pasquale, A.; Voza, A.; Ciccarelli, M.; et al. Vitamin d deficiency, secondary hyperpara-thyroidism and respiratory insufficiency in hospitalized patients with COVID-19. J. Endocrinol. Investig. 2021, 44, 2285–2293. [Google Scholar] [CrossRef]
- Elham, A.S.; Azam, K.; Azam, J.; Mostafa, L.; Nasrin, B.; Marzieh, N. Serum vitamin D, calcium, and zinc levels in patients with COVID-19. Clin. Nutr. ESPEN 2021, 43, 276–282. [Google Scholar] [CrossRef] [PubMed]
- Osman, W.; Al Fahdi, F.; Al Salmi, I.; Al Khalili, H.; Gokhale, A.; Khamis, F. Serum Calcium and Vitamin D levels: Correlation with severity of COVID-19 in hospitalized patients in Royal Hospital, Oman. Int. J. Infect. Dis. 2021, 107, 153–163. [Google Scholar] [CrossRef] [PubMed]
- Grant, W.B.; Lahore, H.; McDonnell, S.L.; Baggerly, C.A.; French, C.B.; Aliano, J.L.; Bhattoa, H.P. Evidence that Vitamin D Supplementation Could Reduce Risk of Influenza and COVID-19 Infections and Deaths. Nutrients 2020, 12, 988. [Google Scholar] [CrossRef] [PubMed]
- Azevedo, M.L.V.; Zanchettin, A.C.; Vaz de Paula, C.B.; Motta Junior, J.D.S.; Malaquias, M.A.S.; Raboni, S.M.; Neto, P.C.; Zeni, R.C.; Prokopenko, A.; Borges, N.H.; et al. Lung neutro-philic recruitment and il-8/il-17a tissue expression in COVID-19. Front. Immunol. 2021, 12, 656350. [Google Scholar] [CrossRef] [PubMed]
- Li, S.; Duan, X.; Li, Y.; Li, M.; Gao, Y.; Li, T.; Li, S.; Tan, L.; Shao, T.; Jeyarajan, A.J.; et al. Differentially expressed immune response genes in COVID-19 patients based on disease severity. Aging 2021, 13, 9265–9276. [Google Scholar] [CrossRef]
- Zawawi, A.; Naser, A.Y.; Alwafi, H.; Minshawi, F. Profile of Circulatory Cytokines and Chemokines in Human Coronaviruses: A Systematic Review and Meta-Analysis. Front. Immunol. 2021, 12, 666223. [Google Scholar] [CrossRef]
- Lakkireddy, M.; Gadiga, S.G.; Malathi, R.D.; Karra, M.L.; Raju, I.P.M.; Chinapaka, S.; Baba, K.S.; Kandakatla, M. Impact of daily high dose oral vitamin d therapy on the inflammatory markers in patients with COVID 19 disease. Sci. Rep. 2021, 11, 10641. [Google Scholar] [CrossRef]
- Kessel, C.; Vollenberg, R.; Masjosthusmann, K.; Hinze, C.; Wittkowski, H.; Debaugnies, F.; Nagant, C.; Corazza, F.; Vely, F.; Kaplanski, G.; et al. Discrimination of COVID-19 from inflam-mation-induced cytokine storm syndromes by disease-related blood biomarkers. Arthritis Rheumatol. 2021, 73, 1791–1799. [Google Scholar] [CrossRef]
- Chen, Z.; Feng, Q.; Zhang, T.; Wang, X. Identification of COVID-19 subtypes based on immunogenomic profiling. Int. Immunopharmacol. 2021, 96, 107615. [Google Scholar] [CrossRef]
- Yamasaki, H. Blood nitrate and nitrite modulating nitric oxide bioavailability: Potential therapeutic functions in COVID-19. Nitric Oxide 2020, 103, 29–30. [Google Scholar] [CrossRef]
- Dursun, E.; Gezen-Ak, D.; Yilmazer, S. A new mechanism for amyloid-beta induction of inos: Vitamin d-vdr pathway disruption. J. Alzheimer’s Dis. 2013, 36, 459–474. [Google Scholar] [CrossRef] [PubMed]
- Dursun, E.; Gezen-Ak, D.; Yilmazer, S. The influence of vitamin d treatment on the inducible nitric oxide synthase (inos) expression in primary hippocampal neurons. Noro. Psikiyatr. Ars. 2014, 51, 163–168. [Google Scholar] [CrossRef]
- Andrukhova, O.; Slavic, S.; Zeitz, U.; Riesen, S.C.; Heppelmann, M.S.; Ambrisko, T.D.; Markovic, M.; Kuebler, W.M.; Erben, R.G. Vitamin d is a regulator of endothelial nitric oxide syn-thase and arterial stiffness in mice. Mol. Endocrinol. 2014, 28, 53–64. [Google Scholar] [CrossRef] [PubMed]
- Lorente, L.; Gómez-Bernal, F.; Martín, M.M.; Navarro-Gonzálvez, J.A.; Argueso, M.; Perez, A.; Ramos-Gómez, L.; Solé-Violán, J.; Ramos, J.A.M.Y.; Ojeda, N.; et al. High serum nitrates levels in non-survivor COVID-19 patients. Med. Intensiva 2020. [Google Scholar] [CrossRef] [PubMed]
- Yardan, T.; Erenler, A.K.; Baydin, A.; Aydin, K.; Cokluk, C. Usefulness of S100B protein in neurological disorders. J. Pak. Med. Assoc. 2011, 61, 276–281. [Google Scholar] [PubMed]
- Perrin, P.; Collongues, N.; Baloglu, S.; Bedo, D.; Bassand, X.; Lavaux, T.; Gautier-Vargas, G.; Keller, N.; Kremer, S.; Fafi-Kremer, S.; et al. Cytokine release syndrome-associated encephalo-pathy in patients with COVID-19. Eur. J. Neurol. 2021, 28, 248–258. [Google Scholar] [CrossRef] [PubMed]
- Aceti, A.; Margarucci, L.M.; Scaramucci, E.; Orsini, M.; Salerno, G.; Di Sante, G.; Gianfranceschi, G.; Di Liddo, R.; Valeriani, F.; Ria, F.; et al. Serum S100B protein as a marker of severity in COVID-19 patients. Sci. Rep. 2020, 10, 18665. [Google Scholar] [CrossRef] [PubMed]
- Bauer, W.; Ulke, J.; Galtung, N.; Strasser-Marsik, L.C.; Neuwinger, N.; Tauber, R.; Somasundaram, R.; Kappert, K. Role of Cell Adhesion Molecules for Prognosis of Disease Development of Patients with and Without COVID-19 in the Emergency Department. J. Infect. Dis. 2021, 223, 1497–1499. [Google Scholar] [CrossRef]
- Li, L.; Huang, M.; Shen, J.; Wang, Y.; Wang, R.; Yuan, C.; Jiang, L.; Huang, M. Serum Levels of Soluble Platelet Endothelial Cell Adhesion Molecule 1 in COVID-19 Patients Are Associated with Disease Severity. J. Infect. Dis. 2021, 223, 178–179. [Google Scholar] [CrossRef]
- Spadaro, S.; Fogagnolo, A.; Campo, G.; Zucchetti, O.; Verri, M.; Ottaviani, I.; Tunstall, T.; Grasso, S.; Scaramuzzo, V.; Murgolo, F.; et al. Markers of endothelial and epithelial pulmonary injury in mechanically ventilated COVID-19 ICU patients. Crit. Care 2021, 25, 74. [Google Scholar] [CrossRef] [PubMed]


| COVID-19 VITAMIN D (CHOLECALCIFEROL) SUPPLEMENTATION | ||||||||||
|---|---|---|---|---|---|---|---|---|---|---|
| Patient Definition | DAY 1 | DAY 2 | DAY 3 | DAY 4 | DAY 5 | DAY 6 | DAY 7 | TOTAL PERIOD | TOTAL DOSE | |
| INPATIENT | Serum 25OHD level < 12 ng/mL | 100.000 IU | 10.000 IU | 10.000 IU | 10.000 IU | 10.000 IU | 10.000 IU | 10.000 IU | 14 Days | 320.000 IU |
|
Serum 25OHD level 20–12 ng/mL | 100.000 IU | 5.000 IU | 5.000 IU | 5.000 IU | 5.000 IU | 5.000 IU | 5.000 IU | 14 Days | 260.000 IU | |
|
Serum 25OHD level 20–30 ng/mL | 100.000 IU | 2.000 IU | 2.000 IU | 2.000 IU | 2.000 IU | 2.000 IU | 2.000 IU | 14 Days | 224.000 IU | |
| ICU PATIENT | Serum 25OHD level < 12 ng/mL | 100.000 IU | 100.000 IU | 100.000 IU | 100.000 IU | 100.000 IU | 5 Days | 500.000 IU | ||
|
Serum 25OHD level 20–12 ng/mL | 100.000 IU | 100.000 IU | 100.000 IU | 100.000 IU | 4 Days | 400.000 IU | ||||
|
Serum 25OHD level 20–30 ng/mL | 100.000 IU | 100.000 IU | 50.000 IU | 3 Days | 250.000 IU | |||||
| Serum 25OHD Levels | ||||||
|---|---|---|---|---|---|---|
| <12 ng/mL (L1) | 12–20 ng/mL (L2) | 20–30 ng/mL (L3) | >30 ng/mL (L4) | p Value | ||
| n (%) | n (%) | n (%) | n (%) | |||
| Sex | Female | 31 (37.8%) | 10 (24.4%) | 11 (39.3%) | 6 (54.5%) | 0.23 |
| Male | 51 (62.2%) | 31 (75.6%) | 17 (60.7%) | 5 (45.5%) | ||
| Hospital stay | <8 days | 29 (35.4%) | 20 (48.8%) | 14 (50.0%) | 6 (54.5%) | 0.30 |
| >8 days | 53 (64.6%) | 21 (51.2%) | 14 (50.0%) | 5 (45.5%) | ||
| ICU referral | Yes | 5 (6.1%) | 2 (5.0%) | 1 (3.6%) | 0 (0.0%) | 0.82 |
| No | 77 (93.9%) | 38 (95.0%) | 27 (96.4%) | 11 (100%) | ||
| <12 ng/mL | 12–20 ng/mL | 20–30 ng/mL | >30 ng/mL | p value for MCT | ||
| n | 82 | 41 | 28 | 11 | ||
| Age | Mean ± SD | 49.70 ± 13.45 | 46.75 ± 11.27 | 54.25 ± 12.35 | 52.18 ± 12.01 | p > 0.05 for all groups |
| Hospital stay (days) | Mean ± SD | 9.40 ± 4.78 | 8.95 ± 4.13 | 8.39 ± 4.14 | 6.91 ± 3.36 | p > 0.05 for all groups |
| Serum 25OHD levels (ng/mL) | Mean ± SD | 8.16 ± 2.22 | 15.27 ± 2.13 | 23.80 ± 2.87 | 44.12 ± 12.87 | p < 0.001 for all groups, overall Post hoc power: 100%, overall Glass’ Δ: 6.84 |
| ALT (IU/L) | Mean ± SD | 32.53 ± 26.07 | 43.66 ± 79.13 | 32.45 ± 17.08 | 24.01 ± 15.08 | p > 0.05 for all groups |
| AST (IU/L) | Mean ± SD | 34.72 ± 28.79 | 36.67 ± 35.91 | 35.71 ± 18.88 | 27.54 ± 14.02 | p > 0.05 for all groups |
| CRP (mg/L) | Mean ± SD | 55.36 ± 70.44 | 40.85 ± 64.49 | 49.84 ± 53.85 | 25.75 ± 26.49 | p > 0.05 for all groups |
| Creatinine (mg/dL) | Mean ± SD | 0.84 ± 0.19 | 0.90 ± 0.22 | 0.91 ± 0.22 | 0.90 ± 0.25 | p > 0.05 for all groups |
| Ca2+ (mg/dL) | Mean ± SD | 8.75 ± 0.48 | 8.83 ± 0.53 | 8.89 ± 0.51 | 9.22 ± 0.67 | L1 vs. L4 p < 0.05; p > 0.05 for other groups Post hoc power: 61.4%, %, Glass’ Δ: 0.98 |
| Sodium (mmol/L) | Mean ± SD | 137.76 ± 3.09 | 138.28 ± 3.20 | 136.96 ± 3.00 | 137.73 ± 4.47 | p > 0.05 for all groups |
| Urea (mg/dL) | Mean ± SD | 27.78 ± 12.46 | 25.67 ± 6.89 | 25.75 ± 8.23 | 26.64 ± 10.14 | p > 0.05 for all groups |
| Ferritin (ng/mL) | Mean ± SD | 407.55 ± 418.19 | 322.83 ± 304.59 | 455.10 ± 442.27 | 394.76 ± 318.01 | p > 0.05 for all groups |
| Hemoglobine (g/dL) | Mean ± SD | 13.48 ± 1.54 | 13.53 ± 1.57 | 13.51 ± 1.35 | 13.24 ± 1.23 | p > 0.05 for all groups |
| Lymphocyte (×103/µL) | Mean ± SD | 1.61 ± 1.00 | 1.59 ± 0.82 | 1.45 ± 0.78 | 1.75 ± 0.93 | p > 0.05 for all groups |
| Platelet (×103/µL) | Mean ± SD | 217.70 ± 78.02 | 224.95 ± 76.72 | 211.07 ± 54.47 | 210.49 ± 72.20 | p > 0.05 for all groups |
| Leukocyte (×103/µL) | Mean ± SD | 6.94 ± 2.96 | 6.72 ± 3.80 | 5.99 ± 2.09 | 5.62 ± 1.75 | p > 0.05 for all groups |
| D-dimer (mg/L) | Mean ± SD | 2.80 ± 12.62 | 0.62 ± 0.55 | 2.49 ± 10.06 | 0.57 ± 0.38 | p > 0.05 for all groups |
| Fibrinogen (mg/dL) | Mean ± SD | 485.21 ± 178.26 | 426.99 ± 176.84 | 464.54 ± 155.50 | 407.79 ±167.58 | p > 0.05 for all groups |
| n | 18 | 18 | 16 | n < 3 | ||
| PTH (pg/mL) | Mean ± SD | 37.68 ± 22.87 | 27.10 ± 10.15 | 23.48 ± 11.25 | - | p > 0.05 for all groups |
| Nitrate–Nitrite (µM) | Mean ± SD | 12.35 ± 6.77 | 10.50 ± 3.89 | 16.11 ± 5.64 | - | L2 vs. L3 p < 0.05; p > 0.05 for other groups Post hoc power: 91.6%, Glass’ Δ: 1.44 |
| NOS1 (ng/mL) | Mean ± SD | 3.00 ± 0.85 | 3.73 ± 1.22 | 3.42 ± 1.07 | - | p > 0.05 for all groups |
| DBP (ng/mL) | Mean ± SD | 450.64 ± 182.61 | 586.10 ± 221.10 | 547.78 ± 174.04 | - | p > 0.05 for all groups |
| IL1B (pg/mL) | Mean ± SD | 6.08 ± 0.94 | 5.98 ± 1.44 | 6.34 ± 1.36 | - | p > 0.05 for all groups |
| IL6 (pg/mL) | Mean ± SD | 17.33 ± 33.40 | 14.81 ± 27.31 | 4.60 ± 3.33 | - | p > 0.05 for all groups |
| IFNg (pg/mL) | Mean ± SD | 6.08 ± 7.72 | 4.65 ± 4.30 | 3.87 ± 4.54 | - | p > 0.05 for all groups |
| IL17 (pg/mL) | Mean ± SD | 2.68 ± 0.57 | 2.56 ± 0.73 | 2.84 ± 0.78 | - | p > 0.05 for all groups |
| LL37 (ng/mL) | Mean ± SD | 19.01 ± 8.22 | 22.52 ± 9.49 | 19.33 ± 4.79 | - | p > 0.05 for all groups |
| S100B (pg/mL) | Mean ± SD | 6.37 ± 8.64 | 5.84 ± 8.94 | 7.86 ± 15.17 | - | p > 0.05 for all groups |
| ICAM1 (ng/mL) | Mean ± SD | 98.03 ± 25.50 | 103.89 ± 66.33 | 72.11 ± 23.84 | - | p > 0.05 for all groups |
| VCAM1 (ng/mL) | Mean ± SD | 578.17 ± 560.15 | 402.15 ± 302.33 | 370.82 ± 163.75 | - | p > 0.05 for all groups |
| Serum 25OHD Levels | ||||
|---|---|---|---|---|
| <12 ng/mL | >12 ng/mL | p Value | ||
| n (%) | n (%) | |||
| Sex | Female | 31 (37.8%) | 27 (33.8%) | 0.60 |
| Male | 51 (62.2%) | 53 (66.2%) | ||
| Hospital stay | <8 days | 28 (35%) | 38 (49%) | 0.08 Post hoc power: 42.9% |
| >8 days | 52 (65%) | 40 (51%) | ||
| ICU referral | Yes | 5 (6%) | 4 (5%) | 0.776 |
| No | 75 (94%) | 73 (95%) | ||
| Mortality | 3 (3.7%) | 1 (1.3%) | 0.33 | |
| Serum 25OHD levels | ||||
| <12 ng/mL | >12 ng/mL | p value | ||
| n | 82 | 79 | ||
| Age | Mean ± SD | 49.71 ± 13.45 | 50.16 ± 12.14 | 0.82 |
| Duration of hospital stay (days) | Mean ± SD | 9.40 ± 4.78 | 8.47 ± 4.05 | 0.18 |
| Serum 25OHD levels (ng/mL) | Mean ± SD | 8.16 ± 2.21 | 22.22 ± 10.90 | <0.0001 Post hoc power: 100%, Glass’ Δ: 6.36 |
| ALT (IU/L) | Mean ± SD | 32.53 ± 26.07 | 36.95 ± 57.57 | 0.53 |
| AST (IU/L) | Mean ± SD | 34.72 ± 28.79 | 35.06 ± 28.34 | 0.94 |
| CRP (mg/L) | Mean ± SD | 55.36 ± 70.44 | 41.93 ± 56.86 | 0.19 |
| Creatinine (mg/dL) | Mean ± SD | 0.84 ± 0.19 | 0.90 ± 0.22 | 0.056 Post hoc power: 45.6%, Glass’ Δ: 0.32 |
| Ca2+ (mg/dL) | Mean ± SD | 8.75 ± 0.48 | 8.90 ± 0.55 | 0.057 Post hoc power: 45.3%, Glass’ Δ: 0.31 |
| Sodium (mmol/L) | Mean ± SD | 137.76 ± 3.09 | 137.73 ± 3.34 | 0.96 |
| Urea (mg/dL) | Mean ± SD | 27.78 ± 12.46 | 25.83 ± 7.79 | 0.24 |
| Ferritin (ng/mL) | Mean ± SD | 407.55 ± 418.19 | 384.72 ± 367.76 | 0.74 |
| Hemoglobine (g/dL) | Mean ± SD | 13.48 ± 1.53 | 13.48 ± 1.44 | 0.99 |
| Lymphocyte (×103/µL) | Mean ± SD | 1.61 ± 1.00 | 1.56 ± 0.82 | 0.75 |
| Platelet (×103/µL) | Mean ± SD | 217.70 ± 78.02 | 218.02 ± 68.47 | 0.98 |
| Leukocyte (×103/µL) | Mean ± SD | 6.94 ± 2.96 | 6.31 ± 3.05 | 0.19 |
| D-dimer (mg/L) | Mean ± SD | 2.80 ± 12.62 | 1.31 ± 6.16 | 0.36 |
| Fibrinogen (mg/dL) | Mean ± SD | 485.21 ± 178.26 | 437.49 ± 166.76 | 0.12 |
| n | 18 | 34 | p value | |
| PTH (pg/mL) | Mean ± SD | 37.68 ± 22.87 | 25.40 ±10.68 | 0.04 Post hoc power: 57.8%, Glass’ Δ: 0.54 |
| Nitrate–Nitrite (µM) | Mean ± SD | 12.35 ± 6.77 | 13.14 ± 5.51 | 0.65 |
| NOS1 (ng/mL) | Mean ± SD | 3.00 ± 0.85 | 3.59 ± 1.14 | 0.06 Post hoc power: 55.9%, Glass’ Δ: 0.69 |
| DBP (ng/mL) | Mean ± SD | 450.64 ± 182.61 | 568.07 ± 198.32 | 0.04 Post hoc power: 57.2%, Glass’ Δ: 0.64 |
| IL1B (pg/mL) | Mean ± SD | 6.08 ±0.94 | 6.15 ± 1.39 | 0.85 |
| IL6 (pg/mL) | Mean ± SD | 17.33 ± 33.40 | 10.00 ± 20.40 | 0.40 |
| IFNg (pg/mL) | Mean ± SD | 6.08 ± 7.72 | 4.28 ± 4.36 | 0.37 |
| IL17 (pg/mL) | Mean ± SD | 2.68 ± 0.57 | 2.69 ± 0.76 | 0.98 |
| LL37 (ng/mL) | Mean ± SD | 19.01 ± 8.22 | 21.02 ± 7.71 | 0.39 |
| S100B (pg/mL) | Mean ± SD | 6.37 ± 8.64 | 6.79 ± 12.12 | 0.90 |
| ICAM1 (ng/mL) | Mean ± SD | 98.03 ± 25.50 | 88.93 ± 52.76 | 0.50 |
| VCAM1 (ng/mL) | Mean ± SD | 575.17 ± 560.15 | 386.96 ± 241.91 | 0.19 |
| Retrospective COVID-19 Cases (without Additional Disease, without Vitamin D Treatment, and Serum 25OHD < 30 ng/mL) | Prospective COVID-19 Cases (with Vitamin D Treatment, and Initial Serum 25OHD < 30 ng/mL) | |||
|---|---|---|---|---|
| n (%) | n (%) | p Value | ||
| Sex | Female | 52 (34.4%) | 80 (49.4%) | 0.008 |
| Male | 99 (65.6%) | 82 (50.6%) | ||
| Hospital stay | <8 days | 63 (41.7%) | 89 (54.9%) | 0.02 * |
| >8 days | 88 (58.3%) | 73 (45.1%) | ||
| ICU referral | Yes | 8 (5.3%) | 18 (11.0%) | 0.07 |
| No | 143 (94.7%) | 145 (89.0%) | ||
| Mortality | 4 (2.7%) | 9 (5.5%) | 0.22 | |
| n | 151 | 163 | ||
| Age | Mean ± SD | 50.23 ± 12.36 | 55.00 ± 16.45 | 0.004 |
| Hospital stay (days) | Mean ± SD | 8.91 ± 4.35 | 9.23 ± 6.54 | 0.30 |
| GROUPS | |||||
|---|---|---|---|---|---|
| Healthy Subjects (H) (n = 23) | COVID-19 (1–3 Days before Vitamin D Treatment) (C) (n = 210) | COVID-19 Cases (Day 7 of vit D) (D7) (n = 97) | COVID-19 Cases (Day 14 of Vit D) (D14) (n = 95) | p Value for MCT (Multiple Comparison Test) Age and Sex Adjusted | |
| Serum 25OHD levels (ng/mL) Mean ± SD | 23.44 ± 9.10 | 16.62 ± 11.85 | 31.73 ± 12.29 | 35.46 ± 10.93 | H vs.C p < 0.05; H vs. D14 p < 0.001; C vs. D7 or D14 p < 0.001; p > 0.05 for other groups Post hoc power: 100% |
| Ca2+ (mg/dL) Mean ± SD | 8.80 ± 0.41 | 8.49 ± 0.87 | 9.06 ± 0.90 | 9.52 ± 0.72 | p > 0.05 for all groups Post hoc power: 37% |
| PTH (pg/mL) Mean ± SD | 28.97 ± 12.14 | 53.67 ± 114.78 | 49.92 ± 124.34 | 33.93 ± 40.15 | p > 0.05 for all groups Post hoc power: 24% |
| Nitrate–Nitrite (µM) Mean ± SD | 10.18 ± 6.62 | 16.58 ± 10.89 | 17.83 ± 11.67 | 18.53 ± 10.76 | H vs. D7or D14 p < 0.05; p > 0.05 for other groups Post hoc power: 62% |
| NOS1 (ng/mL) Mean ± SD | 0.81 ± 0.35 | 3.93 ± 2.45 | 3.56 ± 2.41 | 2.89 ± 2.00 | H vs. C p < 0.001; H vs. D7 p < 0.05; C vs. D14 p < 0.01; p > 0.05 for other groups Post hoc power: 98% |
| DBP (ng/mL) Mean ± SD | 258.16 ± 92.86 | 416.64 ± 279.55 | 307.67 ± 258.36 | 289.74 ± 270.07 | C vs. D7 or D14 p < 0.001; p > 0.05 for other groups Post hoc power: 95% |
| IL1B (pg/mL) Mean ± SD | 4.44 ± 0.75 | 7.30 ± 3.00 | 7.54 ± 4.19 | 7.07 ± 3.49 | H vs. Cor D7 p < 0.05; H vs. D14 p < 0.001; C vs. D14 p < 0.05; p > 0.05 for other groups Post hoc power: 86% |
| IL6 (pg/mL) Mean ± SD | 0.86 ± 0.34 | 19.27 ± 41.66 | 27.57 ± 64.32 | 17.82 ± 43.20 | p > 0.05 for all groups Post hoc power: 22% |
| IFNg (pg/mL) Mean ± SD | 1.10 ± 0.23 | 28.01 ± 24.63 | 35.66 ± 23.34 | 37.05 ± 21.52 | H vs. all groups p < 0.0001; C vs. D7 p < 0.001; C vs. D14 p < 0.0001; p > 0.05 for other groups Post hoc power: 100% |
| IL17 (pg/mL) Mean ± SD | 3.06 ± 1.03 | 2.09 ± 0.80 | 1.98 ± 1.21 | 2.11 ± 1.28 | H vs. all groups p < 0.0001; p > 0.05 for other groups Post hoc power: 99% |
| LL37 (ng/mL) Mean ± SD | 4.81 ± 2.69 | 18.51 ± 9.65 | 15.97 ± 9.23 | 14.76 ± 6.78 | H vs. all groups p < 0.0001; C vs. D7 p < 0.05; C vs. D14 p < 0.01; p > 0.05 for other groups Post hoc power: 100% |
| S100B (pg/mL) Mean ± SD | 1.43 ± 0.25 | 3.96 ± 6.28 | 3.03 ± 3.21 | 3.00 ± 2.56 | H vs.C p < 0.05; p > 0.05 for other groups Post hoc power: 57% |
| ICAM1 (ng/mL) Mean ± SD | 71.97 ± 37.92 | 130.48 ± 84.74 | 144.15 ± 77.14 | 145.33 ± 73.56 | H vs.D7 p < 0.05; H vs.D14 p < 0.01; C vs.D14 p < 0.05; p > 0.05 for other groups Post hoc power: 71% |
| VCAM1 (ng/mL) Mean ± SD | 319.84 ± 138.14 | 496.33 ± 354.93 | 571.24 ± 371.16 | 666.65 ± 463.34 | p > 0.05 for all groups Post hoc power: 13% |
| COVID-19 Cases (1–3 Days before Vitamin D Treatment) (C) (n = 209) | COVID-19 Cases (Day 7 of Vit D) (D7) (n = 99) | COVID-19 Cases (Day 14 of Vit D) (D14) (n = 86) | p Value for MCT | |
|---|---|---|---|---|
| ALT (IU/L) Mean ± SD | 29.08 ± 21.42 | 49.23 ± 44.76 | 53.22 ± 62.64 | C vs. D7 or D14 p < 0.001; p > 0.05 for other groups |
| AST (IU/L) Mean ± SD | 31.44 ± 23.41 | 35.61 ± 26.62 | 31.68 ± 29.86 | p > 0.05 for all groups |
| CRP (mg/L) Mean ± SD | 50.68 ± 66.41 | 28.13 ± 49.08 | 10.96 ± 27.27 | C vs. D7 or D14 p < 0.001; D7 vs. D14 p < 0.001; p > 0.05 for other groups |
| Creatinine (mg/dL) Mean ± SD | 1.03 ± 0.65 | 1.08 ± 1.02 | 0.87 ± 0.27 | p > 0.05 for all groups |
| Sodium (mmol/L) Mean ± SD | 137.08 ± 8.51 | 139.28 ± 3.69 | 139.63 ± 3.24 | C vs. D7 or D14 p < 0.001; p > 0.05 for other groups |
| Urea (mg/dL) Mean ± SD | 35.46 ± 22.64 | 40.77 ± 28.98 | 32.22 ± 16.44 | p > 0.05 for all groups |
| Ferritin (ng/mL) Mean ± SD | 408.15 ± 474.26 | 421.19 ± 498.75 | 252.52 ± 299.45 | p > 0.05 for all groups |
| Hemoglobi Mean ± SD | 12.43 ± 1.89 | 12.27 ± 1.80 | 12.69 ± 1.75 | p > 0.05 for all groups |
| Lymphocyte (×103/µL) Mean ± SD | 1.56 ± 0.82 | 1.60 ± 0.86 | 1.84 ± 0.65 | C vs. D14 p < 0.001; D7 vs. D14 p < 0.05; p > 0.05 for other groups |
| Platelet (×103/µL) Mean ± SD | 210.80 ± 81.10 | 296.25 ± 124.71 | 296.67 ± 91.07 | C vs. D7 or D14 p < 0.001; p > 0.05 for other groups |
| Leukocyte (×103/µL) Mean ± SD | 7.51 ± 7.55 | 8.31 ± 6.63 | 7.60 ± 3.02 | C vs. D14 p < 0.01; p > 0.05 for other groups |
| D-dimer (mg/L) Mean ± SD | 0.99 ± 1.21 | 1.08 ± 1.22 | 0.76 ± 0.83 | p > 0.05 for all groups |
| Fibrinogen (mg/dL) Mean ± SD | 469.60 ± 172.43 | 449.55 ± 148.01 | 375.42 ± 116.03 | C vs. D14 p < 0.001; D7 vs. D14 p < 0.001; p > 0.05 for other groups |
| Groups | Ca2+ | PTH | Nitrate–Nitrite | NOS1 | DBP | IL1B | IL6 | IFNg | IL17 | LL37 | S100B | ICAM1 | VCAM1 |
|---|---|---|---|---|---|---|---|---|---|---|---|---|---|
| Healthy subjects (n = 23) | NC | p = 0.08 95% CI: −0.68 to 0.05, r2 = 0.14 | NC | NC | NC | NC | NC | NC | NC | NC | NC | NC | NC |
| COVID-19 cases (1–3 days before vitamin D treatment) (n = 210) | p = 0.049 95% CI: 0.0006 to 0.27, r2 = 0.02 | p = 0.02 95% CI: −0.29 to −0.03, r2 = 0.03 | p = 0.047 95% CI: −0.27 to −0.002, r2 = 0.02 | p = 0.06 95% CI: −0.26 to 0.005, r2 = 0.02 | p = 0.03 95% CI: 0.01 to 0.28, r2 = 0.02 | p < 0.0001 95% CI: 0.15 to 0.40, r2 = 0.08 | NC | p = 0.06695 95% CI: −0.026 to 0.0009, r2 = 0.016 | NC | NC | NC | p = 0.0003 95% CI: −0.37 to −0.12, r2 = 0.06 | NC |
| COVID-19 cases (day 7 of vit D treatment) (n = 97) | NC | p = 0.074 95% CI: −0.37 to 0.02, r2 = 0.03 | NC | p = 0.043 95% CI: 0.007 to 0.39, r2 = 0.04 | p = 0.043 95% CI: 0.007 to 0.39, r2 = 0.04 | NC | NC | NC | NC | p = 0.005 95% CI: 0.09 to 0.46, r2 = 0.08 | NC | NC | NC |
| COVID-19 cases (day 14 of vit D treatment) (n = 95) | NC | NC | NC | p = 0.023 95% CI: 0.03 to 0.42, r2 = 0.05 | p = 0.033 95% CI: 0.02 to 0.41, r2 = 0.05 | NC | NC | NC | NC | p = 0.008 95% CI: 0.07 to 0.45, r2 = 0.07 | NC | NC | NC |
Publisher’s Note: MDPI stays neutral with regard to jurisdictional claims in published maps and institutional affiliations. |
© 2021 by the authors. Licensee MDPI, Basel, Switzerland. This article is an open access article distributed under the terms and conditions of the Creative Commons Attribution (CC BY) license (https://creativecommons.org/licenses/by/4.0/).
Share and Cite
Gönen, M.S.; Alaylıoğlu, M.; Durcan, E.; Özdemir, Y.; Şahin, S.; Konukoğlu, D.; Nohut, O.K.; Ürkmez, S.; Küçükece, B.; Balkan, İ.İ.; et al. Rapid and Effective Vitamin D Supplementation May Present Better Clinical Outcomes in COVID-19 (SARS-CoV-2) Patients by Altering Serum INOS1, IL1B, IFNg, Cathelicidin-LL37, and ICAM1. Nutrients 2021, 13, 4047. https://doi.org/10.3390/nu13114047
Gönen MS, Alaylıoğlu M, Durcan E, Özdemir Y, Şahin S, Konukoğlu D, Nohut OK, Ürkmez S, Küçükece B, Balkan İİ, et al. Rapid and Effective Vitamin D Supplementation May Present Better Clinical Outcomes in COVID-19 (SARS-CoV-2) Patients by Altering Serum INOS1, IL1B, IFNg, Cathelicidin-LL37, and ICAM1. Nutrients. 2021; 13(11):4047. https://doi.org/10.3390/nu13114047
Chicago/Turabian StyleGönen, Mustafa Sait, Merve Alaylıoğlu, Emre Durcan, Yusuf Özdemir, Serdar Şahin, Dildar Konukoğlu, Okan Kadir Nohut, Seval Ürkmez, Berna Küçükece, İlker İnanç Balkan, and et al. 2021. "Rapid and Effective Vitamin D Supplementation May Present Better Clinical Outcomes in COVID-19 (SARS-CoV-2) Patients by Altering Serum INOS1, IL1B, IFNg, Cathelicidin-LL37, and ICAM1" Nutrients 13, no. 11: 4047. https://doi.org/10.3390/nu13114047
APA StyleGönen, M. S., Alaylıoğlu, M., Durcan, E., Özdemir, Y., Şahin, S., Konukoğlu, D., Nohut, O. K., Ürkmez, S., Küçükece, B., Balkan, İ. İ., Kara, H. V., Börekçi, Ş., Özkaya, H., Kutlubay, Z., Dikmen, Y., Keskindemirci, Y., Karras, S. N., Annweiler, C., Gezen-Ak, D., & Dursun, E. (2021). Rapid and Effective Vitamin D Supplementation May Present Better Clinical Outcomes in COVID-19 (SARS-CoV-2) Patients by Altering Serum INOS1, IL1B, IFNg, Cathelicidin-LL37, and ICAM1. Nutrients, 13(11), 4047. https://doi.org/10.3390/nu13114047