
Associations of Habitual Mineral Intake with New-Onset Prediabetes/Diabetes after Acute Pancreatitis

Abstract
1. Introduction
2. Methods
2.1. Study Design
2.2. Study Population
2.3. Study Groups
2.4. Ascertainment of Mineral Intake
2.5. Laboratory Assays
2.6. Covariates
2.7. Statistical Analysis
3. Results
3.1. Characteristics of the Study Cohort
3.2. Associations between Habitual Mineral Intake and Diabetes Types
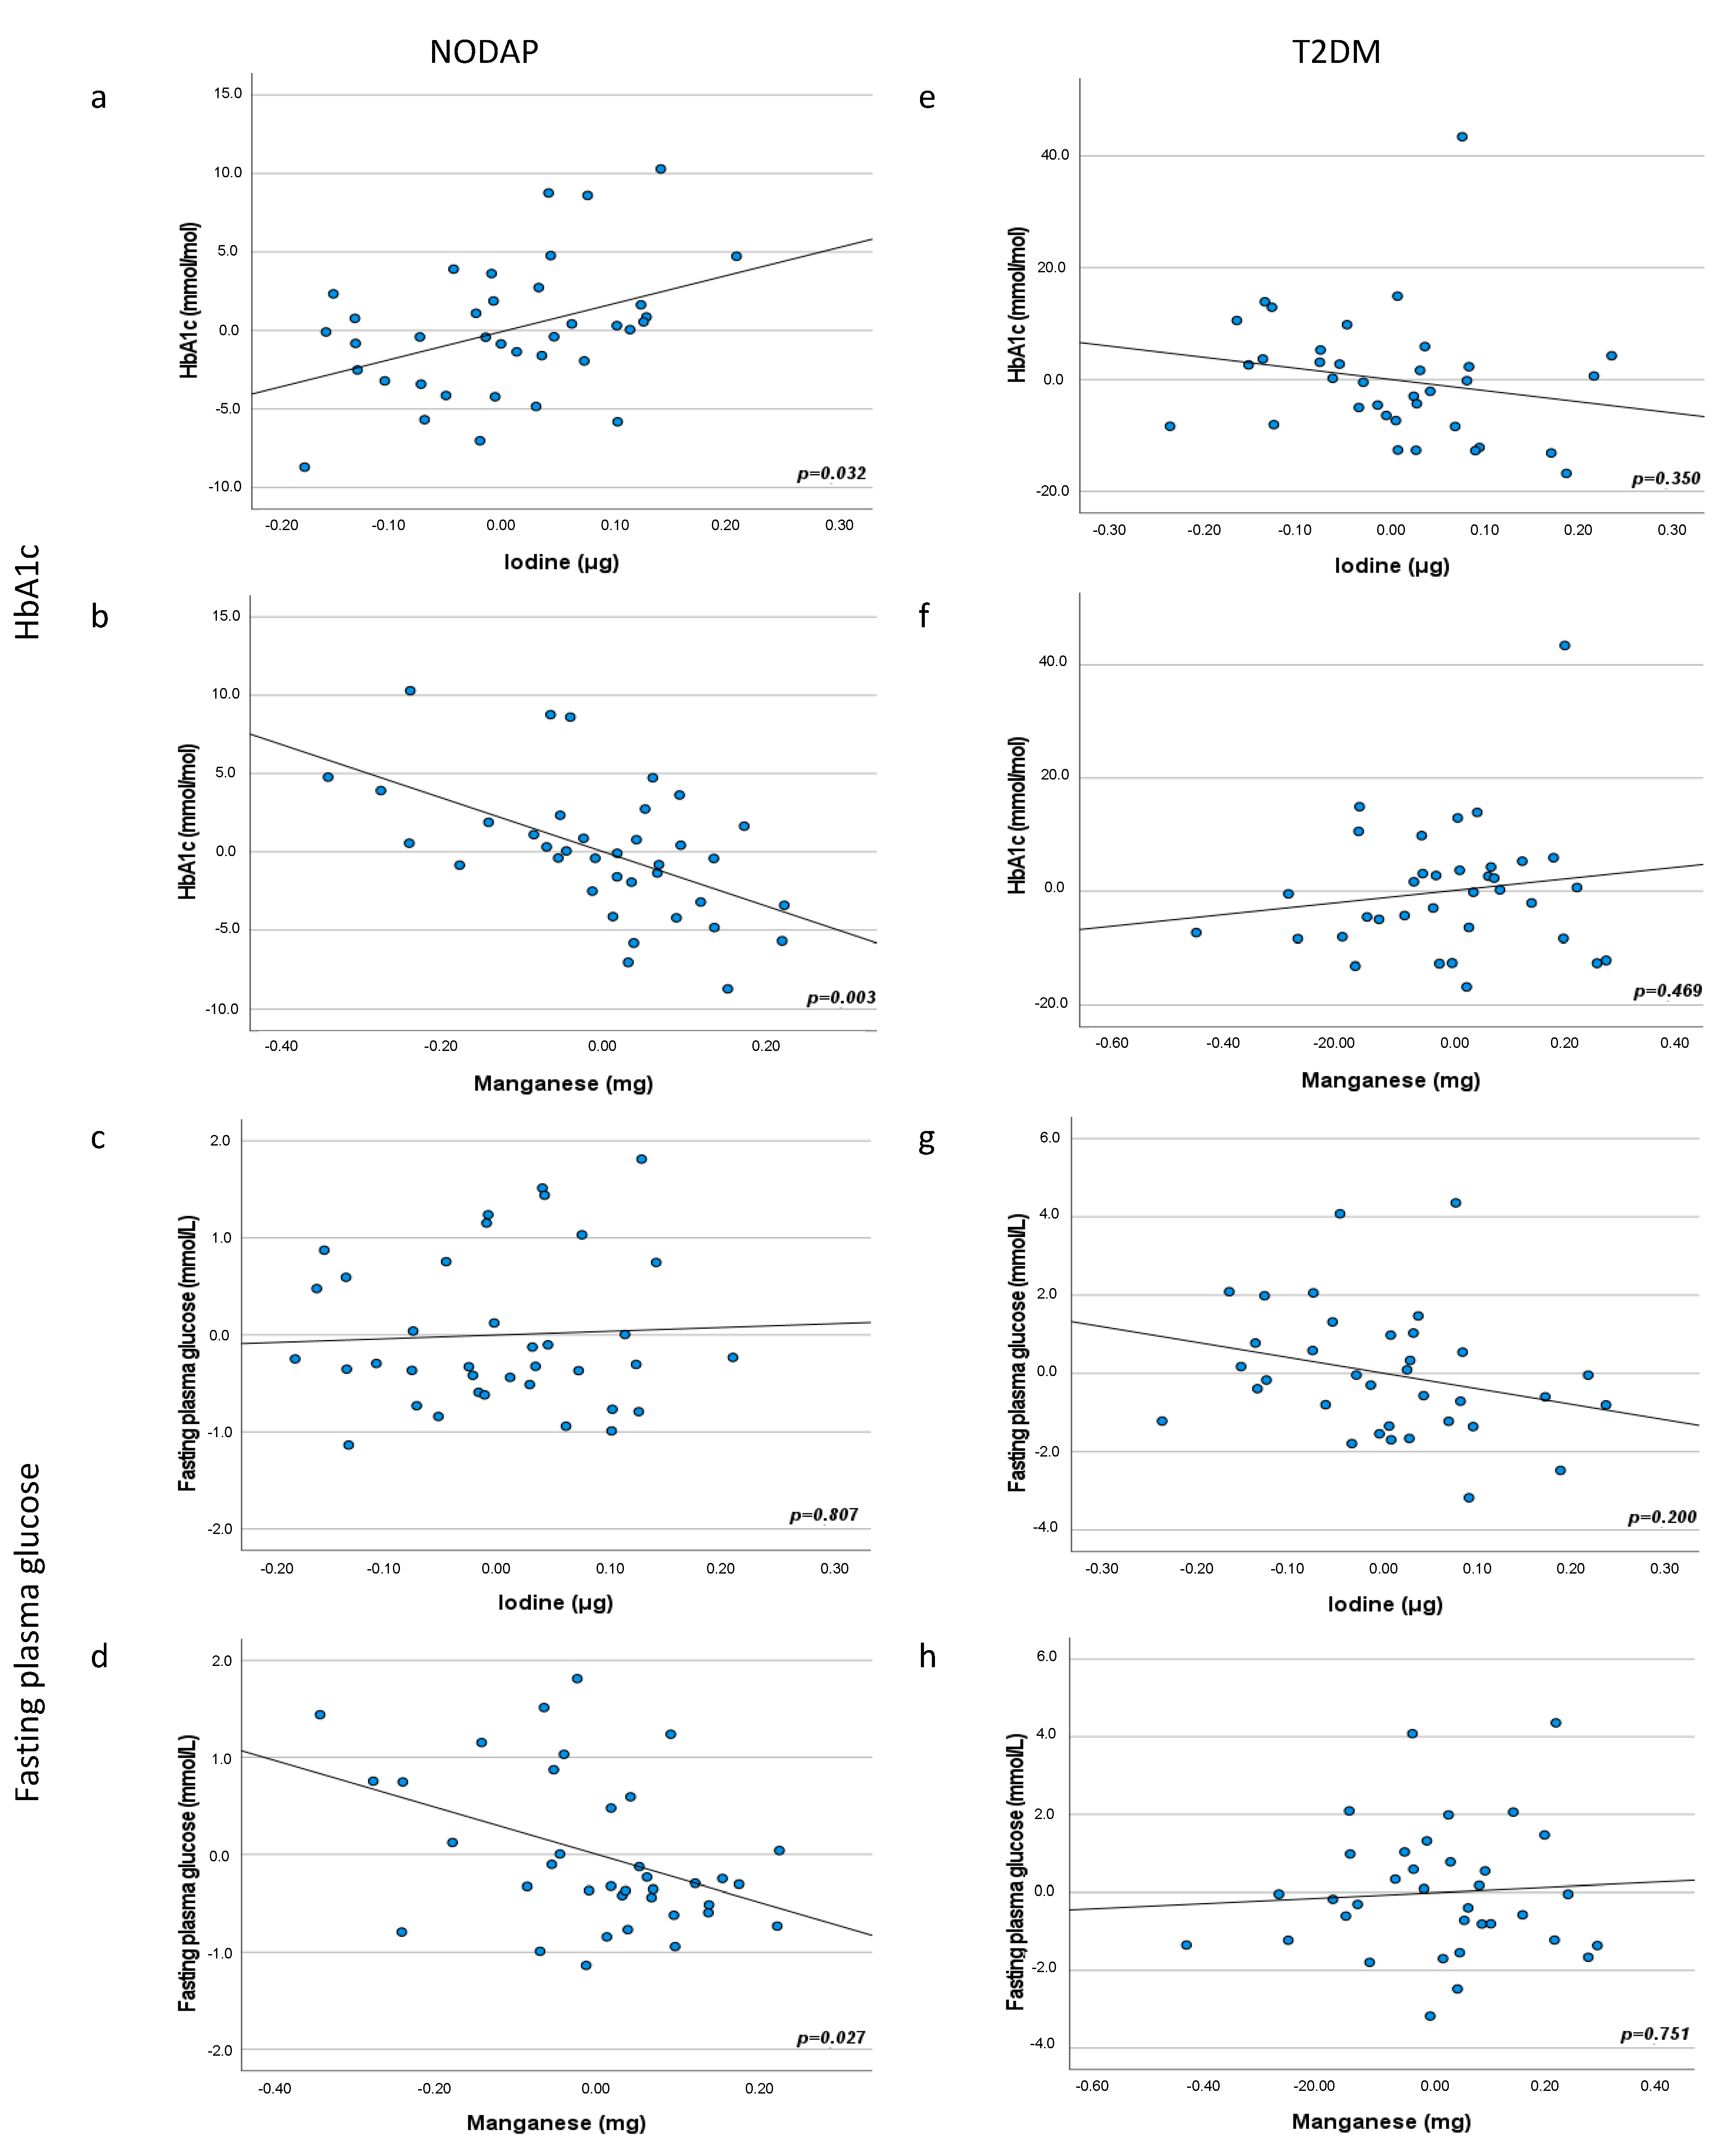
3.3. Associations between Habitual Mineral Intake and Markers of Glucose Metabolism in the Study Groups
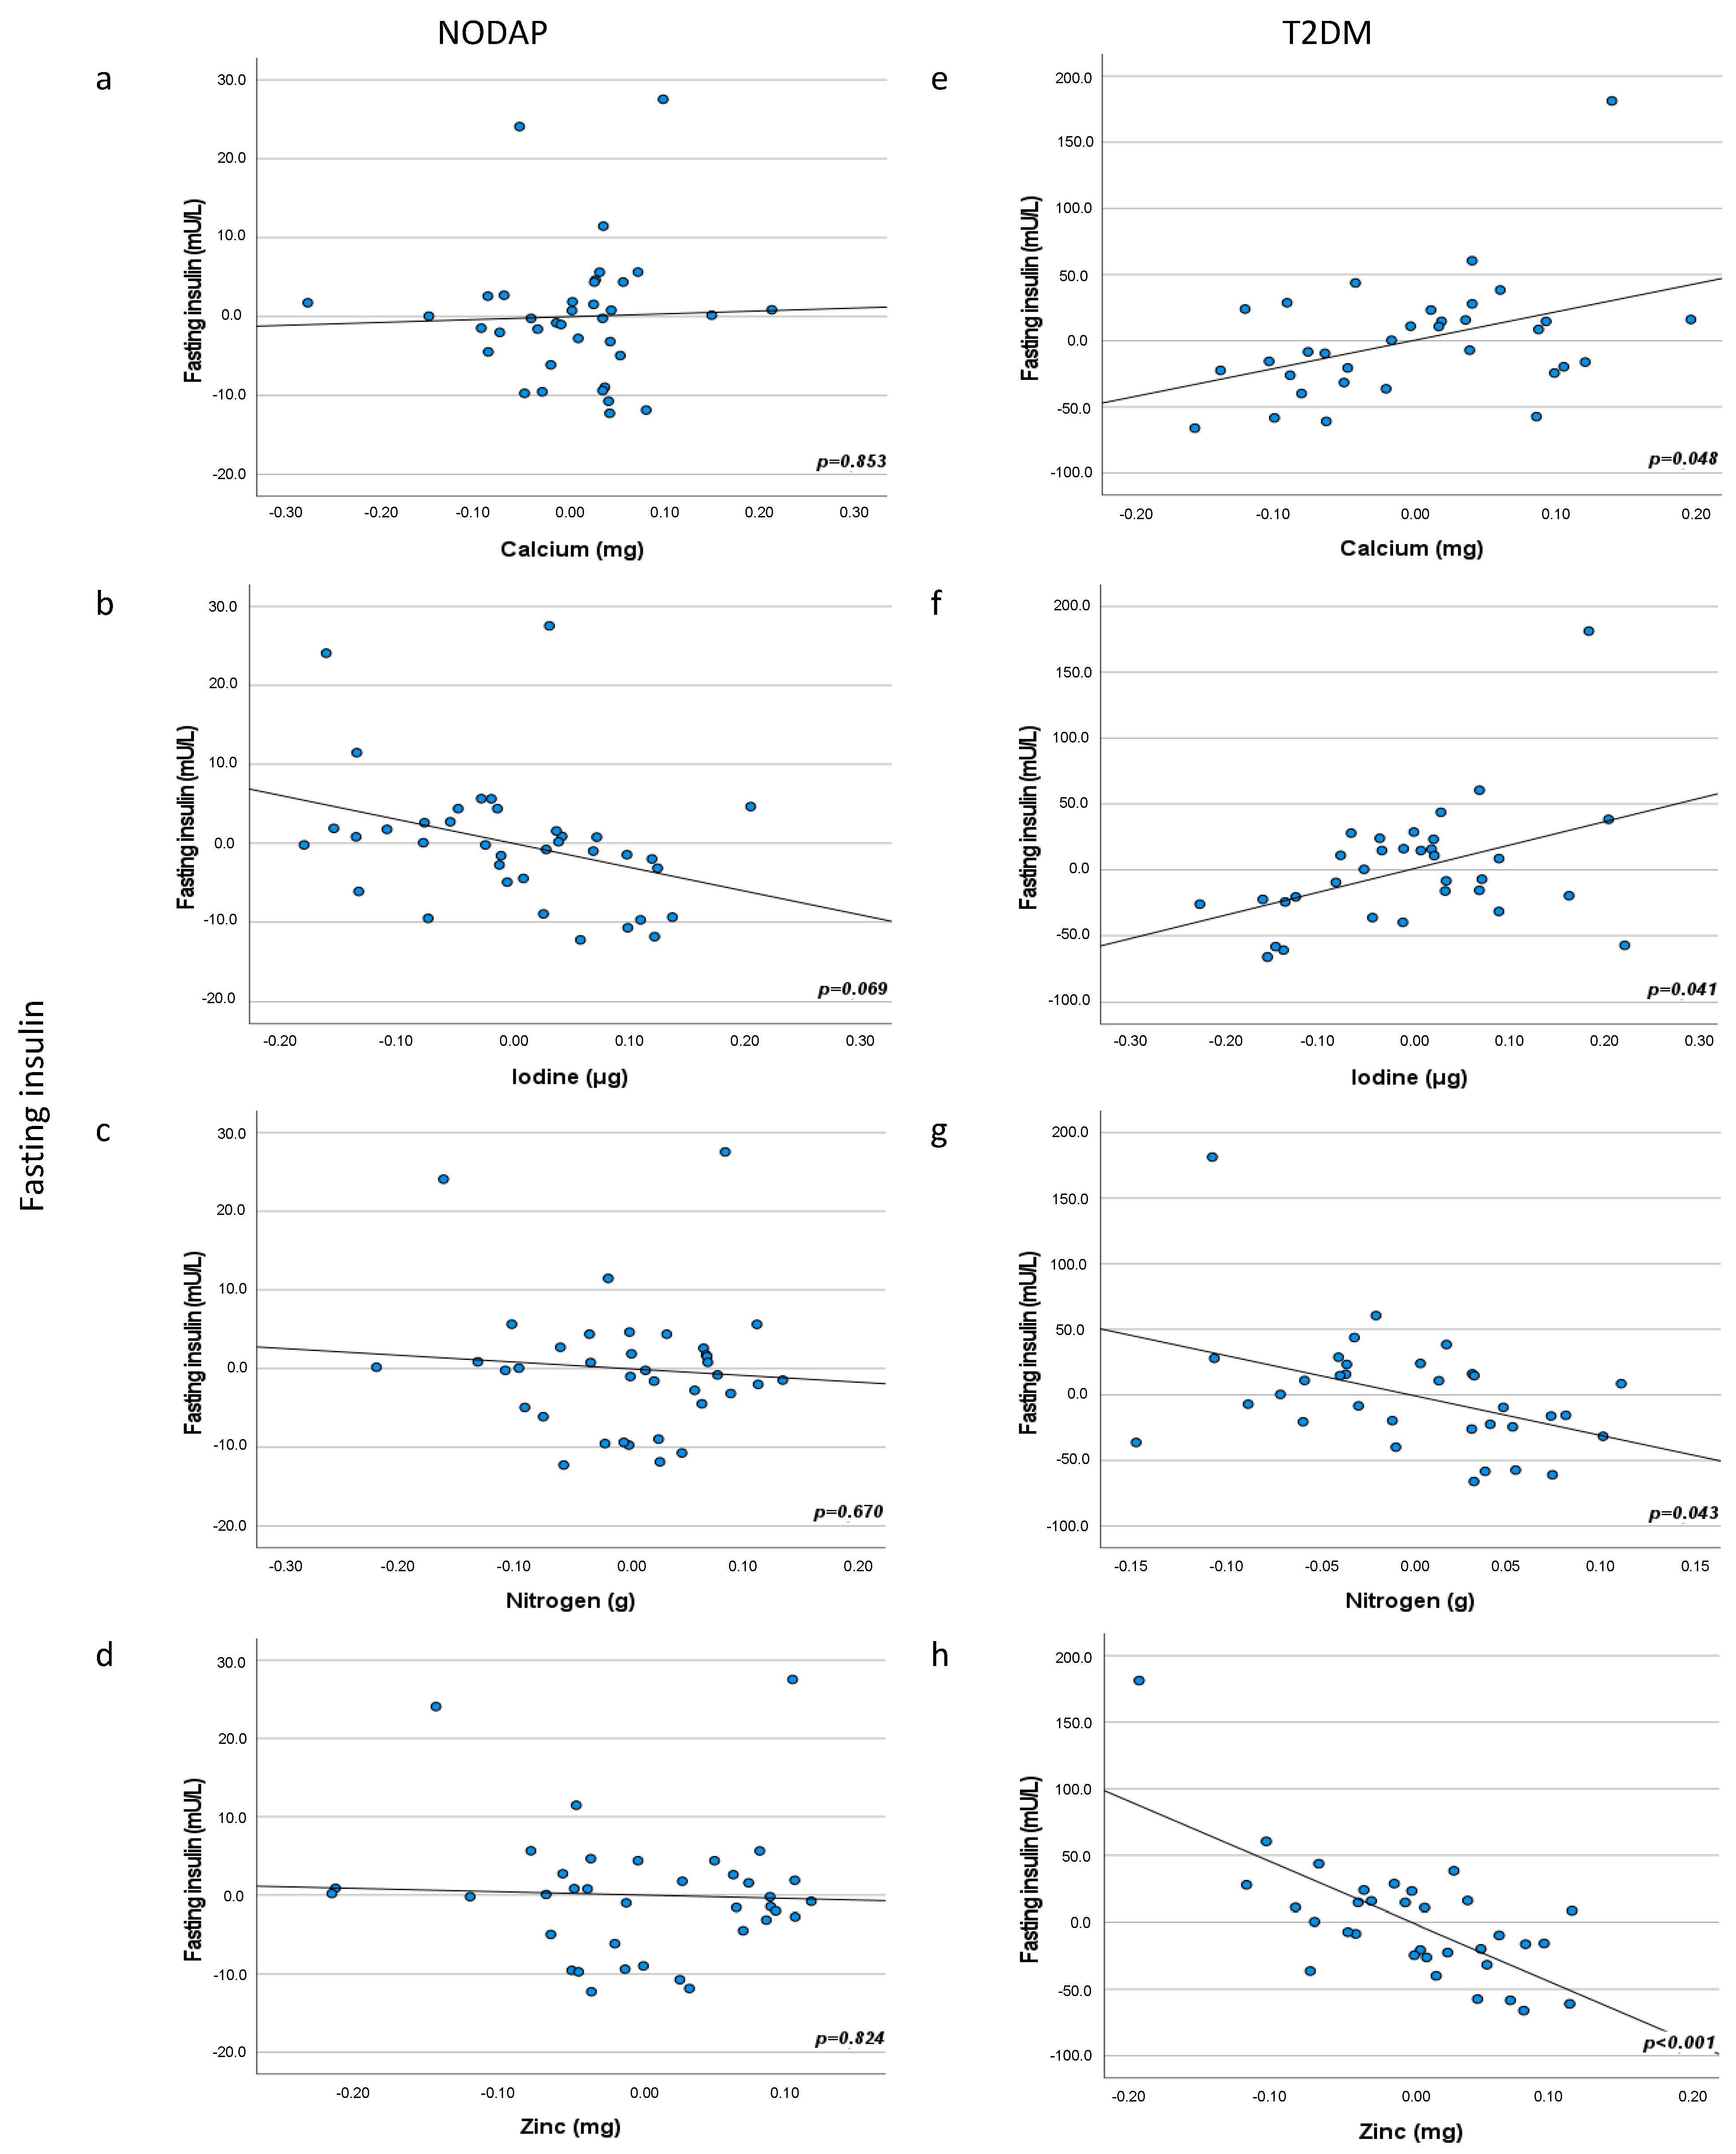
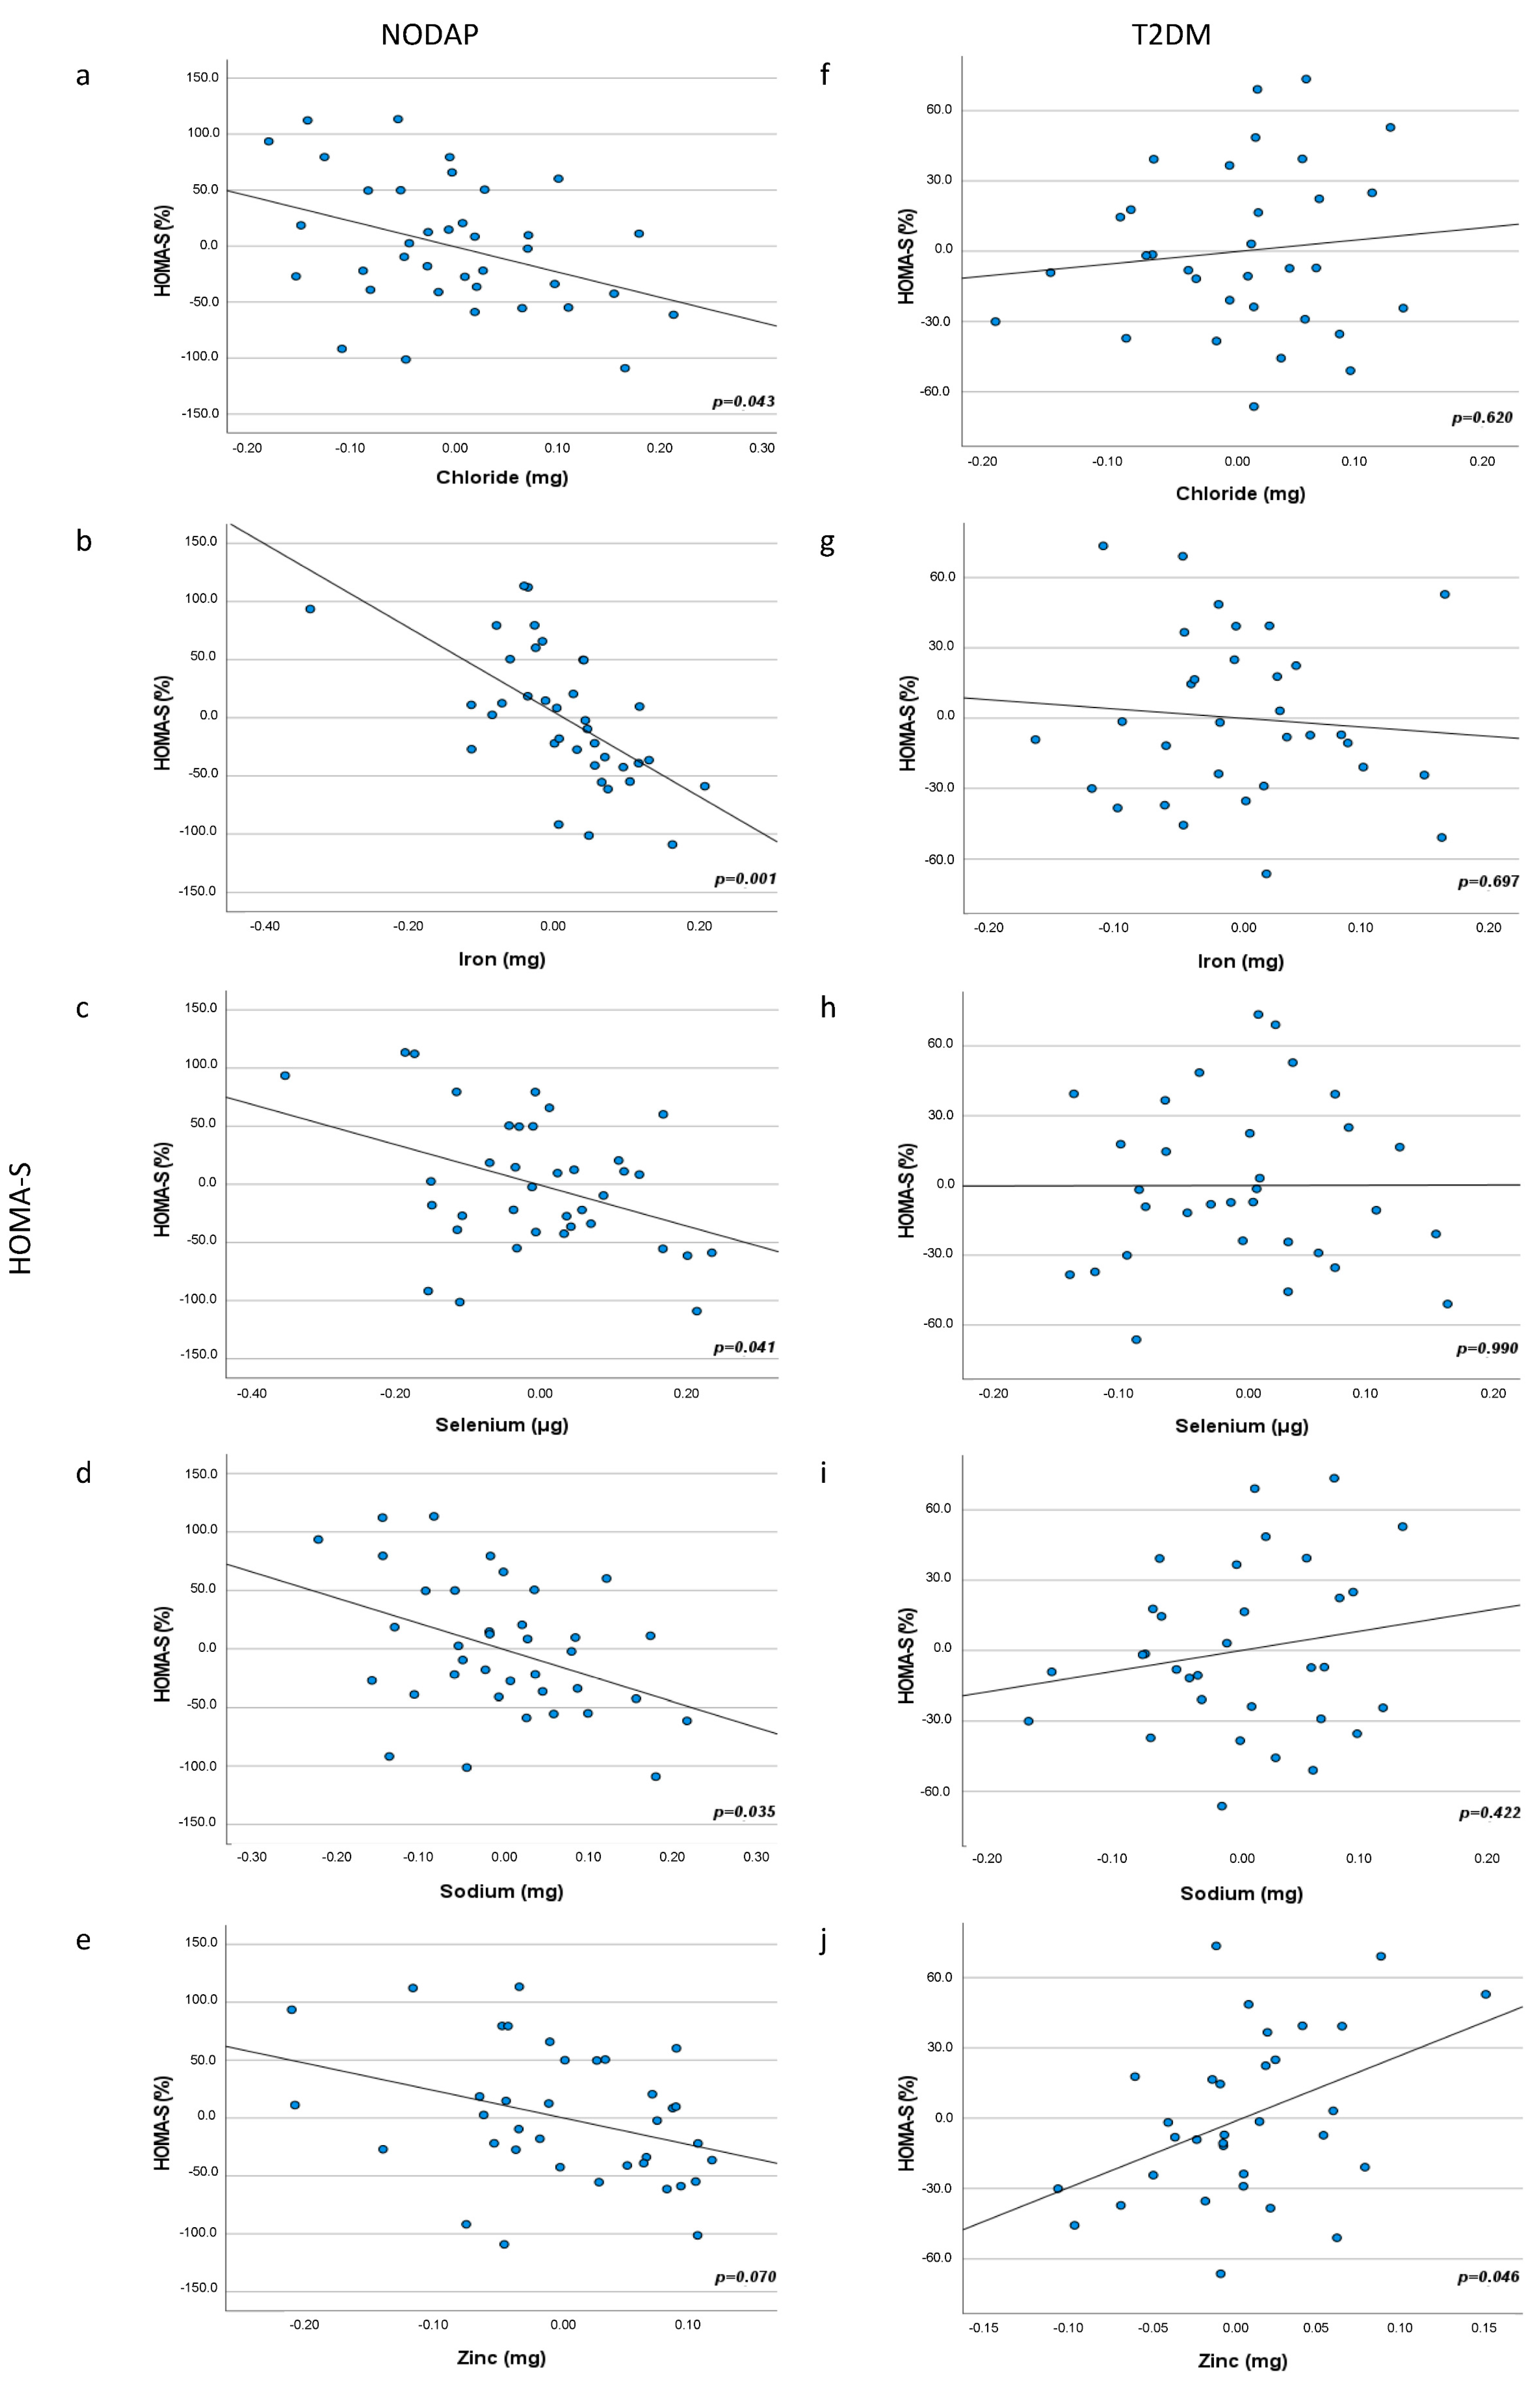
3.4. Associations between Habitual Mineral Intake and Insulin Traits in the Study Groups
4. Discussion
4.1. Manganese Intake and Glucose Metabolism
4.2. Iron Intake and Glucose Metabolism
4.3. Iodine and Selenium Intakes and Glucose Metabolism
4.4. Limitations
5. Conclusions
Author Contributions
Funding
Institutional Review Board Statement
Informed Consent Statement
Data Availability Statement
Acknowledgments
Conflicts of Interest
References
- Petrov, M.S. Post-pancreatitis diabetes mellitus: Prime time for secondary disease. Eur. J. Endocrinol. 2021, 184, R137–R149. [Google Scholar] [CrossRef]
- Xiao, A.Y.; Tan, M.L.Y.; Wu, L.M.; Asrani, V.M.; Windsor, J.A.; Yadav, D.; Petrov, M.S. Global incidence and mortality of pancreatic diseases: A systematic review, meta-analysis, and meta-regression of population-based cohort studies. Lancet Gastroenterol. Hepatol. 2016, 1, 45–55. [Google Scholar] [CrossRef]
- American Diabetes Association. Classification and diagnosis of diabetes: Standards of medical care in diabetes—2018. Diabetes Care 2018, 41, S13–S27. [Google Scholar] [CrossRef]
- Cho, J.; Petrov, M.S. Pancreatitis, pancreatic cancer, and their metabolic sequelae: Projected burden to 2050. Clin. Transl. Gastroenterol. 2020, 11, e00251. [Google Scholar] [CrossRef] [PubMed]
- Woodmansey, C.; McGovern, A.P.; McCullough, K.A.; Whyte, M.B.; Munro, N.M.; Correa, A.C.; Gatenby, P.A.; Jones, S.A.; De Lusignan, S. Incidence, demographics, and clinical characteristics of diabetes of the exocrine pancreas (type 3c): A retrospective cohort study. Diabetes Care 2017, 40, 1486–1493. [Google Scholar] [CrossRef]
- Pendharkar, S.A.; Mathew, J.; Zhao, J.; Windsor, J.A.; Exeter, D.J.; Petrov, M.S. Ethnic and geographic variations in the incidence of pancreatitis and post-pancreatitis diabetes mellitus in New Zealand: A nationwide population-based study. N. Z. Med. J. 2017, 130, 56–68. [Google Scholar]
- Shen, H.N.; Yang, C.C.; Chang, Y.H.; Lu, C.L.; Li, C.Y. Risk of diabetes mellitus after first-attack acute pancreatitis: A national population-based study. Am. J. Gastroenterol. 2015, 110, 1698–1706. [Google Scholar] [CrossRef] [PubMed]
- Bharmal, S.H.; Cho, J.; Alarcon Ramos, G.C.; Ko, J.; Stuart, C.E.; Modesto, A.E.; Singh, R.G.; Petrov, M.S. Trajectories of glycaemia following acute pancreatitis: A prospective longitudinal cohort study with 24 months follow-up. J. Gastroenterol. 2020, 55, 775–788. [Google Scholar] [CrossRef]
- Shivaprasad, C.; Aiswarya, Y.; Kejal, S.; Sridevi, A.; Anupam, B.; Ramdas, B.; Gautham, K.; Aarudhra, P. Comparison of CGM-derived measures of glycemic variability between pancreatogenic diabetes and type 2 diabetes mellitus. J. Diabetes Sci. Technol. 2021, 15, 134–140. [Google Scholar] [CrossRef] [PubMed]
- Pendharkar, S.A.; Mathew, J.; Petrov, M.S. Age- and sex-specific prevalence of diabetes associated with diseases of the exocrine pancreas: A population-based study. Dig. Liver Dis. 2017, 49, 540–544. [Google Scholar] [CrossRef]
- Bendor, C.D.; Bardugo, A.; Zucker, I.; Cukierman-Yaffe, T.; Lutski, M.; Derazne, E.; Shohat, T.; Mosenzon, O.; Tzur, D.; Sapir, A.; et al. Childhood pancreatitis and risk for incident diabetes in adulthood. Diabetes Care 2020, 43, 145–151. [Google Scholar] [CrossRef]
- Petrov, M.S. Post-pancreatitis diabetes mellitus: Investigational drugs in preclinical and clinical development and therapeutic implications. Expert Opin. Investig. Drugs 2021, 30, 737–747. [Google Scholar] [CrossRef] [PubMed]
- Evert, A.B.; Boucher, J.L.; Cypress, M.; Dunbar, S.A.; Franz, M.J.; Mayer-Davis, E.J.; Neumiller, J.J.; Nwankwo, R.; Verdi, C.L.; Urbanski, P.; et al. Nutrition therapy recommendations for the management of adults with diabetes. Diabetes Care 2014, 37, S120–S143. [Google Scholar] [CrossRef]
- American Diabetes Association. Standards of medical care in diabetes—2014. Diabetes Care 2014, 37, S14–S80. [Google Scholar] [CrossRef]
- Nield, L.; Moore, H.; Hooper, L.; Cruickshank, K.; Vyas, A.; Whittaker, V.; Summerbell, C.D. Dietary advice for treatment of type 2 diabetes mellitus in adults. Cochrane Database Syst. Rev. 2007, CD004097. [Google Scholar] [CrossRef] [PubMed]
- Andrews, R.; Cooper, A.; Montgomery, A.; Norcross, A.; Peters, T.; Sharp, D.; Jackson, N.; Fitzsimons, K.; Bright, J.; Coulman, K.; et al. Diet or diet plus physical activity versus usual care in patients with newly diagnosed type 2 diabetes: The Early ACTID randomised controlled trial. Lancet 2011, 378, 129–139. [Google Scholar] [CrossRef]
- Goldhaber-Fiebert, J.D.; Goldhaber-Fiebert, S.N.; Tristan, M.L.; Nathan, D.M. Randomized controlled community-based nutrition and exercise intervention improves glycemia and cardiovascular risk factors in type 2 diabetic patients in rural Costa Rica. Diabetes Care 2003, 26, 24–29. [Google Scholar] [CrossRef]
- Dubey, P.; Thakur, V.; Chattopadhyay, M. Role of minerals and trace elements in diabetes and insulin resistance. Nutrients 2020, 12, 1864. [Google Scholar] [CrossRef]
- Zhang, H.; Yan, C.; Yang, Z.; Zhang, W.; Niu, Y.; Li, X.; Qin, L.; Su, Q. Alterations of serum trace elements in patients with type 2 diabetes. J. Trace Elem. Med. Biol. 2017, 40, 91–96. [Google Scholar] [CrossRef]
- Villegas, R.; Gao, Y.T.; Dai, Q.; Yang, G.; Cai, H.; Li, H.; Zheng, W.; Shu, X.O. Dietary calcium and magnesium intakes and the risk of type 2 diabetes: The Shanghai Women’s Health Study. Am. J. Clin. Nutr. 2009, 89, 1059–1067. [Google Scholar] [CrossRef]
- Dong, J.Y.; Xun, P.; He, K.; Qin, L.Q. Magnesium intake and risk of type 2 diabetes: Meta-analysis of prospective cohort studies. Dia. Care 2011, 34, 2116–2122. [Google Scholar] [CrossRef] [PubMed]
- Kaur, B.; Henry, J. Micronutrient status in type 2 diabetes. In Advances in Food and Nutrition Research; Elsevier: Amsterdam, The Netherlands, 2014; pp. 55–100. [Google Scholar]
- Mancini, F.R.; Dow, C.; Affret, A.; Rajaobelina, K.; Dartois, L.; Balkau, B.; Bonnet, F.; Boutron-Ruault, M.C.; Fagherazzi, G. Micronutrient dietary patterns associated with type 2 diabetes mellitus among women of the E3N-EPIC (Etude Epidémiologique auprès de femmes de l’Education Nationale) cohort study. J. Diabetes 2018, 10, 665–674. [Google Scholar] [CrossRef] [PubMed]
- Eshak, E.S.; Muraki, I.; Imano, H.; Yamagishi, K.; Tamakoshi, A.; Iso, H. Manganese intake from foods and beverages is associated with a reduced risk of type 2 diabetes. Maturitas 2021, 143, 127–131. [Google Scholar] [CrossRef] [PubMed]
- Du, S.; Wu, X.; Han, T.; Duan, W.; Liu, L.; Qi, J.; Niu, Y.; Na, L.; Sun, C. Dietary manganese and type 2 diabetes mellitus: Two prospective cohort studies in China. Diabetology 2018, 61, 1985–1995. [Google Scholar] [CrossRef] [PubMed]
- Lee, D.H.; Folsom, A.R.; Jacobs, D.R. Dietary iron intake and type 2 diabetes incidence in postmenopausal women: The Iowa Women’s Health Study. Diabetologia 2004, 47, 185–194. [Google Scholar] [CrossRef]
- Rajpathak, S.; Ma, J.; Manson, J.; Willett, W.C.; Hu, F.B. Iron intake and the risk of type 2 diabetes in women: A prospective cohort study. Diabetes Care 2006, 29, 1370. [Google Scholar] [CrossRef]
- Luan, D.C.; Li, H.; Li, S.J.; Zhao, Z.; Li, X.; Liu, Z.M. Body iron stores and dietary iron intake in relation to diabetes in adults in North China. Diabetes Care 2008, 31, 285. [Google Scholar] [CrossRef][Green Version]
- Bao, W.; Rong, Y.; Rong, S.; Liu, L. Dietary iron intake, body iron stores, and the risk of type 2 diabetes: A systematic review and meta-analysis. BMC Med. 2012, 10, 119. [Google Scholar] [CrossRef]
- Zhao, Z.; Li, S.; Liu, G.; Yan, F.; Ma, X.; Huang, Z.; Tian, H.; Ye, J. Body iron stores and heme-iron Intake in relation to risk of type 2 diabetes: A systematic review and meta-analysis. PLoS ONE 2012, 7, e41641. [Google Scholar] [CrossRef]
- Kunutsor, S.K.; Apekey, T.A.; Walley, J.; Kain, K. Ferritin levels and risk of type 2 diabetes mellitus: An updated systematic review and meta-analysis of prospective evidence: Ferritin and Risk of Diabetes. Diabetes Metab. Res. Rev. 2013, 29, 308–318. [Google Scholar] [CrossRef]
- Stranges, S.; Sieri, S.; Vinceti, M.; Grioni, S.; Guallar, E.; Laclaustra, M.; Muti, P.; Berrino, F.; Krogh, V. A prospective study of dietary selenium intake and risk of type 2 diabetes. BMC Public Health 2010, 10, 564. [Google Scholar] [CrossRef] [PubMed]
- Siddiqi, S.M.; Sun, C.; Wu, X.; Shah, I.; Mehmood, A. The correlation between dietary selenium intake and type 2 diabetes: A cross-sectional population-based study on North Chinese adults. BioMed Res. Int. 2020, 2020, 1–10. [Google Scholar] [CrossRef] [PubMed]
- Wei, J.; Zeng, C.; Gong, Q.; Yang, H.; Li, X.; Lei, G.; Yang, T. The association between dietary selenium intake and diabetes: A cross-sectional study among middle-aged and older adults. Nutr. J. 2015, 14, 18. [Google Scholar] [CrossRef] [PubMed]
- Petrov, M.S.; Shanbhag, S.; Chakraborty, M.; Phillips, A.R.; Windsor, J.A. Organ failure and infection of pancreatic necrosis as determinants of mortality in patients with acute pancreatitis. Gastroenterology. 2010, 139, 813–820. [Google Scholar] [CrossRef] [PubMed]
- Petrov, M.S.; Basina, M. Diagnosing and classifying diabetes in diseases of the exocrine pancreas. Eur. J. Endocrinol. 2021, 184, R151–R163. [Google Scholar] [CrossRef] [PubMed]
- Das, S.L.; Singh, P.P.; Phillips, A.R.; Murphy, R.; Windsor, J.A.; Petrov, M.S. Newly diagnosed diabetes mellitus after acute pancreatitis: A systematic review and meta-analysis. Gut 2014, 63, 818–831. [Google Scholar] [CrossRef] [PubMed]
- Mulligan, A.A.; Luben, R.N.; Bhaniani, A.; Parry-Smith, D.J.; O’Connor, L.; Khawaja, A.P.; Forouhi, N.G.; Khaw, K.T. A new tool for converting food frequency questionnaire data into nutrient and food group values: FETA research methods and availability. BMJ Open 2014, 4, e004503. [Google Scholar] [CrossRef]
- Singh, R.G.; Cervantes, A.; Kim, J.U.; Nguyen, N.N.; DeSouza, S.V.; Dokpuang, D.; Lu, J.; Petrov, M.S. Intrapancreatic fat deposition and visceral fat volume are associated with the presence of diabetes after acute pancreatitis. Am. J. Physiol. Gastrointest. Liver Physiol. 2019, 316, G806–G815. [Google Scholar] [CrossRef]
- Singh, R.G.; Nguyen, N.N.; DeSouza, S.V.; Pendharkar, S.A.; Petrov, M.S. Comprehensive analysis of body composition and insulin traits associated with intra-pancreatic fat deposition in healthy individuals and people with new-onset prediabetes/diabetes after acute pancreatitis. Diabetes Obes. Metab. 2019, 21, 417–423. [Google Scholar] [CrossRef]
- Cervantes, A.; Singh, R.G.; Kim, J.U.; Desouza, S.V.; Petrov, M.S. Relationship of anthropometric indices to abdominal body composition: A multi-ethnic New Zealand magnetic resonance imaging study. J. Clin. Med. Res. 2019, 11, 435–446. [Google Scholar] [CrossRef]
- Stuart, C.E.; Singh, R.G.; Alarcon Ramos, G.C.; Priya, S.; Ko, J.; Desouza, S.V.; Cho, J.; Petrov, M.S. Relationship of pancreas volume to tobacco smoking and alcohol consumption following pancreatitis. Pancreatology 2020, 20, 60–67. [Google Scholar] [CrossRef] [PubMed]
- National Health and Medical Research Council (Australia); New Zealand Ministry of Health; Australian Department of Health and Ageing. Nutrient Reference Values for Australia and New Zealand; National Health and Medical Research Council: Canberra, Australia, 2006.
- Aschner, J.L.; Aschner, M. Nutritional aspects of manganese homeostasis. Mol. Aspects Med. 2005, 26, 353–362. [Google Scholar] [CrossRef] [PubMed]
- Li, L.; Yang, X. The essential element manganese, oxidative stress, and metabolic diseases: Links and interactions. Oxidative Med. Cell. Longev. 2018, 2018, 1–11. [Google Scholar] [CrossRef]
- Gong, J.H.; Lo, K.; Liu, Q.; Li, J.; Lai, S.; Shadyab, A.H.; Arcan, C.; Snetselaar, L.; Liu, S. Dietary manganese, plasma markers of inflammation, and the development of type 2 diabetes in postmenopausal women: Findings from the women’s health initiative. Diabetes Care 2020, 43, 1344–1351. [Google Scholar] [CrossRef]
- Koh, E.S.; Kim, S.J.; Yoon, H.E.; Chung, J.H.; Chung, S.; Park, C.W.; Chang, Y.S.; Shin, S.J. Association of blood manganese level with diabetes and renal dysfunction: A cross-sectional study of the Korean general population. BMC Endocr. Disord. 2014, 14, 24. [Google Scholar] [CrossRef]
- Yang, J.; Yang, A.; Cheng, N.; Huang, W.; Huang, P.; Liu, N.; Bai, Y. Sex-specific associations of blood and urinary manganese levels with glucose levels, insulin resistance and kidney function in US adults: National health and nutrition examination survey 2011–2016. Chemosphere 2020, 258, 126940. [Google Scholar] [CrossRef] [PubMed]
- Shan, Z.; Chen, S.; Sun, T.; Luo, C.; Guo, Y.; Yu, X.; Yang, W.; Hu, F.B.; Liu, L. U-shaped association between plasma manganese levels and type 2 diabetes. Environ. Health Perspect. 2016, 124, 1876–1881. [Google Scholar] [CrossRef]
- Bry, L.; Chen, P.C.; Sacks, D.B. Effects of hemoglobin variants and chemically modified derivatives on assays for glycohemoglobin. Clin. Chem. 2001, 47, 153. [Google Scholar] [CrossRef]
- Ghazanfari, Z.; Haghdoost, A.A.; Alizadeh, S.M.; Atapour, J.; Zolala, F. A comparison of HbA1c and fasting blood sugar tests in general population. Int. J. Prev. Med. 2010, 1, 187–194. [Google Scholar]
- Miriyala, S.; Spasojevic, I.; Tovmasyan, A.; Salvemini, D.; Vujaskovic, Z.; St. Clair, D.; Batinic-Haberle, I. Manganese superoxide dismutase, MnSOD and its mimics. Biochim. Biophys. Acta 2012, 1822, 794–814. [Google Scholar] [CrossRef]
- Nishikawa, T.; Edelstein, D.; Du, X.L.; Yamagishi, S.; Matsumura, T.; Kaneda, Y.; Yorek, M.A.; Beebe, D.; Oates, P.J.; Hammes, H.; et al. Normalizing mitochondrial superoxide production blocks three pathways of hyperglycaemic damage. Nature 2000, 404, 787–790. [Google Scholar] [CrossRef] [PubMed]
- Ściskalska, M.; Ołdakowska, M.; Marek, G.; Milnerowicz, H. Changes in the activity and concentration of superoxide dismutase isoenzymes (Cu/Zn SOD, MnSOD) in the blood of healthy subjects and patients with acute pancreatitis. Antioxidants 2020, 9, 948. [Google Scholar] [CrossRef] [PubMed]
- Lee, S.-H.; Jouihan, H.A.; Cooksey, R.C.; Jones, D.; Kim, H.J.; Winge, D.R.; McClain, D.A. Manganese supplementation protects against diet-induced diabetes in wild type mice by enhancing insulin secretion. Endocrinology 2013, 154, 1029–1038. [Google Scholar] [CrossRef] [PubMed]
- Burlet, E.; Jain, S.K. Manganese supplementation increases adiponectin and lowers ICAM-1 and creatinine blood levels in Zucker type 2 diabetic rats, and downregulates ICAM-1 by upregulating adiponectin multimerization protein (DsbA-L) in endothelial cells. Mol. Cell. Biochem. 2017, 429, 1–10. [Google Scholar] [CrossRef] [PubMed]
- Hope, S.J.; Daniel, K.; Gleason, K.L.; Comber, S.; Nelson, M.; Powell, J.J. Influence of tea drinking on manganese intake, manganese status and leucocyte expression of MnSOD and cytosolic aminopeptidase P. Eur. J. Clin. Nutr. 2006, 60, 1–8. [Google Scholar] [CrossRef] [PubMed]
- Pendharkar, S.A.; Singh, R.G.; Chand, S.K.; Cervantes, A.; Petrov, M.S. Pro-inflammatory cytokines after an episode of acute pancreatitis: Associations with fasting gut hormone profile. Inflamm. Res. 2018, 67, 339–350. [Google Scholar] [CrossRef]
- Sankaran, S.J.; Xiao, A.Y.; Wu, L.M.; Windsor, J.A.; Forsmark, C.E.; Petrov, M.S. Frequency of progression from acute to chronic pancreatitis and risk factors: A meta-analysis. Gastroenterology 2015, 149, 1490–1500e1. [Google Scholar] [CrossRef]
- Armstrong, J.A.; Cash, N.; Soares, P.M.; Souza, M.H.; Sutton, R.; Criddle, D.N. Oxidative stress in acute pancreatitis: Lost in translation? Free Radic. Res. 2013, 47, 917–933. [Google Scholar] [CrossRef]
- Ansari, T.M.; Ikram, N.; Najam-ul-Haq, M.; Fayyaz, I.; Fayyaz, Q.; Ghafoor, I.; Khalid, N. Essential trace metal (zinc, manganese, copper and iron) levels in plants of medicinal importance. J. Biolog. Sci. 2004, 4, 95–99. [Google Scholar] [CrossRef]
- New Zealand Food Composition Database; The New Zealand Institute for Plant & Food Research Limited and Ministry of Health: Auckland, New Zealand, 2019.
- Hurrell, R.; Egli, I. Iron bioavailability and dietary reference values. Am. J. Clin. Nutr. 2010, 91, 1461S–1467S. [Google Scholar] [CrossRef]
- Fillebeen, C.; Lam, N.H.; Chow, S.; Botta, A.; Sweeney, G.; Pantopoulos, K. Regulatory connections between iron and glucose metabolism. Int. J. Mol. Sci. 2020, 21, 7773. [Google Scholar] [CrossRef] [PubMed]
- Przybyszewska, J.; Żekanowska, E. The role of hepcidin, ferroportin, HCP1, and DMT1 protein in iron absorption in the human digestive tract. Gastroenterol. Rev. 2014, 4, 208–213. [Google Scholar] [CrossRef]
- Nishito, Y.; Kambe, T. Absorption mechanisms of iron, copper, and zinc: An overview. J. Nutr. Sci. Vitaminol. 2018, 64, 1–7. [Google Scholar] [CrossRef] [PubMed]
- Zhang, A.S.; Enns, C.A. Molecular mechanisms of normal iron homeostasis. Hematology 2009, 2009, 207–214. [Google Scholar] [CrossRef]
- Bowers, K.; Yeung, E.; Williams, M.A.; Qi, L.; Tobias, D.K.; Hu, F.B.; Zhang, C. A prospective study of prepregnancy dietary iron intake and risk for gestational diabetes mellitus. Diabetes Care 2011, 34, 1557. [Google Scholar] [CrossRef]
- Zhang, C.; Rawal, S. Dietary iron intake, iron status, and gestational diabetes. Am. J. Clin. Nutr. 2017, 106, 1672S–1680S. [Google Scholar] [CrossRef] [PubMed]
- Fu, S.; Li, F.; Zhou, J.; Liu, Z. The relationship between body iron status, iron intake and gestational diabetes: A systematic review and meta-analysis. Medicine 2016, 95, e2383. [Google Scholar] [CrossRef]
- Dos Santos Vieira, D.; Hermes Sales, C.; Galvão Cesar, C.; Marchioni, D.; Fisberg, R. Influence of haem, non-haem, and total iron intake on metabolic syndrome and its components: A population-based study. Nutrients 2018, 10, 314. [Google Scholar] [CrossRef]
- Zhu, Z.; Wu, F.; Lu, Y.; Wu, C.; Wang, Z.; Zang, J.; Guo, C.; Jia, X.; Yao, J.; Peng, H.; et al. Total and nonheme dietary iron intake is associated with metabolic syndrome and its components in Chinese men and women. Nutrients 2018, 10, 1663. [Google Scholar] [CrossRef]
- Utzschneider, K.M.; Kowdley, K.V. Hereditary hemochromatosis and diabetes mellitus: Implications for clinical practice. Nat. Rev. Endocrinol. 2010, 6, 26–33. [Google Scholar] [CrossRef]
- De Sanctis, V.; Soliman, A.T.; Elsedfy, H.; Pepe, A.; Kattamis, C.; El Kholy, M.; Yassin, M. Diabetes and glucose metabolism in thalassemia major: An update. Expert Rev. Hematol. 2016, 9, 401–408. [Google Scholar] [CrossRef]
- Kimita, W.; Li, X.; Ko, J.; Bharmal, S.H.; Cameron-Smith, D.; Petrov, M.S. Association between habitual dietary iron intake and glucose metabolism in individuals after acute pancreatitis. Nutrients 2020, 12, 3579. [Google Scholar] [CrossRef]
- Shi, Z.; Zhou, M.; Yuan, B.; Qi, L.; Dai, Y.; Luo, Y.; Holmboe-Ottesen, G. Iron intake and body iron stores, anaemia and risk of hyperglycaemia among Chinese adults: The prospective Jiangsu Nutrition Study (JIN). Public Health Nutr. 2010, 13, 1319–1327. [Google Scholar] [CrossRef]
- Chand, S.K.; Singh, R.G.; Pendharkar, S.A.; Petrov, M.S. Iron: A strong element in the pathogenesis of chronic hyperglycaemia after acute pancreatitis. Biol. Trace Elem. Res. 2018, 183, 71–79. [Google Scholar] [CrossRef] [PubMed]
- Ford, E.S.; Cogswell, M.E. Diabetes and serum ferritin concentration among U.S. adults. Diabetes Care 1999, 22, 1978–1983. [Google Scholar] [CrossRef]
- Jiang, R.; Manson, J.E.; Meigs, J.B.; Ma, J.; Rifai, N.; Hu, F.B. Body iron stores in relation to risk of type 2 diabetes in apparently healthy women. JAMA 2004, 291, 711. [Google Scholar] [CrossRef] [PubMed]
- Sun, L.; Zong, G.; Pan, A.; Ye, X.; Li, H.; Yu, Z.; Zhao, Y.; Zou, S.; Yu, D.; Jin, Q.; et al. Elevated plasma ferritin is associated with increased incidence of type 2 diabetes in middle-aged and elderly Chinese adults. J. Nutr. 2013, 143, 1459–1465. [Google Scholar] [CrossRef] [PubMed]
- Hernandez, C.; Lecube, A.; Carrera, A.; Simo, R. Soluble transferrin receptors and ferritin in type 2 diabetic patients. Diabetes Med. 2005, 22, 97–101. [Google Scholar] [CrossRef]
- Van Campenhout, A.; Van Campenhout, C.; Lagrou, A.R.; Abrams, P.; Moorkens, G.; Van Gaal, L.; Manuel-y-Keenoy, B. Impact of diabetes mellitus on the relationships between iron-, inflammatory- and oxidative stress status. Diab. Metab. Res. Rev. 2006, 22, 444–454. [Google Scholar] [CrossRef]
- Kimita, W.; Petrov, M.S. Iron metabolism and the exocrine pancreas. Clin. Chim. Acta 2020, 511, 167–176. [Google Scholar] [CrossRef]
- New Zealand Ministry of Health; University of Otago. A Focus on Nutrition: Key Findings of the 2008/09 New Zealand Adult Nutrition Survey; Ministry of Health: Wellington, New Zealand, 2011.
- Solovyev, N.; Vanhaecke, F.; Michalke, B. Selenium and iodine in diabetes mellitus with a focus on the interplay and speciation of the elements. J. Trace Elem. Med. Biol. 2019, 56, 69–80. [Google Scholar] [CrossRef]
- Liu, J.; Liu, L.; Jia, Q.; Zhang, X.; Jin, X.; Shen, H. Effects of excessive iodine intake on blood glucose, blood pressure, and blood lipids in adults. Biol. Trace Elem. Res. 2019, 192, 136–144. [Google Scholar] [CrossRef] [PubMed]
- Zimmermann, M.B. Iodine deficiency. Endocr. Rev. 2009, 30, 376–408. [Google Scholar] [CrossRef] [PubMed]
- Vejbjerg, P.; Knudsen, N.; Perrild, H.; Laurberg, P.; Andersen, S.; Rasmussen, L.B.; Ovesen, L.; Jørgensen, T. Estimation of iodine intake from various urinary iodine measurements in population studies. Thyroid 2009, 19, 1281–1286. [Google Scholar] [CrossRef] [PubMed]
- Kim, K.; Cho, S.W.; Park, Y.J. Association between iodine intake, thyroid function, and papillary thyroid cancer: A case-control study. Endocrinol. Metab. 2021, 36, 790–799. [Google Scholar] [CrossRef]
- Chung, H.R. Iodine and thyroid function. Ann. Pediatr. Endocrinol. Metab. 2014, 19, 8. [Google Scholar] [CrossRef]
- Hwang, S.; Lee, E.Y.; Lee, W.K.; Shin, D.Y.; Lee, E.J. Correlation between iodine intake and thyroid function in subjects with normal thyroid function. Biol. Trace Elem. Res. 2011, 143, 1393–1397. [Google Scholar] [CrossRef]
- Hage, M.; Zantout, M.S.; Azar, S.T. Thyroid disorders and diabetes mellitus. J. Thyroid. Res. 2011, 2011, 1–7. [Google Scholar] [CrossRef] [PubMed]
- Wang, C. The relationship between type 2 diabetes mellitus and related thyroid diseases. J. Diabetes Res. 2013, 2013, 1–9. [Google Scholar] [CrossRef]
- Duntas, L.H.; Orgiazzi, J.; Brabant, G. The interface between thyroid and diabetes mellitus: Interface between thyroid and diabetes mellitus. Clin. Endocrinol. 2011, 75, 1–9. [Google Scholar] [CrossRef]
- Maxon, H.R. Long-term observations of glucose tolerance in thyrotoxic patients. Arch. Intern. Med. 1975, 135, 1477. [Google Scholar] [CrossRef]
- Mancini, F.R.; Rajaobelina, K.; Dow, C.; Habbal, T.; Affret, A.; Balkau, B.; Bonnet, F.; Boutron-Ruault, M.; Fagherazzi, G. High iodine dietary intake is associated with type 2 diabetes among women of the E3N-EPIC cohort study. Clin. Nutr. 2019, 38, 1651–1656. [Google Scholar] [CrossRef]
- Kieliszek, M. The latest research and development of minerals in human nutrition. Chapter Eleven—Selenium. In Advances in Food and Nutrition Research; Eskin, N.A.M., Ed.; Academic Press: Cambridge, MA, USA, 2021; pp. 417–429. [Google Scholar]
- Mehdi, Y.; Hornick, J.L.; Istasse, L.; Dufrasne, I. Selenium in the environment, metabolism and involvement in body functions. Molecules 2013, 18, 3292. [Google Scholar] [CrossRef]
- Bleys, J.; Navas-Acien, A.; Guallar, E. Serum selenium and diabetes in U.S. adults. Diabetes Care 2007, 30, 829–834. [Google Scholar] [CrossRef]
- Stapleton, S.R. Selenium: An insulin mimetic. Cell. Mol. Life Sci. 2000, 57, 1874–1879. [Google Scholar] [CrossRef]
- Mueller, A.S.; Pallauf, J. Compendium of the antidiabetic effects of supranutritional selenate doses. In vivo and in vitro investigations with type II diabetic db/db mice. J. Nutr. Biochem. 2006, 17, 548–560. [Google Scholar] [CrossRef]
- Stranges, S.; Marshall, J.R.; Natarajan, R.; Donahue, R.P.; Trevisan, M.; Combs, G.F.; Cappuccio, F.P.; Ceriello, A.; Reid, M.E. Effects of long-term selenium supplementation on the incidence of type 2 diabetes: A randomized trial. Ann. Intern. Med. 2007, 147, 217. [Google Scholar] [CrossRef] [PubMed]
- Behar, A.; Dennouni-Medjati, N.; Dali-Sahi, M.; Harek, Y.; Belhadj, M.; Benslama, Y.; Kachecouche, Y. Dietary selenium intake and risk of type 2 diabetes in a female population of western Algeria. Nutr. Clin. Métabolisme 2020, 34, 254–258. [Google Scholar] [CrossRef]
- Vinceti, M.; Filippini, T.; Rothman, K.J. Selenium exposure and the risk of type 2 diabetes: A systematic review and meta-analysis. Eur. J. Epidemiol. 2018, 33, 789–810. [Google Scholar] [CrossRef] [PubMed]
- Gauthier, B.R.; Sola-García, A.; Cáliz-Molina, M.Á.; Lorenzo, P.I.; Cobo-Vuilleumier, N.; Capilla-González, V.; Martin-Montalvo, A. Thyroid hormones in diabetes, cancer, and aging. Aging Cell 2020, 19, e13260. [Google Scholar] [CrossRef] [PubMed]
- Longkumer, C.; Nath, C.; Barman, B.; Ruram, A.; Visi, V.; Yasir, M.; Sangma, M. Idiopathic post prandial glucose lowering, a whistle blower for subclinical hypothyroidism and insulin resistance. A cross-sectional study in tertiary care centre of northeast India. J. Fam. Med. Prim. Care 2020, 9, 4637. [Google Scholar]
- Maratou, E.; Hadjidakis, D.J.; Kollias, A.; Tsegka, K.; Peppa, M.; Alevizaki, M.; Mitrou, P.; Lambadiari, V.; Boutaki, E.; Nikzas, D.; et al. Studies of insulin resistance in patients with clinical and subclinical hypothyroidism. Eur. J. Endocrinol. 2009, 160, 785–790. [Google Scholar] [CrossRef]
- Yang, N.; Zhang, D.-L.; Hao, J.-Y.; Wang, G. Serum levels of thyroid hormones and thyroid stimulating hormone in patients with biliogenic and hyperlipidaemic acute pancreatitis: Difference and value in predicting disease severity. J. Int. Med. Res. 2016, 44, 267–277. [Google Scholar] [CrossRef] [PubMed]
- De Sola, C.; Redondo, M.; Pallarés, F.; Redondo, E.; Hortas, M.L.; Morell, M. Thyroid function in acute pancreatitis. Rev. Esp. Enferm. Dig. 1998, 90, 15–22. [Google Scholar] [PubMed]
- Medina-Santillán, R.; Vázquez-Savedra, J.A.; Tanimoto, M.; Gordon, F.; García-Manzo, N.T. Decrease in the serum concentration of triiodothyronine in patients with acute edematous pancreatitis. Arch. Invest. Med. 1989, 20, 243–245. [Google Scholar]
- Update Report on the Dietary Iodine Intake of New Zealand Children Following Fortification of Bread with Iodine; New Zealand Ministry for Primary Industries: Wellington, New Zealand, 2014.
- The Addition of Folic Acid and Iodised Salt to Bread: New Zealand User Guide on Implementing the New Zealand Standards; New Zealand Ministry for Primary Industries: Wellington, New Zealand, 2012.
- Kieliszek, M. Selenium—Fascinating microelement, properties and sources in food. Molecules 2019, 24, 1298. [Google Scholar] [CrossRef]
- Gibson, R.S. Principles of Nutritional Assessment, 2nd ed.; Oxford University Press: New York, NY, USA, 2005. [Google Scholar]
- Kowalkowska, J.; Slowinska, M.; Slowinski, D.; Dlugosz, A.; Niedzwiedzka, E.; Wadolowska, L. Comparison of a full food-frequency questionnaire with the three-day unweighted food records in young Polish adult women: Implications for dietary assessment. Nutrients 2013, 5, 2747. [Google Scholar] [CrossRef]
- Roth, J.A.; Garrick, M.D. Iron interactions and other biological reactions mediating the physiological and toxic actions of manganese. Biochem. Pharmacol. 2003, 66, 1–13. [Google Scholar] [CrossRef]
- Finley, J.W. Manganese absorption and retention by young women is associated with serum ferritin concentration. Am. J. Clin. Nutr. 1999, 70, 37–43. [Google Scholar] [CrossRef]
- Kaess, B.M.; Pedley, A.; Massaro, J.M.; Murabito, J.; Hoffmann, U.; Fox, C.S. The ratio of visceral to subcutaneous fat, a metric of body fat distribution, is a unique correlate of cardiometabolic risk. Diabetologia 2012, 55, 2622–2630. [Google Scholar] [CrossRef] [PubMed]


| Characteristic | Total | NODAP | T2DM | NAP | p * |
|---|---|---|---|---|---|
| (n = 106) | (n = 37) | (n = 37) | (n = 32) | ||
| Age | 56.1 (14.5) | 58.9 (14.4) | 57.2(15.0) | 51.6(13.3) | 0.094 |
| Sex | 0.031 | ||||
| Men | 69 (65.1) | 26 (70.3) | 28 (75.7) | 15 (46.9) | |
| Women | 37 (34.9) | 11 (29.7) | 9 (24.3) | 17 (53.1) | |
| Daily energy intake (kcal) | 1686 (609) | 1776 (692) | 1728 (534) | 1534 (574) | 0.226 |
| V/S fat volume ratio | 0.77 (0.43) | 0.81 (0.40) | 0.87 (0.46) | 0.61 (0.40) | 0.035 |
| Alcohol intake (g/day) | 11.1 (17.9) | 13.4 (21.9) | 8.7 (13.1) | 11.1 (17.7) | 0.527 |
| Smoking status | 0.052 | ||||
| Never | 47 (44) | 11 30) | 21 (57) | 15 (47) | |
| Former | 35 (33) | 16 (4) | 11 (30) | 8 (25) | |
| Light (<20 a/d) | 8 (8) | 3 (8) | 2 (5) | 3 (9) | |
| Moderate (20–39 a/d) | 15 (14) | 7 (19) | 2 (5) | 6 (19) | |
| Heavy (>39 a/d) | 0 (0) | 0 (0) | 0 (0) | 0 (0) | |
| Aetiology of AP | 0.563 | ||||
| Biliary | 40 (38) | 14 (38) | 14 (38) | 12 (38) | |
| Alcohol-related | 21 (20) | 12 (32) | 5 (14) | 4 (13) | |
| Other | 45 (43) | 11 (30) | 18 (49) | 16 (50) | |
| Number of AP episodes | 1.9 (2.8) | 2.3 (3.8) | 1.4 (1.0) | 1.8 (2.8) | 0.434 |
| Cholecystectomy | 0.538 | ||||
| No | 66 (62) | 24 (65) | 25 (68) | 17 (53) | |
| Yes | 39 (37) | 13 (35) | 12 (32) | 14 (44) | |
| Use of anti-diabetic medications | <0.001 | ||||
| None | 92 (87) | 37 (100) | 23 (62) | 32 (100) | |
| Oral medication | 8 (8) | 0 (0) | 8 (22) | 0 (0) | |
| Insulin | 6 (6) | 0 (0) | 6 (16) | 0 (0) | |
| HbA1c (mmol/mol) | 40.61 (10.82) | 39.05 (4.80) | 47.19 (15.23) | 34.61 (2.55) | <0.001 |
| Fasting plasma glucose (mmol/L) | 5.86 (1.74) | 5.86 (0.92) | 6.61 (2.55) | 4.96 (0.34) | <0.001 |
| Fasting insulin (mU/L) | 16.68 (36.01) | 12.98 (9.96) | 24.62 (59.95) | 12.15 (10.27) | 0.277 |
| HOMA-S (%) | 0.88 (0.74) | 1.02 (1.06) | 0.72 (0.44) | 0.90 (0.49) | 0.228 |
| HOMA-β (%) | 106.97 (56.87) | 95.74 (45.63) | 103.24 (57.12) | 125.07 (65.87) | 0.098 |
| Mineral | Model | T2DM | NODAP | ||||||
|---|---|---|---|---|---|---|---|---|---|
| β | p | 95% CI | β | p | 95% CI | ||||
| Lower | Upper | Lower | Upper | ||||||
| Calcium (mg) | 1 | 0.009 | 0.821 | −0.070 | 0.089 | −0.023 | 0.565 | −0.102 | 0.056 |
| 2 | −0.020 | 0.537 | −0.082 | 0.043 | −0.059 | 0.063 | −0.120 | 0.003 | |
| 3 | −0.018 | 0.581 | −0.080 | 0.045 | −0.058 | 0.064 | −0.120 | 0.003 | |
| 4 | −0.022 | 0.506 | −0.089 | 0.044 | −0.057 | 0.073 | −0.120 | 0.005 | |
| 5 | −0.010 | 0.797 | −0.087 | 0.067 | −0.056 | 0.091 | −0.121 | 0.009 | |
| Chloride (mg) | 1 | 0.047 | 0.326 | −0.047 | 0.141 | 0.040 | 0.396 | −0.053 | 0.133 |
| 2 | 0.000 | 0.996 | −0.057 | 0.057 | −0.020 | 0.471 | −0.077 | 0.036 | |
| 3 | 0.003 | 0.926 | −0.054 | 0.060 | −0.020 | 0.471 | −0.077 | 0.036 | |
| 4 | 0.002 | 0.939 | −0.057 | 0.061 | −0.023 | 0.417 | −0.079 | 0.033 | |
| 5 | 0.024 | 0.492 | −0.045 | 0.093 | −0.025 | 0.394 | −0.084 | 0.033 | |
| Copper (mg) | 1 | 0.123 | 0.012 | 0.027 | 0.219 | 0.090 | 0.064 | −0.005 | 0.185 |
| 2 | 0.073 | 0.039 | 0.004 | 0.141 | 0.026 | 0.445 | −0.042 | 0.094 | |
| 3 | 0.078 | 0.026 | 0.010 | 0.146 | 0.026 | 0.436 | −0.041 | 0.093 | |
| 4 | 0.072 | 0.049 | 0.000 | 0.144 | 0.026 | 0.458 | −0.043 | 0.094 | |
| 5 | 0.061 | 0.147 | −0.022 | 0.145 | 0.019 | 0.592 | −0.052 | 0.090 | |
| Iodine (μg) | 1 | 0.046 | 0.259 | −0.034 | 0.126 | 0.017 | 0.675 | −0.063 | 0.097 |
| 2 | 0.030 | 0.402 | −0.040 | 0.099 | −0.007 | 0.846 | −0.076 | 0.062 | |
| 3 | 0.037 | 0.269 | −0.029 | 0.104 | −0.007 | 0.843 | −0.073 | 0.059 | |
| 4 | 0.015 | 0.666 | −0.054 | 0.084 | −0.009 | 0.787 | −0.074 | 0.056 | |
| 5 | 0.010 | 0.811 | −0.071 | 0.091 | 0.000 | 0.990 | −0.069 | 0.068 | |
| Iron (mg) | 1 | 0.012 | 0.785 | −0.076 | 0.101 | −0.002 | 0.963 | −0.090 | 0.086 |
| 2 | −0.037 | 0.205 | −0.096 | 0.021 | −0.064 | 0.029 | −0.122 | −0.007 | |
| 3 | −0.036 | 0.220 | −0.095 | 0.022 | −0.064 | 0.030 | −0.122 | −0.006 | |
| 4 | −0.034 | 0.272 | −0.094 | 0.027 | −0.061 | 0.036 | −0.119 | −0.004 | |
| 5 | −0.034 | 0.342 | −0.104 | 0.036 | −0.076 | 0.013 | −0.135 | −0.016 | |
| Magnesium (mg) | 1 | 0.025 | 0.513 | −0.051 | 0.100 | 0.034 | 0.371 | −0.041 | 0.109 |
| 2 | −0.013 | 0.582 | −0.062 | 0.035 | −0.013 | 0.581 | −0.061 | 0.035 | |
| 3 | −0.011 | 0.665 | −0.059 | 0.038 | −0.013 | 0.579 | −0.061 | 0.034 | |
| 4 | −0.015 | 0.559 | −0.066 | 0.036 | −0.013 | 0.600 | −0.061 | 0.035 | |
| 5 | −0.016 | 0.589 | −0.076 | 0.043 | −0.017 | 0.516 | −0.067 | 0.034 | |
| Manganese (mg) | 1 | 0.022 | 0.687 | −0.085 | 0.128 | 0.028 | 0.600 | −0.078 | 0.134 |
| 2 | −0.006 | 0.878 | −0.089 | 0.076 | −0.017 | 0.687 | −0.098 | 0.065 | |
| 3 | −0.003 | 0.942 | −0.085 | 0.079 | −0.017 | 0.688 | −0.098 | 0.065 | |
| 4 | −0.021 | 0.633 | −0.107 | 0.065 | −0.020 | 0.634 | −0.101 | 0.062 | |
| 5 | −0.049 | 0.343 | −0.150 | 0.053 | −0.035 | 0.418 | −0.121 | 0.051 | |
| Nitrogen (g) | 1 | 0.010 | 0.784 | −0.060 | 0.079 | −0.025 | 0.474 | −0.094 | 0.044 |
| 2 | −0.023 | 0.299 | −0.066 | 0.021 | −0.066 | 0.003 | −0.109 | −0.023 | |
| 3 | −0.021 | 0.346 | −0.064 | 0.023 | −0.066 | 0.003 | −0.109 | −0.023 | |
| 4 | −0.042 | 0.055 | −0.086 | 0.001 | −0.065 | 0.002 | −0.106 | −0.024 | |
| 5 | −0.033 | 0.205 | −0.084 | 0.018 | −0.066 | 0.003 | −0.110 | −0.023 | |
| Phosphorous (mg) | 1 | 0.017 | 0.610 | −0.048 | 0.081 | −0.005 | 0.880 | −0.069 | 0.059 |
| 2 | −0.017 | 0.291 | −0.050 | 0.015 | −0.046 | 0.005 | −0.078 | −0.014 | |
| 3 | −0.015 | 0.351 | −0.047 | 0.017 | −0.046 | 0.005 | −0.078 | −0.015 | |
| 4 | −0.026 | 0.124 | −0.059 | 0.007 | −0.045 | 0.005 | −0.077 | −0.014 | |
| 5 | −0.023 | 0.241 | −0.061 | 0.015 | −0.046 | 0.006 | −0.078 | −0.014 | |
| Potassium (mg) | 1 | 0.017 | 0.642 | −0.055 | 0.088 | 0.020 | 0.578 | −0.051 | 0.091 |
| 2 | −0.019 | 0.449 | −0.069 | 0.031 | −0.025 | 0.318 | −0.074 | 0.024 | |
| 3 | −0.015 | 0.543 | −0.064 | 0.034 | −0.025 | 0.310 | −0.073 | 0.023 | |
| 4 | −0.018 | 0.492 | −0.069 | 0.034 | −0.024 | 0.324 | −0.073 | 0.024 | |
| 5 | −0.020 | 0.510 | −0.080 | 0.040 | −0.026 | 0.322 | −0.076 | 0.025 | |
| Selenium (μg) | 1 | 0.058 | 0.202 | −0.032 | 0.147 | 0.035 | 0.439 | −0.054 | 0.123 |
| 2 | 0.024 | 0.445 | −0.038 | 0.085 | −0.011 | 0.716 | −0.072 | 0.049 | |
| 3 | −0.011 | 0.713 | −0.071 | 0.049 | −0.011 | 0.713 | −0.071 | 0.049 | |
| 4 | 0.009 | 0.780 | −0.053 | 0.071 | −0.014 | 0.637 | −0.073 | 0.045 | |
| 5 | −0.008 | 0.828 | −0.081 | 0.065 | −0.011 | 0.722 | −0.072 | 0.050 | |
| Sodium (mg) | 1 | 0.042 | 0.380 | −0.053 | 0.137 | 0.030 | 0.536 | −0.065 | 0.124 |
| 2 | −0.004 | 0.895 | −0.062 | 0.054 | −0.031 | 0.281 | −0.089 | 0.026 | |
| 3 | −0.002 | 0.953 | −0.060 | 0.056 | −0.031 | 0.281 | −0.088 | 0.026 | |
| 4 | −0.005 | 0.875 | −0.065 | 0.055 | 0.009 | 0.780 | −0.053 | 0.071 | |
| 5 | 0.022 | 0.537 | −0.048 | 0.092 | −0.034 | 0.256 | −0.094 | 0.025 | |
| Zinc (mg) | 1 | 0.025 | 0.489 | −0.046 | 0.096 | −0.024 | 0.510 | −0.094 | 0.047 |
| 2 | −0.017 | 0.459 | −0.063 | 0.029 | −0.071 | 0.002 | −0.116 | −0.026 | |
| 3 | −0.017 | 0.467 | −0.063 | 0.029 | −0.071 | 0.003 | −0.117 | −0.026 | |
| 4 | −0.029 | 0.232 | −0.077 | 0.019 | −0.070 | 0.003 | −0.116 | −0.025 | |
| 5 | −0.017 | 0.527 | −0.071 | 0.037 | −0.078 | 0.001 | −0.124 | −0.033 | |
| Mineral | Model | NAP | T2DM | NODAP | ||||||||||||
|---|---|---|---|---|---|---|---|---|---|---|---|---|---|---|---|---|
| R2 | Unstandardised | p | 95% CI | R2 | Unstandardised | p | 95% CI | R2 | Unstandardised | p | 95% CI | |||||
| B | Lower | Upper | B | Lower | Upper | B | Lower | Upper | ||||||||
| Calcium (mg) | 1 | 0.003 | 0.695 | 0.772 | −4.164 | 5.554 | 0.028 | −15.434 | 0.368 | −49.861 | 18.994 | 0.055 | 8.423 | 0.164 | −3.610 | 20.456 |
| 2 | 0.278 | 0.404 | 0.886 | −5.315 | 6.123 | 0.039 | −16.023 | 0.528 | −67.269 | 35.222 | 0.170 | 12.012 | 0.172 | −5.491 | 29.515 | |
| 3 | 0.280 | 0.452 | 0.875 | −5.397 | 6.301 | 0.081 | −15.410 | 0.541 | −66.347 | 35.528 | 0.190 | 14.180 | 0.124 | −4.111 | 32.470 | |
| 4 | 0.347 | 1.608 | 0.595 | −4.558 | 7.774 | 0.173 | −22.037 | 0.380 | −72.650 | 28.576 | 0.247 | 13.916 | 0.131 | −4.383 | 32.216 | |
| 5 | 0.382 | 1.344 | 0.683 | −5.415 | 8.103 | 0.493 | −14.339 | 0.568 | −65.521 | 36.844 | 0.275 | 12.586 | 0.199 | −7.032 | 32.204 | |
| Chloride (mg) | 1 | 0.085 | 4.268 | 0.112 | −1.059 | 9.596 | 0.044 | −15.515 | 0.227 | −41.158 | 10.127 | 0.051 | 5.530 | 0.179 | −2.658 | 13.718 |
| 2 | 0.323 | 5.032 | 0.198 | −2.798 | 12.863 | 0.063 | −24.427 | 0.325 | −74.324 | 25.471 | 0.126 | 4.013 | 0.603 | −11.565 | 19.590 | |
| 3 | 0.341 | 6.349 | 0.139 | −2.201 | 14.900 | 0.109 | −24.191 | 0.326 | −73.745 | 25.364 | 0.133 | 4.323 | 0.582 | −11.515 | 20.160 | |
| 4 | 0.382 | 5.548 | 0.217 | −3.484 | 14.580 | 0.222 | −32.960 | 0.184 | −82.570 | 16.650 | 0.191 | 3.785 | 0.633 | −12.267 | 19.837 | |
| 5 | 0.424 | 5.932 | 0.215 | −3.720 | 15.585 | 0.484 | −11.699 | 0.619 | −59.769 | 36.371 | 0.233 | 3.655 | 0.657 | −13.081 | 20.391 | |
| Copper (mg) | 1 | 0.042 | 2.683 | 0.268 | −2.177 | 7.544 | 0.022 | −13.209 | 0.390 | −44.091 | 17.672 | 0.004 | 1.427 | 0.706 | −6.181 | 9.035 |
| 2 | 0.298 | 3.412 | 0.386 | −4.547 | 11.371 | 0.037 | −8.386 | 0.677 | −49.121 | 32.349 | 0.151 | −6.212 | 0.283 | −17.795 | 5.370 | |
| 3 | 0.303 | 3.655 | 0.368 | −4.553 | 11.863 | 0.079 | −1.616 | 0.938 | −43.979 | 40.746 | 0.153 | −5.948 | 0.317 | −17.864 | 5.968 | |
| 4 | 0.343 | 1.698 | 0.701 | −7.325 | 10.722 | 0.170 | −3.533 | 0.864 | −45.511 | 38.445 | 0.208 | −5.829 | 0.356 | −18.551 | 6.893 | |
| 5 | 0.379 | 1.663 | 0.785 | −10.893 | 14.218 | 0.478 | 0.148 | 0.994 | −37.444 | 37.740 | 0.242 | −4.840 | 0.472 | −18.487 | 8.807 | |
| Iodine (μg) | 1 | 0.050 | 3.050 | 0.226 | −1.998 | 8.098 | 0.040 | −21.520 | 0.247 | −58.669 | 15.629 | 0.065 | 7.667 | 0.129 | −2.340 | 17.674 |
| 2 | 0.298 | 2.446 | 0.394 | −3.351 | 8.244 | 0.052 | −18.384 | 0.425 | −64.815 | 28.047 | 0.185 | 9.758 | 0.116 | −2.534 | 22.049 | |
| 3 | 0.301 | 2.571 | 0.382 | −3.382 | 8.524 | 0.084 | −10.465 | 0.667 | −59.635 | 38.706 | 0.241 | 14.951 | 0.037 | 0.997 | 28.905 | |
| 4 | 0.359 | 2.552 | 0.401 | −3.613 | 8.717 | 0.181 | −14.979 | 0.533 | −63.706 | 33.747 | 0.276 | 14.135 | 0.065 | −0.929 | 29.200 | |
| 5 | 0.390 | 2.185 | 0.520 | −4.771 | 9.140 | 0.498 | −19.879 | 0.350 | −62.977 | 23.219 | 0.354 | 17.763 | 0.032 | 1.601 | 33.926 | |
| Iron (mg) | 1 | 0.017 | 1.807 | 0.490 | −3.479 | 7.093 | 0.065 | −22.774 | 0.140 | −53.395 | 7.848 | 0.004 | 1.644 | 0.697 | −6.852 | 10.139 |
| 2 | 0.278 | −0.183 | 0.959 | −7.449 | 7.082 | 0.099 | −41.281 | 0.146 | −97.747 | 15.184 | 0.153 | −7.510 | 0.264 | −20.979 | 5.958 | |
| 3 | 0.279 | −0.041 | 0.991 | −7.555 | 7.473 | 0.139 | −39.418 | 0.163 | −95.710 | 16.874 | 0.159 | −7.557 | 0.268 | −21.211 | 6.098 | |
| 4 | 0.348 | 2.304 | 0.562 | −5.805 | 10.412 | 0.202 | −30.213 | 0.294 | −88.098 | 27.672 | 0.205 | −6.118 | 0.392 | −20.529 | 8.294 | |
| 5 | 0.392 | 3.614 | 0.477 | −6.799 | 14.027 | 0.478 | −3.564 | 0.893 | −57.916 | 50.788 | 0.242 | −5.279 | 0.478 | −20.352 | 9.794 | |
| Magnesium (mg) | 1 | 0.015 | 2.080 | 0.517 | −4.410 | 8.570 | 0.029 | −16.583 | 0.329 | −50.606 | 17.439 | 0.000 | −0.035 | 0.995 | −10.529 | 10.459 |
| 2 | 0.278 | 0.748 | 0.872 | −8.730 | 10.226 | 0.045 | −17.348 | 0.523 | −72.103 | 37.408 | 0.198 | −15.774 | 0.084 | −33.813 | 2.264 | |
| 3 | 0.281 | 1.328 | 0.794 | −9.013 | 11.668 | 0.090 | −16.465 | 0.541 | −70.912 | 37.982 | 0.199 | −15.595 | 0.101 | −34.382 | 3.193 | |
| 4 | 0.342 | 1.603 | 0.752 | −8.779 | 11.985 | 0.182 | −17.570 | 0.509 | −71.398 | 36.259 | 0.241 | −14.792 | 0.152 | −35.363 | 5.779 | |
| 5 | 0.377 | 0.706 | 0.900 | −10.879 | 12.292 | 0.481 | −9.455 | 0.698 | −59.159 | 40.248 | 0.291 | −15.995 | 0.138 | −37.481 | 5.492 | |
| Manganese (mg) | 1 | 0.035 | 2.419 | 0.311 | −2.381 | 7.220 | 0.003 | 3.558 | 0.751 | −19.041 | 26.157 | 0.041 | −4.493 | 0.230 | −11.951 | 2.965 |
| 2 | 0.322 | 4.217 | 0.201 | −2.395 | 10.829 | 0.070 | 16.181 | 0.274 | −13.505 | 45.866 | 0.338 | −15.097 | 0.003 | −24.555 | −5.638 | |
| 3 | 0.332 | 4.740 | 0.172 | −2.197 | 11.678 | 0.117 | 16.108 | 0.273 | −13.362 | 45.579 | 0.338 | −15.274 | 0.003 | −25.116 | −5.431 | |
| 4 | 0.365 | 3.708 | 0.341 | −4.186 | 11.602 | 0.183 | 10.427 | 0.495 | −20.504 | 41.359 | 0.411 | −16.465 | 0.002 | −26.546 | −6.385 | |
| 5 | 0.399 | 4.551 | 0.392 | −6.300 | 15.401 | 0.490 | 10.357 | 0.469 | −18.745 | 39.458 | 0.455 | −17.147 | 0.003 | −27.829 | −6.464 | |
| Nitrogen (g) | 1 | 0.001 | 0.747 | 0.837 | −6.634 | 8.128 | 0.030 | −19.306 | 0.321 | −58.323 | 19.711 | 0.017 | 3.968 | 0.440 | −6.356 | 14.293 |
| 2 | 0.297 | −4.643 | 0.407 | −15.959 | 6.673 | 0.048 | −24.332 | 0.472 | −92.587 | 43.924 | 0.119 | 0.040 | 0.996 | −17.873 | 17.952 | |
| 3 | 0.297 | −4.622 | 0.438 | −16.695 | 7.450 | 0.092 | −21.690 | 0.520 | −89.766 | 46.385 | 0.125 | 0.611 | 0.946 | −17.734 | 18.956 | |
| 4 | 0.366 | −5.911 | 0.327 | −18.122 | 6.301 | 0.169 | −6.075 | 0.872 | −82.534 | 70.384 | 0.184 | −0.280 | 0.977 | −19.817 | 19.257 | |
| 5 | 0.402 | −6.015 | 0.366 | −19.565 | 7.535 | 0.487 | 21.821 | 0.536 | −50.047 | 93.689 | 0.227 | 0.707 | 0.944 | −19.774 | 21.187 | |
| Phosphorous (mg) | 1 | 0.010 | 1.936 | 0.593 | −5.384 | 9.255 | 0.029 | −20.931 | 0.329 | −63.886 | 22.025 | 0.028 | 5.931 | 0.322 | −6.066 | 17.928 |
| 2 | 0.280 | −1.931 | 0.777 | −15.783 | 11.921 | 0.047 | −28.990 | 0.485 | −112.750 | 54.770 | 0.125 | 7.100 | 0.627 | −22.399 | 36.598 | |
| 3 | 0.281 | −1.597 | 0.824 | −16.252 | 13.058 | 0.090 | −24.752 | 0.550 | −108.475 | 58.970 | 0.136 | 9.891 | 0.523 | −21.318 | 41.100 | |
| 4 | 0.341 | −2.105 | 0.776 | −17.217 | 13.006 | 0.178 | −23.107 | 0.582 | −108.193 | 61.980 | 0.205 | 14.626 | 0.389 | −19.608 | 48.860 | |
| 5 | 0.381 | −2.991 | 0.706 | −19.313 | 13.331 | 0.478 | −5.990 | 0.885 | −90.846 | 78.867 | 0.244 | 13.957 | 0.448 | −23.277 | 51.190 | |
| Potassium (mg) | 1 | 0.007 | 1.337 | 0.662 | −4.851 | 7.526 | 0.036 | −19.541 | 0.274 | −55.273 | 16.190 | 0.001 | 1.188 | 0.845 | −11.066 | 13.442 |
| 2 | 0.278 | 0.318 | 0.935 | −7.579 | 8.216 | 0.054 | −24.484 | 0.404 | −83.561 | 34.593 | 0.172 | −14.573 | 0.160 | −35.223 | 6.077 | |
| 3 | 0.280 | 0.700 | 0.867 | −7.806 | 9.207 | 0.093 | −19.581 | 0.507 | −79.212 | 40.049 | 0.172 | −14.359 | 0.190 | −36.204 | 7.486 | |
| 4 | 0.342 | 1.503 | 0.721 | −7.086 | 10.093 | 0.187 | −22.375 | 0.442 | −81.154 | 36.405 | 0.212 | −11.737 | 0.321 | −35.497 | 12.022 | |
| 5 | 0.378 | 0.938 | 0.838 | −8.489 | 10.366 | 0.495 | −22.591 | 0.387 | −75.593 | 30.410 | 0.261 | −13.299 | 0.286 | −38.402 | 11.804 | |
| Selenium (μg) | 1 | 0.040 | 2.931 | 0.282 | −2.541 | 8.404 | 0.001 | −3.726 | 0.836 | −40.123 | 32.672 | 0.028 | 3.654 | 0.321 | −3.718 | 11.025 |
| 2 | 0.283 | 1.851 | 0.674 | −7.101 | 10.803 | 0.042 | 15.057 | 0.575 | −39.189 | 69.303 | 0.123 | 2.239 | 0.697 | −9.372 | 13.850 | |
| 3 | 0.285 | 1.978 | 0.661 | −7.198 | 11.155 | 0.117 | 31.274 | 0.272 | −25.844 | 88.391 | 0.130 | 2.706 | 0.646 | −9.201 | 14.612 | |
| 4 | 0.343 | 1.688 | 0.710 | −7.586 | 10.963 | 0.215 | 39.157 | 0.218 | −24.592 | 102.907 | 0.186 | 1.519 | 0.799 | −10.596 | 13.633 | |
| 5 | 0.379 | 1.311 | 0.784 | −8.516 | 11.139 | 0.487 | 17.826 | 0.540 | −41.505 | 77.158 | 0.237 | 3.642 | 0.569 | −9.322 | 16.607 | |
| Sodium (mg) | 1 | 0.088 | 4.275 | 0.104 | −0.940 | 9.490 | 0.040 | −14.905 | 0.248 | −40.714 | 10.904 | 0.052 | 5.413 | 0.175 | −2.519 | 13.345 |
| 2 | 0.334 | 5.458 | 0.150 | −2.114 | 13.030 | 0.056 | −21.295 | 0.389 | −71.052 | 28.463 | 0.128 | 4.165 | 0.575 | −10.800 | 19.130 | |
| 3 | 0.352 | 6.607 | 0.107 | −1.542 | 14.757 | 0.102 | −21.094 | 0.390 | −70.514 | 28.327 | 0.134 | 4.312 | 0.567 | −10.871 | 19.495 | |
| 4 | 0.390 | 5.738 | 0.179 | −2.828 | 14.305 | 0.216 | −31.273 | 0.214 | −81.738 | 19.192 | 0.191 | 3.797 | 0.619 | −11.648 | 19.243 | |
| 5 | 0.438 | 6.639 | 0.153 | −2.688 | 15.966 | 0.480 | −7.151 | 0.770 | −57.207 | 42.906 | 0.235 | 4.181 | 0.597 | −11.894 | 20.256 | |
| Zinc (mg) | 1 | 0.000 | 0.059 | 0.986 | −6.747 | 6.865 | 0.033 | −19.770 | 0.295 | −57.549 | 18.010 | 0.026 | 4.984 | 0.343 | −5.549 | 15.517 |
| 2 | 0.327 | −6.886 | 0.179 | −17.132 | 3.360 | 0.062 | −29.825 | 0.329 | −91.235 | 31.585 | 0.120 | 2.044 | 0.817 | −15.812 | 19.899 | |
| 3 | 0.327 | −7.089 | 0.193 | −18.004 | 3.826 | 0.124 | −36.619 | 0.231 | −97.872 | 24.634 | 0.126 | 2.199 | 0.806 | −15.918 | 20.315 | |
| 4 | 0.401 | −8.146 | 0.134 | −19.009 | 2.716 | 0.188 | −25.215 | 0.431 | −89.980 | 39.550 | 0.185 | 1.313 | 0.886 | −17.316 | 19.943 | |
| 5 | 0.464 | −12.169 | 0.085 | −26.193 | 1.856 | 0.480 | 8.802 | 0.779 | −55.273 | 72.876 | 0.227 | 0.970 | 0.919 | −18.434 | 20.375 | |
| Mineral | Model | NAP | T2DM | NODAP | ||||||||||||
|---|---|---|---|---|---|---|---|---|---|---|---|---|---|---|---|---|
| R2 | Unstandardised | p | 95% CI | R2 | Unstandardised | p | 95% CI | R2 | Unstandardised | p | 95% CI | |||||
| B | Lower | Upper | B | Lower | Upper | B | Lower | Upper | ||||||||
| Calcium (mg) | 1 | 0.004 | 0.097 | 0.753 | −0.527 | 0.720 | 0.021 | −2.219 | 0.404 | −7.561 | 3.124 | 0.090 | 2.072 | 0.071 | −0.191 | 4.334 |
| 2 | 0.151 | 0.149 | 0.703 | −0.648 | 0.947 | 0.049 | −2.695 | 0.492 | −10.614 | 5.225 | 0.228 | 1.495 | 0.354 | −1.740 | 4.730 | |
| 3 | 0.222 | 0.185 | 0.630 | −0.598 | 0.967 | 0.088 | −2.608 | 0.505 | −10.511 | 5.296 | 0.234 | 1.722 | 0.311 | −1.688 | 5.131 | |
| 4 | 0.225 | 0.192 | 0.651 | −0.675 | 1.058 | 0.283 | −3.788 | 0.302 | −11.177 | 3.601 | 0.268 | 1.659 | 0.335 | −1.799 | 5.117 | |
| 5 | 0.232 | 0.163 | 0.730 | −0.814 | 1.140 | 0.545 | −3.188 | 0.386 | −10.646 | 4.271 | 0.303 | 1.746 | 0.339 | −1.941 | 5.432 | |
| Chloride (mg) | 1 | 0.025 | 0.302 | 0.399 | −0.421 | 1.025 | 0.052 | −2.620 | 0.187 | −6.575 | 1.335 | 0.068 | 1.224 | 0.119 | −0.331 | 2.780 |
| 2 | 0.164 | 0.410 | 0.472 | −0.745 | 1.565 | 0.091 | −5.102 | 0.181 | −12.716 | 2.513 | 0.209 | −0.488 | 0.728 | −3.329 | 2.352 | |
| 3 | 0.270 | 0.771 | 0.188 | −0.402 | 1.945 | 0.129 | −5.068 | 0.182 | −12.658 | 2.521 | 0.210 | −0.467 | 0.745 | −3.364 | 2.431 | |
| 4 | 0.280 | 0.854 | 0.180 | −0.424 | 2.132 | 0.340 | −6.499 | 0.070 | −13.578 | 0.579 | 0.247 | −0.497 | 0.735 | −3.465 | 2.471 | |
| 5 | 0.295 | 0.905 | 0.192 | −0.497 | 2.308 | 0.553 | −3.676 | 0.284 | −10.607 | 3.256 | 0.283 | −0.630 | 0.680 | −3.732 | 2.471 | |
| Copper (mg) | 1 | 0.022 | −0.242 | 0.439 | −0.875 | 0.390 | 0.032 | −2.426 | 0.308 | −7.187 | 2.336 | 0.025 | 0.677 | 0.347 | −0.766 | 2.119 |
| 2 | 0.277 | −1.073 | 0.044 | −2.113 | −0.033 | 0.050 | −2.194 | 0.480 | −8.463 | 4.074 | 0.249 | −1.382 | 0.187 | −3.469 | 0.706 | |
| 3 | 0.320 | −0.977 | 0.065 | −2.021 | 0.066 | 0.079 | −1.322 | 0.683 | −7.884 | 5.241 | 0.249 | −1.380 | 0.200 | −3.530 | 0.770 | |
| 4 | 0.329 | −1.084 | 0.069 | −2.262 | 0.093 | 0.264 | −1.868 | 0.537 | −7.989 | 4.254 | 0.292 | −1.577 | 0.173 | −3.883 | 0.730 | |
| 5 | 0.416 | −1.901 | 0.023 | −3.508 | −0.294 | 0.535 | −1.471 | 0.585 | −6.964 | 4.023 | 0.333 | −1.754 | 0.154 | −4.208 | 0.699 | |
| Iodine (μg) | 1 | 0.008 | 0.154 | 0.637 | −0.508 | 0.816 | 0.046 | −3.572 | 0.214 | −9.309 | 2.165 | 0.058 | 1.392 | 0.151 | −0.533 | 3.316 |
| 2 | 0.147 | 0.073 | 0.856 | −0.749 | 0.895 | 0.061 | −3.252 | 0.361 | −10.412 | 3.909 | 0.219 | 0.838 | 0.464 | −1.468 | 3.144 | |
| 3 | 0.219 | 0.147 | 0.711 | −0.664 | 0.958 | 0.084 | −2.203 | 0.559 | −9.821 | 5.415 | 0.231 | 1.288 | 0.337 | −1.405 | 3.980 | |
| 4 | 0.223 | 0.176 | 0.681 | −0.701 | 1.054 | 0.274 | −3.022 | 0.391 | −10.129 | 4.084 | 0.254 | 0.919 | 0.526 | −2.011 | 3.850 | |
| 5 | 0.230 | 0.118 | 0.811 | −0.902 | 1.138 | 0.562 | −3.979 | 0.200 | −10.211 | 2.254 | 0.280 | 0.392 | 0.807 | −2.878 | 3.663 | |
| Iron (mg) | 1 | 0.004 | −0.110 | 0.745 | −0.793 | 0.574 | 0.070 | −3.652 | 0.126 | −8.384 | 1.079 | 0.031 | 0.843 | 0.294 | −0.763 | 2.448 |
| 2 | 0.186 | −0.536 | 0.276 | −1.527 | 0.456 | 0.130 | −7.646 | 0.079 | −16.241 | 0.950 | 0.232 | −1.264 | 0.302 | −3.721 | 1.193 | |
| 3 | 0.240 | −0.430 | 0.381 | −1.425 | 0.565 | 0.162 | −7.387 | 0.090 | −15.990 | 1.216 | 0.234 | −1.268 | 0.308 | −3.766 | 1.229 | |
| 4 | 0.254 | −0.564 | 0.307 | −1.683 | 0.555 | 0.296 | −5.258 | 0.211 | −13.683 | 3.166 | 0.265 | −1.186 | 0.369 | −3.842 | 1.470 | |
| 5 | 0.280 | −0.830 | 0.254 | −2.308 | 0.647 | 0.533 | −1.636 | 0.675 | −9.604 | 6.332 | 0.300 | −1.215 | 0.377 | −3.992 | 1.562 | |
| Magnesium (mg) | 1 | 0.060 | −0.533 | 0.193 | −1.350 | 0.285 | 0.031 | −2.638 | 0.316 | −7.904 | 2.629 | 0.032 | 1.051 | 0.288 | −0.927 | 3.030 |
| 2 | 0.358 | −1.611 | 0.008 | −2.764 | −0.457 | 0.056 | −3.446 | 0.411 | −11.880 | 4.988 | 0.249 | −2.229 | 0.184 | −5.574 | 1.116 | |
| 3 | 0.370 | −1.470 | 0.023 | −2.717 | −0.224 | 0.094 | −3.321 | 0.426 | −11.741 | 5.099 | 0.249 | −2.254 | 0.197 | −5.739 | 1.230 | |
| 4 | 0.376 | −1.485 | 0.027 | −2.790 | −0.181 | 0.274 | −3.379 | 0.385 | −11.234 | 4.477 | 0.284 | −2.378 | 0.214 | −6.208 | 1.453 | |
| 5 | 0.402 | −1.658 | 0.030 | −3.132 | −0.183 | 0.541 | −2.652 | 0.457 | −9.899 | 4.595 | 0.315 | −2.340 | 0.245 | −6.386 | 1.707 | |
| Manganese (mg) | 1 | 0.036 | −0.313 | 0.315 | −0.939 | 0.314 | 0.004 | 0.612 | 0.724 | −2.888 | 4.111 | 0.000 | 0.020 | 0.978 | −1.440 | 1.479 |
| 2 | 0.216 | −0.670 | 0.148 | −1.595 | 0.255 | 0.070 | 2.447 | 0.286 | −2.151 | 7.044 | 0.318 | −2.065 | 0.029 | −3.905 | −0.225 | |
| 3 | 0.259 | −0.548 | 0.243 | −1.492 | 0.397 | 0.110 | 2.437 | 0.286 | −2.147 | 7.020 | 0.319 | −2.116 | 0.031 | −4.029 | −0.202 | |
| 4 | 0.261 | −0.603 | 0.268 | −1.702 | 0.496 | 0.258 | 0.917 | 0.683 | −3.649 | 5.484 | 0.374 | −2.394 | 0.020 | −4.386 | −0.403 | |
| 5 | 0.300 | −1.023 | 0.177 | −2.551 | 0.505 | 0.531 | 0.672 | 0.751 | −3.650 | 4.994 | 0.403 | −2.436 | 0.027 | −4.579 | −0.294 | |
| Nitrogen (g) | 1 | 0.000 | 0.029 | 0.951 | −0.925 | 0.983 | 0.079 | −4.872 | 0.102 | −10.761 | 1.017 | 0.069 | 1.529 | 0.116 | −0.396 | 3.455 |
| 2 | 0.159 | −0.492 | 0.540 | −2.124 | 1.140 | 0.151 | −9.958 | 0.051 | −19.945 | 0.028 | 0.207 | 0.307 | 0.849 | −2.949 | 3.564 | |
| 3 | 0.217 | −0.232 | 0.775 | −1.892 | 1.428 | 0.182 | −9.612 | 0.059 | −19.620 | 0.395 | 0.209 | 0.363 | 0.826 | −2.979 | 3.706 | |
| 4 | 0.219 | −0.201 | 0.816 | −1.965 | 1.564 | 0.290 | −6.283 | 0.249 | −17.236 | 4.670 | 0.244 | 0.055 | 0.976 | −3.551 | 3.660 | |
| 5 | 0.227 | −0.073 | 0.941 | −2.088 | 1.943 | 0.539 | −3.647 | 0.482 | −14.194 | 6.899 | 0.279 | −0.286 | 0.878 | −4.078 | 3.506 | |
| Phosphorous (mg) | 1 | 0.002 | 0.113 | 0.809 | −0.834 | 1.059 | 0.040 | −3.794 | 0.252 | −10.412 | 2.823 | 0.079 | 1.913 | 0.091 | −0.325 | 4.150 |
| 2 | 0.150 | −0.317 | 0.743 | −2.289 | 1.654 | 0.080 | −7.676 | 0.228 | −20.427 | 5.075 | 0.206 | 0.152 | 0.954 | −5.234 | 5.538 | |
| 3 | 0.214 | −0.017 | 0.986 | −2.004 | 1.971 | 0.113 | −7.102 | 0.266 | −19.910 | 5.705 | 0.208 | 0.352 | 0.901 | −5.375 | 6.080 | |
| 4 | 0.217 | 0.019 | 0.985 | −2.116 | 2.155 | 0.279 | −5.937 | 0.332 | −18.279 | 6.405 | 0.244 | 0.307 | 0.922 | −6.092 | 6.706 | |
| 5 | 0.227 | 0.046 | 0.968 | −2.321 | 2.414 | 0.544 | −5.139 | 0.396 | −17.430 | 7.152 | 0.278 | −0.356 | 0.917 | −7.329 | 6.617 | |
| Potassium (mg) | 1 | 0.093 | −0.631 | 0.101 | −1.395 | 0.132 | 0.041 | −3.221 | 0.244 | −8.742 | 2.301 | 0.034 | 1.259 | 0.276 | −1.051 | 3.569 |
| 2 | 0.343 | −1.289 | 0.011 | −2.260 | −0.318 | 0.074 | −5.037 | 0.265 | −14.094 | 4.021 | 0.249 | −2.497 | 0.187 | −6.267 | 1.273 | |
| 3 | 0.359 | −1.165 | 0.029 | −2.199 | −0.131 | 0.103 | −4.377 | 0.338 | −13.563 | 4.810 | 0.249 | −2.577 | 0.197 | −6.564 | 1.410 | |
| 4 | 0.369 | −1.203 | 0.031 | −2.289 | −0.117 | 0.292 | −5.001 | 0.238 | −13.501 | 3.499 | 0.278 | −2.493 | 0.252 | −6.853 | 1.866 | |
| 5 | 0.390 | −1.305 | 0.036 | −2.518 | −0.092 | 0.571 | −5.495 | 0.147 | −13.061 | 2.070 | 0.308 | −2.391 | 0.301 | −7.047 | 2.265 | |
| Selenium (μg) | 1 | 0.001 | 0.070 | 0.844 | −0.649 | 0.788 | 0.034 | −2.930 | 0.290 | −8.476 | 2.616 | 0.088 | 1.241 | 0.074 | −0.127 | 2.609 |
| 2 | 0.154 | −0.296 | 0.630 | −1.548 | 0.955 | 0.050 | −2.893 | 0.486 | −11.263 | 5.476 | 0.212 | 0.502 | 0.631 | −1.608 | 2.611 | |
| 3 | 0.219 | −0.223 | 0.713 | −1.458 | 1.012 | 0.076 | −1.390 | 0.756 | −10.438 | 7.658 | 0.214 | 0.550 | 0.609 | −1.619 | 2.720 | |
| 4 | 0.221 | −0.210 | 0.741 | −1.513 | 1.092 | 0.254 | −0.467 | 0.921 | −10.095 | 9.161 | 0.246 | 0.352 | 0.749 | −1.882 | 2.586 | |
| 5 | 0.231 | −0.221 | 0.747 | −1.638 | 1.195 | 0.548 | −4.096 | 0.336 | −12.718 | 4.526 | 0.278 | 0.059 | 0.960 | −2.358 | 2.475 | |
| Sodium (mg) | 1 | 0.026 | 0.298 | 0.396 | −0.410 | 1.006 | 0.043 | −2.386 | 0.233 | −6.379 | 1.606 | 0.070 | 1.203 | 0.114 | −0.303 | 2.709 |
| 2 | 0.167 | 0.429 | 0.440 | −0.696 | 1.553 | 0.071 | −4.127 | 0.279 | −11.770 | 3.516 | 0.208 | −0.339 | 0.802 | −3.072 | 2.394 | |
| 3 | 0.269 | 0.733 | 0.193 | −0.397 | 1.864 | 0.110 | −4.098 | 0.280 | −11.719 | 3.522 | 0.209 | −0.327 | 0.812 | −3.108 | 2.454 | |
| 4 | 0.278 | 0.805 | 0.186 | −0.417 | 2.026 | 0.316 | −5.590 | 0.128 | −12.890 | 1.711 | 0.245 | −0.350 | 0.804 | −3.209 | 2.510 | |
| 5 | 0.303 | 0.938 | 0.166 | −0.426 | 2.302 | 0.537 | −2.196 | 0.541 | −9.513 | 5.121 | 0.282 | −0.535 | 0.716 | −3.521 | 2.451 | |
| Zinc (mg) | 1 | 0.002 | 0.104 | 0.811 | −0.777 | 0.985 | 0.037 | −3.221 | 0.270 | −9.062 | 2.621 | 0.092 | 1.805 | 0.068 | −0.144 | 3.754 |
| 2 | 0.151 | −0.285 | 0.705 | −1.818 | 1.247 | 0.084 | −5.927 | 0.208 | −15.327 | 3.474 | 0.210 | 0.639 | 0.691 | −2.604 | 3.881 | |
| 3 | 0.215 | −0.045 | 0.952 | −1.594 | 1.504 | 0.141 | −6.936 | 0.142 | −16.332 | 2.459 | 0.211 | 0.653 | 0.689 | −2.645 | 3.951 | |
| 4 | 0.217 | −0.027 | 0.973 | −1.659 | 1.605 | 0.272 | −3.872 | 0.410 | −13.369 | 5.625 | 0.245 | 0.416 | 0.806 | −3.019 | 3.851 | |
| 5 | 0.229 | 0.244 | 0.820 | −1.971 | 2.459 | 0.530 | 0.535 | 0.908 | −8.905 | 9.975 | 0.279 | 0.273 | 0.877 | −3.320 | 3.866 | |
| Mineral | Model | NAP | T2DM | NODAP | ||||||||||||
|---|---|---|---|---|---|---|---|---|---|---|---|---|---|---|---|---|
| R2 | Unstandardised | p | 95% CI | R2 | Unstandardised | p | 95% CI | R2 | Unstandardised | p | 95% CI | |||||
| B | Lower | Upper | B | Lower | Upper | B | Lower | Upper | ||||||||
| Calcium (mg) | 1 | 0.000 | 0.682 | 0.944 | −18.900 | 20.265 | 0.000 | 3.095 | 0.966 | −144.004 | 150.194 | 0.025 | 11.785 | 0.352 | −13.594 | 37.164 |
| 2 | 0.003 | 1.530 | 0.908 | −25.514 | 28.575 | 0.093 | 94.086 | 0.370 | −117.360 | 305.531 | 0.140 | 0.416 | 0.982 | −36.564 | 37.396 | |
| 3 | 0.006 | 1.318 | 0.923 | −26.345 | 28.981 | 0.095 | 94.223 | 0.378 | −121.278 | 309.724 | 0.154 | 4.158 | 0.828 | −34.648 | 42.963 | |
| 4 | 0.055 | −1.750 | 0.905 | −31.605 | 28.104 | 0.345 | 151.133 | 0.123 | −43.802 | 346.068 | 0.233 | 4.652 | 0.806 | −33.719 | 43.023 | |
| 5 | 0.169 | −4.304 | 0.779 | −35.829 | 27.222 | 0.554 | 211.928 | 0.048 | 2.380 | 421.476 | 0.305 | 3.631 | 0.853 | −36.272 | 43.535 | |
| Chloride (mg) | 1 | 0.000 | −0.396 | 0.971 | −22.804 | 22.013 | 0.125 | −115.711 | 0.043 | −227.763 | −3.659 | 0.111 | 16.935 | 0.044 | 0.477 | 33.394 |
| 2 | 0.003 | −1.419 | 0.940 | −39.663 | 36.826 | 0.205 | −250.464 | 0.035 | −482.368 | −18.559 | 0.165 | 15.112 | 0.338 | −16.512 | 46.736 | |
| 3 | 0.006 | −3.765 | 0.856 | −46.016 | 38.486 | 0.206 | −249.783 | 0.039 | −486.616 | −12.949 | 0.181 | 16.096 | 0.312 | −15.873 | 48.066 | |
| 4 | 0.054 | 0.348 | 0.987 | −44.621 | 45.316 | 0.325 | −157.937 | 0.202 | −405.953 | 90.079 | 0.248 | 12.594 | 0.430 | −19.553 | 44.740 | |
| 5 | 0.167 | 3.869 | 0.865 | −42.829 | 50.567 | 0.468 | −74.265 | 0.573 | −344.241 | 195.710 | 0.316 | 10.893 | 0.501 | −21.922 | 43.708 | |
| Copper (mg) | 1 | 0.001 | −1.361 | 0.890 | −21.340 | 18.619 | 0.051 | −77.657 | 0.206 | −200.404 | 45.090 | 0.015 | 5.743 | 0.463 | −9.966 | 21.452 |
| 2 | 0.005 | −4.421 | 0.814 | −42.569 | 33.727 | 0.087 | −62.201 | 0.431 | −221.550 | 97.148 | 0.175 | −13.480 | 0.255 | −37.185 | 10.225 | |
| 3 | 0.008 | −5.274 | 0.785 | −44.670 | 34.123 | 0.094 | −73.003 | 0.383 | −242.022 | 96.016 | 0.182 | −12.505 | 0.302 | −36.818 | 11.809 | |
| 4 | 0.057 | −6.079 | 0.775 | −49.572 | 37.413 | 0.309 | −78.894 | 0.304 | −233.561 | 75.772 | 0.239 | −7.103 | 0.579 | −33.004 | 18.797 | |
| 5 | 0.166 | −0.005 | 1.000 | −58.549 | 58.538 | 0.469 | −43.971 | 0.561 | −198.733 | 110.791 | 0.313 | −7.846 | 0.555 | −34.827 | 19.134 | |
| Iodine (μg) | 1 | 0.015 | 6.774 | 0.508 | −13.910 | 27.458 | 0.011 | 44.089 | 0.559 | −108.095 | 196.274 | 0.003 | −3.376 | 0.751 | −24.832 | 18.080 |
| 2 | 0.028 | 10.929 | 0.421 | −16.526 | 38.385 | 0.145 | 139.849 | 0.119 | −38.148 | 317.846 | 0.183 | −16.155 | 0.207 | −41.723 | 9.412 | |
| 3 | 0.029 | 10.675 | 0.444 | −17.574 | 38.924 | 0.149 | 149.525 | 0.121 | −42.249 | 341.299 | 0.183 | −15.662 | 0.296 | −45.737 | 14.413 | |
| 4 | 0.064 | 7.312 | 0.619 | −22.663 | 37.287 | 0.391 | 177.429 | 0.042 | 7.071 | 347.788 | 0.262 | −17.142 | 0.276 | −48.728 | 14.444 | |
| 5 | 0.167 | 2.035 | 0.898 | −30.667 | 34.737 | 0.560 | 173.350 | 0.041 | 7.943 | 338.758 | 0.389 | −30.162 | 0.069 | −62.806 | 2.482 | |
| Iron (mg) | 1 | 0.003 | 3.297 | 0.755 | −18.119 | 24.712 | 0.099 | −115.820 | 0.075 | −243.956 | 12.315 | 0.065 | 13.101 | 0.129 | −3.999 | 30.202 |
| 2 | 0.011 | 7.683 | 0.648 | −26.530 | 41.897 | 0.160 | −200.167 | 0.088 | −432.286 | 31.952 | 0.141 | 1.804 | 0.897 | −26.366 | 29.974 | |
| 3 | 0.012 | 7.195 | 0.679 | −28.208 | 42.597 | 0.162 | −201.193 | 0.092 | −437.755 | 35.369 | 0.153 | 1.665 | 0.906 | −26.784 | 30.113 | |
| 4 | 0.066 | 10.265 | 0.592 | −28.802 | 49.333 | 0.407 | −245.327 | 0.028 | −462.181 | −28.472 | 0.242 | 9.479 | 0.512 | −19.738 | 38.695 | |
| 5 | 0.219 | 26.432 | 0.260 | −21.085 | 73.948 | 0.506 | −162.179 | 0.177 | −403.620 | 79.263 | 0.316 | 9.995 | 0.496 | −19.730 | 39.721 | |
| Magnesium (mg) | 1 | 0.004 | 4.215 | 0.745 | −22.047 | 30.478 | 0.031 | −69.528 | 0.325 | −211.363 | 72.307 | 0.064 | 16.067 | 0.131 | −5.016 | 37.150 |
| 2 | 0.013 | 11.065 | 0.615 | −33.550 | 55.680 | 0.070 | −38.358 | 0.729 | −262.673 | 185.957 | 0.142 | 4.207 | 0.826 | −34.552 | 42.967 | |
| 3 | 0.013 | 10.442 | 0.663 | −38.328 | 59.212 | 0.072 | −38.529 | 0.732 | −267.158 | 190.100 | 0.157 | 7.364 | 0.710 | −32.652 | 47.381 | |
| 4 | 0.064 | 11.718 | 0.631 | −38.103 | 61.538 | 0.279 | −13.693 | 0.895 | −225.423 | 198.038 | 0.264 | 23.641 | 0.260 | −18.415 | 65.697 | |
| 5 | 0.178 | 13.735 | 0.599 | −39.821 | 67.291 | 0.467 | 56.533 | 0.604 | −166.590 | 279.656 | 0.346 | 27.072 | 0.205 | −15.765 | 69.909 | |
| Manganese (mg) | 1 | 0.011 | 5.508 | 0.569 | −14.050 | 25.066 | 0.041 | −51.721 | 0.256 | −142.781 | 39.339 | 0.021 | 6.635 | 0.395 | −9.016 | 22.286 |
| 2 | 0.027 | 12.556 | 0.426 | −19.325 | 44.437 | 0.074 | −29.026 | 0.632 | −151.707 | 93.654 | 0.145 | −4.331 | 0.695 | −26.653 | 17.990 | |
| 3 | 0.027 | 12.358 | 0.457 | −21.338 | 46.054 | 0.076 | −28.812 | 0.640 | −153.877 | 96.254 | 0.155 | −2.854 | 0.803 | −25.954 | 20.246 | |
| 4 | 0.063 | 8.552 | 0.651 | −30.036 | 47.141 | 0.282 | −21.648 | 0.713 | −141.639 | 98.343 | 0.232 | 1.811 | 0.878 | −22.102 | 25.723 | |
| 5 | 0.191 | 18.914 | 0.446 | −31.778 | 69.606 | 0.464 | 23.069 | 0.710 | −104.147 | 150.285 | 0.308 | 4.983 | 0.685 | −20.009 | 29.976 | |
| Nitrogen (g) | 1 | 0.006 | 6.296 | 0.667 | −23.334 | 35.925 | 0.141 | −164.493 | 0.032 | −313.440 | −15.546 | 0.023 | 9.547 | 0.371 | −11.829 | 30.923 |
| 2 | 0.026 | 20.629 | 0.436 | −32.961 | 74.219 | 0.220 | −290.208 | 0.026 | −543.873 | −36.544 | 0.149 | −10.206 | 0.574 | −46.762 | 26.350 | |
| 3 | 0.026 | 20.417 | 0.469 | −36.755 | 77.589 | 0.224 | −293.149 | 0.028 | −551.738 | −34.560 | 0.159 | −8.631 | 0.641 | −45.969 | 28.707 | |
| 4 | 0.067 | 16.507 | 0.572 | −43.109 | 76.122 | 0.449 | −354.028 | 0.010 | −616.299 | −91.757 | 0.231 | −2.819 | 0.885 | −42.203 | 36.565 | |
| 5 | 0.205 | 29.712 | 0.336 | −33.177 | 92.601 | 0.557 | −302.235 | 0.043 | −594.534 | −9.936 | 0.309 | −8.424 | 0.670 | −48.642 | 31.795 | |
| Phosphorous (mg) | 1 | 0.005 | 5.317 | 0.715 | −24.217 | 34.852 | 0.064 | −124.221 | 0.154 | −297.555 | 49.113 | 0.030 | 12.826 | 0.303 | −12.057 | 37.708 |
| 2 | 0.028 | 26.005 | 0.417 | −38.750 | 90.760 | 0.104 | −176.359 | 0.291 | −511.914 | 159.195 | 0.154 | −21.636 | 0.470 | −81.865 | 38.594 | |
| 3 | 0.028 | 25.670 | 0.448 | −42.882 | 94.222 | 0.106 | −180.110 | 0.290 | −522.839 | 162.618 | 0.161 | −17.082 | 0.589 | −80.946 | 46.783 | |
| 4 | 0.065 | 17.927 | 0.614 | −54.521 | 90.374 | 0.294 | −120.851 | 0.458 | −451.367 | 209.664 | 0.231 | 2.698 | 0.938 | −67.235 | 72.630 | |
| 5 | 0.181 | 21.602 | 0.558 | −53.968 | 97.173 | 0.461 | −38.232 | 0.840 | −427.352 | 350.887 | 0.306 | 2.698 | 0.938 | −67.235 | 72.630 | |
| Potassium (mg) | 1 | 0.006 | 5.082 | 0.680 | −19.831 | 29.995 | 0.004 | −25.770 | 0.734 | −179.222 | 127.681 | 0.038 | 14.536 | 0.245 | −10.432 | 39.504 |
| 2 | 0.014 | 9.796 | 0.592 | −27.342 | 46.933 | 0.077 | 67.976 | 0.576 | −177.997 | 313.950 | 0.147 | −10.519 | 0.626 | −54.057 | 33.018 | |
| 3 | 0.014 | 9.292 | 0.637 | −30.771 | 49.355 | 0.078 | 65.721 | 0.599 | −187.360 | 318.802 | 0.156 | −6.998 | 0.758 | −52.818 | 38.823 | |
| 4 | 0.063 | 9.372 | 0.643 | −31.888 | 50.632 | 0.294 | 83.250 | 0.466 | −148.104 | 314.604 | 0.234 | 8.031 | 0.738 | −40.624 | 56.686 | |
| 5 | 0.177 | 10.860 | 0.609 | −32.768 | 54.489 | 0.486 | 115.795 | 0.314 | −117.857 | 349.446 | 0.312 | 13.207 | 0.594 | −37.094 | 63.508 | |
| Selenium (μg) | 1 | 0.009 | 5.761 | 0.602 | −16.608 | 28.130 | 0.098 | −125.002 | 0.076 | −263.713 | 13.708 | 0.057 | 10.798 | 0.155 | −4.281 | 25.877 |
| 2 | 0.034 | 18.588 | 0.369 | −23.220 | 60.395 | 0.114 | −127.226 | 0.229 | −339.267 | 84.815 | 0.144 | 4.334 | 0.713 | −19.488 | 28.156 | |
| 3 | 0.035 | 18.255 | 0.389 | −24.650 | 61.159 | 0.132 | −160.099 | 0.169 | −392.384 | 72.187 | 0.159 | 5.725 | 0.634 | −18.588 | 30.037 | |
| 4 | 0.076 | 15.940 | 0.464 | −28.303 | 60.183 | 0.287 | −66.978 | 0.582 | −314.052 | 180.097 | 0.236 | 5.128 | 0.670 | −19.252 | 29.508 | |
| 5 | 0.187 | 15.431 | 0.485 | −29.824 | 60.687 | 0.489 | −126.832 | 0.291 | −370.420 | 116.757 | 0.304 | 0.815 | 0.949 | −24.893 | 26.523 | |
| Sodium (mg) | 1 | 0.001 | −1.545 | 0.887 | −23.518 | 20.428 | 0.159 | −130.487 | 0.022 | −240.412 | −20.562 | 0.112 | 16.517 | 0.043 | 0.577 | 32.457 |
| 2 | 0.005 | −4.201 | 0.818 | −41.446 | 33.043 | 0.275 | −299.924 | 0.008 | −516.198 | −83.650 | 0.167 | 15.217 | 0.315 | −15.142 | 45.576 | |
| 3 | 0.010 | −6.605 | 0.740 | −47.140 | 33.930 | 0.276 | −299.407 | 0.010 | −520.277 | −78.537 | 0.182 | 15.680 | 0.305 | −14.964 | 46.323 | |
| 4 | 0.056 | −4.007 | 0.848 | −46.888 | 38.874 | 0.359 | −212.348 | 0.089 | −459.386 | 34.690 | 0.247 | 11.938 | 0.437 | −19.015 | 42.891 | |
| 5 | 0.167 | 2.849 | 0.898 | −42.868 | 48.566 | 0.489 | −142.541 | 0.288 | −414.470 | 129.388 | 0.314 | 9.383 | 0.547 | −22.242 | 41.008 | |
| Zinc (mg) | 1 | 0.004 | 4.532 | 0.737 | −22.804 | 31.869 | 0.213 | −197.213 | 0.007 | −336.116 | −58.310 | 0.035 | 12.018 | 0.270 | −9.755 | 33.791 |
| 2 | 0.018 | 15.253 | 0.535 | −34.560 | 65.067 | 0.382 | −373.530 | 0.001 | −575.644 | −171.417 | 0.143 | −5.245 | 0.772 | −41.851 | 31.362 | |
| 3 | 0.018 | 14.702 | 0.573 | −38.378 | 67.781 | 0.386 | −380.543 | 0.001 | −589.288 | −171.797 | 0.155 | −4.778 | 0.794 | −41.776 | 32.220 | |
| 4 | 0.066 | 14.441 | 0.590 | −40.152 | 69.033 | 0.657 | −445.092 | <0.001 | −619.351 | −270.832 | 0.231 | −1.635 | 0.930 | −39.212 | 35.941 | |
| 5 | 0.260 | 50.565 | 0.128 | −15.779 | 116.909 | 0.724 | −443.991 | <0.001 | −650.255 | −237.727 | 0.305 | −4.170 | 0.824 | −42.378 | 34.037 | |
| Mineral | Model | NAP | T2DM | NODAP | ||||||||||||
|---|---|---|---|---|---|---|---|---|---|---|---|---|---|---|---|---|
| R2 | Unstandardised | p | 95% CI | R2 | Unstandardised | p | 95% CI | R2 | Unstandardised | p | 95% CI | |||||
| B | Lower | Upper | B | Lower | Upper | B | Lower | Upper | ||||||||
| Calcium (mg) | 1 | 0.000 | 4.245 | 0.926 | −88.813 | 97.302 | 0.001 | −8.964 | 0.867 | −117.484 | 99.556 | 0.001 | −20.276 | 0.881 | −293.772 | 253.221 |
| 2 | 0.073 | 23.013 | 0.706 | −101.166 | 147.192 | 0.067 | −18.272 | 0.817 | −179.031 | 142.487 | 0.107 | 114.173 | 0.563 | −283.789 | 512.134 | |
| 3 | 0.073 | 22.983 | 0.713 | −104.289 | 150.254 | 0.192 | −16.230 | 0.829 | −168.916 | 136.457 | 0.110 | 132.410 | 0.526 | −288.485 | 553.304 | |
| 4 | 0.154 | 41.110 | 0.533 | −93.534 | 175.754 | 0.223 | −5.025 | 0.950 | −169.995 | 159.946 | 0.229 | 139.137 | 0.489 | −267.284 | 545.558 | |
| 5 | 0.247 | 66.633 | 0.345 | −77.518 | 210.784 | 0.420 | −88.801 | 0.348 | −281.674 | 104.072 | 0.709 | 57.731 | 0.667 | −215.061 | 330.524 | |
| Chloride (mg) | 1 | 0.033 | −51.011 | 0.339 | −158.443 | 56.421 | 0.004 | 15.765 | 0.737 | −79.199 | 110.730 | 0.111 | −180.055 | 0.044 | −355.117 | −4.993 |
| 2 | 0.086 | −63.180 | 0.477 | −243.526 | 117.166 | 0.086 | 77.326 | 0.432 | −121.453 | 276.104 | 0.178 | −289.538 | 0.086 | −622.669 | 43.594 | |
| 3 | 0.089 | −72.394 | 0.452 | −268.015 | 123.228 | 0.216 | 82.758 | 0.374 | −105.362 | 270.879 | 0.178 | −289.377 | 0.092 | −629.320 | 50.567 | |
| 4 | 0.181 | −104.669 | 0.298 | −308.129 | 98.790 | 0.264 | 111.304 | 0.256 | −86.304 | 308.911 | 0.280 | −261.122 | 0.121 | −594.969 | 72.724 | |
| 5 | 0.246 | −98.220 | 0.355 | −315.089 | 118.648 | 0.400 | 49.419 | 0.637 | −165.851 | 264.689 | 0.750 | −217.292 | 0.044 | −428.069 | −6.514 | |
| Copper (mg) | 1 | 0.031 | −43.362 | 0.352 | −137.263 | 50.538 | 0.009 | 24.564 | 0.599 | −69.756 | 118.884 | 0.099 | −154.495 | 0.057 | −314.111 | 5.122 |
| 2 | 0.092 | −69.511 | 0.416 | −242.574 | 103.551 | 0.102 | 60.255 | 0.299 | −56.496 | 177.005 | 0.146 | −170.409 | 0.186 | −427.502 | 86.684 | |
| 3 | 0.093 | −71.292 | 0.418 | −249.976 | 107.392 | 0.199 | 30.092 | 0.604 | −87.746 | 147.929 | 0.146 | −171.753 | 0.196 | −436.630 | 93.124 | |
| 4 | 0.165 | −78.492 | 0.413 | −273.392 | 116.408 | 0.228 | 22.564 | 0.707 | −99.655 | 144.782 | 0.309 | −253.252 | 0.058 | −515.926 | 9.422 | |
| 5 | 0.212 | −31.411 | 0.815 | −308.032 | 245.211 | 0.283 | 10.249 | 0.871 | −119.765 | 140.263 | 0.745 | −167.033 | 0.061 | −342.373 | 8.307 | |
| Iodine (μg) | 1 | 0.004 | −15.292 | 0.755 | −114.575 | 83.990 | 0.010 | 30.916 | 0.579 | −81.679 | 143.511 | 0.020 | −94.323 | 0.404 | −320.836 | 132.190 |
| 2 | 0.067 | 4.789 | 0.939 | −123.720 | 133.298 | 0.087 | 56.379 | 0.421 | −85.043 | 197.802 | 0.108 | −85.555 | 0.543 | −368.826 | 197.716 | |
| 3 | 0.067 | 4.607 | 0.943 | −127.926 | 137.140 | 0.192 | 14.082 | 0.842 | −129.786 | 157.951 | 0.109 | −100.274 | 0.542 | −432.233 | 231.685 | |
| 4 | 0.146 | 28.682 | 0.670 | −109.020 | 166.384 | 0.226 | 24.852 | 0.743 | −130.091 | 179.795 | 0.220 | −62.038 | 0.715 | −405.720 | 281.644 | |
| 5 | 0.238 | 60.435 | 0.415 | −91.349 | 212.218 | 0.282 | 3.760 | 0.964 | −165.192 | 172.712 | 0.730 | 166.340 | 0.149 | −63.802 | 396.482 | |
| Iron (mg) | 1 | 0.051 | −59.579 | 0.231 | −159.174 | 40.016 | 0.000 | −1.752 | 0.973 | −107.430 | 103.927 | 0.115 | −185.833 | 0.040 | −363.132 | −8.535 |
| 2 | 0.109 | −82.280 | 0.286 | −237.781 | 73.220 | 0.067 | 24.843 | 0.789 | −164.093 | 213.779 | 0.165 | −233.936 | 0.116 | −528.950 | 61.077 | |
| 3 | 0.111 | −85.085 | 0.287 | −246.254 | 76.083 | 0.192 | 14.699 | 0.868 | −165.163 | 194.562 | 0.166 | −234.282 | 0.121 | −534.284 | 65.720 | |
| 4 | 0.206 | −114.133 | 0.186 | −287.501 | 59.234 | 0.226 | 30.623 | 0.755 | −169.964 | 231.209 | 0.352 | −346.007 | 0.020 | −633.371 | −58.643 | |
| 5 | 0.254 | −115.084 | 0.302 | −342.302 | 112.134 | 0.282 | 3.634 | 0.972 | −211.245 | 218.513 | 0.815 | −311.717 | 0.001 | −476.081 | −147.352 | |
| Magnesium (mg) | 1 | 0.003 | −19.157 | 0.758 | −145.201 | 106.887 | 0.000 | −2.214 | 0.967 | −110.488 | 106.061 | 0.037 | −129.590 | 0.256 | −357.405 | 98.225 |
| 2 | 0.068 | 12.933 | 0.899 | −194.469 | 220.335 | 0.065 | 2.267 | 0.978 | −163.449 | 167.982 | 0.102 | −83.355 | 0.690 | −505.305 | 338.596 | |
| 3 | 0.068 | 13.362 | 0.904 | −212.038 | 238.763 | 0.191 | 0.629 | 0.994 | −156.748 | 158.006 | 0.102 | −80.624 | 0.711 | −520.302 | 359.053 | |
| 4 | 0.138 | 6.492 | 0.953 | −221.286 | 234.269 | 0.223 | 9.332 | 0.906 | −152.865 | 171.528 | 0.251 | −255.197 | 0.258 | −707.649 | 197.254 | |
| 5 | 0.217 | 48.798 | 0.688 | −201.321 | 298.916 | 0.288 | −38.814 | 0.670 | −225.826 | 148.199 | 0.744 | −270.454 | 0.062 | −556.016 | 15.109 | |
| Manganese (mg) | 1 | 0.033 | −44.415 | 0.337 | −137.646 | 48.815 | 0.025 | −29.789 | 0.387 | −99.021 | 39.444 | 0.018 | −64.901 | 0.434 | −231.423 | 101.621 |
| 2 | 0.107 | −75.452 | 0.299 | −221.969 | 71.064 | 0.085 | −34.271 | 0.443 | −124.527 | 55.986 | 0.097 | −8.935 | 0.941 | −252.480 | 234.611 | |
| 3 | 0.110 | −80.190 | 0.292 | −233.884 | 73.504 | 0.210 | −33.277 | 0.432 | −118.905 | 52.352 | 0.098 | −5.432 | 0.965 | −259.170 | 248.305 | |
| 4 | 0.157 | −58.269 | 0.495 | −232.216 | 115.678 | 0.259 | −47.567 | 0.288 | −137.956 | 42.823 | 0.219 | −38.405 | 0.761 | −294.475 | 217.665 | |
| 5 | 0.210 | 0.653 | 0.996 | −240.491 | 241.797 | 0.369 | −82.329 | 0.102 | −182.399 | 17.741 | 0.708 | −27.175 | 0.749 | −199.621 | 145.271 | |
| Nitrogen (g) | 1 | 0.038 | −71.506 | 0.304 | −211.519 | 68.508 | 0.015 | 42.746 | 0.499 | −84.772 | 170.264 | 0.070 | −177.381 | 0.113 | −398.803 | 44.041 |
| 2 | 0.112 | −137.456 | 0.271 | −389.188 | 114.275 | 0.111 | 124.875 | 0.248 | −92.253 | 342.003 | 0.146 | −258.927 | 0.184 | −647.304 | 129.451 | |
| 3 | 0.116 | −146.926 | 0.263 | −411.659 | 117.807 | 0.223 | 105.339 | 0.308 | −102.865 | 313.543 | 0.147 | −260.240 | 0.193 | −659.486 | 139.006 | |
| 4 | 0.174 | −127.030 | 0.343 | −399.145 | 145.084 | 0.314 | 213.001 | 0.087 | −33.151 | 459.154 | 0.281 | −317.497 | 0.119 | −721.219 | 86.225 | |
| 5 | 0.259 | −157.445 | 0.278 | −452.534 | 137.643 | 0.370 | 224.107 | 0.101 | −47.412 | 495.625 | 0.732 | −202.711 | 0.129 | −468.542 | 63.121 | |
| Phosphorous (mg) | 1 | 0.012 | −39.950 | 0.563 | −179.722 | 99.821 | 0.004 | 22.295 | 0.741 | −114.093 | 158.684 | 0.029 | −133.702 | 0.311 | −397.468 | 130.064 |
| 2 | 0.072 | −51.373 | 0.734 | −359.027 | 256.282 | 0.080 | 84.240 | 0.504 | −170.846 | 339.326 | 0.102 | −132.413 | 0.687 | −794.890 | 530.063 | |
| 3 | 0.072 | −54.417 | 0.729 | −375.257 | 266.423 | 0.200 | 65.482 | 0.585 | −178.166 | 309.130 | 0.102 | −129.617 | 0.710 | −833.766 | 574.532 | |
| 4 | 0.138 | −7.089 | 0.965 | −340.158 | 325.981 | 0.243 | 98.521 | 0.432 | −156.148 | 353.190 | 0.241 | −353.553 | 0.340 | −1099.203 | 392.097 | |
| 5 | 0.212 | 31.093 | 0.857 | −325.047 | 387.233 | 0.286 | 56.721 | 0.713 | −259.758 | 373.200 | 0.720 | −269.348 | 0.284 | −775.847 | 237.152 | |
| Potassium (mg) | 1 | 0.003 | −16.429 | 0.781 | −136.370 | 103.512 | 0.004 | 18.905 | 0.736 | −94.355 | 132.165 | 0.027 | −128.753 | 0.334 | −395.441 | 137.936 |
| 2 | 0.067 | 3.992 | 0.962 | −168.705 | 176.690 | 0.082 | 64.340 | 0.479 | −119.569 | 248.249 | 0.097 | −1.281 | 0.996 | −478.077 | 475.515 | |
| 3 | 0.067 | 3.486 | 0.969 | −182.688 | 189.661 | 0.198 | 40.995 | 0.639 | −136.289 | 218.279 | 0.098 | 9.198 | 0.971 | −496.937 | 515.333 | |
| 4 | 0.138 | 2.516 | 0.978 | −186.768 | 191.800 | 0.233 | 49.116 | 0.585 | −133.876 | 232.109 | 0.229 | −172.371 | 0.502 | −691.495 | 346.753 | |
| 5 | 0.215 | 35.293 | 0.723 | −170.311 | 240.896 | 0.282 | 13.879 | 0.892 | −195.396 | 223.154 | 0.723 | −206.074 | 0.222 | −544.658 | 132.510 | |
| Selenium (μg) | 1 | 0.082 | −79.157 | 0.126 | −181.980 | 23.665 | 0.002 | −11.955 | 0.832 | −126.209 | 102.300 | 0.156 | −190.212 | 0.015 | −341.928 | −38.496 |
| 2 | 0.174 | −161.698 | 0.084 | −346.864 | 23.467 | 0.065 | −9.716 | 0.905 | −175.647 | 156.215 | 0.270 | −316.557 | 0.010 | −550.548 | −82.565 | |
| 3 | 0.175 | −163.257 | 0.089 | −353.246 | 26.733 | 0.225 | −88.172 | 0.294 | −257.424 | 81.081 | 0.272 | −321.541 | 0.010 | −562.267 | −80.815 | |
| 4 | 0.229 | −150.724 | 0.121 | −344.671 | 43.224 | 0.239 | −65.983 | 0.483 | −256.883 | 124.918 | 0.365 | −301.402 | 0.014 | −538.260 | −64.544 | |
| 5 | 0.284 | −136.762 | 0.178 | −341.488 | 67.963 | 0.287 | −41.705 | 0.682 | −250.337 | 166.927 | 0.751 | −170.803 | 0.042 | −334.944 | −6.663 | |
| Sodium (mg) | 1 | 0.045 | −58.808 | 0.260 | −163.574 | 45.959 | 0.004 | 16.363 | 0.733 | −80.536 | 113.262 | 0.124 | −184.187 | 0.033 | −352.486 | −15.889 |
| 2 | 0.106 | −88.626 | 0.307 | −263.553 | 86.301 | 0.091 | 87.005 | 0.384 | −114.584 | 288.594 | 0.199 | −311.853 | 0.052 | −626.458 | 2.752 | |
| 3 | 0.111 | −98.167 | 0.289 | −285.097 | 88.764 | 0.221 | 93.598 | 0.322 | −97.008 | 284.204 | 0.199 | −311.400 | 0.056 | −631.659 | 8.858 | |
| 4 | 0.203 | −124.509 | 0.194 | −317.339 | 68.320 | 0.281 | 137.051 | 0.176 | −65.969 | 340.071 | 0.298 | −283.647 | 0.077 | −599.697 | 32.403 | |
| 5 | 0.271 | −126.663 | 0.223 | −336.940 | 83.615 | 0.343 | 144.558 | 0.175 | −69.341 | 358.456 | 0.754 | −218.425 | 0.033 | −418.330 | −18.520 | |
| Zinc (mg) | 1 | 0.023 | −51.834 | 0.420 | −181.514 | 77.846 | 0.025 | 55.468 | 0.385 | −72.923 | 183.859 | 0.073 | −183.978 | 0.105 | −408.329 | 40.372 |
| 2 | 0.085 | −78.844 | 0.495 | −313.081 | 155.394 | 0.112 | 125.731 | 0.243 | −90.458 | 341.919 | 0.145 | −252.328 | 0.191 | −637.361 | 132.704 | |
| 3 | 0.086 | −83.949 | 0.488 | −329.674 | 161.776 | 0.273 | 169.479 | 0.098 | −33.648 | 372.607 | 0.145 | −251.641 | 0.200 | −643.524 | 140.241 | |
| 4 | 0.158 | −86.306 | 0.480 | −335.522 | 162.909 | 0.377 | 289.421 | 0.023 | 43.866 | 534.977 | 0.264 | −258.584 | 0.182 | −645.443 | 128.275 | |
| 5 | 0.229 | −105.373 | 0.507 | −431.429 | 220.683 | 0.419 | 309.600 | 0.037 | 20.715 | 598.485 | 0.742 | −224.960 | 0.070 | −469.860 | 19.940 | |
| Mineral | Model | NAP | T2DM | NODAP | ||||||||||||
|---|---|---|---|---|---|---|---|---|---|---|---|---|---|---|---|---|
| R2 | Unstandardised | p | 95% CI | R2 | Unstandardised | p | 95% CI | R2 | Unstandardised | p | 95% CI | |||||
| B | Lower | Upper | B | Lower | Upper | B | Lower | Upper | ||||||||
| Calcium (mg) | 1 | 0.000 | −5.939 | 0.924 | −131.853 | 119.975 | 0.026 | 59.501 | 0.375 | −75.352 | 194.355 | 0.002 | −14.743 | 0.801 | −132.376 | 102.890 |
| 2 | 0.012 | −6.229 | 0.942 | −179.720 | 167.261 | 0.073 | 77.512 | 0.436 | −123.813 | 278.838 | 0.045 | −38.284 | 0.665 | −216.884 | 140.317 | |
| 3 | 0.026 | −9.389 | 0.914 | −185.937 | 167.158 | 0.082 | 78.258 | 0.439 | −126.297 | 282.813 | 0.045 | −36.058 | 0.700 | −224.993 | 152.877 | |
| 4 | 0.096 | −29.370 | 0.750 | −218.038 | 159.298 | 0.199 | 100.850 | 0.333 | −109.921 | 311.621 | 0.122 | −31.336 | 0.736 | −219.349 | 156.676 | |
| 5 | 0.207 | −49.778 | 0.609 | −249.916 | 150.361 | 0.323 | 212.290 | 0.108 | −51.282 | 475.862 | 0.242 | −36.731 | 0.696 | −227.639 | 154.177 | |
| Chloride (mg) | 1 | 0.000 | −6.794 | 0.926 | −154.426 | 140.838 | 0.015 | 39.754 | 0.501 | −79.372 | 158.881 | 0.054 | 54.184 | 0.166 | −23.594 | 131.962 |
| 2 | 0.012 | −3.849 | 0.975 | −257.061 | 249.363 | 0.062 | 68.869 | 0.583 | −185.206 | 322.944 | 0.143 | 141.793 | 0.058 | −5.019 | 288.606 | |
| 3 | 0.028 | −31.997 | 0.811 | −305.099 | 241.105 | 0.071 | 71.013 | 0.577 | −187.234 | 329.259 | 0.147 | 144.009 | 0.058 | −5.501 | 293.518 | |
| 4 | 0.092 | −3.160 | 0.982 | −292.529 | 286.208 | 0.174 | 61.822 | 0.633 | −201.737 | 325.382 | 0.201 | 128.137 | 0.095 | −23.649 | 279.924 | |
| 5 | 0.197 | 17.586 | 0.904 | −284.210 | 319.383 | 0.239 | 81.685 | 0.583 | −223.503 | 386.873 | 0.304 | 116.500 | 0.126 | −35.158 | 268.159 | |
| Copper (mg) | 1 | 0.001 | 7.765 | 0.903 | −121.090 | 136.620 | 0.017 | 41.359 | 0.482 | −77.394 | 160.112 | 0.004 | 14.096 | 0.695 | −58.279 | 86.471 |
| 2 | 0.016 | 34.751 | 0.772 | −209.890 | 279.392 | 0.053 | 17.738 | 0.812 | −134.068 | 169.543 | 0.039 | 6.490 | 0.911 | −110.693 | 123.673 | |
| 3 | 0.027 | 24.732 | 0.841 | −226.887 | 276.350 | 0.060 | 7.625 | 0.923 | −153.952 | 169.202 | 0.041 | 8.557 | 0.886 | −112.062 | 129.176 | |
| 4 | 0.093 | 19.065 | 0.887 | −256.912 | 295.043 | 0.168 | 16.570 | 0.833 | −143.875 | 177.016 | 0.136 | 46.493 | 0.458 | −79.998 | 172.984 | |
| 5 | 0.201 | 64.828 | 0.724 | −314.034 | 443.690 | 0.228 | 11.032 | 0.897 | −164.469 | 186.533 | 0.251 | 42.761 | 0.502 | −86.363 | 171.884 | |
| Iodine (μg) | 1 | 0.008 | 30.782 | 0.640 | −102.706 | 164.271 | 0.046 | 81.841 | 0.240 | −57.529 | 221.212 | 0.022 | −42.133 | 0.386 | −139.513 | 55.247 |
| 2 | 0.029 | 56.302 | 0.518 | −120.504 | 233.109 | 0.098 | 101.984 | 0.249 | −75.679 | 279.648 | 0.072 | −64.920 | 0.297 | −189.764 | 59.923 | |
| 3 | 0.039 | 50.674 | 0.570 | −130.679 | 232.027 | 0.098 | 98.086 | 0.303 | −93.617 | 289.789 | 0.076 | −78.239 | 0.285 | −224.781 | 68.303 | |
| 4 | 0.095 | 23.215 | 0.803 | −167.908 | 214.337 | 0.225 | 127.661 | 0.189 | −67.401 | 322.723 | 0.141 | −66.715 | 0.389 | −222.844 | 89.415 | |
| 5 | 0.197 | −15.199 | 0.881 | −225.146 | 194.748 | 0.309 | 158.222 | 0.140 | −56.457 | 372.901 | 0.322 | −137.836 | 0.084 | −295.371 | 19.699 | |
| Iron (mg) | 1 | 0.007 | 30.044 | 0.658 | −107.487 | 167.575 | 0.035 | 66.164 | 0.308 | −64.121 | 196.449 | 0.035 | 44.412 | 0.265 | −35.151 | 123.976 |
| 2 | 0.034 | 79.261 | 0.461 | −138.613 | 297.135 | 0.076 | 98.022 | 0.403 | −138.853 | 334.898 | 0.079 | 77.703 | 0.245 | −55.889 | 211.295 | |
| 3 | 0.043 | 70.665 | 0.523 | −154.431 | 295.761 | 0.083 | 95.313 | 0.424 | −145.887 | 336.513 | 0.081 | 77.519 | 0.253 | −58.319 | 213.357 | |
| 4 | 0.123 | 104.201 | 0.387 | −140.508 | 348.909 | 0.168 | 30.333 | 0.813 | −231.155 | 291.821 | 0.202 | 117.228 | 0.091 | −20.114 | 254.570 | |
| 5 | 0.276 | 206.316 | 0.165 | −92.421 | 505.054 | 0.230 | 35.933 | 0.801 | −258.075 | 329.941 | 0.323 | 119.810 | 0.081 | −15.689 | 255.309 | |
| Magnesium (mg) | 1 | 0.012 | 47.893 | 0.566 | −121.097 | 216.883 | 0.010 | 37.288 | 0.578 | −98.261 | 172.836 | 0.018 | 39.442 | 0.424 | −59.480 | 138.364 |
| 2 | 0.048 | 134.307 | 0.338 | −148.960 | 417.574 | 0.054 | 27.146 | 0.794 | −183.772 | 238.064 | 0.074 | 100.091 | 0.277 | −84.314 | 284.497 | |
| 3 | 0.051 | 120.287 | 0.429 | −188.080 | 428.655 | 0.062 | 26.630 | 0.800 | −187.738 | 240.998 | 0.080 | 109.211 | 0.254 | −82.253 | 300.675 | |
| 4 | 0.122 | 130.433 | 0.395 | −181.386 | 442.253 | 0.167 | 16.960 | 0.870 | −195.391 | 229.310 | 0.228 | 195.903 | 0.052 | −1.449 | 393.255 | |
| 5 | 0.225 | 137.590 | 0.405 | −200.651 | 475.831 | 0.231 | 34.706 | 0.778 | −219.204 | 288.617 | 0.359 | 209.968 | 0.035 | 15.617 | 404.319 | |
| Manganese (mg) | 1 | 0.028 | 55.427 | 0.378 | −71.380 | 182.235 | 0.005 | 16.415 | 0.707 | −71.921 | 104.751 | 0.010 | 21.010 | 0.558 | −51.092 | 93.113 |
| 2 | 0.071 | 123.704 | 0.221 | −79.364 | 326.773 | 0.052 | −3.069 | 0.957 | −119.040 | 112.901 | 0.050 | 32.472 | 0.544 | −75.283 | 140.227 | |
| 3 | 0.075 | 116.172 | 0.271 | −96.576 | 328.920 | 0.060 | −2.711 | 0.963 | −120.579 | 115.156 | 0.054 | 36.441 | 0.512 | −75.538 | 148.420 | |
| 4 | 0.115 | 87.295 | 0.463 | −155.219 | 329.809 | 0.174 | 26.902 | 0.649 | −93.552 | 147.355 | 0.161 | 67.896 | 0.235 | −46.563 | 182.354 | |
| 5 | 0.233 | 148.215 | 0.348 | −174.149 | 470.580 | 0.228 | 6.949 | 0.921 | −136.888 | 150.786 | 0.301 | 86.001 | 0.137 | −29.129 | 201.130 | |
| Nitrogen (g) | 1 | 0.009 | 45.855 | 0.628 | −145.675 | 237.384 | 0.028 | 72.596 | 0.361 | −87.307 | 232.498 | 0.001 | 10.020 | 0.838 | −89.000 | 109.040 |
| 2 | 0.059 | 187.715 | 0.277 | −160.518 | 535.947 | 0.079 | 122.556 | 0.377 | −157.318 | 402.431 | 0.039 | −2.024 | 0.982 | −179.990 | 175.943 | |
| 3 | 0.063 | 173.300 | 0.338 | −192.896 | 539.496 | 0.085 | 117.196 | 0.407 | −168.841 | 403.233 | 0.040 | 0.506 | 0.996 | −182.241 | 183.252 | |
| 4 | 0.117 | 144.646 | 0.436 | −233.597 | 522.889 | 0.167 | −23.512 | 0.888 | −365.757 | 318.734 | 0.127 | 48.643 | 0.609 | −143.703 | 240.989 | |
| 5 | 0.253 | 229.907 | 0.243 | −169.685 | 629.500 | 0.228 | −24.832 | 0.898 | −421.984 | 372.320 | 0.239 | 19.193 | 0.840 | −174.203 | 212.590 | |
| Phosphorous (mg) | 1 | 0.003 | 27.993 | 0.766 | −162.724 | 218.710 | 0.015 | 57.456 | 0.499 | −114.202 | 229.114 | 0.000 | 7.146 | 0.901 | −108.600 | 122.893 |
| 2 | 0.045 | 188.086 | 0.367 | −233.295 | 609.466 | 0.060 | 78.072 | 0.627 | −247.944 | 404.089 | 0.039 | −13.901 | 0.924 | −308.039 | 280.237 | |
| 3 | 0.051 | 169.357 | 0.435 | −271.236 | 609.950 | 0.067 | 71.617 | 0.662 | −261.259 | 404.493 | 0.040 | −5.683 | 0.971 | −318.630 | 307.265 | |
| 4 | 0.103 | 113.980 | 0.613 | −346.970 | 574.930 | 0.167 | 17.031 | 0.918 | −321.290 | 355.353 | 0.134 | 117.914 | 0.484 | −222.170 | 457.998 | |
| 5 | 0.208 | 126.685 | 0.590 | −356.433 | 609.803 | 0.234 | 85.992 | 0.685 | −349.189 | 521.173 | 0.240 | 54.466 | 0.755 | −300.687 | 409.619 | |
| Potassium (mg) | 1 | 0.018 | 56.300 | 0.477 | −103.819 | 216.419 | 0.006 | 30.712 | 0.663 | −111.969 | 173.394 | 0.008 | 29.688 | 0.607 | −86.520 | 145.896 |
| 2 | 0.047 | 109.673 | 0.347 | −125.983 | 345.328 | 0.051 | −1.282 | 0.991 | −235.386 | 232.821 | 0.047 | 51.782 | 0.620 | −159.087 | 262.650 | |
| 3 | 0.051 | 97.860 | 0.434 | −155.787 | 351.506 | 0.060 | −8.590 | 0.942 | −248.425 | 231.244 | 0.050 | 62.325 | 0.572 | −160.321 | 284.971 | |
| 4 | 0.119 | 101.462 | 0.425 | −157.261 | 360.184 | 0.166 | −2.926 | 0.980 | −241.369 | 235.517 | 0.161 | 138.053 | 0.236 | −95.225 | 371.330 | |
| 5 | 0.222 | 105.443 | 0.434 | −170.771 | 381.657 | 0.228 | 18.263 | 0.892 | −259.878 | 296.404 | 0.293 | 162.286 | 0.165 | −71.287 | 395.858 | |
| Selenium (μg) | 1 | 0.013 | 43.158 | 0.544 | −100.802 | 187.119 | 0.069 | 102.133 | 0.146 | −37.525 | 241.791 | 0.017 | 26.818 | 0.445 | −43.726 | 97.362 |
| 2 | 0.068 | 157.873 | 0.231 | −107.040 | 422.786 | 0.132 | 155.801 | 0.125 | −45.927 | 357.530 | 0.065 | 52.255 | 0.358 | −61.844 | 166.354 | |
| 3 | 0.078 | 152.266 | 0.257 | −118.360 | 422.893 | 0.133 | 162.882 | 0.151 | −63.501 | 389.264 | 0.068 | 55.403 | 0.343 | −61.864 | 172.670 | |
| 4 | 0.132 | 135.082 | 0.323 | −142.104 | 412.269 | 0.215 | 144.228 | 0.235 | −99.935 | 388.390 | 0.151 | 60.494 | 0.302 | −57.238 | 178.226 | |
| 5 | 0.232 | 128.958 | 0.356 | −156.548 | 414.464 | 0.268 | 141.726 | 0.305 | −139.159 | 422.612 | 0.249 | 37.843 | 0.530 | −84.499 | 160.185 | |
| Sodium (mg) | 1 | 0.001 | −12.310 | 0.863 | −156.880 | 132.261 | 0.007 | 27.329 | 0.651 | −94.818 | 149.477 | 0.056 | 53.368 | 0.159 | −21.949 | 128.684 |
| 2 | 0.013 | −17.939 | 0.882 | −264.710 | 228.832 | 0.051 | 4.073 | 0.975 | −256.284 | 264.431 | 0.145 | 137.731 | 0.055 | −3.231 | 278.693 | |
| 3 | 0.030 | −43.199 | 0.737 | −305.709 | 219.310 | 0.060 | 5.845 | 0.964 | −258.847 | 270.537 | 0.147 | 138.601 | 0.058 | −4.721 | 281.923 | |
| 4 | 0.094 | −24.835 | 0.854 | −300.837 | 251.166 | 0.167 | −18.877 | 0.889 | −295.000 | 257.246 | 0.199 | 121.615 | 0.100 | −24.696 | 267.927 | |
| 5 | 0.196 | 14.467 | 0.919 | −280.912 | 309.846 | 0.228 | −20.252 | 0.897 | −341.472 | 300.969 | 0.297 | 105.786 | 0.150 | −40.874 | 252.447 | |
| Zinc (mg) | 1 | 0.003 | 27.139 | 0.756 | −150.344 | 204.621 | 0.002 | 22.001 | 0.786 | −141.899 | 185.901 | 0.002 | 11.563 | 0.818 | −89.887 | 113.012 |
| 2 | 0.038 | 131.442 | 0.418 | −197.461 | 460.345 | 0.051 | −2.183 | 0.987 | −284.797 | 280.430 | 0.039 | 6.272 | 0.943 | −171.268 | 183.813 | |
| 3 | 0.045 | 115.778 | 0.494 | −228.626 | 460.181 | 0.060 | 9.784 | 0.946 | −281.729 | 301.297 | 0.041 | 6.966 | 0.938 | −173.654 | 187.585 | |
| 4 | 0.111 | 115.634 | 0.501 | −235.095 | 466.363 | 0.204 | −180.999 | 0.299 | −533.080 | 171.082 | 0.123 | 34.254 | 0.706 | −149.606 | 218.113 | |
| 5 | 0.296 | 335.168 | 0.117 | −91.712 | 762.049 | 0.256 | −180.723 | 0.394 | −613.285 | 251.839 | 0.239 | 18.785 | 0.835 | −164.458 | 202.028 | |
Publisher’s Note: MDPI stays neutral with regard to jurisdictional claims in published maps and institutional affiliations. |
© 2021 by the authors. Licensee MDPI, Basel, Switzerland. This article is an open access article distributed under the terms and conditions of the Creative Commons Attribution (CC BY) license (https://creativecommons.org/licenses/by/4.0/).
Share and Cite
Norbitt, C.F.; Kimita, W.; Ko, J.; Bharmal, S.H.; Petrov, M.S. Associations of Habitual Mineral Intake with New-Onset Prediabetes/Diabetes after Acute Pancreatitis. Nutrients 2021, 13, 3978. https://doi.org/10.3390/nu13113978
Norbitt CF, Kimita W, Ko J, Bharmal SH, Petrov MS. Associations of Habitual Mineral Intake with New-Onset Prediabetes/Diabetes after Acute Pancreatitis. Nutrients. 2021; 13(11):3978. https://doi.org/10.3390/nu13113978
Chicago/Turabian StyleNorbitt, Claire F., Wandia Kimita, Juyeon Ko, Sakina H. Bharmal, and Maxim S. Petrov. 2021. "Associations of Habitual Mineral Intake with New-Onset Prediabetes/Diabetes after Acute Pancreatitis" Nutrients 13, no. 11: 3978. https://doi.org/10.3390/nu13113978
APA StyleNorbitt, C. F., Kimita, W., Ko, J., Bharmal, S. H., & Petrov, M. S. (2021). Associations of Habitual Mineral Intake with New-Onset Prediabetes/Diabetes after Acute Pancreatitis. Nutrients, 13(11), 3978. https://doi.org/10.3390/nu13113978