Article

Association between Milk Intake and Incident Stroke among Japanese Community Dwellers: The Iwate-KENCO Study

by
Kozo Tanno
1,*,
Yuki Yonekura
2,
Nagako Okuda
3,
Toru Kuribayashi
4,
En Yabe
5,
Megumi Tsubota-Utsugi
1,
Shinichi Omama
6,
Toshiyuki Onoda
7,
Masaki Ohsawa
8,
Kuniaki Ogasawara
9,
Fumitaka Tanaka
10,
Koichi Asahi
10,
Ryo Itabashi
11,
Shigeki Ito
12,
Yasushi Ishigaki
13,
Fumiaki Takahashi
14,
Makoto Koshiyama
15,
Ryohei Sasaki
16,
Daisuke Fujimaki
1,
Nobuyuki Takanashi
1,
Eri Takusari
1,
Kiyomi Sakata
1 and
Akira Okayama
17
add Show full author list remove Hide full author list
1
Department of Hygiene and Preventive Medicine, Iwate Medical University, Yahaba 028-3694, Japan
2
Department of Nursing Informatics, Graduate School of Nursing Science, St. Luke’s International University, Tokyo 104-0044, Japan
3
Department of Health Science, Kyoto Prefectural University, Kyoto 606-8522, Japan
4
Faculty of Humanities and Social Sciences, Iwate University, Morioka 020-8550, Japan
5
Department of Health Food Sciences, University of Human Arts and Sciences, Saitama 399-8539, Japan
6
Iwate Prefectural Advanced Critical Care and Emergency Center, Iwate Medical University, Yahaba 028-3694, Japan
7
Health Care Center, Iwate University, Morioka 020-8550, Japan
8
Department of Internal Medicine, Morioka Tsunagi Onsen Hospital, Morioka 020-0055, Japan
9
Department of Neurosurgery, Iwate Medical University, Yahaba 028-3695, Japan
10
Division of Nephrology and Hypertension, Department of Internal Medicine, Iwate Medical University, Yahaba 028-3695, Japan
11
Stroke Center, Division of Neurology and Gerontology, Department of Internal Medicine, Iwate Medical University, Yahaba 028-3695, Japan
12
Division of Hematology and Oncology, Department of Internal Medicine, Iwate Medical University, Yahaba 028-3695, Japan
13
Division of Diabetes, Metabolism and Endocrinology, Department of Internal Medicine, Iwate Medical University, Yahaba 028-3695, Japan
14
Department of Information Science, Iwate Medical University, Yahaba 028-3694, Japan
15
Iwate Health Service Association, Morioka 020-8585, Japan
16
Center for Liberal Arts and Sciences, Department of Human Sciences, Iwate Medical University, Yahaba 028-3694, Japan
17
The Research Institute of Strategy for Prevention, Tokyo 103-0006, Japan
*
Author to whom correspondence should be addressed.
Nutrients 2021, 13(11), 3781; https://doi.org/10.3390/nu13113781
Submission received: 24 August 2021 / Revised: 12 October 2021 / Accepted: 20 October 2021 / Published: 25 October 2021
(This article belongs to the Section Clinical Nutrition)

Abstract

:
We aimed to evaluate the association between the milk consumption and incident stroke in a Japanese population, where milk consumption is lower than that of Western countries. In total, 14,121 participants (4253 men and 9868 women) aged 40–69 years, free from cardiovascular diseases (CVD) were prospectively followed for 10.7 years. Participants were categorized into four groups according to the milk intake frequency obtained from a brief-type self-administered diet questionnaire. The adjusted HRs of total stroke, ischemic stroke and haemorrhagic stroke associated with milk intake frequency were calculated using the Cox proportional hazards model. During the follow-up, 478 stroke cases were detected (208 men and 270 women). Compared to women with a milk intake of <2 cups/week, those with an intake of 7 to <12 cups/week had a significantly low risk of ischemic stroke in a model adjusting CVD risk factors; the HR (95% CI) was 0.53 (0.32–0.88). No significant associations were found in men. This study suggested that milk intake of 7 to <12 cups/week decreased the risk of ischemic stroke in Japanese women. Milk intake of about 1 to <2 cups/day may be effective in the primary prevention of ischemic stroke in a population with low milk intake.

1. Introduction

Milk and dairy products are the major components of traditional Western diets, and the effects of their consumption on health have been frequently reported [1]. In Japan, milk intake is a relatively new dietary habit that was introduced to Japan after World War II, when it was served in school lunches. According to the 2017 Food Agriculture Organization balance sheet, the food supply quantity of milk was 245.43 kg/capita/year and 215.96 kg/capita/year in North America and Europe, respectively, compared to 58.63 kg/capita/year in Japan, corresponding to 160 g/capita/day [2]. The consumption of milk in Japan is lower than that in Western countries, and it is much lower for adults. According to the National Health and Nutrition Survey conducted in Japan in 2016, the average milk and dairy consumption was 111.2 g/day for those aged 20 years and above and 306 g/day for those aged 7–14 years [3]. Conversely, according to National Health and Nutrition Survey in US in 2007–2010, the average total dairy consumption was 2.1 cup equivalents/day for those aged 9–18 years, 1.7 cup equivalents/day for those aged 19–50 years, and 1.5 cup equivalent/day for those aged 51–70 years [4]. The Dutch National Food Consumption Survey 2012–2016 showed that the mean dairy product consumption was 374 g/day for men aged 19–70 years and 321 g/day for women aged 19–70 years [5].
The association between milk consumption and the risk of cardiovascular diseases (CVDs), such as myocardial infarction and stroke, has also been often reported [6,7,8]. The epidemiology of the diseases differs among Japanese and Western populations; in Western countries, mortality and morbidity from coronary artery disease are higher than those from stroke, while in East Asian countries, including Japan, mortality and morbidity from stroke are higher than those from myocardial infarction [9]. The reports on health effects of milk consumption that focus mainly on Western populations may not provide sufficient evidence for the Japanese population, which differs greatly from the Western population in terms of both milk intake and disease patterns.
Milk is a good source of potassium, calcium, and magnesium, which have been reported to reduce blood pressure [10,11,12]. In observational and interventional studies, an inverse relationship of milk consumption with blood pressure levels, and the development of hypertension have been observed [13,14]. Therefore, milk consumption is expected to have a potential risk-reducing effect on stroke.
A recent meta-analysis showed a significant inverse association between milk consumption and the risk of stroke [15,16], while others have shown a null association [17]. Some meta-analyses have suggested a nonlinear relationship [18,19]. Several studies have examined the association of milk consumption with mortality from stroke in Japanese people, but the results have been inconsistent [20,21,22]. In addition, to the best of our knowledge, no study involving the Japanese subjects has used the incidence of stroke as an endpoint. Therefore, the relationship between milk consumption and the incidence of stroke in the Japanese population is unclear.
Therefore, this study aimed to elucidate the relationship between the frequency of milk intake and the incidence of stroke in a Japanese population, whose milk consumption is lower than that in Western populations.

2. Materials and Methods

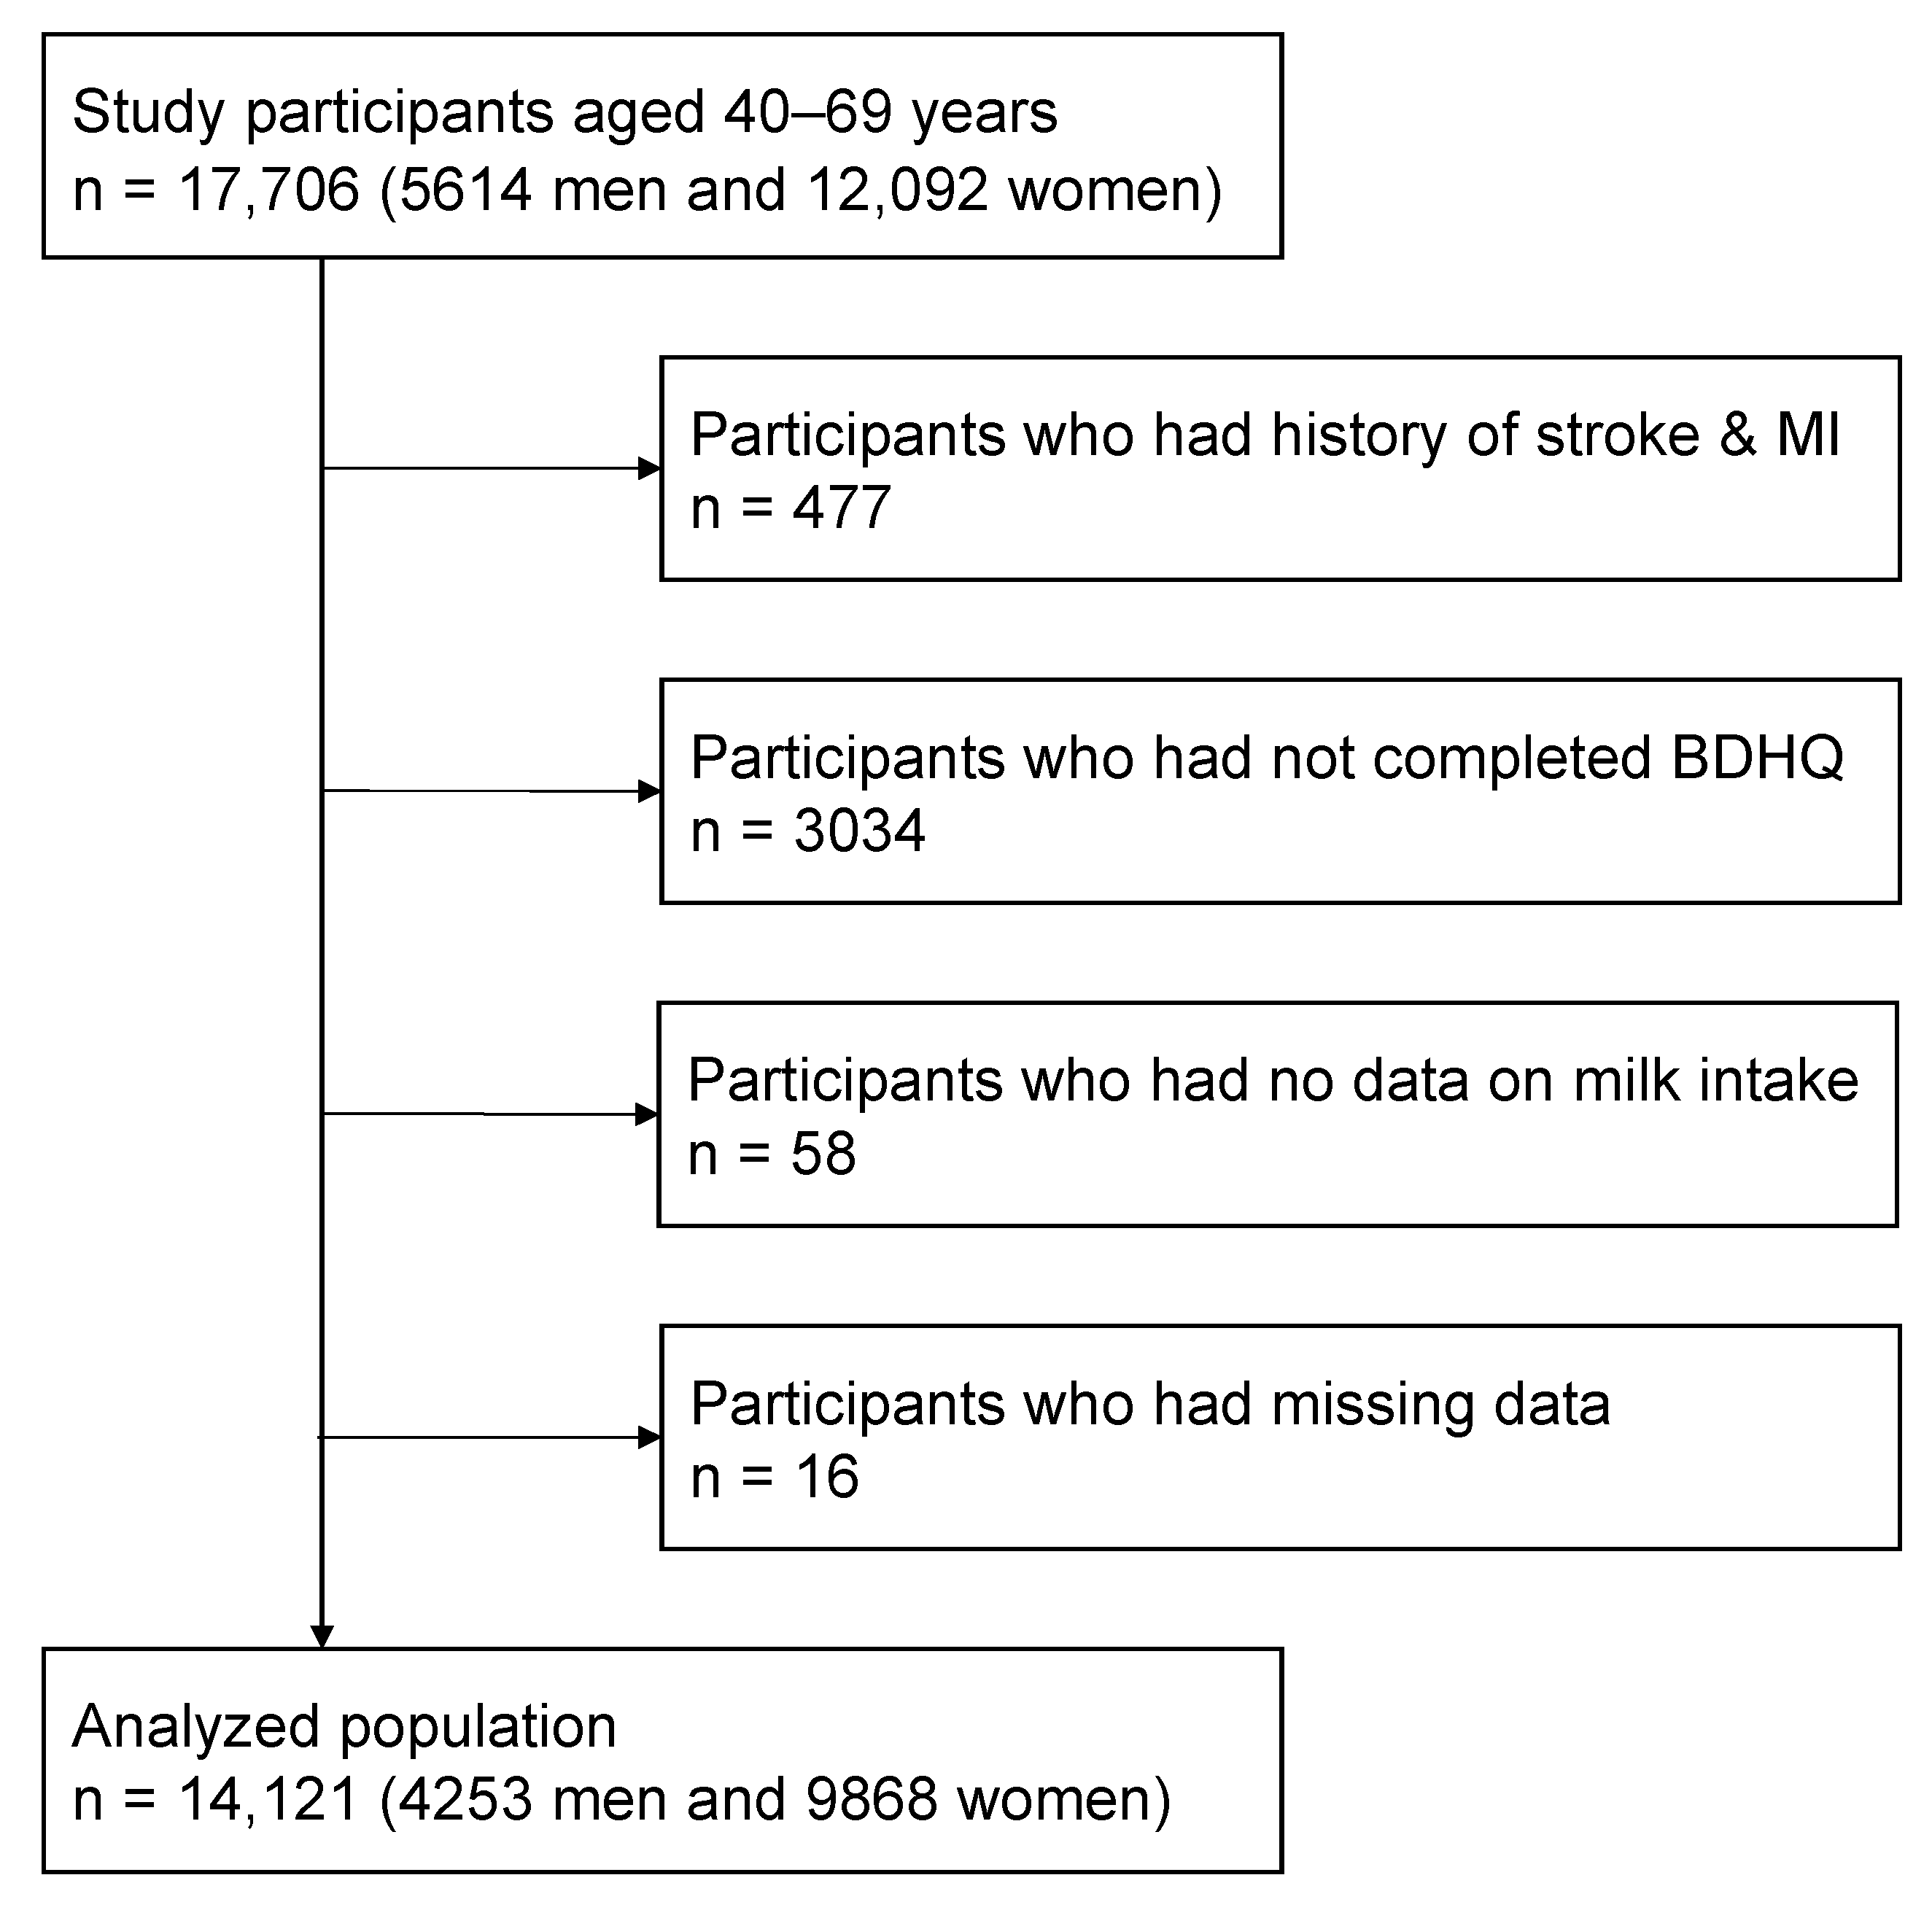
2.1. Study Population

The Iwate-Kenpoku cohort (Iwate-KENCO) study is a prospective cohort study of community-dwelling residents in the Ninohe, Kuji, and Miyako districts of the northern part of Iwate Prefecture, Northeast of the main island of Japan. The methodology of the Iwate-KENCO study has been described elsewhere [23]. A baseline survey was conducted between 2002 and 2005, wherein participants were recruited from the individuals who participated in the government-regulated multiphasic health check-up in each municipality. In total, 17,706 participants (5614 men and 12,092 women) aged 40 to 69 years provided written informed consent for participation in this study. In the present analysis, we excluded 3585 persons for the following reasons: 477 persons with a history of stroke or myocardial infarction, 3092 persons without the data for food frequency questionnaire, and 16 persons with missing data. Consequently, data from 14,121 participants (4253 men and 9868 women) were analyzed in this study (Figure 1).

2.2. Frequency of Milk Intake and Other Foods

Food intake was assessed once at baseline using the brief-type self-administered diet history questionnaire (BDHQ) [24,25], which includes questions about the frequency of consumption and/or portion sizes of about 58 food items. The BDHQ was validated through comparison with results from dietary records, and the Spearman’s correlation coefficient for dairy products was 0.70, which indicated reasonable ranking ability [25]. Two questions regarding dairy foods intake were posed to assess the consumption (number of cups) of normal/high-fat milk/yogurt and low-fat milk/yogurt. Frequency in the BDHQ were measured as “≥2 cups/day”, “1 cup/day”, “4 to 6 cups/week”, “2 to 3 cups/week”, “1 cup/week”, “<1 cup/day”, and “never drink”. These were re-categorized as 14, 7, 5, 2.5, 1, 0.5, and 0 cups/week, respectively, in the present analysis. We calculated the total number of cups of normal/high-fat and low-fat milk/yogurt and described it as milk consumption (cups/week). Based on milk intake, participants were categorized into following four groups: <2 cups/week, 2 to <7 cups/week, 7 to <12 cups/week, and ≥12 cups/week.
To examine the food intake pattern, we calculated the intake frequency (times/week) of starchy foods (such as rice, bread, and noodles), fish, soy products, meat, vegetables, fruits, and sugar-sweetened beverages, and the number of cups of miso soup per day. The frequency ratio of the total fish and soy products intake to that of meat (times/times) was also calculated.

2.3. Stroke Event Ascertainment

Stroke events were identified by accessing the Iwate Stroke Registry, which included the entire area where the participants lived; indeed, details of this registry have been described previously [26,27]. Since 1991, the stroke registration program has been coordinated by the Iwate Prefecture government and the Iwate Medical Association; the medical records of all medical facilities within the survey area are verified to ensure complete capture of all data. The stroke diagnostic criteria in this registry are based principally on the criteria established for the Monitoring System for Cardiovascular Disease commissioned by the Ministry of Health and Welfare [28], and these criteria correspond with those published by the World Health Organization [29]. To verify the accuracy of the data, a physician or trained research nurse visited and checked the medical records at the referral hospitals. We defined the follow-up period as the period from the baseline survey to either the first outcome or the end of the observation period. In the present study, we used follow-up data until 31 December 2014; participants who did not experience any outcomes during the follow-up period and those who moved out of the study area were censored administratively. Death and date of death were confirmed by the investigators reviewing the population-register sheets of the cohort members.

2.4. Other Measurements

The baseline survey consisted of a self-reported questionnaire, measurements of anthropometric data and blood pressure, and blood tests. The methodology for data collection has been described previously [23]. Body mass index (BMI) was calculated by measuring height and body weight. BMI was classified into four categories: <18.5 kg/m2, 18.5–24.9 kg/m2, 25–29.9 kg/m2, and ≥30 kg/m2. Systolic blood pressure (SBP) and diastolic blood pressure were recorded two times after five minutes of sitting rest, and the mean of the two measurements was used. Casual blood samples were drawn from the antecubital vein. Glycated haemoglobin (HbA1c) levels were measured using high-performance liquid chromatography. Serum total cholesterol (TC) and high-density lipoprotein cholesterol (HDLC) levels were measured by direct enzymatic assays.
Participants completed a self-reported questionnaire and reported their use of antihypertensives, smoking status, alcohol consumption status, and exercise habits. We asked participants to complete the questionnaire and bring it to their municipal health check-up site. In cases where the answers in the questionnaire were insufficient, a trained interviewer asked the respondent to answer as fully as possible. Smoking status was categorized into three groups: current smoking, ex-smoking, and non-smoking. Alcohol consumption was assessed by the frequency per week and amount of drinking per occasion and categorized as follows: intake of ≥3 drinks/day, 2 to <3 drinks/day, <2 drinks/day, ex-drinking, and non-drinking for men. Women reported less frequent alcohol intake compared with men, and the ≥3 drinks/day and 2 to <3 drinks/day categories were aggregated. Regular exercise was defined as engaging in exercise for at least 60 minutes, 8 times per month. In women, menopausal state was divided into two categories based on the answer to a questionnaire: postmenopausal state or not.

2.5. Statistical Analysis

All analyses were stratified by sex. Linear trends across the four milk intake frequency categories were estimated by one-way analysis of variance (ANOVA) for continuous variables and chi-square test for categorical variables. Using the Cox proportional hazards model, multivariate adjusted hazard ratios (HRs) and 95% confidence intervals (CIs) for total stroke, ischemic stroke, and haemorrhagic stroke in each group, considering the category “<2 cups/week” as a reference, were calculated for 4 models: model 1, adjusted for age; model 2, adjusted for age and lifestyle factors (smoking status, alcohol consumption status, and exercise habits); model 3, adjusted for age, lifestyle factors, and dietary factors (fruits and vegetables, fish and soy products intake to meat intake ratio); and model 4, adjusted for age, lifestyle factors, dietary factors, BMI categories, menopausal state, and CVD risk factors (SBP, HbA1c, TC, HDLC, and use of antihypertensives). The assumption of proportional hazard was verified using an interaction term between time and milk intake frequency in the models. All p values were two-tailed, and differences with p values < 0.05 were considered statistically significant. Statistical analyses were performed using the SPSS software package, version 25 (IBM Corporation, Armonk, NY, USA).

3. Results

The numbers (percentages) of men in the milk intake frequency categories were 1072 (25.2%), 1129 (26.5%), 1508 (35.5%), and 544 (12.8%) for <2 cups/week, 2 to <7 cups/week, 7 to <12 cups/week, and ≥12 cups/week, respectively. The corresponding numbers (percentages) for women were 1370 (13.9%), 2624 (26.6%), 4257 (43.1%), and 1617 (16.4%), respectively. Table 1 shows the baseline characteristics of the participants according to milk intake frequency categories. The men who had a higher milk intake frequency were older, had lower SBP, and significantly increased TC and HDLC levels; additionally, the proportion of current smokers and those who consumed ≥3 alcoholic drinks/day was significantly lower, and the proportion of those with regular exercise habit was significantly higher. Similar trends were observed among women; additionally, the proportion of obese women was significantly lower, and the proportion of postmenopausal women was significantly higher among those with a higher milk intake frequency.
Table 2 shows the food intake frequency of the participants according to milk intake frequency categories. The intake of starchy foods was similar among the groups. Participants with a higher milk intake frequency consumed more vegetables, fruits, meat, fish, and soy products, and the ratio of total fish and soy products intake to meat intake was significantly higher for those with a higher milk intake frequency.
The total observational person-years was 152,518 and the mean (standard deviation) observational period was 10.7 (2.1) years. Total stroke, ischemic stroke, and haemorrhagic stroke occurred in 478 (208 men and 270 women), 263 (134 men and 129 women), and 210 (72 men and 138 women) participants, respectively. Table 3 shows the multivariate adjusted HRs (95% CIs) of groups based on milk intake frequency, while considering the <2 cups/week category as a reference. For total stroke, women consuming 2 to <7 cups/week and 7 to <12 cups/week had significantly lower risks in models 1, 2, and 3. The HR was attenuated in model 4 with a marginal significance; the HRs (95% CIs) were 0.71 (0.47–1.05) (p = 0.084) and 0.73 (0.51–1.05) (p = 0.084) for the 2 to <7 cups/week and 7 to <12 cups/week categories, respectively. For ischemic stroke, women who consumed 2 to <7 cups/week had a significantly lower risk in model 1, but the significance disappeared in further adjusted models. For women who consumed 7 to <12 cups/week, a significantly lower ischemic stroke risk was shown in all models; the HR was 0.53 (0.32–0.88) (p = 0.014) in model 4. For haemorrhagic stroke, no significant association with milk intake frequency was observed. In men, no significant associations were found between milk intake frequency and the risks of total stroke, ischemic stroke, and haemorrhagic stroke. Additionally, no linear relationships were observed in all models in both sexes.

4. Discussion

We demonstrated that women who consumed milk at the frequency of 2 to <7 cups/week and 7 to <12 cups/week tended to have a decreased risk of total stroke compared with those who consumed <2 cups/week; however, the statistical significance disappeared after adjusting for not only CVD risk factors such as BMI, SBP, TC and HPLC, but also lifestyle factors, dietary factors, and menopausal state. For ischemic stroke, the reduced risk for women who consumed 7 to <12 cups/week remained significant even after fully adjusting. In contrast, no significant association between the frequency of milk intake and incidence of stroke was observed among men.
The findings of the previous studies on the association between milk intake frequency and risk of stroke in Japanese cohorts have been inconsistent [20,21,22]. In a 15-year follow-up cohort study that was conducted in 1965, people who consumed milk ≥4 times/week had significantly lower mortality risks from total, haemorrhagic, and ischemic stroke than those who consumed milk <once/week [20]. In contrast, in a 16-year follow-up study that was conducted in 1979, no significant association between milk consumption and mortality due to stroke was observed [21]. NIPPON DATA80, a 24-year follow-up study that was conducted in 1980, showed an inverse relationship between milk and dairy consumption and mortality risk due to stroke with a marginal significance only in women [22]. These studies examined only the risk of mortality but not the incidence of stroke. To the best of our knowledge, this is the first prospective cohort study in Japan to investigate the association between milk intake frequency and the incidence of stroke.
Several studies regarding the association between milk consumption and the risk of stroke have found an inverse [30,31], non-significant [32,33,34], or even a positive association in Western populations [35]. A recent meta-analysis showed that the relative risk of stroke (incidence and mortality) for a 200 g increase in daily milk intake was 0.98 (95% CI, 0.95–1.01) in Western countries and 0.82 (95% CI, 0.75–0.90) in East Asian countries, including Japan [18]. The analysis also suggested a possible nonlinear relationship between milk intake and the risk of stroke, and the greatest reduction in the risk of stroke was observed with the intake of approximately 125 g of milk/day for Western populations. Regional differences were also suggested, and the greatest reduction in the risk of stroke was observed with the intake of approximately 165 g of milk/day for East Asian countries [18]. The findings of our study suggested that, compared to those with a milk intake of <2 cups/week, the HR for ischemic stroke in women was significantly lowest for those who consumed 7 to <12 cups/week, while the HR was not significant for those who consumed ≥12 cups/week. Our results also suggested a nonlinear relationship between milk intake frequency and stroke incidence. In the BDHQ, participants were asked to state the number of cups of milk without specifying the volume of the cup. However, people often use a 150–200 mL-cup or glass in Japan [36], and the current analysis may suggest the optimal amount of milk intake for the prevention of ischemic stroke in the Japanese population.
The present study could not elucidate the underlying mechanism for the association between milk intake frequency and stroke risk reduction; however, there are several possible explanations. First, people with higher milk consumption seemed to prefer traditional Japanese foods; the consumption of high amounts of fish and soy products was accompanied by higher vegetable and fruit consumption. These foods have been reported to be associated with the lower risk of mortality due to CVDs [37,38,39]. Current findings suggesting a favorable association between milk intake frequency and the risk of stroke may be partially affected by the preference for Japanese foods. Second, nutrients included in milk might have played an important role in reducing the risk of stroke; indeed, milk contains an abundance of minerals such as potassium, calcium, and magnesium. These minerals have been reported to be associated with the reduced risk of stroke [40,41,42]. A prospective cohort study has shown a decrease in the risk of stroke and ischemic stroke after a higher consumption of dairy-derived calcium [43]. It has also been suggested that the proteins and peptides in milk may have antihypertensive and insulin secretion control effects [44]. An inverse association has been reported between milk and dairy consumption and CVD risk factors, such as hypertension, diabetes, and metabolic syndrome [13,45,46]. In the present analysis, the significant association of milk intake frequency with stroke risk reduction weakened or disappeared after adjusting for CVD risk factors. High blood pressure levels and impaired glucose tolerance may mediate the association between milk intake frequency and the incidence of stroke. In contrast, as milk intake increases, the intake of saturated fat, an important determinant of blood cholesterol levels, of which the average intake of Japanese adults is 15.3 g/day [3], increases. However, a recent meta-analysis reported an inverse association between dietary saturated fat intake and stroke risk in Japanese, but not in non-Japanese [47]. Yamagishi et al. suggest that an increase in saturated fat intake to a level of about 20 g/day may be optimal for the primary prevention of CVD in the Japanese population [48].
In the present study, no significant association was observed between milk intake frequency and the incidence of stroke in men. Among men, the proportion of those who consumed 7 to <12 cups of milk/week was lower than that among women. Owing to a smaller number of men who consumed the quantity of milk that was effective in reducing stroke risk, there might not have been a significant association. Moreover, a higher proportion of men had CVD risk factors, such as hypertension, diabetes, heavy drinking, and smoking habit, compared to women. These factors might have had a stronger impact on the incidence of stroke than the milk consumption, which might have masked the association between milk intake frequency and the incidence of stroke.
Our study has several limitations. First, in the BDHQ, consumption of milk and yogurt was combined in one question, and these could not be distinguished. Additionally, we could not distinguish between the effects of normal- and low-fat milk because approximately 30% of the participants reported drinking both types of milk. However, in the baseline year (2003) of the present cohort study, most milk and dairy products consumed were in the form of whole milk (76.1%), according to the National Health and Nutrition Survey in Japan [49]. In addition, according to the 2003 statistical survey on milk and dairy products, the amount of milk produced in Iwate Prefecture was 97,530 kL, while the amount of fermented milk produced was 4951 kL [50]. In 2004, the purchase volume per week per household for whole milk and low-fat milk was 2.56 L and 0.43 L, respectively [51]. Therefore, we believe that normal- and low-fat milk and yogurt consumption can be considered as whole milk consumption in our cohort. The consumption of low-fat milk is increasing in Japan, and the impact of different types of milk requires investigation in the future. Second, the BDHQ contained the question only on the number of cups of milk without specifying the volume, which might have caused a misclassification of the milk consumption categories. However, given the nature of food frequency questionnaires, a quantitative assessment of nutrient intakes could not be expected. Only frequencies were assessed for most of the foods in the BDHQ, and the validation paper showed the BDHQ’s limited ability to estimate the mean values of nutrients [52]. Although we also did not consider total energy intake in this study, considering the substantial correlation coefficient (0.70) of the BDHQ, we believe we categorized the participants reasonably: participants with higher milk/yogurt consumption and lower consumption. Third, the generalizability of our findings may be limited. The participants were those who underwent health check-up in three districts in one prefecture and might have been highly health conscious. Therefore, they are more likely to have favorable health behaviors, and the incidence and hazard ratios of stroke may be underestimated. In addition, it may be difficult to extrapolate our findings to the Western populations because of the differences in milk consumption levels. However, we believe that our findings may be generalizable to the East Asian population, which share some common characteristics such as low milk intake, high salt intake [53], and relatively low levels of obesity [54] with Japanese populations.
In conclusion, our findings suggest that moderate milk consumption (7 to <12 cups/week) decreased the risk of ischemic stroke in women but not in men. Consuming approximately 1 to <2 cups of milk/day may be effective in preventing ischemic stroke in the Japanese population.

Author Contributions

Conceptualization, K.T. and A.O.; methodology, K.T.; formal analysis, K.T.; investigation, K.T., Y.Y., T.K., S.O., T.O., M.O., F.T. (Fumitaka Tanaka), M.K., R.S. and E.T.; data curation, T.O.; writing—original draft preparation, K.T.; writing—review and editing, Y.Y., N.O., T.K., E.Y., M.T.-U., S.O., T.O., M.O., K.O., F.T. (Fumitaka Tanaka), K.A., R.I., S.I., Y.I., F.T. (Fumiaki Takahashi), M.K., R.S., D.F., N.T., E.T., K.S. and A.O.; project administration, A.O. and K.T.; funding acquisition, K.T., A.O., K.O., and K.S. All authors have read and agreed to the published version of the manuscript.

Funding

This work was supported by a grant from Japan Arteriosclerosis Prevention Fund; a grant-in-aid for Scientific Research (C) from the Japan Society for the Promotion of Science (JSPS KAKENHI Grant Numbers JP17K09126 and JP21K10477); and a grant-in-aid from the Ministry of Health, Labor and Welfare, Health and Labor Sciences research grants, Japan (H23-Junkankitou [Seishuu]-Ippan-005; H26-Junkankitou [Seisaku]-Ippan-001; H29-Junkankitou-Ippan-003 and 20FA1002). This study was also supported in part by the Japan Dairy Association.

Institutional Review Board Statement

The study was conducted according to the guidelines of the Declaration of Helsinki, and approved by the Medical Ethics Committee of Iwate Medical University (H13–33. the latest approval date: 9 January 2020).

Informed Consent Statement

Informed consent was obtained from all participants involved in the study.

Data Availability Statement

No additional data are available.

Acknowledgments

The authors would like to thank the participants of this study, the staff of Iwate Health Service Association, and the staff of all municipalities (Iwate Prefecture, Ninohe City, Ichinohe Town, Karumai Town, Kunohe Village, Yamada Town, Miyako City, Iwaizumi Town, Tanohata Village, Kuji City, Fudai Village, Noda Village, and Hirono Town). The authors would like to appreciate the late Professor Kazuyoshi Itai for his great support in administering the Iwate-KENCO study.

Conflicts of Interest

K.T., N.O. and A.O. received a research grant from the Japan Dairy Association. The funders had no role in the design of the study; in the collection, analyses, or interpretation of data; in the writing of the manuscript, or in the decision to publish the results.

References

  1. Willett, W.C.; Ludwig, D.S. Milk and Health. N. Engl. J. Med. 2020, 382, 644–654. [Google Scholar] [CrossRef]
  2. FAOSTAT. New Food Balances. Available online: http://www.fao.org/faostat/en/#data/FBS (accessed on 19 December 2020).
  3. Ministry of Health; Labour and Welfare. National Health and Nutrition Survey Japan 2016. Available online: http://www.mhlw.go.jp/bunya/kenkou/eiyou/h28-houkoku.html (accessed on 6 October 2018).
  4. Quann, E.E.; Fulgoni, V.L., 3rd; Auestad, N. Consuming the daily recommended amounts of dairy products would reduce the prevalence of inadequate micronutrient intakes in the United States: Diet modeling study based on NHANES 2007–2010. Nutr. J. 2015, 14, 90. [Google Scholar] [CrossRef] [Green Version]
  5. National Institute for Public Health and the Environment. DNFCS 2012–2016, 1–79 Years. Available online: https://www.rivm.nl/en/dutch-national-food-consumption-survey/overview-surveys/dnfcs-2012-2016 (accessed on 19 September 2021).
  6. Hirahatake, K.M.; Astrup, A.; Hill, J.O.; Slavin, J.L.; Allison, D.B.; Maki, K.C. Potential Cardiometabolic Health Benefits of Full-Fat Dairy: The Evidence Base. Adv. Nutr. 2020, 11, 533–547. [Google Scholar] [CrossRef]
  7. Yu, E.; Hu, F.B. Dairy Products, Dairy Fatty Acids, and the Prevention of Cardiometabolic Disease: A Review of Recent Evidence. Curr. Atheroscler. Rep. 2018, 20, 24. [Google Scholar] [CrossRef]
  8. Drouin-Chartier, J.P.; Brassard, D.; Tessier-Grenier, M.; Cote, J.A.; Labonte, M.E.; Desroches, S.; Couture, P.; Lamarche, B. Systematic Review of the Association between Dairy Product Consumption and Risk of Cardiovascular-Related Clinical Outcomes. Adv. Nutr. 2016, 7, 1026–1040. [Google Scholar] [CrossRef] [PubMed] [Green Version]
  9. Hata, J.; Kiyohara, Y. Epidemiology of stroke and coronary artery disease in Asia. Circ. J. 2013, 77, 1923–1932. [Google Scholar] [CrossRef] [Green Version]
  10. Aburto, N.J.; Hanson, S.; Gutierrez, H.; Hooper, L.; Elliott, P.; Cappuccio, F.P. Effect of increased potassium intake on cardiovascular risk factors and disease: Systematic review and meta-analyses. BMJ 2013, 346, f1378. [Google Scholar] [CrossRef] [Green Version]
  11. Jayedi, A.; Zargar, M.S. Dietary calcium intake and hypertension risk: A dose-response meta-analysis of prospective cohort studies. Eur. J. Clin. Nutr. 2019, 73, 969–978. [Google Scholar] [CrossRef] [PubMed]
  12. Kass, L.; Weekes, J.; Carpenter, L. Effect of magnesium supplementation on blood pressure: A meta-analysis. Eur. J. Clin. Nutr. 2012, 66, 411–418. [Google Scholar] [CrossRef] [PubMed]
  13. Soedamah-Muthu, S.S.; Verberne, L.D.; Ding, E.L.; Engberink, M.F.; Geleijnse, J.M. Dairy consumption and incidence of hypertension: A dose-response meta-analysis of prospective cohort studies. Hypertension 2012, 60, 1131–1137. [Google Scholar] [CrossRef] [Green Version]
  14. Hidayat, K.; Du, H.Z.; Yang, J.; Chen, G.C.; Zhang, Z.; Li, Z.N.; Qin, L.Q. Effects of milk proteins on blood pressure: A meta-analysis of randomized control trials. Hypertens. Res. 2017, 40, 264–270. [Google Scholar] [CrossRef]
  15. Soedamah-Muthu, S.S.; de Goede, J. Dairy Consumption and Cardiometabolic Diseases: Systematic Review and Updated Meta-Analyses of Prospective Cohort Studies. Curr. Nutr. Rep. 2018, 7, 171–182. [Google Scholar] [CrossRef] [PubMed] [Green Version]
  16. Alexander, D.D.; Bylsma, L.C.; Vargas, A.J.; Cohen, S.S.; Doucette, A.; Mohamed, M.; Irvin, S.R.; Miller, P.E.; Watson, H.; Fryzek, J.P. Dairy consumption and CVD: A systematic review and meta-analysis. Br. J. Nutr. 2016, 115, 737–750. [Google Scholar] [CrossRef] [Green Version]
  17. Mullie, P.; Pizot, C.; Autier, P. Daily milk consumption and all-cause mortality, coronary heart disease and stroke: A systematic review and meta-analysis of observational cohort studies. BMC Public Health 2016, 16, 1236. [Google Scholar] [CrossRef] [PubMed] [Green Version]
  18. de Goede, J.; Soedamah-Muthu, S.S.; Pan, A.; Gijsbers, L.; Geleijnse, J.M. Dairy Consumption and Risk of Stroke: A Systematic Review and Updated Dose-Response Meta-Analysis of Prospective Cohort Studies. J. Am. Heart Assoc. 2016, 5, e002787. [Google Scholar] [CrossRef] [PubMed] [Green Version]
  19. Hu, D.; Huang, J.; Wang, Y.; Zhang, D.; Qu, Y. Dairy foods and risk of stroke: A meta-analysis of prospective cohort studies. Nutr. Metab. Cardiovasc. Dis. 2014, 24, 460–469. [Google Scholar] [CrossRef]
  20. Kinjo, Y.; Beral, V.; Akiba, S.; Key, T.; Mizuno, S.; Appleby, P.; Yamaguchi, N.; Watanabe, S.; Doll, R. Possible protective effect of milk, meat and fish for cerebrovascular disease mortality in Japan. J. Epidemiol. 1999, 9, 268–274. [Google Scholar] [CrossRef] [Green Version]
  21. Sauvaget, C.; Nagano, J.; Allen, N.; Grant, E.J.; Beral, V. Intake of animal products and stroke mortality in the Hiroshima/Nagasaki Life Span Study. Int. J. Epidemiol. 2003, 32, 536–543. [Google Scholar] [CrossRef]
  22. Kondo, I.; Ojima, T.; Nakamura, M.; Hayasaka, S.; Hozawa, A.; Saitoh, S.; Ohnishi, H.; Akasaka, H.; Hayakawa, T.; Murakami, Y.; et al. Consumption of dairy products and death from cardiovascular disease in the Japanese general population: The NIPPON DATA80. J. Epidemiol. 2013, 23, 47–54. [Google Scholar] [CrossRef] [Green Version]
  23. Ohsawa, M.; Itai, K.; Tanno, K.; Onoda, T.; Ogawa, A.; Nakamura, M.; Kuribayashi, T.; Yoshida, Y.; Kawamura, K.; Sasaki, S.; et al. Cardiovascular risk factors in the Japanese northeastern rural population. Int. J. Cardiol. 2009, 137, 226–235. [Google Scholar] [CrossRef]
  24. Ohsawa, M.; Itai, K.; Onoda, T.; Tanno, K.; Sasaki, S.; Nakamura, M.; Ogawa, A.; Sakata, K.; Kawamura, K.; Kuribayashi, T.; et al. Dietary intake of n-3 polyunsaturated fatty acids is inversely associated with CRP levels, especially among male smokers. Atherosclerosis 2008, 201, 184–191. [Google Scholar] [CrossRef] [PubMed]
  25. Kobayashi, S.; Murakami, K.; Sasaki, S.; Okubo, H.; Hirota, N.; Notsu, A.; Fukui, M.; Date, C. Comparison of relative validity of food group intakes estimated by comprehensive and brief-type self-administered diet history questionnaires against 16 d dietary records in Japanese adults. Public Health Nutr. 2011, 14, 1200–1211. [Google Scholar] [CrossRef] [PubMed]
  26. Makita, S.; Nakamura, M.; Satoh, K.; Tanaka, F.; Onoda, T.; Kawamura, K.; Ohsawa, M.; Tanno, K.; Itai, K.; Sakata, K.; et al. Serum C-reactive protein levels can be used to predict future ischemic stroke and mortality in Japanese men from the general population. Atherosclerosis 2009, 204, 234–238. [Google Scholar] [CrossRef] [PubMed]
  27. Omama, S.; Yoshida, Y.; Ogasawara, K.; Ogawa, A.; Ishibashi, Y.; Ohsawa, M.; Tanno, K.; Onoda, T.; Itai, K.; Sakata, K.; et al. Incidence rate of cerebrovascular diseases in northern Japan determined from the Iwate Stroke Registry with an inventory survey system. J. Stroke Cerebrovasc. Dis. 2013, 22, e317–e322. [Google Scholar] [CrossRef]
  28. National Cardiovascular Center. Study Project of Monitoring System for Cardiovascular Disease commissioned by the Ministry of Health and Welfare. In Manual for the Registry and Follow-Up of Stroke; National Cardiovascular Center: Osaka, Japan, 1988. [Google Scholar]
  29. World Health Organization; World Health Organization MONICA Project. Event Registration Data Component, MONICA Manual Version 1.1. Document for Meeting of MONICA Principal Investigators; World Health Organization: Geneva, Switzerland, 1986. [Google Scholar]
  30. Mazidi, M.; Mikhailidis, D.P.; Sattar, N.; Howard, G.; Graham, I.; Banach, M.; Lipid and Blood Pressure Meta-Analysis Collaboration Group. Consumption of dairy product and its association with total and cause specific mortality—A population-based cohort study and meta-analysis. Clin. Nutr. 2019, 38, 2833–2845. [Google Scholar] [CrossRef] [PubMed]
  31. Dehghan, M.; Mente, A.; Rangarajan, S.; Sheridan, P.; Mohan, V.; Iqbal, R.; Gupta, R.; Lear, S.; Wentzel-Viljoen, E.; Avezum, A.; et al. Association of dairy intake with cardiovascular disease and mortality in 21 countries from five continents (PURE): A prospective cohort study. Lancet 2018, 392, 2288–2297. [Google Scholar] [CrossRef]
  32. Dalmeijer, G.W.; Struijk, E.A.; van der Schouw, Y.T.; Soedamah-Muthu, S.S.; Verschuren, W.M.; Boer, J.M.; Geleijnse, J.M.; Beulens, J.W. Dairy intake and coronary heart disease or stroke--a population-based cohort study. Int. J. Cardiol. 2013, 167, 925–929. [Google Scholar] [CrossRef] [Green Version]
  33. Praagman, J.; Franco, O.H.; Ikram, M.A.; Soedamah-Muthu, S.S.; Engberink, M.F.; van Rooij, F.J.; Hofman, A.; Geleijnse, J.M. Dairy products and the risk of stroke and coronary heart disease: The Rotterdam Study. Eur. J. Nutr. 2015, 54, 981–990. [Google Scholar] [CrossRef]
  34. Larsson, S.C.; Virtamo, J.; Wolk, A. Dairy consumption and risk of stroke in Swedish women and men. Stroke 2012, 43, 1775–1780. [Google Scholar] [CrossRef] [Green Version]
  35. Johansson, I.; Esberg, A.; Nilsson, L.M.; Jansson, J.H.; Wennberg, P.; Winkvist, A. Dairy Product Intake and Cardiometabolic Diseases in Northern Sweden: A 33-Year Prospective Cohort Study. Nutrients 2019, 11, 284. [Google Scholar] [CrossRef] [Green Version]
  36. Yoshiike, N.; Hayashi, F.; Takemi, Y.; Mizoguchi, K.; Seino, F. A new food guide in Japan: The Japanese food guide Spinning Top. Nutr. Rev. 2007, 65, 149–154. [Google Scholar] [CrossRef]
  37. Okuda, N.; Miura, K.; Okayama, A.; Okamura, T.; Abbott, R.D.; Nishi, N.; Fujiyoshi, A.; Kita, Y.; Nakamura, Y.; Miyagawa, N.; et al. Fruit and vegetable intake and mortality from cardiovascular disease in Japan: A 24-year follow-up of the NIPPON DATA80 Study. Eur. J. Clin. Nutr. 2015, 69, 482–488. [Google Scholar] [CrossRef]
  38. Miyagawa, N.; Miura, K.; Okuda, N.; Kadowaki, T.; Takashima, N.; Nagasawa, S.Y.; Nakamura, Y.; Matsumura, Y.; Hozawa, A.; Fujiyoshi, A.; et al. Long-chain n-3 polyunsaturated fatty acids intake and cardiovascular disease mortality risk in Japanese: A 24-year follow-up of NIPPON DATA80. Atherosclerosis 2014, 232, 384–389. [Google Scholar] [CrossRef]
  39. Nakamura, Y.; Ueshima, H.; Okamura, T.; Kadowaki, T.; Hayakawa, T.; Kita, Y.; Abbott, R.D.; Okayama, A.; National Integrated Project for Prospective Observation of Non-Communicable Diseases and Its Trends in the Aged, 1980 Research Group. A Japanese diet and 19-year mortality: National integrated project for prospective observation of non-communicable diseases and its trends in the aged, 1980. Br. J. Nutr. 2009, 101, 1696–1705. [Google Scholar] [CrossRef] [PubMed] [Green Version]
  40. Larsson, S.C.; Orsini, N.; Wolk, A. Dietary potassium intake and risk of stroke: A dose-response meta-analysis of prospective studies. Stroke 2011, 42, 2746–2750. [Google Scholar] [CrossRef]
  41. Larsson, S.C.; Orsini, N.; Wolk, A. Dietary magnesium intake and risk of stroke: A meta-analysis of prospective studies. Am. J. Clin. Nutr. 2012, 95, 362–366. [Google Scholar] [CrossRef] [Green Version]
  42. Larsson, S.C.; Orsini, N.; Wolk, A. Dietary calcium intake and risk of stroke: A dose-response meta-analysis. Am. J. Clin. Nutr. 2013, 97, 951–957. [Google Scholar] [CrossRef] [Green Version]
  43. Umesawa, M.; Iso, H.; Date, C.; Yamamoto, A.; Toyoshima, H.; Watanabe, Y.; Kikuchi, S.; Koizumi, A.; Kondo, T.; Inaba, Y.; et al. Dietary intake of calcium in relation to mortality from cardiovascular disease: The JACC Study. Stroke 2006, 37, 20–26. [Google Scholar] [CrossRef] [PubMed] [Green Version]
  44. Marcone, S.; Belton, O.; Fitzgerald, D.J. Milk-derived bioactive peptides and their health promoting effects: A potential role in atherosclerosis. Br. J. Clin. Pharmacol. 2017, 83, 152–162. [Google Scholar] [CrossRef] [Green Version]
  45. Mena-Sanchez, G.; Becerra-Tomas, N.; Babio, N.; Salas-Salvado, J. Dairy Product Consumption in the Prevention of Metabolic Syndrome: A Systematic Review and Meta-Analysis of Prospective Cohort Studies. Adv. Nutr. 2019, 10, S144–S153. [Google Scholar] [CrossRef] [PubMed]
  46. Talaei, M.; Pan, A.; Yuan, J.M.; Koh, W.P. Dairy intake and risk of type 2 diabetes. Clin. Nutr. 2018, 37, 712–718. [Google Scholar] [CrossRef]
  47. Muto, M.; Ezaki, O. High Dietary Saturated Fat is Associated with a Low Risk of Intracerebral Hemorrhage and Ischemic Stroke in Japanese but not in Non-Japanese: A Review and Meta-Analysis of Prospective Cohort Studies. J. Atheroscler. Thromb. 2018, 25, 375–392. [Google Scholar] [CrossRef] [Green Version]
  48. Yamagishi, K.; Iso, H.; Tsugane, S. Saturated fat intake and cardiovascular disease in Japanese population. J. Atheroscler. Thromb. 2015, 22, 435–439. [Google Scholar] [CrossRef] [PubMed] [Green Version]
  49. Ministry of Health; Labour and Welfare. National Health and Nurtrional Survey 2003. Available online: https://www.mhlw.go.jp/bunya/kenkou/eiyou-chosa2-01/index.html (accessed on 26 February 2021).
  50. Ministry of Agriculture; Forestry and Fisheries. Statistical Survey on Milk and Dairy Products 2003. Available online: https://www.e-stat.go.jp/stat-search/files?page=1&layout=datalist&toukei=00500225&tstat=000001015114&cycle=7&year=20030&month=0&tclass1=000001015842&tclass2=000001033340 (accessed on 7 August 2021).
  51. Japan Dairy Association. Survey on Consumption Trends of Milk and Dairy Products. Available online: https://www.j-milk.jp/report/trends/f13cn00000000xc8-att/9fgd1p0000023zn9.pdf (accessed on 26 February 2021).
  52. Kobayashi, S.; Honda, S.; Murakami, K.; Sasaki, S.; Okubo, H.; Hirota, N.; Notsu, A.; Fukui, M.; Date, C. Both comprehensive and brief self-administered diet history questionnaires satisfactorily rank nutrient intakes in Japanese adults. J. Epidemiol. 2012, 22, 151–159. [Google Scholar] [CrossRef] [Green Version]
  53. Brown, I.J.; Tzoulaki, I.; Candeias, V.; Elliott, P. Salt intakes around the world: Implications for public health. Int. J. Epidemiol. 2009, 38, 791–813. [Google Scholar] [CrossRef] [PubMed] [Green Version]
  54. Ng, M.; Fleming, T.; Robinson, M.; Thomson, B.; Graetz, N.; Margono, C.; Mullany, E.C.; Biryukov, S.; Abbafati, C.; Abera, S.F.; et al. Global, regional, and national prevalence of overweight and obesity in children and adults during 1980–2013: A systematic analysis for the Global Burden of Disease Study 2013. Lancet 2014, 384, 766–781. [Google Scholar] [CrossRef] [Green Version]
Figure 1. Flowchart for the selection of analyzed cohort.
Nutrients 13 03781 g001
Table 1. Baseline characteristics of participants according to milk intake frequency categories by sex, 2002–2005, Iwate-KENCO study.
Milk Intake Frequency<2 Cups/Week2 to <7 Cups/Week7 to <12 Cups/Week≥12 Cups/weekp for Trend
Men
Number of participants107211291508544
Age (years)56.7 (8.6)57.9 (8.1)60.4 (7.1)60.1 (7.5)<0.001
SBP (mmHg)128.9 (19.0)129.9 (19.2)128.3 (19.1)127.5 (19.3)0.050
HbA1c (%)5.06 (0.66)5.12 (0.78)5.16 (0.74)5.11 (0.72)0.077
TC (mg/dL)191.2 (33.5)192.7 (33.1)195.6 (31.8)199.8 (32.6)<0.001
HDLC (mg/dL)56.6 (15.4)55.2 (15.0)56.3 (15.5)58.8 (15.8)0.003
BMI<18.5 kg/m218 (1.7)14 (1.2)28 (1.9)4 (0.7)0.532
18.5 to <25 kg/m2687 (64.1)667 (59.1)935 (62.0)333 (61.2)0.418
25 to <30 kg/m2329 (30.7)407 (36.0)501 (33.2)190 (34.9)0.185
≥30 kg/m238 (3.5)41 (3.6)44 (2.9)17 (3.1)0.380
Smoking statusCurrent smoking519 (48.4)446 (39.5)436 (28.9)143 (26.3)<0.001
Ex-smoking252 (23.5)315 (27.9)457 (30.3)170 (31.3)<0.001
Non-smoking301 (28.1)368 (32.6)615 (40.8)231 (42.5)<0.001
Alcohol drinking status≥3 drinks/day113 (10.5)80 (7.1)61 (4.0)27 (5.0)<0.001
2 to <3 drink/day190 (17.7)149 (13.2)203 (13.5)41 (7.5)<0.001
<2 drinks/day455 (42.4)546 (48.4)723 (47.9)250 (46.0)0.061
Ex-drinking58 (5.4)47 (4.2)96 (6.4)40 (7.4)0.035
Non-drinking256 (23.9)307 (27.2)425 (28.2)186 (34.2)<0.001
Regular exercise113 (10.5)141 (12.5)310 (20.6)113 (20.8)<0.001
Use of antihypertensives188 (17.5)210 (18.6)301 (20.0)92 (16.9)0.591
Women
Number of participants1370262442571617
Age (years)56.3 (8.2)56.0 (8.0)58.4 (7.5)59.0 (7.5)<0.001
SBP (mmHg)124.9 (19.9)121.8 (18.9)123.5 (19.4)123.3 (19.1)0.135
HbA1c (%)5.05 (0.65)5.06 (0.63)5.09 (0.63)5.09 (0.53)0.026
TC (mg/dL)202.2 (32.6)204.7 (32.8)208.9 (32.3)208.4 (30.8)<0.001
HDLC (mg/dL)60.1 (14.2)61.9 (14.4)62.2 (14.2)63.1 (14.5)<0.001
BMI<18.5 kg/m252 (3.8)72 (2.7)129 (3.0)41 (2.5)0.343
18.5 to <25 kg/m2779 (56.9)1614 (61.5)2682 (63.0)1025 (63.4)0.008
25 to <30 kg/m2438 (32.0)785 (29.9)1251 (29.4)486 (30.1)0.465
≥30 kg/m2101 (7.4)153 (5.8)195 (4.6)65 (4.0)<0.001
Smoking statusCurrent smoking79 (5.8)92 (3.5)86 (2.0)37 (2.3)<0.001
Ex-smoking32 (2.3)46 (1.8)53 (1.2)16 (1.0)<0.001
Non-smoking1259 (91.9)2486 (94.7)4118 (96.7)1564 (96.7)<0.001
Alcohol drinking status≥2 drinks/day59 (4.3)64 (2.4)57 (1.3)12 (0.7)<0.001
<2 drinks/day200 (14.6)398 (15.2)513 (12.1)163 (10.1)<0.001
Ex-drinking32 (2.3)38 (1.4)54 (1.3)31 (1.9)0.284
Non-drinking1119 (81.7)2171 (82.7)3679 (86.4)1421 (87.9)<0.001
Regular exercise135 (9.9)266 (10.1)525 (12.3)215 (13.3)<0.001
Use of antihypertensives268 (19.6)444 (16.9)771 (18.1)311 (19.2)0.728
Postmenopausal state977 (71.3)1872 (71.3)3439 (80.8)1326 (82.0)<0.001
Continuous variables are expressed as means (standard deviations), and categorical variables are expressed as numbers (percentages). p for trend was estimated by one-way analysis of variance for continuous variables and by chi-square test for categorical variables. Abbreviations: SBP, systolic blood pressure; HbA1c, glycated haemoglobin; TC, total cholesterol; HDLC, high-density lipoprotein cholesterol; BMI, body mass index.
Table 2. Food intake frequency according to milk intake frequency categories by sex, 2002–2005, Iwate-KENCO study.
Milk Intake Frequency<2 Cups/Week2 to <7 Cups/Week7 to <12 Cups/Week≥12 Cups/Weekp for Trend
Men
Number of participants107211291508544
Starchy foods (portion/week)29.8 (11.3)30.0 (11.0)29.0 (10.6)30.1 (12.0)0.443
Fish (times/week)9.3 (6.8)10.1 (6.6)10.5 (7.1)11.2 (8.2)<0.001
Soy products (times/week)7.6 (4.5)7.9 (4.1)9.2 (4.7)9.8 (5.0)<0.001
Meat (times/week)8.3 (2.5)8.7 (2.5)8.6 (2.8)9.1 (3.5)<0.001
Protein foods, (fish + soy)/meats ratio2.1 (1.2)2.1 (1.2)2.3 (1.2)2.5 (1.4)<0.001
Vegetable (times/week)26.2 (14.3)27.3 (14.2)30.7 (15.4)32.0 (17.1)<0.001
Fruit (times/week)4.0 (4.5)5.2 (4.9)6.8 (5.8)7.4 (6.4)<0.001
Miso soup (cups/day)2.5 (1.3)2.5 (1.2)2.5 (1.1)2.5 (1.2)0.870
Sugary drink (drinks/week)3.0 (4.7)2.7 (4.2)2.6 (4.4)3.1 (4.7)0.487
Women
Number of participants1370262442571617
Starchy foods (portion/week)25.2 (8.1)25.7 (8.0)25.2 (7.9)26.2 (8.6)0.042
Fish (times/week)9.1 (7.0)10.3 (7.0)10.7 (7.1)12.3 (8.6)<0.001
Soy products (times/week)8.2 (4.9)8.9 (4.6)9.7 (4.7)10.7 (5.2)<0.001
Meat (times/week)8.4 (2.5)8.8 (2.6)8.6 (2.6)8.9 (3.1)0.008
Protein foods, (fish + soy)/meats ratio2.1 (1.4)2.2 (1.2)2.4 (1.4)2.7 (2.1)<0.001
Vegetable (times/week)30.2 (16.1)32.4 (15.4)35.2 (16.7)38.2 (18.1)<0.001
Fruit (times/week)5.9 (5.7)7.2 (5.9)8.6 (6.3)9.8 (7.2)<0.001
Miso soup (cups/day)2.1 (1.0)2.2 (1.0)2.1 (1.0)2.2 (1.0)0.399
Sugary drink (drinks/week)1.6 (3.4)1.5 (2.8)1.4 (3.0)1.6 (3.4)0.648
Data are expressed as mean (standard deviation). p for trend was estimated using one-way analysis of variance.
Table 3. Multivariate adjusted hazard ratios for total stroke, ischemic stroke, and hamorrhagic stroke, according to milk intake frequency categories by sex, 2002–2014, Iwate-KENCO study.
Milk Intake Frequency<2 Cups/Week2 to <7 Cups/Week7 to <12 Cups/Week≥12 Cups/Weekp for Trend
Men
Person-years11,26811,84815,9865764
Total stroke
Number of cases49647025
Crude incidence rate4.355.404.384.34
HR (95% CI)
Model 111.18 (0.81–1.71)0.84 (0.58–1.21)0.83 (0.51–1.35)0.500
Model 211.22 (0.84–1.77)0.92 (0.63–1.33)0.93 (0.57–1.51)0.885
Model 311.24 (0.84–1.82)0.93 (0.63–1.36)0.95 (0.57–1.57)0.985
Model 411.21 (0.83–1.79)0.99 (0.67–1.46)0.97 (0.59–1.61)0.810
Ischemic stroke
Number of cases31425011
Crude incidence rate2.753.543.131.91
HR (95% CI)
Model 111.21 (0.76–1.93)0.92 (0.58–1.44)0.56 (0.28–1.12)0.165
Model 211.24 (0.78–1.98)0.99 (0.62–1.56)0.61 (0.31–1.23)0.289
Model 311.28 (0.80–2.06)1.01 (0.63–1.62)0.61 (0.30–1.27)0.364
Model 411.27 (0.79–2.05)1.07 (0.66–1.71)0.64 (0.31–1.34)0.491
Haemorrhagic stroke
Number of cases18212013
Crude incidence rate1.601.771.252.26
HR (95% CI)
Model 111.06 (0.57–2.00)0.68 (0.36–1.29)1.23 (0.60–2.53)0.586
Model 211.12 (0.59–2.11)0.77 (0.40–1.47)1.42 (0.69–2.95)0.331
Model 311.09 (0.56–2.10)0.76 (0.39–1.49)1.44 (0.68–3.04)0.295
Model 411.04 (0.53–2.01)0.82 (0.42–1.61)1.39 (0.66–2.94)0.281
Women
Person-years14,65728,09845,82217,218
Total stroke
Number of cases506110455
Crude incidence rate3.412.172.273.19
HR (95% CI)
Model 110.65 (0.45–0.95)0.59 (0.42–0.83)0.80 (0.55–1.18)0.536
Model 210.66 (0.45–0.96)0.60 (0.43–0.84)0.81 (0.55–1.20)0.590
Model 310.66 (0.44–0.98)0.67 (0.47–0.95)0.91 (0.61–1.37)0.909
Model 410.71 (0.47–1.05)0.73 (0.51–1.051.03 (0.68–1.55)0.567
Ischemic stroke
Number of cases28314228
Crude incidence rate1.911.100.921.63
HR (95% CI)
Model 110.60 (0.36–0.999)0.41 (0.26–0.67)0.70 (0.41–1.18)0.153
Model 210.60 (0.36–1.01)0.41 (0.26–0.67)0.70 (0.41–1.18)0.152
Model 310.65 (0.38–1.11)0.48 (0.29–0.79)0.77 (0.44–1.35)0.322
Model 410.69 (0.40–1.18)0.53 (0.32–0.88)0.89 (0.50–1.57)0.572
Haemorrhagic stroke
Number of cases22296126
Crude incidence rate1.501.031.331.51
HR (95% CI)
Model 110.70 (0.40–1.22)0.81 (0.50–1.33)0.90 (0.51–1.59)0.664
Model 210.71 (0.41–1.24)0.84 (0.51–1.37)0.93 (0.53–1.65)0.584
Model 310.65 (0.36–1.17)0.91 (0.55–1.53)1.06 (0.58–1.93)0.300
Model 410.70 (0.39–1.26)0.98 (0.59–1.64)1.17 (0.64–2.15)0.195
Crude incidence rate is expressed as number of cases per 1000 person-years. Model 1: adjusted for age. Model 2: Model 1 + smoking status, alcohol consumption status, and exercise habits. Model 3: Model 2 + fruits and vegetables intake frequency and the ratio of total fish and soy products consumption to meat consumption. Model 4: Model 3 + body mass index, systolic blood pressure, glycated haemoglobin, total cholesterol, high-density lipoprotein cholesterol, use of antihypertensives, and menopausal state (if women). Abbreviations: HR, hazard ratio; CI, confidence interval.
Publisher’s Note: MDPI stays neutral with regard to jurisdictional claims in published maps and institutional affiliations.

