Article

Indole-3-Propionic Acid, a Gut-Derived Tryptophan Metabolite, Associates with Hepatic Fibrosis

1
Department of Clinical Nutrition, Institute of Public Health and Clinical Nutrition, University of Eastern Finland, 70211 Kuopio, Finland
2
Departments of Medicine, University of Eastern Finland and Kuopio University Hospital, 70211 Kuopio, Finland
3
Department of Pathology, University of Eastern Finland and Kuopio University Hospital, 70211 Kuopio, Finland
4
Department of Life Technologies, Food Chemistry and Food Development Unit, University of Turku, 20500 Turku, Finland
5
Department of Molecular and Clinical Medicine, University of Gothenburg, 40530 Gothenburg, Sweden
6
Department of Human Genetics, David Geffen School of Medicine, University of California Los Angeles (UCLA), Los Angeles, CA 90095, USA
7
Institute for Precision Health, School of Medicine, University of California Los Angeles (UCLA), Los Angeles, CA 90095, USA
8
Department of Medicine, Endocrinology and Clinical Nutrition, Kuopio University Hospital, 70211 Kuopio, Finland
*
Author to whom correspondence should be addressed.
These authors contributed equally to this work.
Nutrients 2021, 13(10), 3509; https://doi.org/10.3390/nu13103509
Submission received: 25 August 2021 / Revised: 28 September 2021 / Accepted: 30 September 2021 / Published: 5 October 2021
(This article belongs to the Special Issue Dietary Biomarkers in Human Nutrition)

Abstract

:
Background and Aims: Gut microbiota-derived metabolites play a vital role in maintenance of human health and progression of disorders, including obesity and type 2 diabetes (T2D). Indole-3-propionic acid (IPA), a gut-derived tryptophan metabolite, has been recently shown to be lower in individuals with obesity and T2D. IPA’s beneficial effect on liver health has been also explored in rodent and cell models. In this study, we investigated the association of IPA with human liver histology and transcriptomics, and the potential of IPA to reduce hepatic stellate cell activation in vitro. Methods: A total of 233 subjects (72% women; age 48.3 ± 9.3 years; BMI 43.1 ± 5.4 kg/m2) undergoing bariatric surgery with detailed liver histology were included. Circulating IPA levels were measured using LC-MS and liver transcriptomics with total RNA-sequencing. LX-2 cells were used to study hepatoprotective effect of IPA in cells activated by TGF-β1. Results: Circulating IPA levels were found to be lower in individuals with liver fibrosis compared to those without fibrosis (p = 0.039 for all participants; p = 0.013 for 153 individuals without T2D). Accordingly, levels of circulating IPA associated with expression of 278 liver transcripts (p < 0.01) that were enriched for the genes regulating hepatic stellate cells (HSCs) activation and hepatic fibrosis signaling. Our results suggest that IPA may have hepatoprotective potential because it is able to reduce cell adhesion, cell migration and mRNA gene expression of classical markers of HSCs activation in LX-2 cells (all p < 0.05). Conclusion: The association of circulating IPA with liver fibrosis and the ability of IPA to reduce activation of LX-2 cells suggests that IPA may have a therapeutic potential. Further molecular studies are needed to investigate the mechanisms how IPA can ameliorate hepatic fibrosis.

Graphical Abstract

1. Introduction

The liver is a central hub for a multitude of metabolic functions that are critical for physiological homeostasis [1]. Hepatic lipid and glucose metabolism dysregulation, hallmarks of non-alcoholic fatty liver disease (NAFLD) sets in an inflammatory milieu, leading to severe tissue injury, remodeling, and fibrosis, as commonly seen in non-alcoholic steatohepatitis (NASH) [2,3,4].
The gut microbiota is critical for human health maintenance by regulating metabolic processes such as the degradation of dietary elements and production of microbial metabolites that form an integral part of the systemic metabolome [5,6]. Indole-3-propionic acid (IPA) is one of the gut-derived tryptophan metabolites associated with dietary fiber intake [7,8] that is found to be reduced in various metabolic diseases in humans [9,10,11,12,13]. Recent studies in humans and rodents conclude that IPA levels are potentially modulated by dietary fat and fiber intake and suggests improving IPA levels with dietary and lifestyle modifications [7,13,14,15]. IPA is also known to induce anti-oxidative, anti-inflammatory, anti-hyperglycemic, and neuro-protective effects in vitro and in vivo [16,17,18,19]. The hepatoprotective effects of IPA have been shown in few in vitro models using the renal proximal tubular cells and rat hepatic microsomal membranes [20,21]. Recent rodent studies highlight the beneficial role of IPA in ameliorating the advanced liver pathology including NASH and hepatocellular carcinoma (HCC) by altering the fibrotic and pro-inflammatory processes [15,22].
The gut-liver axis also plays an integral part in the progression of hepatic fibrosis and precipitation of other hepatic alterations [23,24,25]. Systemic circulating intestinal metabolites such as short-chain fatty acids, branched-chain amino acids, secondary bile acids, betaine, tryptophan and its metabolites, have been reported to be associated with NASH and HCC [26,27,28,29,30]. Despite this strong evidence, little is known about their impact on histological and molecular mechanisms contributing to NAFLD.
Liver fibrosis is a result of a dysregulated healing response and the primary cellular source of extracellular matrix (ECM) components are the hepatic stellate cells (HSCs), interacting actively with major cytokines [31,32]. Apoptosis of the activated HSCs or reversal to a quiescent state are critical steps in the reversal of fibrosis [31,33]. In the present study, we identified circulating IPA levels to be associated with liver inflammation and fibrosis in obese individuals. Thus, we investigated the association of circulating IPA with liver transcriptomics identifying potential link with pathways regulating extracellular matrix and fibrosis. Thereafter, we used an in vitro cell model of spontaneously immortalized human hepatic stellate cell line (LX-2) to reveal the potential of IPA to ameliorate activation of LX-2 cells and development of fibrosis in human NAFLD.

2. Materials and Methods

2.1. Study Population

The study population consisted of participants from the ongoing Kuopio Obesity Surgery (KOBS) Study [34]. A total of 233 subjects (mean ± SD: 48.3 ± 9.3 years old; body mass index, BMI: 43.1 ± 5.4 kg/m2; 64 males; 80 with T2D) undergoing bariatric surgery were included. Before the surgery, study subjects participated in a one-day visit and were interviewed for disease history and current drug treatments. Fasting blood samples were drawn after 12 h fasting and glucose, insulin and serum lipids were determined as described previously [34]. Liver biopsies were obtained during the bariatric surgery. Written informed consent was obtained from all participants and the study protocol was approved by the Ethics Committee of the Northern Savo Hospital District (54/2005, 104/2008, and 27/2010) and were in accordance with the Helsinki Declaration.

2.2. Liver Histology

Liver biopsies were obtained using Trucut needles (Radiplast AB, Uppsala, Sweden) or as a wedge biopsy during elective gastric bypass operations. Liver biopsies (n = 233) were scored for histology by an experienced pathologist according to the standard criteria, as described previously [35,36]. Steatosis and lobular inflammation were scored on a four-point scale (0,1,2, and 3), ballooning scored on a three-point scale (0,1, and 2) and hepatic fibrosis was scored on a five-point scale (0,1,2,3, and 4) [35]. To test the associations of circulating IPA levels with each of the liver histology (steatosis, lobular inflammation, ballooning, or fibrosis), we categorized each of them into two groups based on the presence (all except 0) or absence (only 0) of the respective stages/grades. Out of 233, 164 subjects could be categorized into distinct histological phenotypes: (1) Normal liver without any steatosis, inflammation, ballooning, or fibrosis (n = 79); (2) Simple steatosis (steatosis > 5%) without evidence of hepatocellular ballooning, inflammation or fibrosis (n = 40); (3) NASH (n = 45) as described previously [37] and summarized in Table 1.

2.3. Measurement of Serum Indole-3-Propionic Acid (IPA)

Fasting serum samples obtained at the baseline (before the surgery) were submitted to non-targeted LC-MS for metabolomics profiling (n = 233). The samples were analyzed with a UHPLC-qTOF-MS system (1290 LC, 6540 qTOF-MS, Agilent Technologies, Waldbronn, Karlsruhe, Germany) as described previously [37]. IPA was identified based on retention time and MS/MS spectral comparison with pure standard compound. To validate the approach of using IPA signal intensity, reported as peak area for our analysis we analyzed fasting serum IPA concentrations measurements in a sub cohort of 121 participants (described in Table S1) using a similar protocol as previously applied [38]. IPA signal intensity and concentration measurements correlated strongly (r = 0.82, p < 0.0001; Figure S1), and thus the IPA signal intensities (peak area) were considered for all further analysis.

2.4. Gene Expression in Liver Using RNA-Sequencing

Total RNA sequencing was performed for 175 liver samples from the current study population. Briefly, RNA sequencing libraries underwent 50-nucleotide long paired-end sequencing on Illumina HiSeq 2500 machine, followed by read alignment, normalization and differential expression analysis considering the technical and confounding factors (namely RIN, uniquely aligned reads %, 3’ bias, age, sex and BMI) as described previously [37,39].

2.5. Validation of Anti-Fibrotic Effects of IPA Using Human Hepatic Stellate Cells (LX-2)

The reagents and chemicals used for the experiments are listed in Supplementary Material (Methods S1). Immortalized human hepatic stellate cells (LX-2) were maintained in DMEM-1% Pen/Strep supplemented with 2% FBS and incubated at 37 °C in a humidified atmosphere supplied with 5% CO2.

2.5.1. Cytotoxicity Assay

First, to assess the effect on LX-2 cells viability and cytotoxicity and select the working doses of IPA, 3-(4,5-dimethylthiazol-2-yl)-2,5-diphenyl tetrazolium bromide (MTT) assay was performed as per manufacturer’s protocol. Briefly, cells in 96-well plates (15,000 cells/well/100 μL) after overnight adhesion were treated with various doses of IPA (1 nM, 10 nM, 100 nM, 1 μM, 10 μM, 100 μM, 1 mM, 2 mM) and corresponding vehicle controls (DMSO). After 24 and 48 h of IPA treatment, media from each well was replaced with 100 μL of MTT (0.2 mg/mL), followed by two hours incubation. This was followed by replacement of MTT with DMSO to extract the formazan crystals. The absorbance was read using Cytation 3 (Biotek Instruments, USA) at 570 nm, reference background at 650 nm and using DMSO as control. After 24 h of treatment, only the highest dose of IPA (2 mM) significantly reduced cell viability. Whereas, after 48 h, both 1 and 2 mM reduced cell viability significantly. Therefore, IPA doses of 1, 10, and 100 μM were selected for the actual experiments, which were the highest non-toxic concentrations, close to the physiological range [19,38] and which have been previously used [15,40,41].

2.5.2. Cell Adhesion Assay

To study the effect of IPA on cell adhesion, LX-2 cells were plated in 6-well plates (150,000 cells/well). Next day, the cells were treated with IPA and corresponding vehicle controls (DMSO). After 24 and 48 h of treatment, the cells were trypsinized and transferred to a 96-well plate. After two hours of adhesion, the media in each well was replaced with 100 µL of MTT (0.2 mg/mL), and the same protocol as mentioned above was followed.

2.5.3. Wound Healing Cell Migration Assay

For cell migration, LX-2 cells were plated in 24-well plate (40,000 cells/well). After 24 h of plating, a scratch was made using the 200 µL pipette tip followed by DPBS wash and treatment with IPA and corresponding vehicle controls for 24 h. The wound was imaged at 0 and 24 h in Zeiss inverted light microscope (Zeiss Axio Vert.A1 and AxioCam MRm, Jena, Germany) at 50× magnification and area of the wounds were quantified using ImageJ software (National Institute of Health, Bethesda, MD, USA, Version 1.51).

2.5.4. Activation of LX-2 Cells by TGF-β1 and IPA Treatment

For the induction of fibrogenesis, we incubated the LX-2 with a potent cytokine TGF-β1 as studied previously [42]. Briefly, the cells were plated in 24-well plate (40,000 cells/well) and were treated next day with TGF-β1 (5 ng/mL) in serum free media for 24 and 48 h and 4 nM HCL with 0.1% BSA was used as vehicle control for TGF-β1. The treatment to the cells with IPA (100 µM) for 24 h was performed either as a co-treatment with TGF-β1 induction or as a recovery after 24 h of TGF-β1 induction without media replacement.

2.5.5. Quantitative RT-PCR

The activated and IPA treated cells along with the controls were lysed using RLT supplemented with 1% β-mercaptoethanol and total RNA was extracted according to the manufacturer’s instructions. RNA was then transcribed into complementary DNA (cDNA) and quantified for gene expression levels of α-smooth muscle actin (αSMA), collagen type 1 (COL1A2), matrix metalloproteinase-2 (MMP2), tissue inhibitor of metalloproteinases 1 (TIMP1) and integrin subunit alpha 3 (ITGA3) using specific forward and reverse primers listed in Table S2. Human 60S acidic ribosomal protein P0 (RPLP0) mRNA levels served as an internal control. The QuantStudio (QuantStudio 6 pro Real-Time PCR System, Thermo Fisher, Landsmeer, The Netherland) comparative CT (ΔΔCT) cycling parameters and 2−∆∆Ct method was used to calculate relative fold gene expression.

2.6. Statistical Analysis

IPA signal intensities were inverse-rank normalized prior to the analysis. The associations of fasting serum IPA levels between stages/grades for each liver histology (steatosis, lobular inflammation, ballooning, fibrosis) were tested using general linear model (univariate). Certain models were further adjusted for age, gender, and BMI. All the analyses were performed using SPSS version 27 program (IBM Inc., Armonk, NY, USA) and two-sided p value of <0.05 was considered statistically significant.
To evaluate associations between global gene expression and clinical features, edgeR’s negative binomial generalized linear model with quasi-likelihood F test, controlling for technical and biological factors influencing gene expression identified with PCA was used. For the differential gene expression model, IPA signal intensities were used, as explained in 2.3. The following covariates were included in the analysis: uniquely aligned reads %, 3’ bias, and RNA integrity number (RIN), age, gender, and BMI. To reveal the functional relationship among key genes (p value < 0.01), two different approaches were employed. First, Ingenuity Pathway Analysis’ core analysis was used to find the top canonical pathways. Next, we used g:Profiler to extract the gene ontology (GO) and Reactome terms and assembled all the significantly enriched terms into functionally interpretable clusters using Enrichment Map (v3.1.2) plugin in Cytoscape (v3.7.1) [43].
For LX-2 experiments, data were obtained at least from three independent experiments done in triplicate and expressed as mean ± SD. Samples were tested for normality using D’Agostino and Pearson omnibus normality test. For each treatment group, corresponding controls were also included and analyzed, however for the simplicity of representation single control was used. One-way ANOVA followed by Bonferroni’s post hoc test was used for statistical comparisons using GraphPad Prism v.5 (GraphPad Software Inc., version 5, San Diego, CA, USA).

3. Results

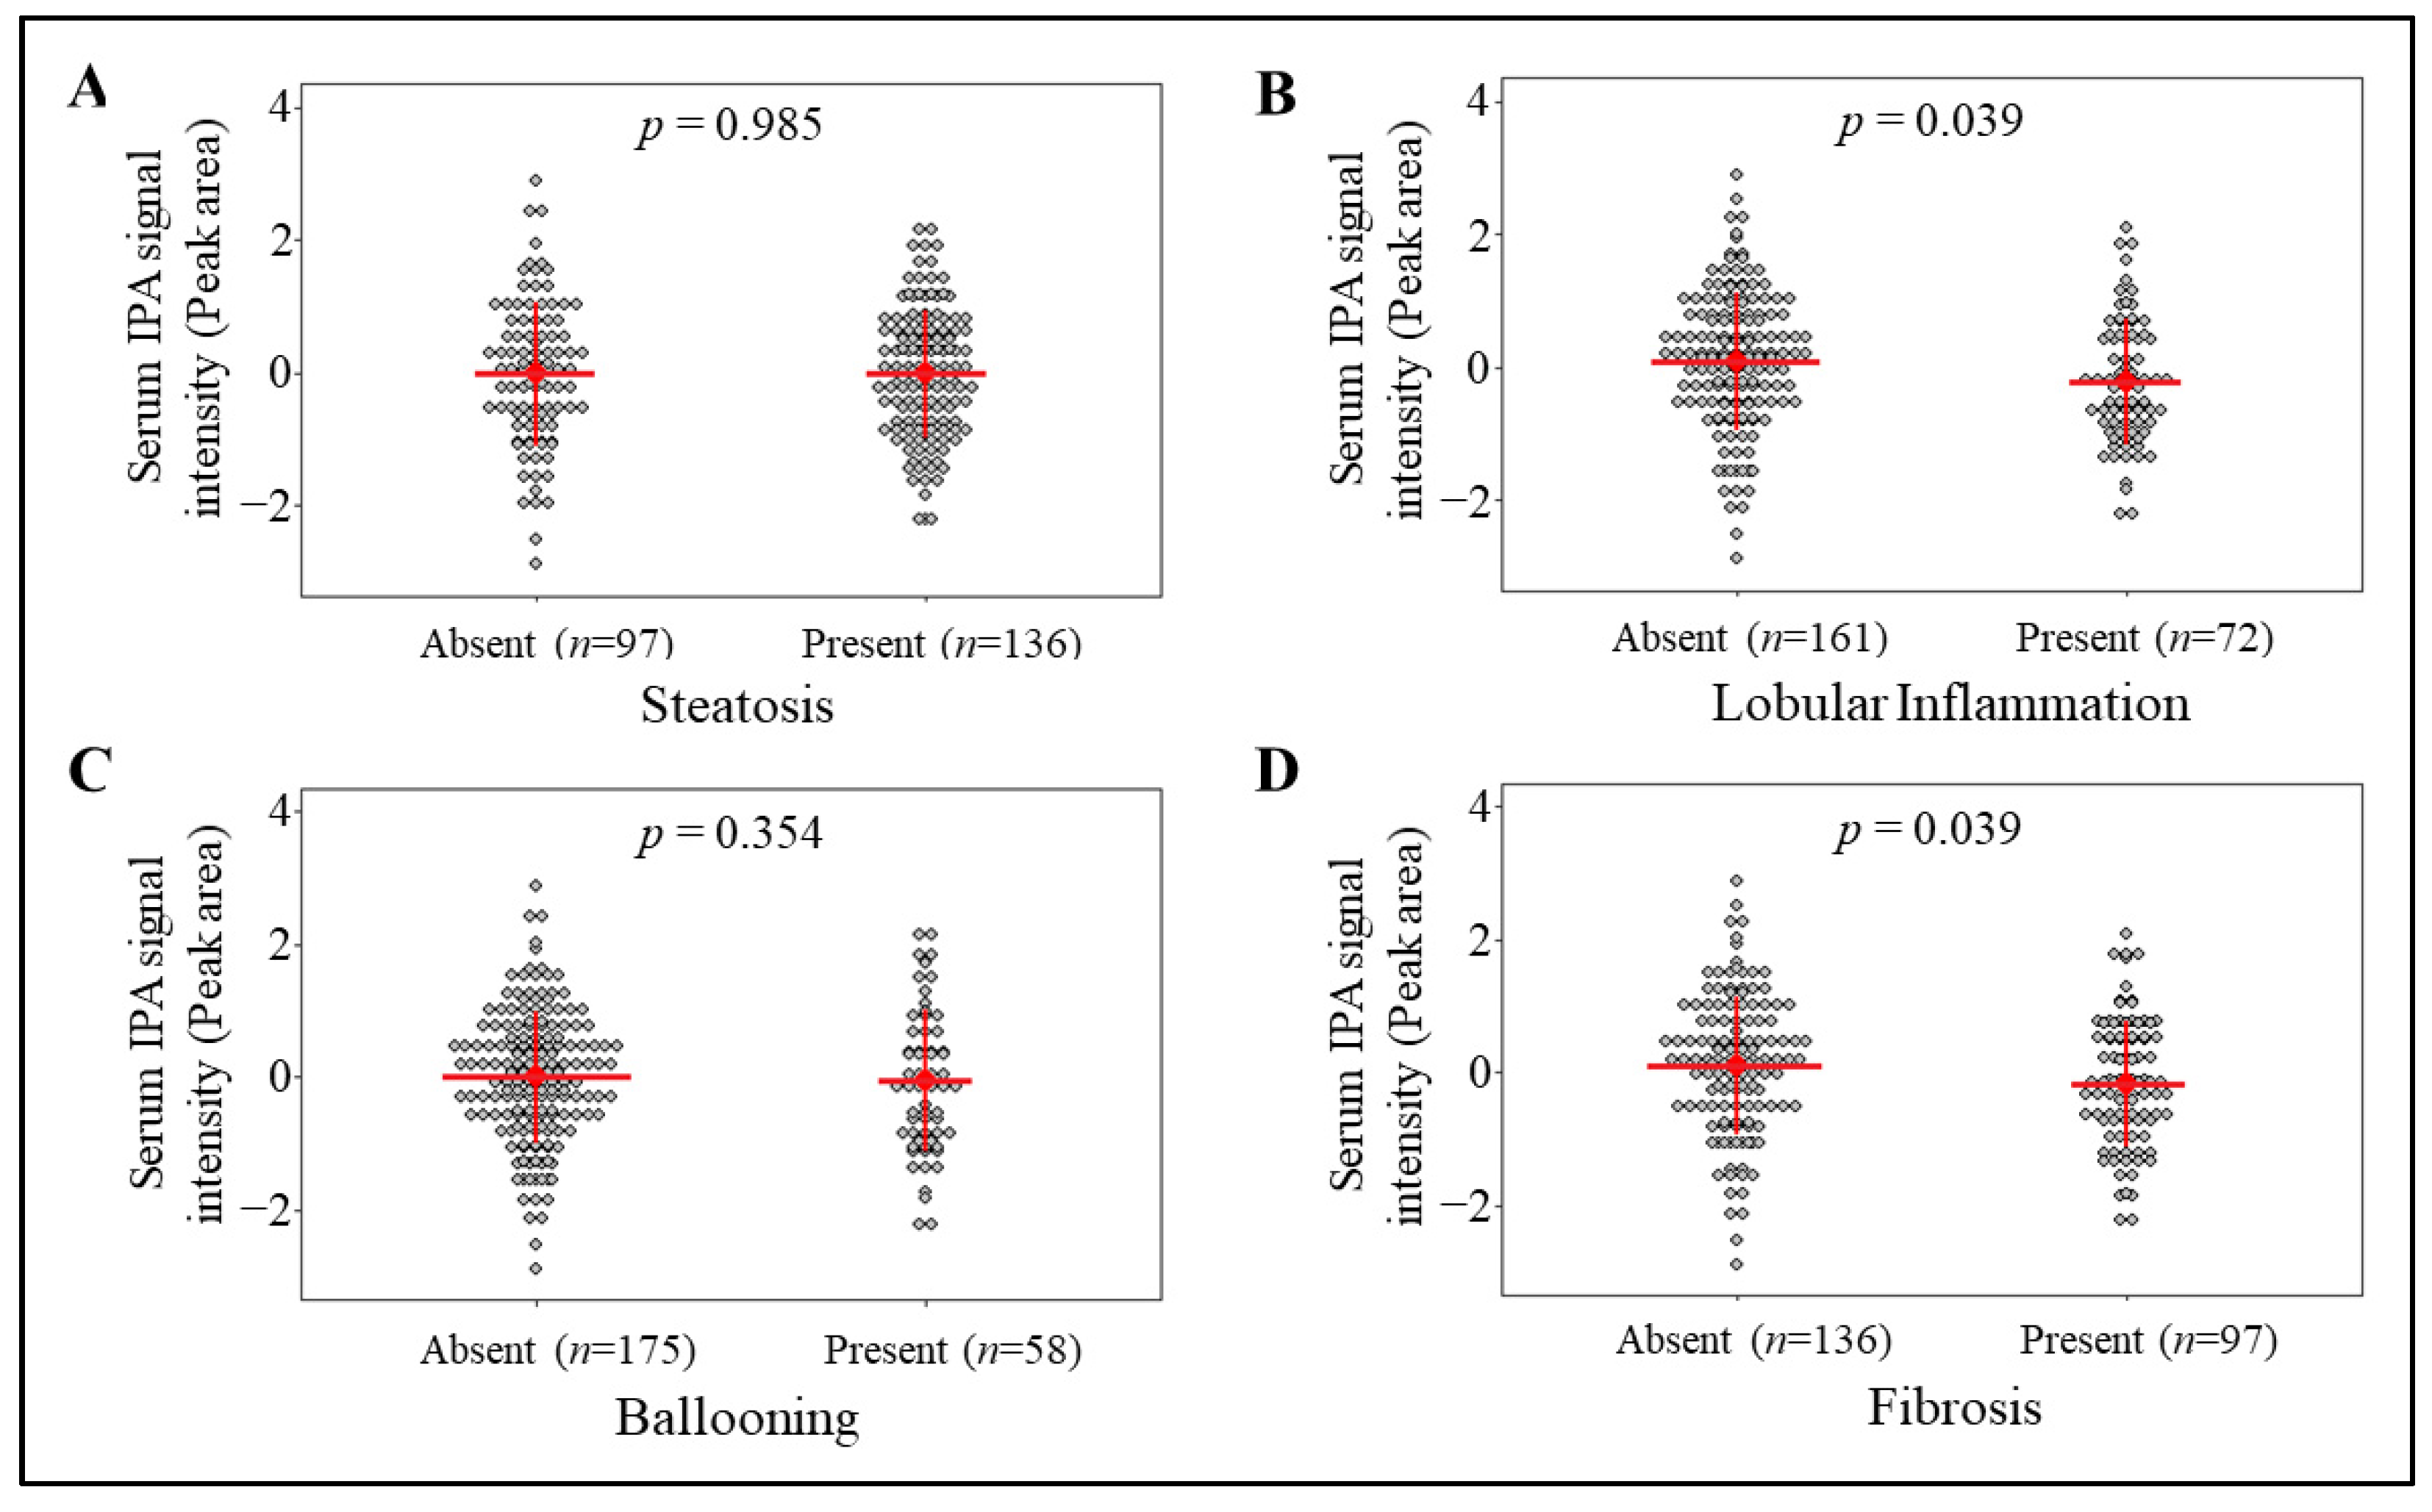
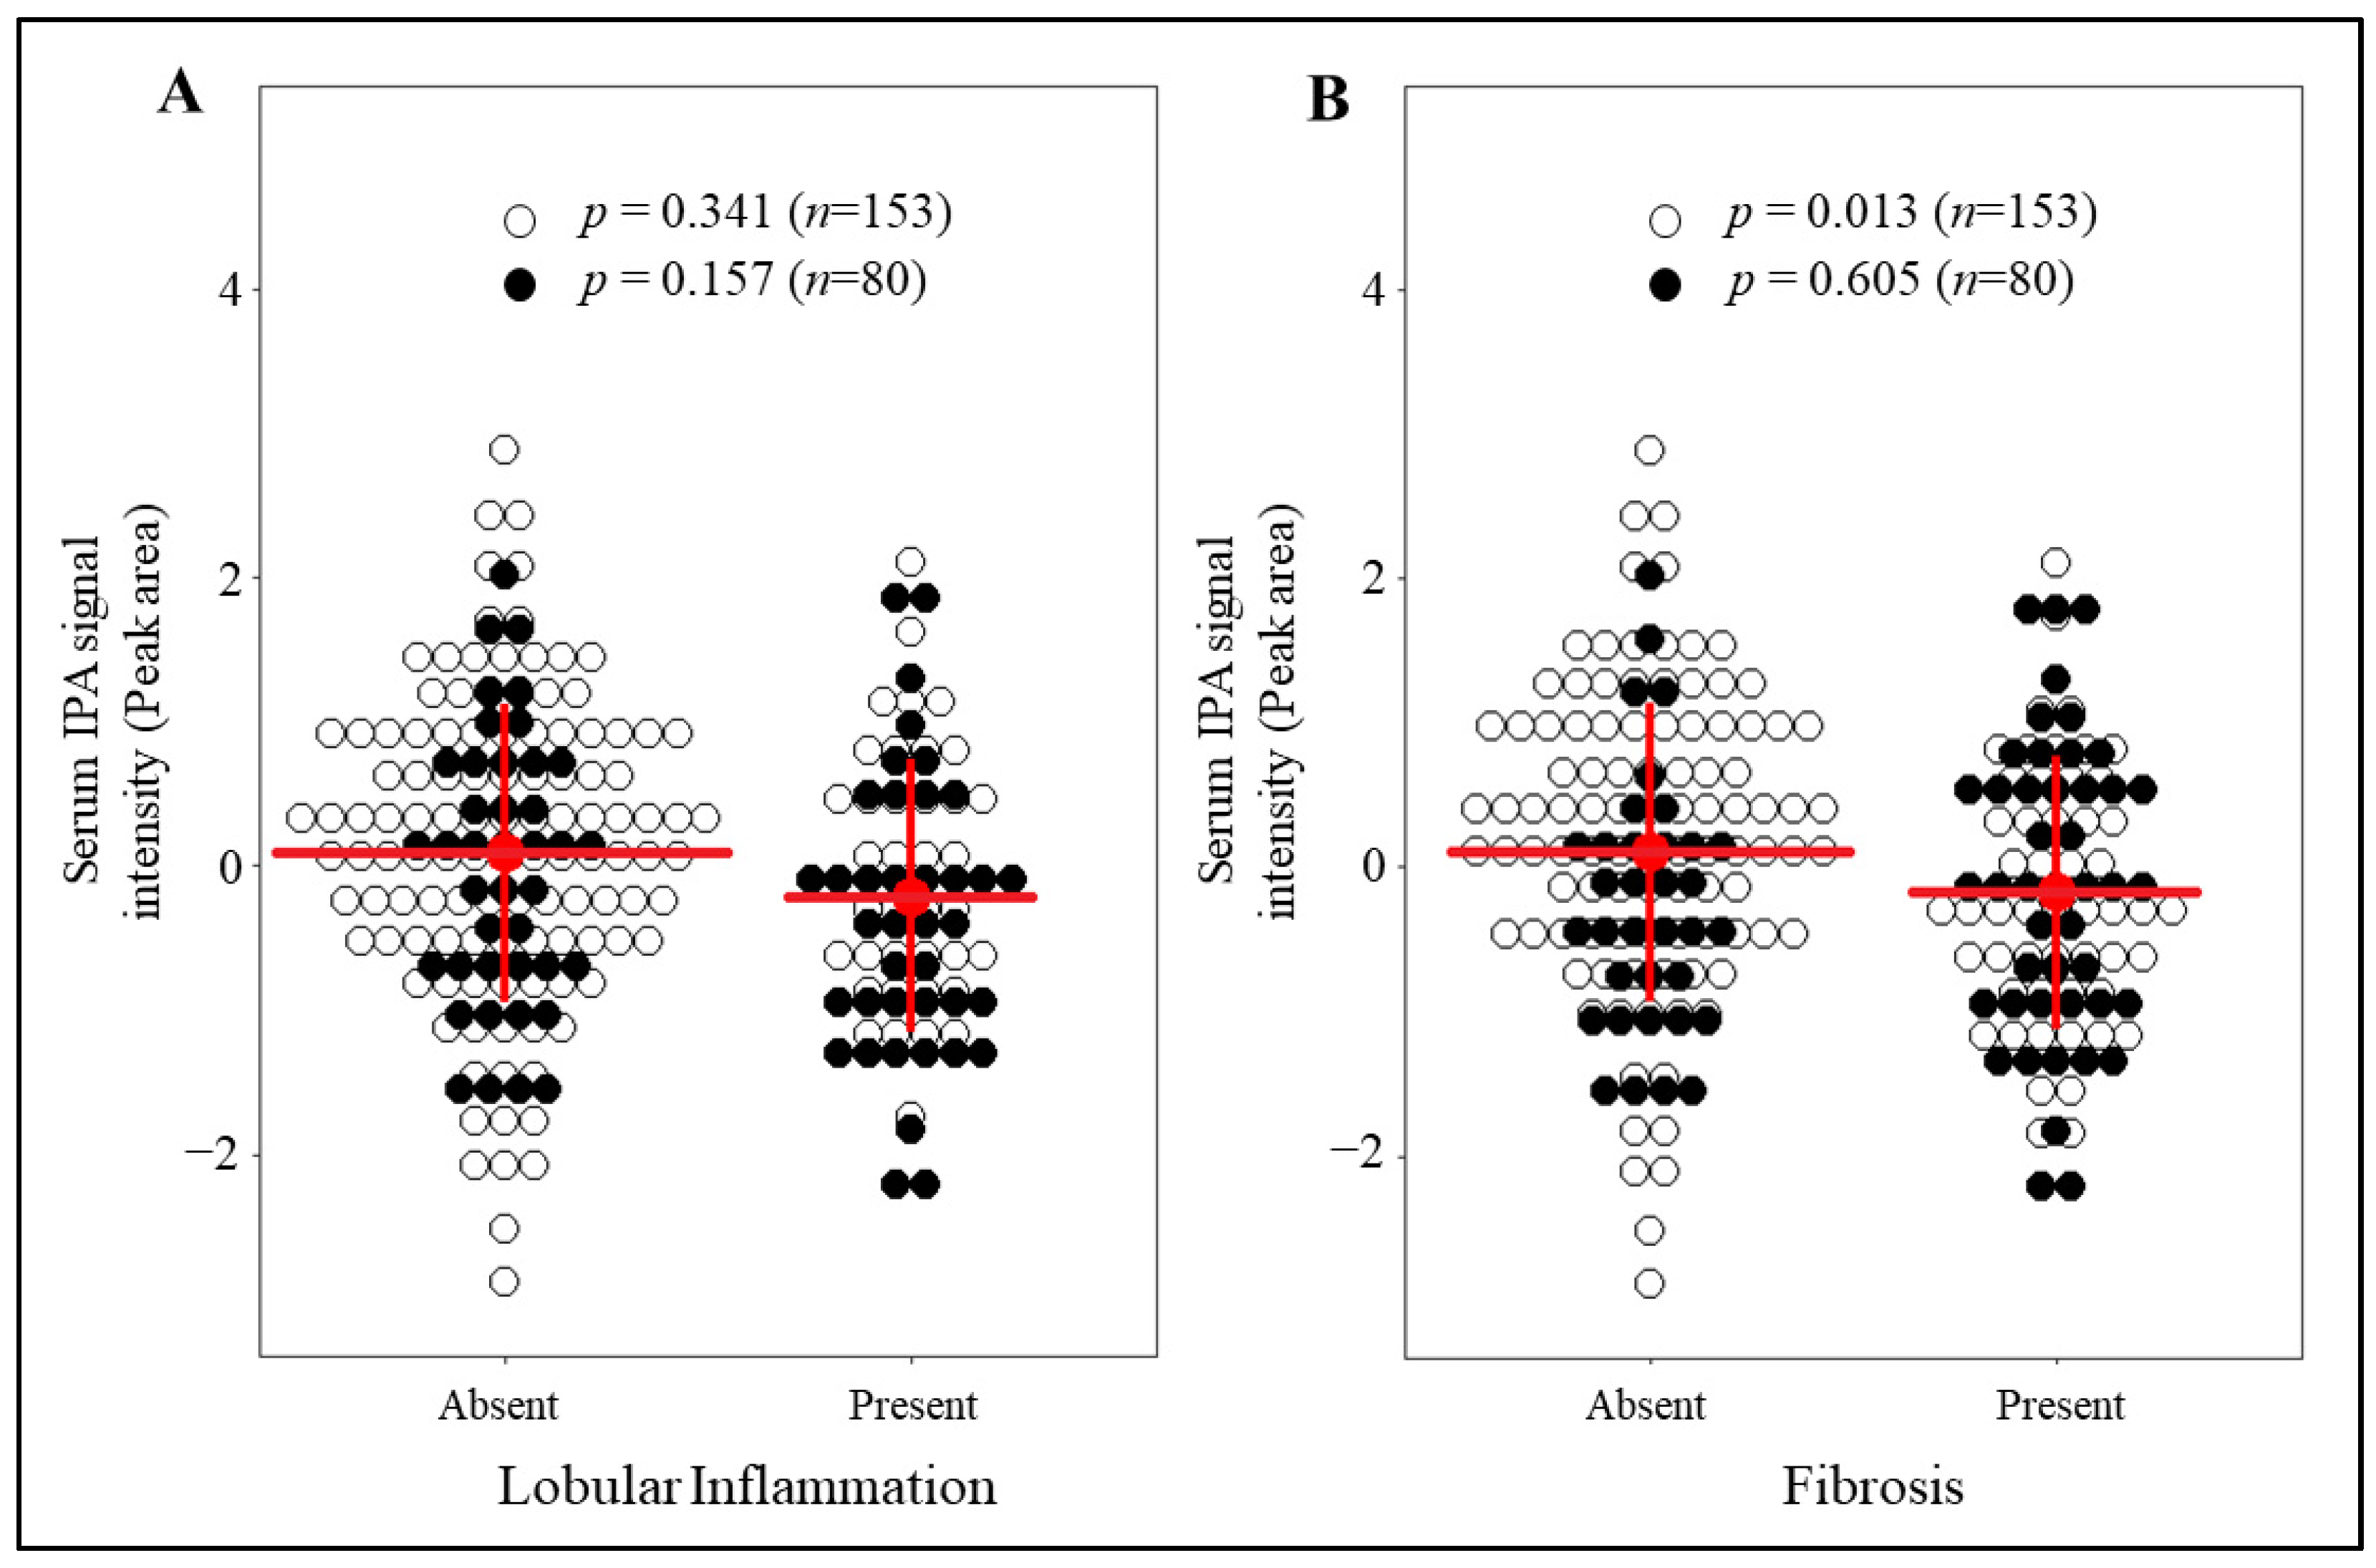
3.1. Circulating IPA Levels Associate with the Lobular Inflammation and Fibrosis

The main characteristics of the KOBS study population divided in those with normal liver, simple steatosis (SS) and NASH liver phenotypes are shown in Table 1 (n = 164). IPA levels were not significantly different among the three liver phenotypes, as published in our previous publication in this cohort [37].
The limitation of using these categories (Table 1) is that the association between IPA and specific histological findings defining NASH may be lost. Hence, to study associations of IPA specifically with presence or absence of steatosis, lobular inflammation, ballooning, and fibrosis was performed. In this analysis, all the participants with characterized liver histology (n = 233, Table S1) were included to assess the association of IPA signal intensities with detailed liver histology, based on presence (all except 0) or absence (stage/grade 0) of each specific liver histology, we observed significant inverse associations of IPA levels with lobular inflammation (p = 0.039) and fibrosis (p = 0.039) but not with steatosis (p = 0.985) or ballooning (p = 0.354) (Figure 1). When the model was adjusted for age, gender, and BMI, the association of IPA levels remained borderline significant for lobular inflammation (p = 0.051) and fibrosis (p = 0.076).

3.2. IPA Levels Are Markedly Reduced in Individuals with Fibrosis and without T2D

To more accurately investigate the relationship of circulating IPA and liver histology considering the already known interaction of IPA with T2D [8,13,38], a more homogeneous sub-population of individuals without T2D was selected from the current cohort (n = 153). In nondiabetic individuals, IPA levels were lower for those with fibrosis compared to those without fibrosis (p = 0.013 unadjusted model; p = 0.019 model adjusted for age, gender, and BMI; Figure 2A) while the presence of lobular inflammation (Figure 2B), steatosis and ballooning (Figure S2) did not associate with IPA. In addition, when the associations of IPA levels across all the stages/grades within each of the liver histology (Figure S3) were analyzed, IPA levels were found to be significantly associated with fibrosis (p = 0.030 unadjusted model; p = 0.044 model adjusted for age, gender, and BMI) for individuals without T2D. The levels of IPA were not associated with fibrosis in individuals with T2D as shown in Figure 2 and Figure S3.

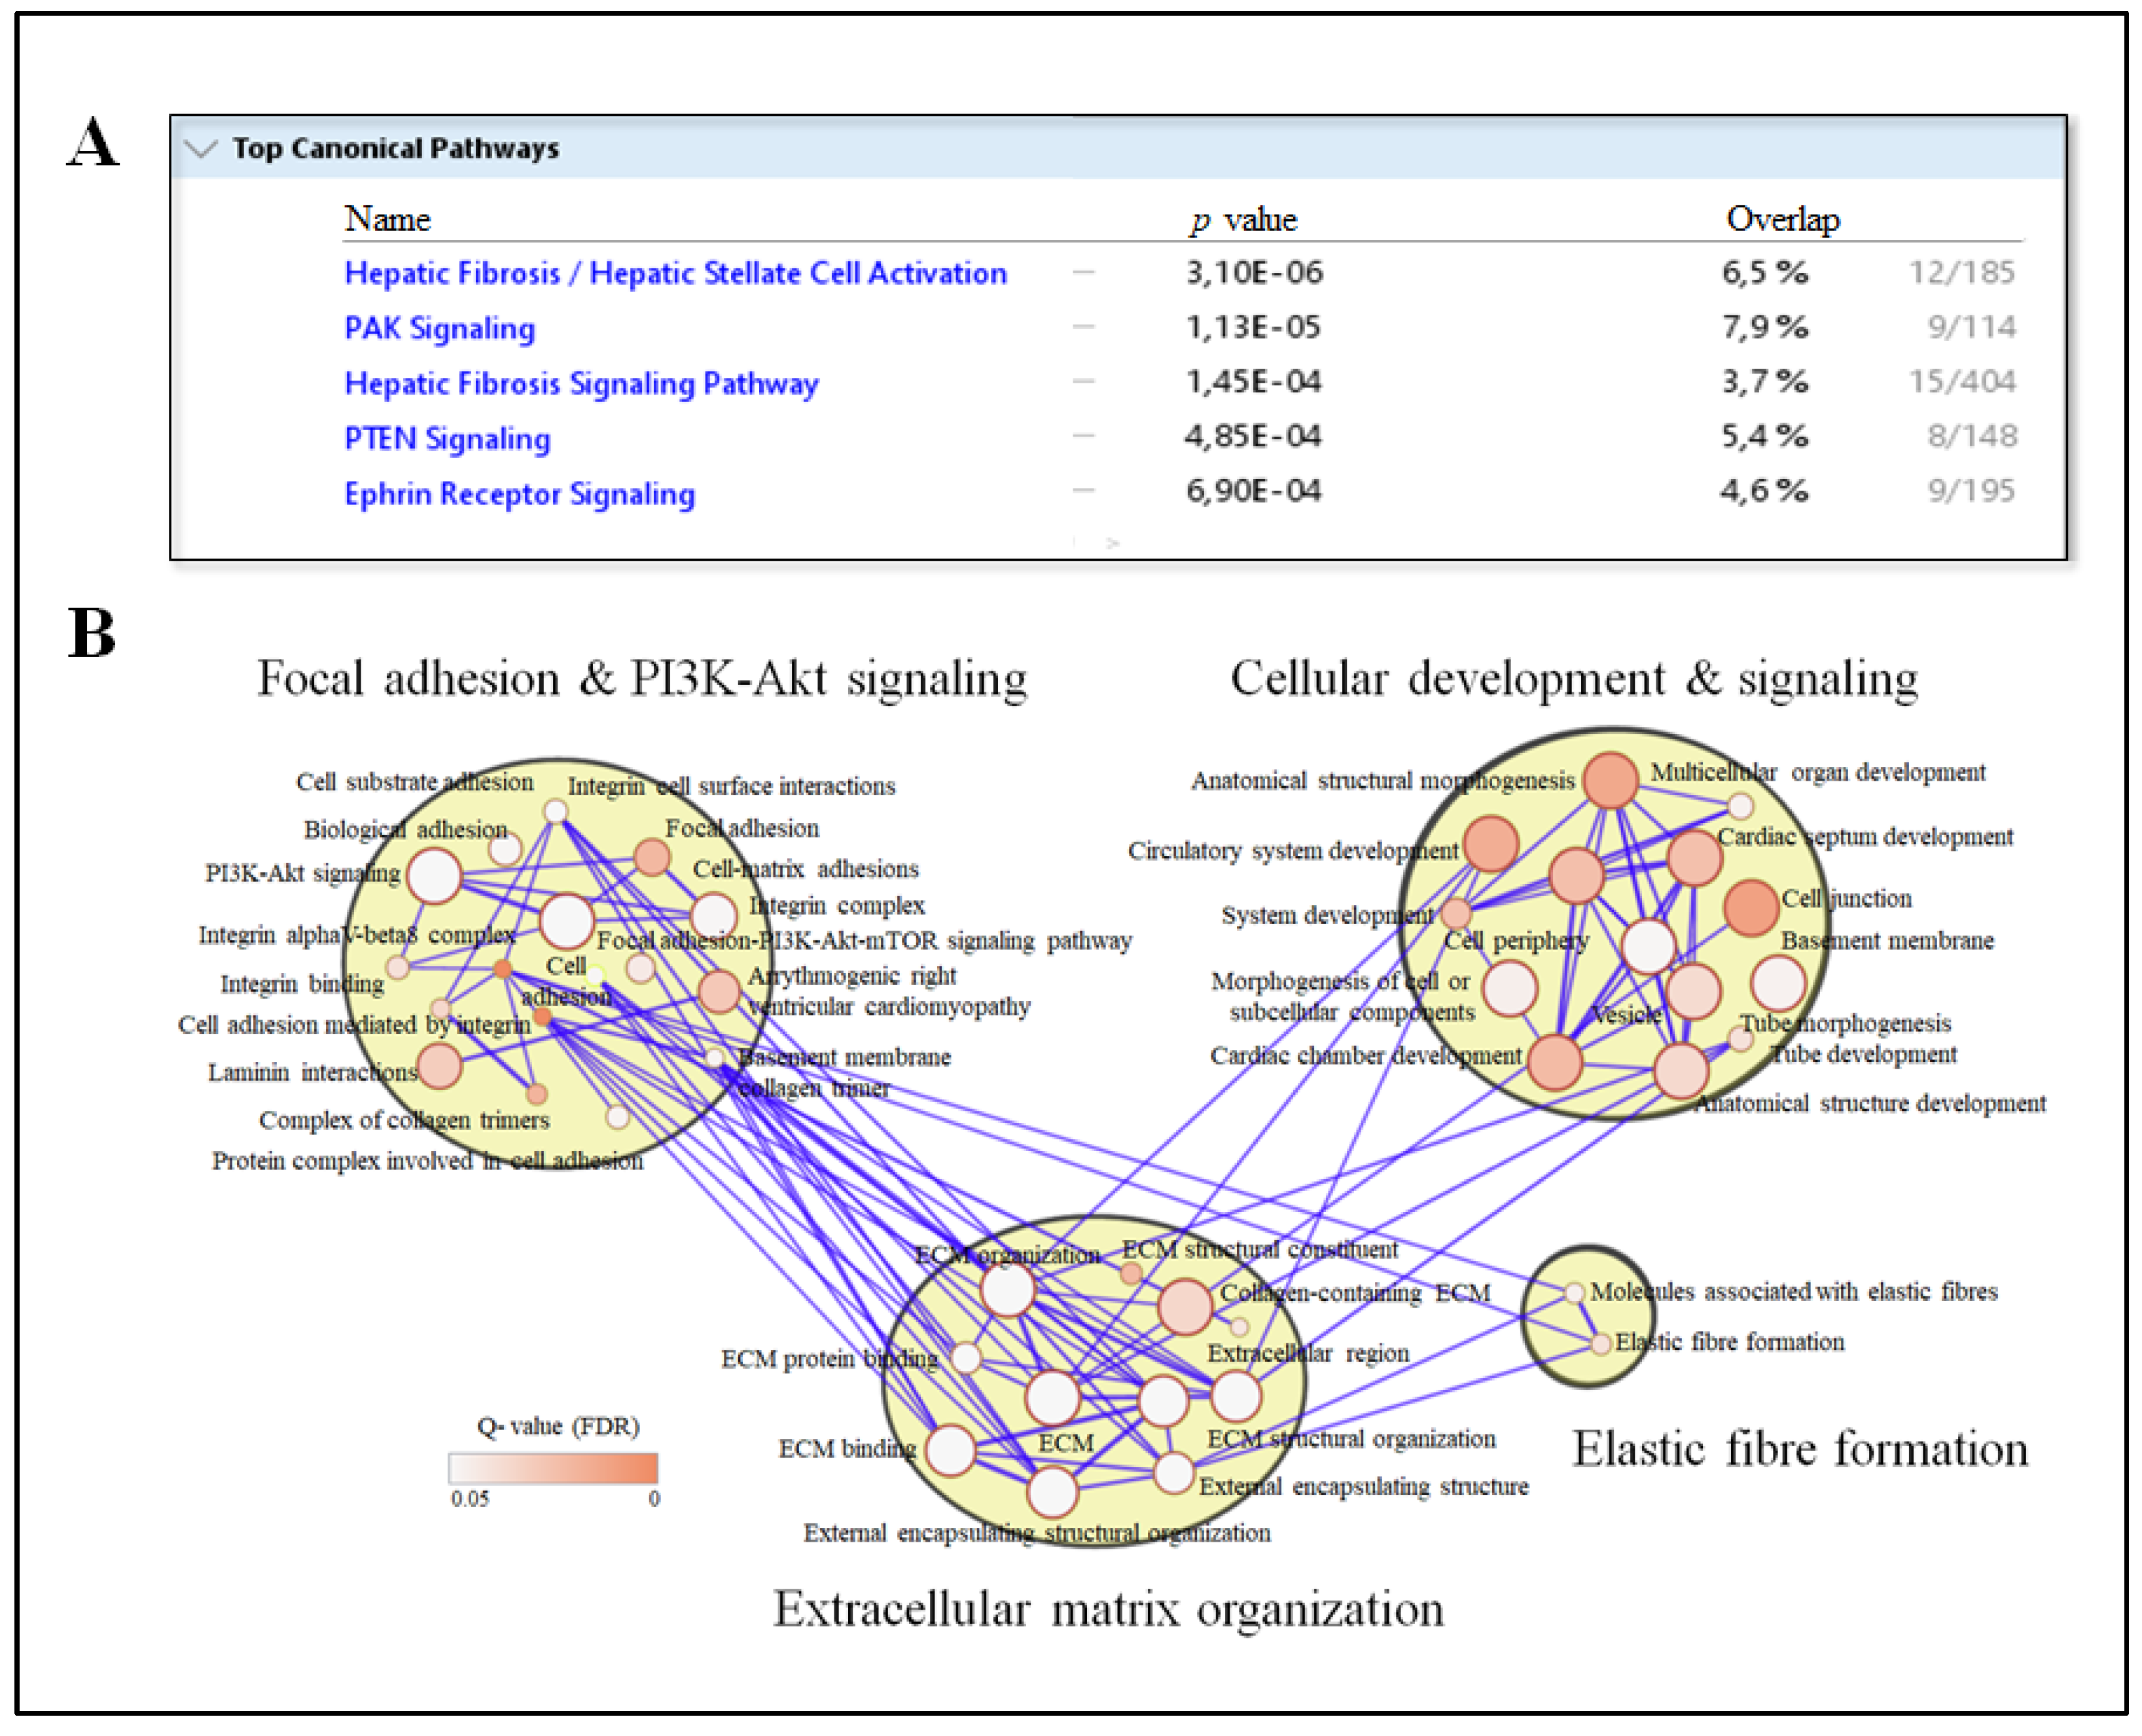
3.3. Circulating IPA Associates with Liver Transcripts Enriched for Pathways Related to Fibrosis

To identify molecular mechanisms explaining the association between IPA and liver fibrosis, we investigated the associations of circulating IPA levels with the global liver transcriptomics. Analysis of the global liver gene expression identified 278 transcripts with p value < 0.01 that associated with the IPA levels (gene counts adjusted for technical factors, age, gender, and BMI). The top canonical pathway enriched using the Ingenuity Pathway Analysis was hepatic fibrosis/hepatic stellate cell activation (Figure 3A). In addition, g:Profiler based pathway enrichment for the corresponding transcripts revealed enrichment of the following pathways: extracellular matrix organization, focal adhesion and PI3K-Akt signaling, elastic fibers formation and cellular development and signaling (Figure 3B). The genes significantly associated with IPA levels are tabulated in Table S3. The top three genes associated (FDR p < 0.1) with IPA were SLC11A1 (solute carrier family 11 member 1), MROH6 (maestro heat-like repeat-containing protein family member 6) and MAPKAPK3 (mitogen-activated protein kinase-activated protein kinase 3). This also included markers of hepatic stellate cell activation, such as ITGA3 (p = 0.000415).

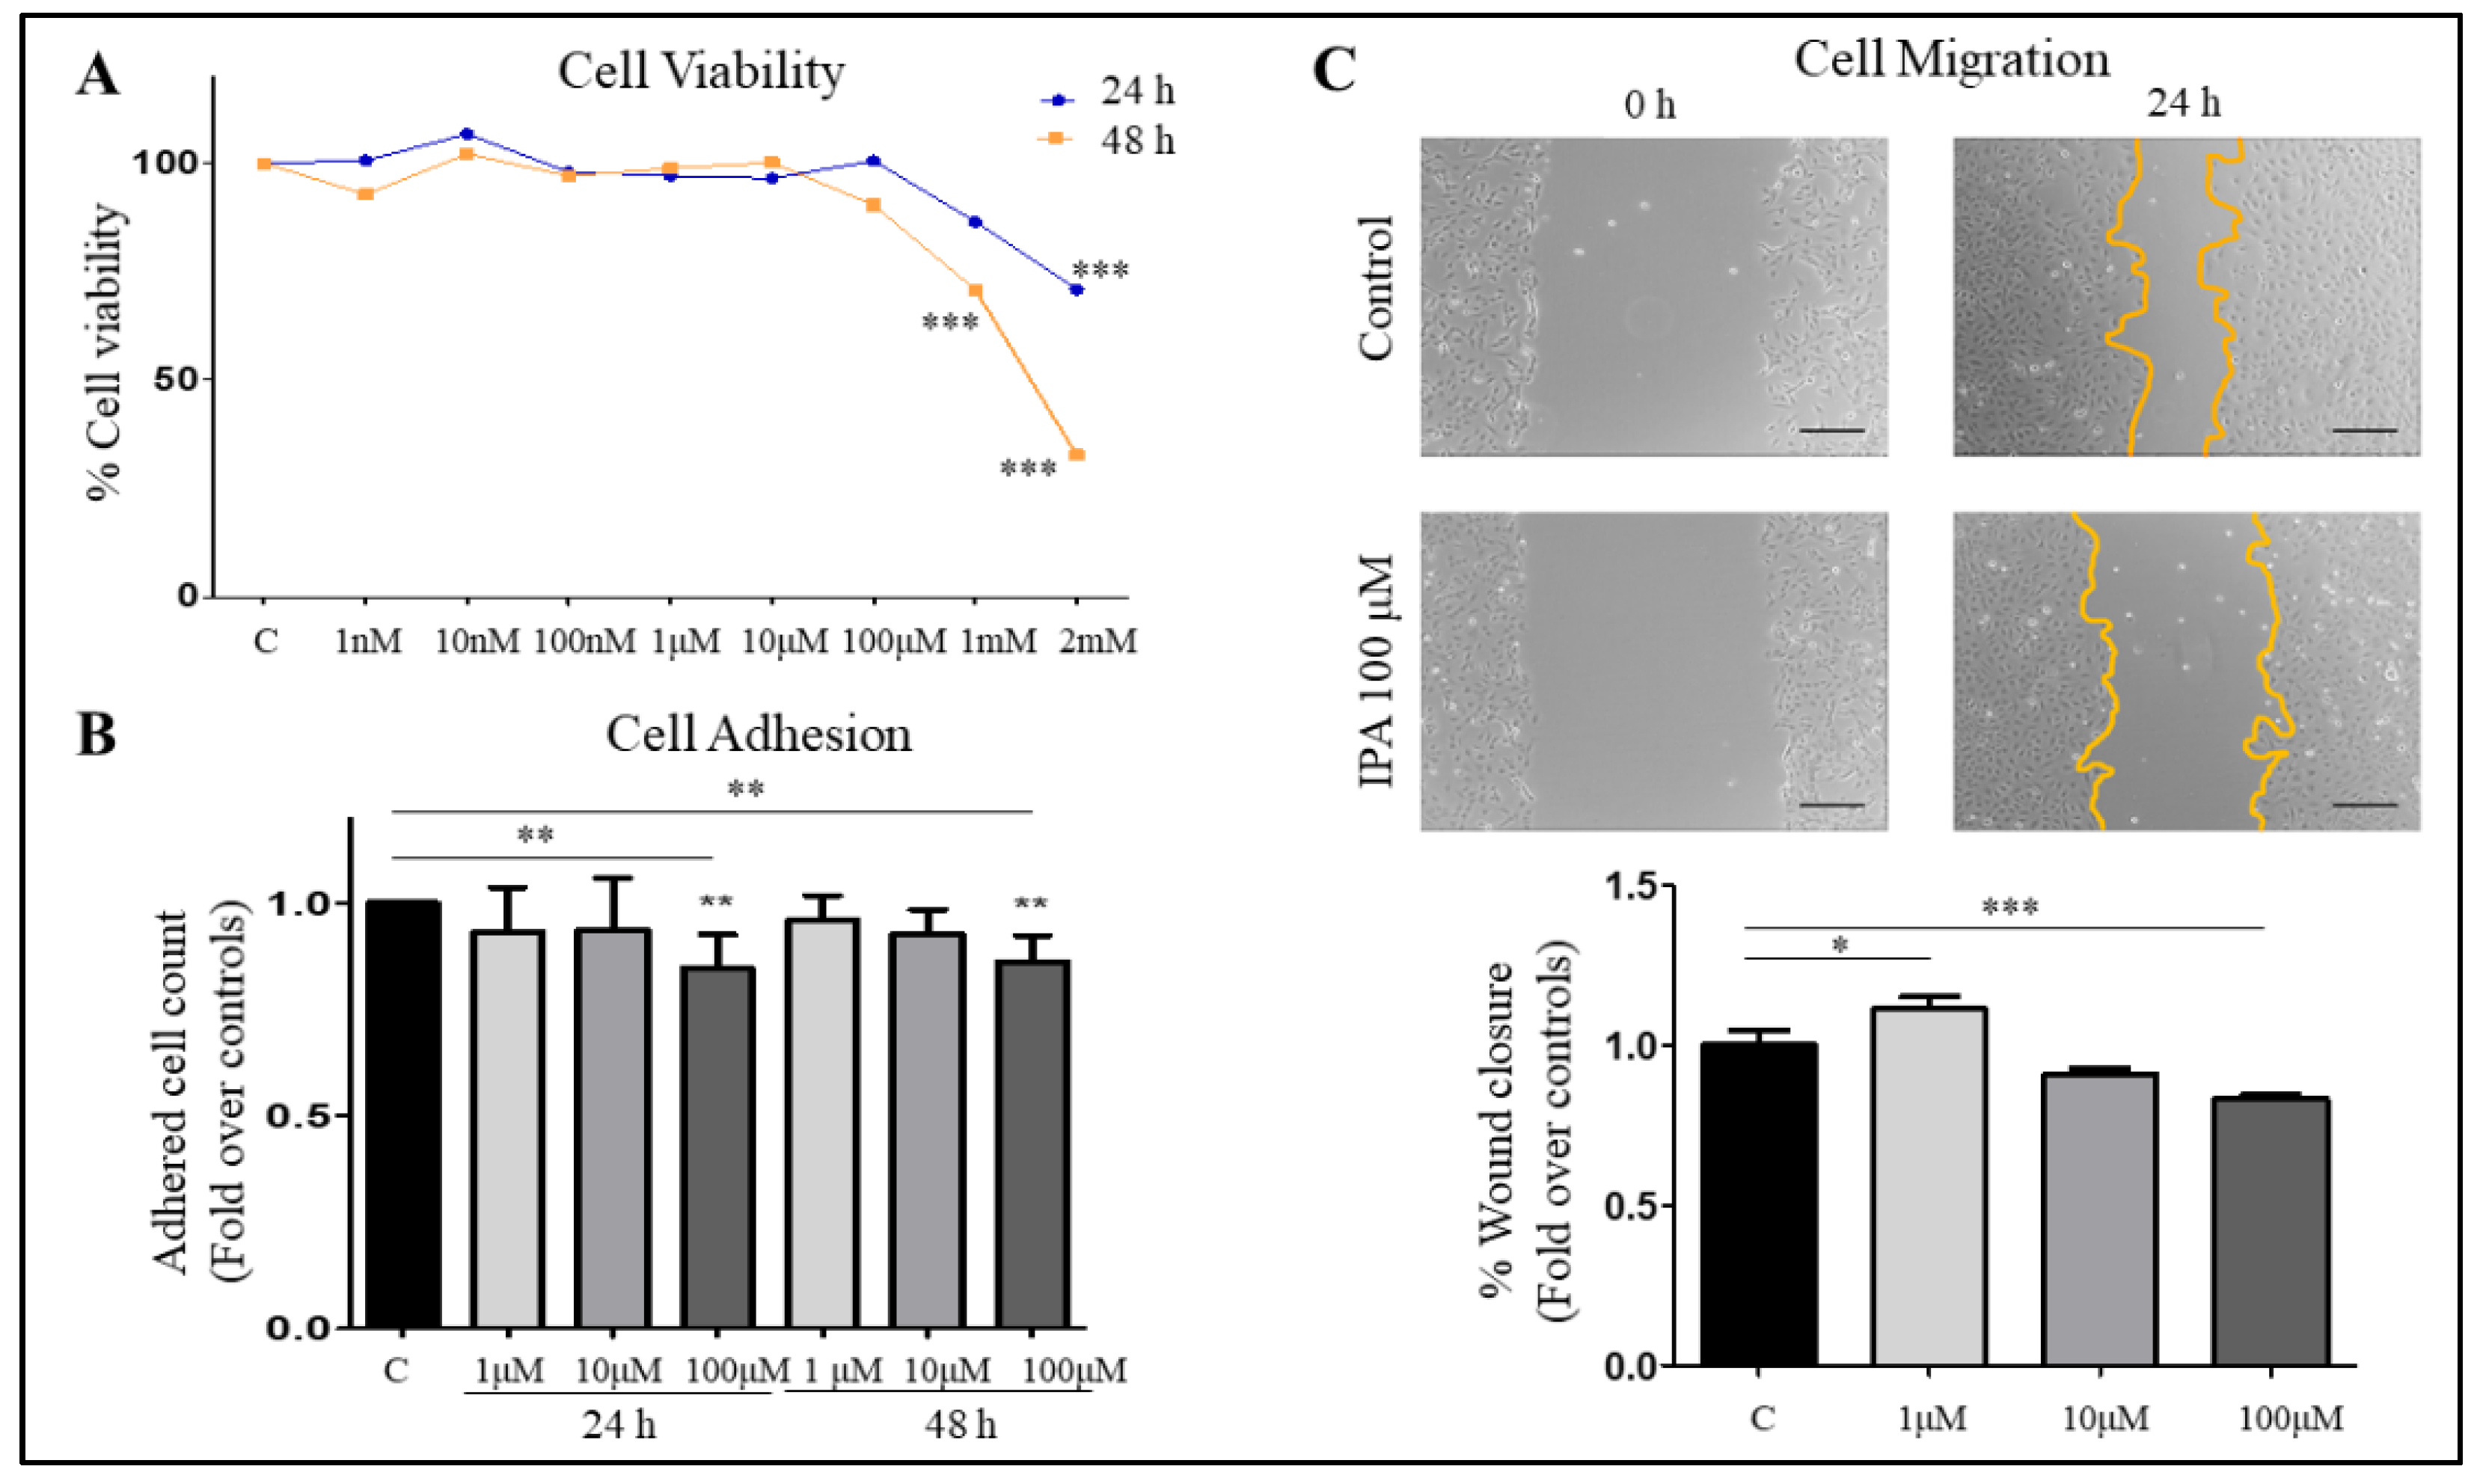
3.4. IPA Reduces Cell Adhesion and Migration of LX-2 Cells

Next, we established a model to investigate the potential role of IPA in the regulation of stellate cells by treating LX-2 cells with varying concentrations of IPA and demonstrating that as high as 100 µM of IPA exhibits no change in cell viability after 24 and 48 h of treatment (Figure 4A). We further checked the effect of IPA on cell adhesion and cell migration, known features of HSCs activation [44], 100 μM IPA treatment significantly reduced the cell adhesion after 24 and 48 h of pre-treatment (Figure 4B). The treatment with 100 μM of IPA also significantly reduced the cell migration in LX-2 cells (Figure 4C).

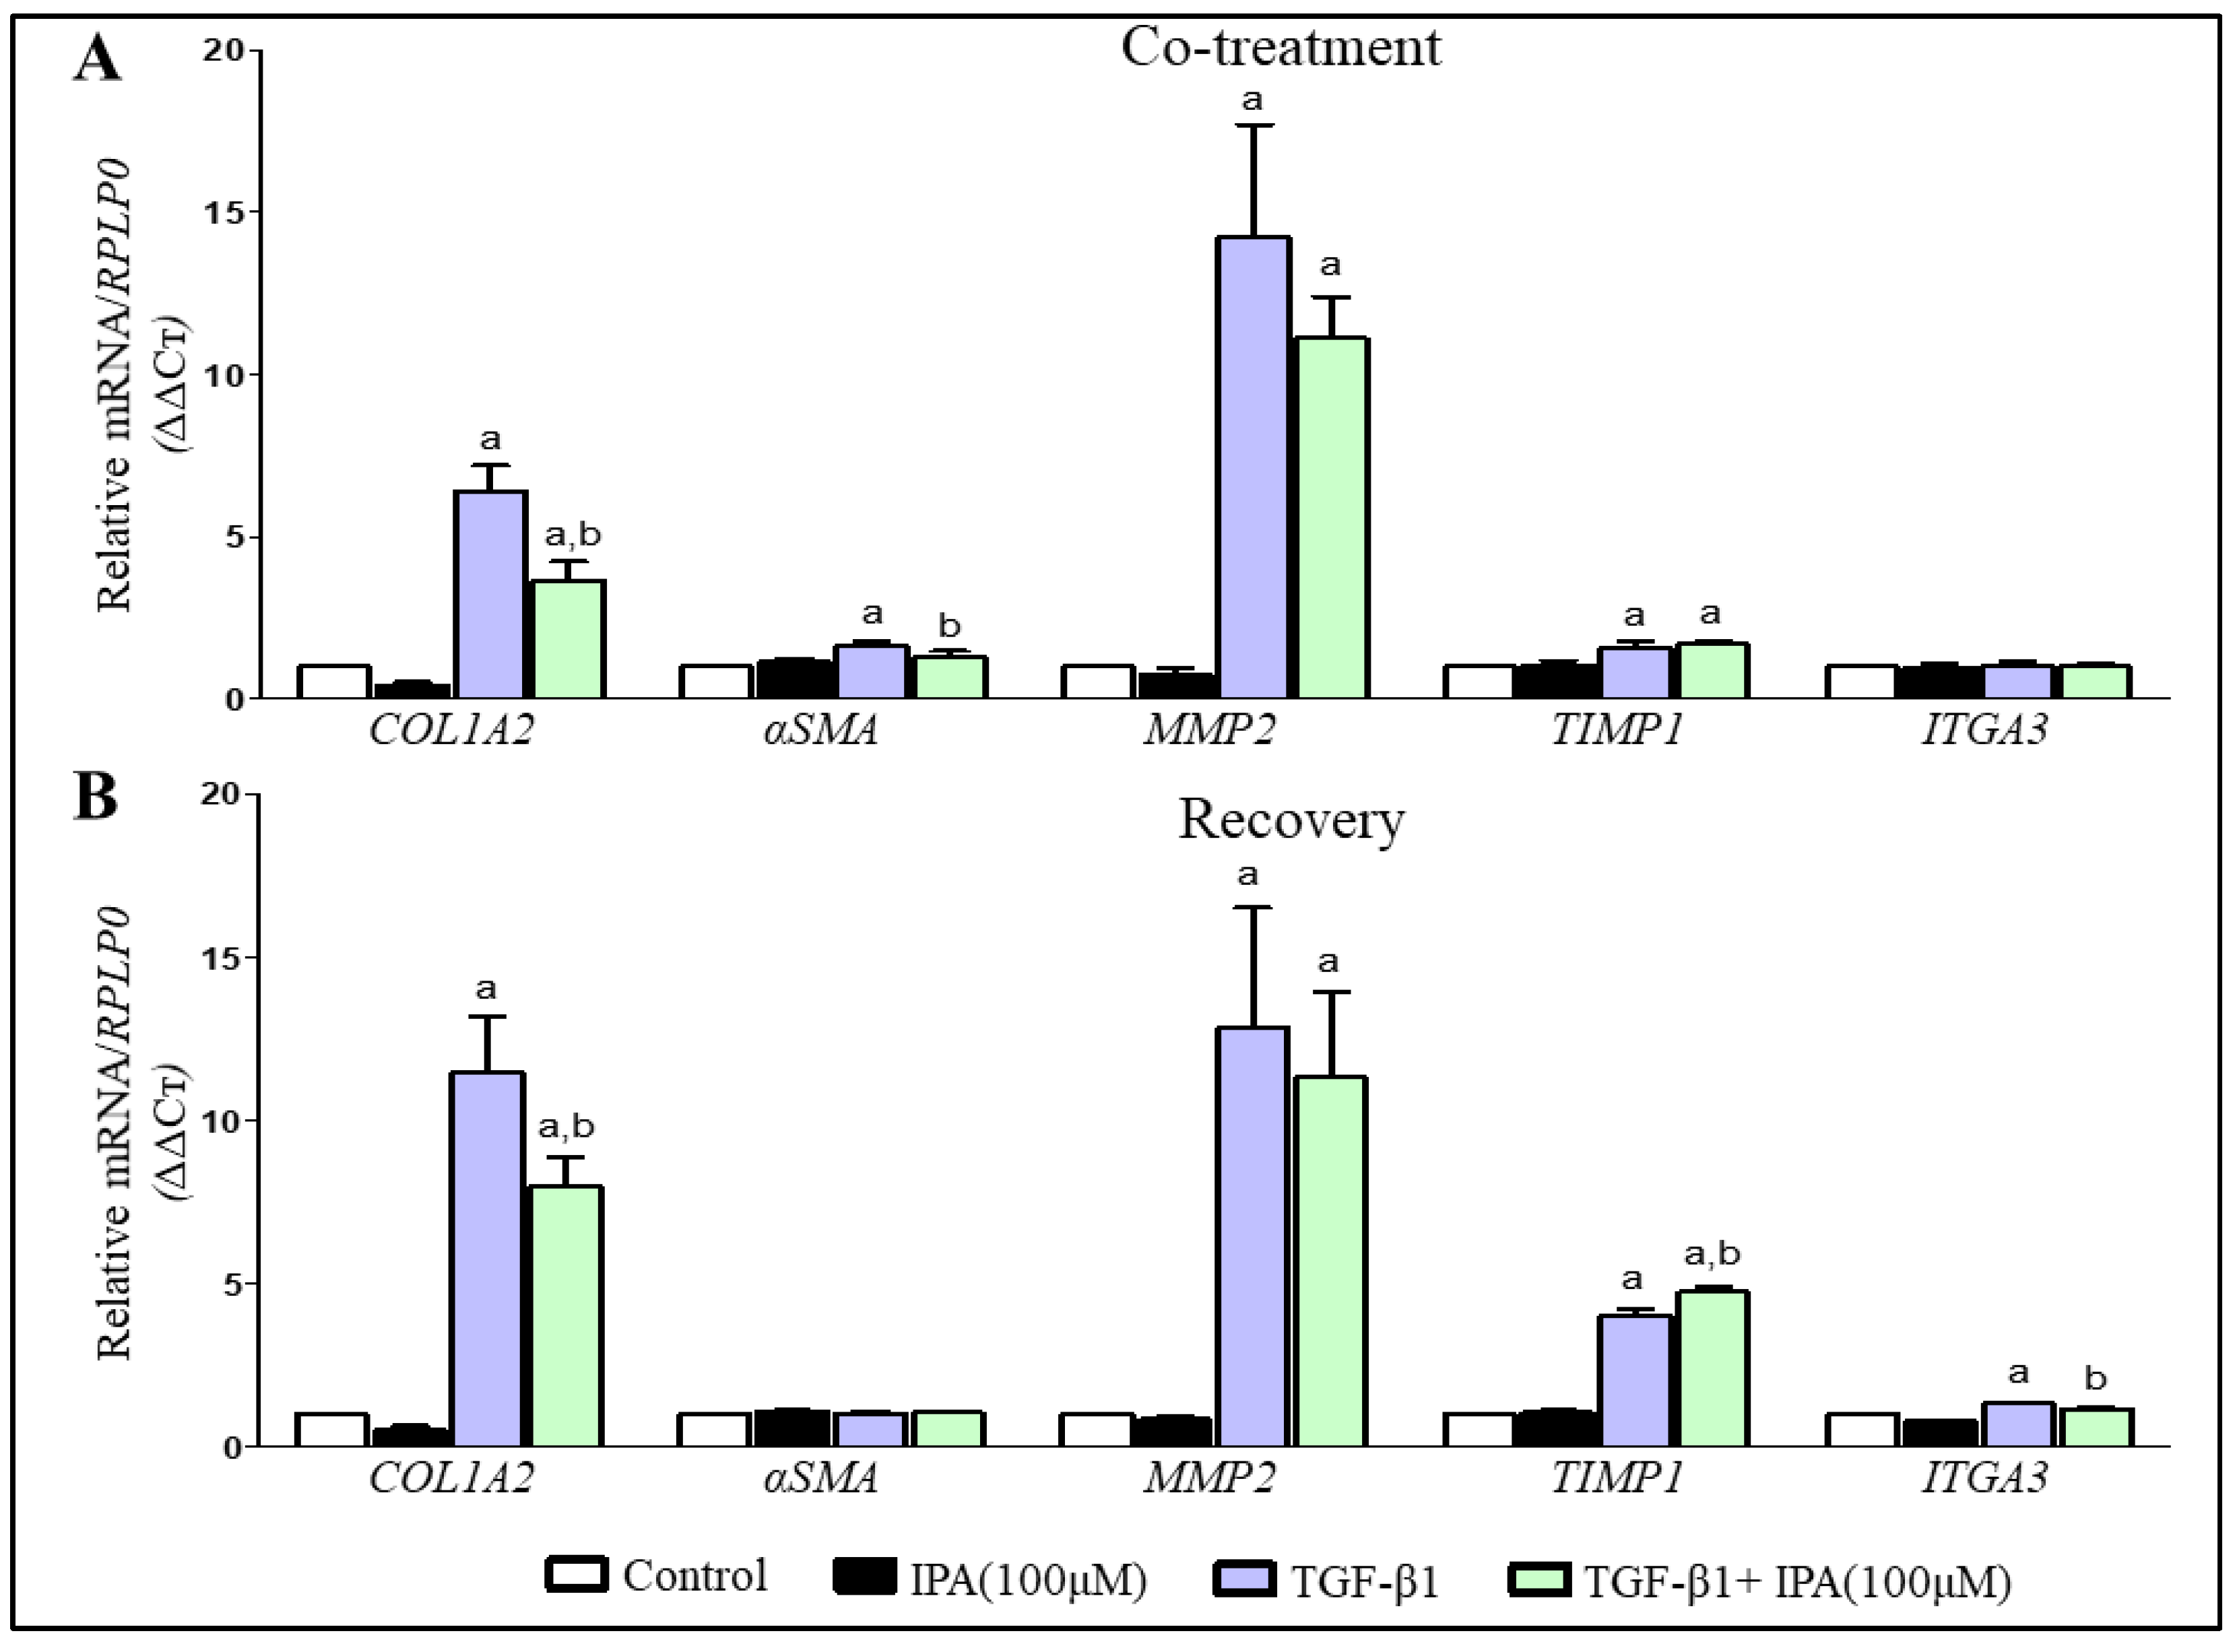
3.5. IPA Subsides Fibrogenesis in Activated LX-2 Cells

The effect of IPA on classical markers of HSCs activation was studied using LX-2 cells with or without TGF-β1 (5 ng/mL) treatment for 24 or 48 h. In LX-2 cells treated only with IPA (100 µM), there was no change in the mRNA gene expression of classical markers of HSCs activation (Figure 5). As expected, treatment with TGF-β1 led to an increase in mRNA gene expression of COL1A2, MMP2, and TIMP1 [45]. However, when the cells were treated with IPA (100 µM) as co-treatment with TGF-β1, we demonstrated significantly lower mRNA gene expression of COL1A2 and αSMA as compared to TGF-β1 (Figure 5A). When IPA (100 µM) was added as a recovery treatment after 24 h of TGF-β1 treatment, there was a significant decrease of mRNA gene expression of COL1A2 and ITGA3 and an increased expression of TIMP1 as compared to TGF-β1 (Figure 5B).

4. Discussion and Conclusions

In the present study, we observed that liver inflammation and fibrosis were associated with circulating levels of gut-derived metabolite IPA, especially in individuals without T2D (Figure 1 and Figure 2). Circulating levels of IPA were associated with mRNA levels of genes enriched for pathways involve in hepatic stellate cell activation and altered extracellular signaling (Figure 3), suggesting IPA can ameliorate activation of stellate cells in human liver and thus reduce fibrosis. To support this, we observed that IPA treatment is able to rescue and reduce activation of LX-2 cells stimulated by TGF-β1. Altogether, this evidence suggests that IPA is a promising candidate for further studies aimed at identifying new treatments for reversal or management of hepatic fibrogenesis.
The important clinical finding that started these analyses was the observation that liver inflammation and fibrosis, but not steatosis, were associated with circulating levels of IPA in obese individuals (Figure 1). More specifically, in obese individuals undergoing bariatric surgery, we found fasting serum IPA levels to be higher in those without fibrosis compared to those with fibrosis, a relationship that was even more evident in individuals without T2D (Figure 2). Existing evidence associate indoles and their derivatives with the improvement of gut metabolism, liver health, and liver integrity [46]. For example, circulating indole levels were found to be inversely correlated with hepatic fat content and BMI in human subjects [47]. Lower circulating IPA levels have also been found in individuals with obesity, chronic kidney diseases, T2D, atherosclerosis, and other metabolic diseases, which to an extent, is proposed to be mediated by dietary modifications affecting microbiota production [7,8,9,10,11,12,48]. Thus, our results strengthen the evidence that IPA links with development of liver diseases, as earlier reported for other metabolites such as choline, betaine and secondary bile acids [27,30,49]. Regarding the strong links between T2D and liver fibrosis [50] it is important to note that IPA levels have been associated with T2D and glucose homeostasis in rodents and humans [8,13,16,19]. Therefore, our observation that IPA associates with fibrosis in nondiabetic individuals (Figure 2) is an important finding highlighting a link between IPA and liver fibrosis independent of T2D.
Consistent with the suggestion that IPA can regulate liver fibrosis in humans, circulating IPA associated with liver transcripts enriched in hepatic stellate cell activation and altered extracellular signaling (Figure 3), which are the major players in the onset and progression of fibrosis [31,42]. Within these pathways, genes associated with fibrosis signaling, including ITGA3, ITGAV, LAMC3, and COL1A2, were negatively correlated with the circulating IPA levels. These genes belong to the family of extracellular matrix components (including integrins, laminins and collagen) and are known to be activated by steatosis derived inflammatory mediators in a fatty liver [51]. Previously, IPA has been shown to inhibit the expression of fibrogenic and collagen family genes and attenuate diet-induced NASH phenotypes in rats [22], and to induce cytostatic effect and regulate cell-cell adhesion and communication both in vivo and in vitro [52,53]. Therefore, our transcriptomic analysis of human liver strengthens the conclusion that IPA may have hepatoprotective effect in humans.
To confirm the potential of IPA to regulate activation of HSCs we demonstrated that IPA could reduce cell adhesion and migration, and partially restore mRNA expression of genes related to activation of LX-2 cells by TGF-β1 (Figure 4 and Figure 5). These responses to IPA treatment also support the role of IPA in fibrogenesis because the reduction in cell adhesion and migration could be an indicator of a more quiescent phenotype or a less activated phenotype for HSCs [33], indicating a protective effect of IPA. Liver fibrosis is a result of healing response to chronic liver injury characterized by deposition of extracellular matrix (ECM) through the activation of COL1A2, αSMA and growth factors in HSCs [31]. Thus, the reduction in the mRNA gene expression of these classical markers COL1A2 and aSMA of cell activation and alterations in ECM associated genes TIMP1 and ITGA3 validate the ameliorative effect of IPA on HSCs. Similar changes in mRNA expression in response to IPA have been previously observed in diet-induced rodent model of NASH [22].
We have acknowledged limitations in our study. The prospective cohort cannot link our conclusions to causation. For this reason, we performed the experimental studies in LX-2 cells to obtain, at least preliminary evidence for causation. Although it is difficult to prove the clinically relevant causal relationship because of the nature of the study, in vitro validation using the cell model provides a strong suggestion that IPA can rescue hepatic fibrosis. The mechanisms of this action should be revealed in more detailed experimental studies including changes in protein levels, inflammation and functional assessment of ECM in response to IPA. Regarding the action of IPA in the liver, we agree that the availability of intrahepatic IPA content would allow us to better understand the mechanism and the metabolic outcomes at tissue-level. However, this was not possible to obtain and may also not be relevant because of the potentially low tissue concentrations. Under physiological conditions, serum IPA concentrations range from 1–10 μM in humans [19,38]. In most of the in vitro studies testing the efficacy of IPA, 100 μM and higher doses have been used [15,20,40,41]. Since we have no knowledge about the tissue concentrations in humans, we decided to use commonly used 100 μM concentration with cells. A recent study also reports contrasting acute and chronic effect of IPA on mitochondrial function in human cardiomyocytes [40] which also indicates that detailed mechanistic actions have to be investigated before proceeding to clinical studies in humans.
In conclusion, we observed that circulating levels of gut-derived metabolite IPA were associated with liver inflammation and fibrosis and with mRNA levels of genes enriched for pathways including hepatic stellate cell activation and fibrosis signaling. Studies with activated HSCs further supported the conclusion that IPA can reduce activation of stellate cells. Altogether, our findings suggests that IPA is a promising candidate for further studies aimed at identifying new treatments for reversal or management of hepatic fibrogenesis.

Supplementary Materials

The following are available online at https://www.mdpi.com/article/10.3390/nu13103509/s1, Methods S1: Reagents and chemicals, Figure S1: IPA measurement correlation, Figure S2: Associations of serum IPA signal intensity with steatosis and ballooning, based on presence (all except 0) or absence (stage/grade 0) of either steatosis or ballooning in individuals with or without T2D, Figure S3: Associations of serum IPA signal intensity across all the stages/grades within each of the liver histology with or without T2D, Table S1:Characteristics of the individuals undergoing bariatric surgery with IPA signal intensity identified using non-targeted and IPA concentrations using targeted metabolomics included in the current study, Table S2: Primer sequences, Table S3: List of liver transcripts/genes significantly associated with IPA levels.

Author Contributions

R.S. researched, collected, and analyzed the clinical as well as experimental data and wrote the manuscript. P.P. provided and D.K. analyzed the RNA sequencing data. M.I. and M.V. analyzed, designed, and supervised the cell culture experiments. V.M. and V.K. collected and analyzed the clinical data. M.T. and K.H. analyzed and interpreted the metabolomics data. S.R. provided the LX-2 cells and designed the experimental study. J.P. and V.D.d.M. designed the study, collected the clinical data, and reviewed the manuscript. All authors have read and agreed to the published version of the manuscript.

Funding

Finnish Diabetes Research Foundation granted to V.D.de M. financial support for the experimental research and targeted metabolomics analyses. Kuopio Obesity Surgery Study (J.P.) was supported by the Finnish Diabetes Research Foundation, Kuopio University Hospital Project grant (EVO/VTR grants 2005–2019), the Academy of Finland grant (contract no. 138006). Financial contribution for experiments was supported by Health from Science (TERVA, 404030) project. R.S. was supported by GenomMed Doctoral Programme, co-funded by Horizon 2020 Framework Programme of the European Union (Marie Skłodowska Curie grant agreement no. 740264). M.V. was supported by the Academy of Finland (Contract no. 324494). V.M was supported by a grant from Finnish Medical Foundation. D.K. was supported by the Academy of Finland (contract no. 316458). P.P. was supported by the National Institutes of Health (NIH) grants HL-095056, HL-28481, and U01 DK105561. KH was supported by Academy of Finland (grant no. 321716) and ERA-NET NEURON 2019 Translational Biomarkers (grant no. 334814).

Institutional Review Board Statement

The study was conducted according to the guidelines of the Declaration of Helsinki, and approved by the Ethics Committee of the Northern Savo Hospital District (54/2005, 104/2008, and 27/2010).

Informed Consent Statement

Written informed consent was obtained from all participants.

Acknowledgments

The authors wish to acknowledge CSC–IT Center for Science, Espoo, Finland, for computational resources and department of Ophthalmology, UEF, for microscopy.

Conflicts of Interest

The authors declare no conflict of interest.

References

  1. Trefts, E.; Gannon, M.; Wasserman, D.H. The Liver. Curr. Biol. 2017, 27, R1147–R1151. [Google Scholar] [CrossRef]
  2. Bechmann, L.; Hannivoort, R.A.; Gerken, G.; Hotamisligil, G.S.; Trauner, M.; Canbay, A. The interaction of hepatic lipid and glucose metabolism in liver diseases. J. Hepatol. 2012, 56, 952–964. [Google Scholar] [CrossRef] [PubMed] [Green Version]
  3. Parhofer, K.G. Interaction between Glucose and Lipid Metabolism: More than Diabetic Dyslipidemia. Diabetes Metab. J. 2015, 39, 353–362. [Google Scholar] [CrossRef] [PubMed] [Green Version]
  4. Katsarou, A.; Moustakas, I.I.; Pyrina, I.; Lembessis, P.; Koutsilieris, M.; Chatzigeorgiou, A. Metabolic inflammation as an instigator of fibrosis during non-alcoholic fatty liver disease. World J. Gastroenterol. 2020, 26, 1993–2011. [Google Scholar] [CrossRef]
  5. Mohajeri, M.H.; Brummer, R.J.M.; Rastall, R.A.; Weersma, R.K.; Harmsen, H.J.M.; Faas, M.; Eggersdorfer, M. The role of the microbiome for human health: From basic science to clinical applications. Eur. J. Nutr. 2018, 57, 1–14. [Google Scholar] [CrossRef] [PubMed] [Green Version]
  6. Lee-Sarwar, K.A.; Lasky-Su, J.; Kelly, R.S.; Litonjua, A.A.; Weiss, S.T. Metabolome–Microbiome Crosstalk and Human Disease. Metabolites 2020, 10, 181. [Google Scholar] [CrossRef]
  7. Menni, C.; Hernandez, M.M.; Vital, M.; Mohney, R.P.; Spector, T.D.; Valdes, A.M. Circulating levels of the anti-oxidant indoleproprionic acid are associated with higher gut microbiome diversity. Gut Microbes 2019, 10, 688–695. [Google Scholar] [CrossRef] [Green Version]
  8. de Mello, V.D.; Paananen, J.; Lindström, J.; Lankinen, M.A.; Shi, L.; Kuusisto, J.; Uusitupa, M. Faculty Opinions recommendation of Indolepropionic acid and novel lipid metabolites are associated with a lower risk of type 2 diabetes in the Finnish Diabetes Prevention Study. Sci. Rep. 2017, 7. [Google Scholar] [CrossRef]
  9. Cason, C.A.; Dolan, K.T.; Sharma, G.; Tao, M.; Kulkarni, R.; Helenowski, I.B.; Doane, B.M.; Avram, M.J.; McDermott, M.M.; Chang, E.B.; et al. Plasma Microbiome-Modulated Indole-and Phenyl-Derived Metabolites Associate with Advanced Atherosclerosis and Postoperative Outcomes. J. Vasc. Surg. 2018, 68, 1552–1562.e7. [Google Scholar] [CrossRef]
  10. Cussotto, S.; Delgado, I.; Anesi, A.; Dexpert, S.; Aubert, A.; Beau, C.; Forestier, D.; Ledaguenel, P.; Magne, E.; Mattivi, F.; et al. Tryptophan Metabolic Pathways Are Altered in Obesity and Are Associated With Systemic Inflammation. Front. Immunol. 2020, 11, 557. [Google Scholar] [CrossRef]
  11. Jennis, M.; Cavanaugh, C.R.; Leo, G.C.; Mabus, J.R.; Lenhard, J.; Hornby, P.J. Microbiota-Derived Tryptophan Indoles Increase After Gastric Bypass Surgery and Reduce Intestinal Permeability in Vitro and in Vivo. Neurogastroenterol. Motil. 2018, 30, e13178. [Google Scholar] [CrossRef] [PubMed]
  12. Sun, C.-Y.; Lin, C.-J.; Pan, H.-C.; Lee, C.-C.; Lu, S.-C.; Hsieh, Y.-T.; Huang, S.-Y.; Huang, H.-Y. Clinical association between the metabolite of healthy gut microbiota, 3-indolepropionic acid and chronic kidney disease. Clin. Nutr. 2018, 38, 2945–2948. [Google Scholar] [CrossRef] [PubMed]
  13. Qi, Q.; Li, J.; Yu, B.; Moon, J.; Chai, J.C.; Merino, J.; Hu, J.; Ruiz-Canela, M.; Rebholz, C.; Wang, Z.; et al. Host and Gut Microbial Tryptophan Metabolism and Type 2 Diabetes: An Integrative Analysis of Host Genetics, Diet, Gut Microbiome and Circulating Metabolites in Cohort Studies. Gut 2021, 0, 1–11. [Google Scholar]
  14. Pallister, T.; Jennings, A.; Mohney, R.P.; Yarand, D.; Mangino, M.; Cassidy, A.; MacGregor, A.; Spector, T.D.; Menni, C. Characterizing Blood Metabolomics Profiles Associated with Self-Reported Food Intakes in Female Twins. PLoS ONE 2016, 11, e0158568. [Google Scholar] [CrossRef] [PubMed] [Green Version]
  15. Zhang, X.; Coker, O.O.; Chu, E.S.H.; Fu, K.; Lau, H.C.H.; Wang, Y.; Chan, A.W.H.; Wei, H.; Yang, X.; Sung, J.J.Y.; et al. Dietary Cholesterol Drives Fatty Liver-Associated Liver Cancer by Modulating Gut Microbiota and Metabolites. Gut 2021, 70, 761. [Google Scholar] [CrossRef] [PubMed]
  16. Abildgaard, A.; Elfving, B.; Hokland, M.; Wegener, G.; Lund, S. The microbial metabolite indole-3-propionic acid improves glucose metabolism in rats, but does not affect behaviour. Arch. Physiol. Biochem. 2017, 124, 306–312. [Google Scholar] [CrossRef] [PubMed]
  17. Bendheim, P.E.; Poeggeler, B.; Neria, E.; Ziv, V.; Pappolla, M.A.; Chain, D.G. Development of Indole-3-Propionic Acid (OXIGON™) for Alzheimer’s Disease. J. Mol. Neurosci. 2002, 19, 213–217. [Google Scholar] [CrossRef]
  18. Hwang, I.K.; Yoo, K.-Y.; Li, H.; Park, O.K.; Lee, C.H.; Choi, J.H.; Jeong, Y.-G.; Lee, Y.L.; Kim, Y.-M.; Kwon, Y.-G.; et al. Indole-3-propionic acid attenuates neuronal damage and oxidative stress in the ischemic hippocampus. J. Neurosci. Res. 2009, 87, 2126–2137. [Google Scholar] [CrossRef] [PubMed]
  19. Negatu, D.A.; Gengenbacher, M.; Dartois, V.; Dick, T. Indole Propionic Acid, an Unusual Antibiotic Produced by the Gut Microbiota, With Anti-inflammatory and Antioxidant Properties. Front. Microbiol. 2020, 11, 575586. [Google Scholar] [CrossRef]
  20. Yisireyili, M.; Takeshita, K.; Saito, S.; Murohara, T.; Niwa, T. Indole-3-propionic acid suppresses indoxyl sulfate-induced expression of fibrotic and inflammatory genes in proximal tubular cells. Nagoya J. Med Sci. 2017, 79, 477–486. [Google Scholar] [CrossRef]
  21. Karbownik, M.; Reiter, R.J.; Garcia, J.J.; Cabrera, J.; Burkhardt, S.; Osuna, C.; Lewiński, A. Indole-3-Propionic Acid, a Melatonin-Related Molecule, Protects Hepatic Microsomal Membranes from Iron-Induced Oxidative Damage: Relevance to Cancer Reduction. J. Cell. Biochem. 2001, 81, 507–513. [Google Scholar] [CrossRef]
  22. Zhao, Z.-H.; Xin, F.-Z.; Xue, Y.; Hu, Z.; Han, Y.; Ma, F.; Zhou, D.; Liu, X.-L.; Cui, A.; Liu, Z.; et al. Indole-3-propionic acid inhibits gut dysbiosis and endotoxin leakage to attenuate steatohepatitis in rats. Exp. Mol. Med. 2019, 51, 1–14. [Google Scholar] [CrossRef] [Green Version]
  23. Aron-Wisnewsky, J.; Warmbrunn, M.V.; Nieuwdorp, M.; Clément, K. Nonalcoholic Fatty Liver Disease: Modulating Gut Microbiota to Improve Severity? Gastroenterology 2020, 158, 1881–1898. [Google Scholar] [CrossRef] [PubMed]
  24. Dodd, D.; Spitzer, M.H.; Van Treuren, W.; Merrill, B.D.; Hryckowian, A.J.; Higginbottom, S.K.; Le, A.; Cowan, T.M.; Nolan, G.P.; Fischbach, M.A.; et al. A Gut Bacterial Pathway Metabolizes Aromatic Amino Acids into Nine Circulating Metabolites. Nature 2017, 551, 648–652. [Google Scholar] [CrossRef] [PubMed]
  25. Zhou, D.; Fan, J.-G. Microbial metabolites in non-alcoholic fatty liver disease. World J. Gastroenterol. 2019, 25, 2019–2028. [Google Scholar] [CrossRef]
  26. Kirpich, I.A.; Marsano, L.S.; McClain, C.J. Gut-Liver Axis, Nutrition, and Non-Alcoholic Fatty Liver Disease. Clin. Biochem. 2015, 48, 923–930. [Google Scholar] [CrossRef] [PubMed] [Green Version]
  27. Aragonès, G.; Colom-Pellicer, M.; Aguilar, C.; Guiu-Jurado, E.; Martínez, S.; Sabench, F.; Antonio Porras, J.; Riesco, D.; Del Castillo, D.; Richart, C.; et al. Circulating Microbiota-Derived Metabolites: A "Liquid Biopsy? Int. J. Obes. 2020, 44, 875–885. [Google Scholar] [CrossRef] [PubMed] [Green Version]
  28. Ohtani, N.; Kawada, N. Role of the Gut-Liver Axis in Liver Inflammation, Fibrosis, and Cancer: A Special Focus on the Gut Microbiota Relationship. Hepatol. Commun. 2019, 3, 456–470. [Google Scholar] [CrossRef] [PubMed] [Green Version]
  29. Mazagova, M.; Wang, L.; Anfora, A.T.; Wissmueller, M.; Lesley, S.A.; Miyamoto, Y.; Eckmann, L.; Dhungana, S.; Pathmasiri, W.; Sumner, S.; et al. Commensal Microbiota is Hepatoprotective and Prevents Liver Fibrosis in Mice. Fed. Am Soc. Exp. Biol. 2015, 29, 1043–1055. [Google Scholar] [CrossRef] [Green Version]
  30. Ni, Y.; Ni, L.; Zhuge, F.; Fu, Z. The Gut Microbiota and its Metabolites, Novel Targets for Treating and Preventing Non-Alcoholic Fatty Liver Disease. Mol. Nutr. Food Res. 2020, 64, 2000375. [Google Scholar] [CrossRef]
  31. Karsdal, M.A.; Manon-Jensen, T.; Genovese, F.; Kristensen, J.H.; Nielsen, M.J.; Sand, J.M.B.; Hansen, N.-U.B.; Bay-Jensen, A.-C.; Bager, C.L.; Krag, A.; et al. Novel insights into the function and dynamics of extracellular matrix in liver fibrosis. Am. J. Physiol. Liver Physiol. 2015, 308, G807–G830. [Google Scholar] [CrossRef] [PubMed] [Green Version]
  32. Marra, F. Chemokines in Liver Inflammation and Fibrosis. Front. Biosci. 2002, 7, 1899. [Google Scholar] [CrossRef] [PubMed]
  33. Elsharkawy, A.M.; Oakley, F.; Mann, D.A. The role and regulation of hepatic stellate cell apoptosis in reversal of liver fibrosis. Apoptosis 2005, 10, 927–939. [Google Scholar] [CrossRef] [PubMed]
  34. Pihlajamäki, J.; Grönlund, S.; Simonen, M.; Käkelä, P.; Moilanen, L.; Pääkkönen, M.; Pirinen, E.; Kolehmainen, M.; Kärjä, V.; Kainulainen, S.; et al. Cholesterol Absorption Decreases After Roux-En-Y Gastric Bypass but Not After Gastric Banding. Metabolism 2010, 59, 866–872. [Google Scholar] [CrossRef] [PubMed]
  35. Männistö, V.T.; Simonen, M.; Soininen, P.; Tiainen, M.; Kangas, A.J.; Kaminska, D.; Venesmaa, S.; Käkelä, P.; Kärjä, V.; Gylling, H.; et al. Lipoprotein Subclass Metabolism in Nonalcoholic Steatohepatitis. J. Lipid Res. 2014, 55, 2676–2684. [Google Scholar] [CrossRef] [PubMed] [Green Version]
  36. Brunt, E.M.; Janney, C.G.; Di Bisceglie, A.M.; Neuschwander-Tetri, B.A.; Bacon, B.R. Nonalcoholic Steatohepatitis: A Proposal for Grading and Staging the Histological Lesions. Am. J. Gastroenterol. 1999, 94, 2467–2474. [Google Scholar] [CrossRef]
  37. de Mello, V.D.; Sehgal, R.; Männistö, V.; Klåvus, A.; Nilsson, E.; Perfilyev, A.; Kaminska, D.; Miao, Z.; Pajukanta, P.; Ling, C.; et al. Serum aromatic and branched-chain amino acids associated with NASH demonstrate divergent associations with serum lipids. Liver Int. 2020, 41, 754–763. [Google Scholar] [CrossRef]
  38. Tuomainen, M.; Lindström, J.; Lehtonen, M.; Auriola, S.; Pihlajamäki, J.; Peltonen, M.; Tuomilehto, J.; Uusitupa, M.; de Mello, V.D.; Hanhineva, K. Associations of Serum Indolepropionic Acid, a Gut Microbiota Metabolite, with Type 2 Diabetes and Low-Grade Inflammation in High-Risk Individuals. Nutr. Diabetes 2018, 8, 35. [Google Scholar] [CrossRef]
  39. Männistö, V.; Kaminska, D.; Käkelä, P.; Neuvonen, M.; Niemi, M.; Alvarez, M.; Pajukanta, P.; Romeo, S.; Nieuwdorp, M.; Groen, A.; et al. Protein Phosphatase 1 Regulatory Subunit 3B Genotype at rs4240624 Has a Major Effect on Gallbladder Bile Composition. Hepatol. Commun. 2020, 5, 244–257. [Google Scholar] [CrossRef]
  40. Gesper, M.; Nonnast, A.B.H.; Kumowski, N.; Stoehr, R.; Schuett, K.; Marx, N.; Kappel, B.A. Gut-Derived Metabolite Indole-3-Propionic Acid Modulates Mitochondrial Function in Cardiomyocytes and Alters Cardiac Function. Front. Med. 2021, 8, 264. [Google Scholar] [CrossRef]
  41. Wlodarska, M.; Luo, C.; Kolde, R.; D’Hennezel, E.; Annand, J.W.; Heim, C.E.; Krastel, P.; Schmitt, E.K.; Omar, A.S.; Creasey, E.A.; et al. Indoleacrylic Acid Produced by Commensal Peptostreptococcus Species Suppresses Inflammation. Cell Host Microbe 2017, 22, 25–37.e6. [Google Scholar] [CrossRef] [PubMed] [Green Version]
  42. Dewidar, B.; Meyer, C.; Dooley, S.; Meindl-Beinker, A. TGF-Β in Hepatic Stellate Cell Activation and Liver Fibrogenesis-Updated 2019. Cells 2019, 8, 1419. [Google Scholar] [CrossRef] [PubMed] [Green Version]
  43. Shannon, P.; Markiel, A.; Ozier, O.; Baliga, N.S.; Wang, J.T.; Ramage, D.; Amin, N.; Schwikowski, B.; Ideker, T. Cytoscape: A software environment for integrated models of biomolecular interaction networks. Genome Res. 2003, 13, 2498–2504. [Google Scholar] [CrossRef] [PubMed]
  44. Trivedi, P.; Wang, S.; Friedman, S.L. The Power of Plasticity—Metabolic Regulation of Hepatic Stellate Cells. Cell Metab. 2020, 33, 242–257. [Google Scholar] [CrossRef] [PubMed]
  45. Robert, S.; Gicquel, T.; Bodin, A.; Lagente, V.; Boichot, E. Characterization of the MMP/TIMP Imbalance and Collagen Production Induced by IL-1β Or TNF-A Release from Human Hepatic Stellate Cells. PLoS ONE 2016, 11, e0153118. [Google Scholar] [CrossRef] [Green Version]
  46. Hendrikx, T.; Schnabl, B. Indoles: Metabolites Produced by Intestinal Bacteria Capable of Controlling Liver Disease Manifestation. J. Intern. Med. 2019, 286, 32–40. [Google Scholar] [CrossRef] [Green Version]
  47. Ma, L.; Li, H.; Hu, J.; Zheng, J.; Zhou, J.; Botchlett, R.; Matthews, D.; Zeng, T.; Chen, L.; Xiao, X.; et al. Indole Alleviates Diet-Induced Hepatic Steatosis and Inflammation in a Manner Involving Myeloid Cell 6-Phosphofructo-2-Kinase/Fructose-2,6-Biphosphatase 3. Hepatology 2020, 72, 1191–1203. [Google Scholar] [CrossRef]
  48. Gao, J.; Guo, X.; Wei, W.; Li, R.; Hu, K.; Liu, X.; Jiang, W.; Liu, S.; Wang, W.; Sun, H.; et al. The Association of Fried Meat Consumption With the Gut Microbiota and Fecal Metabolites and Its Impact on Glucose Homoeostasis, Intestinal Endotoxin Levels, and Systemic Inflammation: A Randomized Controlled-Feeding Trial. Diabetes Care 2021, 44, 1970–1979. [Google Scholar] [CrossRef]
  49. Ji, Y.; Yin, Y.; Li, Z.; Zhang, W. Gut Microbiota-Derived Components and Metabolites in the Progression of Non-Alcoholic Fatty Liver Disease (NAFLD). Nutrients 2019, 11, 1712. [Google Scholar] [CrossRef] [Green Version]
  50. Gastaldelli, A.; Cusi, K. From NASH to diabetes and from diabetes to NASH: Mechanisms and treatment options. JHEP Rep. 2019, 1, 312–328. [Google Scholar] [CrossRef] [Green Version]
  51. Tsuchida, T.; Friedman, S.L. Mechanisms of Hepatic Stellate Cell Activation. Nat. Rev. Gastroenterol. Hepatol. 2017, 14, 397–411. [Google Scholar] [CrossRef] [PubMed]
  52. Venkatesh, M.; Mukherjee, S.; Wang, H.; Li, H.; Sun, K.; Benechet, A.P.; Qiu, Z.; Maher, L.; Redinbo, M.R.; Phillips, R.S.; et al. Symbiotic Bacterial Metabolites Regulate Gastrointestinal Barrier Function Via the Xenobiotic Sensor PXR and Toll-Like Receptor 4. Immunity 2014, 41, 296–310. [Google Scholar] [CrossRef] [PubMed] [Green Version]
  53. Sari, Z.; Miko, E.; Kovacs, T.; Janko, L.; Csonka, T.; Lente, G.; Sebo, E.; Toth, J.; Toth, D.; Arkosy, P.; et al. Indolepropionic Acid, a Metabolite of the Microbiome, Has Cytostatic Properties in Breast Cancer by Activating AHR and PXR Receptors and Inducing Oxidative Stress. Cancers 2020, 12, 2411. [Google Scholar] [CrossRef] [PubMed]
Figure 1. Associations of serum IPA signal intensity with liver histology, based on presence (all except 0) or absence (stage/grade 0) of each specific histological characteristic. Dot plot presents the inverse-normalized serum IPA signal intensities (y-axis) across the (A) steatosis, (B) lobular inflammation, (C) ballooning and (D) fibrosis. Red lines and whiskers represent mean serum IPA signal intensity and SD, respectively. The number of individuals in each group are indicated for each group in parentheses. General linear model (univariate) test results p value is shown as p for each comparison between presence or absence of each specific histological characteristic.
Nutrients 13 03509 g001
Figure 2. Associations of serum IPA signal intensity with lobular inflammation and fibrosis, based on presence (all except 0) or absence (stage/grade 0) of either lobular inflammation or fibrosis in individuals with or without T2D. Dot plot presents the inverse-normalized serum IPA signal intensities (y-axis) for (A) lobular inflammation and (B) fibrosis. The white dots are individuals without T2D, and black are those with T2D. Red lines and whiskers represent mean serum IPA signal intensity and SD respectively for whole population. General linear model (univariate) test results p value is shown as p for each comparison between presence or absence of each specific histological characteristic separately in those with and without T2D.
Nutrients 13 03509 g002
Figure 3. Enriched pathways corresponding to the significantly (p value < 0.01) associated genes with serum IPA signal intensities. (A) Top canonical pathways based on a total of 278 transcripts IDs and corresponding genes that were nominally associated with IPA (Ingenuity Pathway Analysis). The p value for the enrichment for each pathway is shown with the total overlapping genes percentage. (B) Enrichment map based on gene ontology and reactome terms (g:Profiler in Cytoscape). The connection between the nodes (edges) are depicted with blue lines and intensity of red color indicates the Q value (adjusted p value) for the enrichment score for each node.
Nutrients 13 03509 g003
Figure 4. Effect of IPA on LX-2 cell viability, cell adhesion, and cell migration. (A) Impact on viability in LX-2 cells after IPA treatment for 24 and 48 h. Line plot represents % cell viability. (B) The effect of IPA on cell adhesion, bar plot presents the fold change reduction in adhered cells after IPA treatment for 24 and 48 h. (C) Representative images of control and IPA 100 µM at 0 and 24 h after the monolayer injury. Magnification 50× and at least 4 images for each group. Bar plot represents the % wound closure after 24 h. All the values are presented as mean ± SD, n = 3 independent experiments, One-way ANOVA followed by Bonferroni’s post hoc test was used for statistical comparisons. C—control, * p value < 0.05, ** p value < 0.01, *** p value < 0.001 compared to corresponding controls.
Nutrients 13 03509 g004
Figure 5. TGF-β1 induced mRNA gene expression changes and effect of IPA treatment on LX-2. Bar plot presents the relative mRNA with respect to endogenous control (RPLP0) after induction of LX-2 cells with TGF-β1 for 24 h, (A) Co-treatment with IPA for 24 h and (B) Recovery group, IPA treatment for 24 h after one day of cell induction with TGF-β1. All the values are presented as mean ± SD, n = 3 independent experiments, One-way ANOVA followed by Bonferroni’s post hoc test was used for statistical comparisons. Statistically significant results are shown with alphabets; a, p value < 0.05 vs. control; b, p value < 0.05 vs. TGF-β1.
Nutrients 13 03509 g005
Table 1. Clinical characteristics and liver histology of study participants according to histological liver phenotype.
Normal LiverSimple SteatosisNASHp a
Total, N (men/women)79 (20/59)40 (9/31)45 (18/27)0.14
Age (years)47.4 ± 9.746.5 ± 8.649.5 ± 9.60.31
BMI (kg/m2)42.6 ± 5.543.3 ± 4.843.4 ± 5.40.61
fS-Total cholesterol (mmol/L)4.2 ± 0.84.2 ± 0.94.5 ± 1.10.27
fS-LDL cholesterol (mmol/L)2.4 ± 0.72.4 ± 0.92.5 ± 1.00.80
fS-HDL cholesterol (mmol/L)1.2 ± 0.31.1 ± 0.21.2 ± 0.40.27
fS-Triglycerides (mmol/L)1.3 (1.0–2.3)1.4 (0.9–2.0)1.6 (1.3–2.2)0.60
fP-glucose (mmol/L)6.0 ± 1.36.3 ± 1.97.3 ± 2.2 *0.0005
fS-insulin (mU/L)13.8 (7.8–18.6)16.0 (11.0–23.4) *20.5 (14.4–28.8) *0.00006
Type 2 diabetes, N (%)15 (18.9)11 (27.5)26 (57.8) *0.00003
Lipid lowering medication, N (%)22 (28.6)9 (22.5)20 (44.4)0.07
Glucose lowering medication, N (%)14 (17.7)11 (25)24 (53.3) *0.0002
IPA levels (Inverse normalized)0.04 ± 1.110.18 ± 0.93−0.04±0.980.63
Steatosis grade, N
<5%7900
5–33%03213
33–66%0519
>66%0313
Lobular inflammation, N0045
Ballooning, N0037
Fibrosis, N (stage range)0042 (1–3)
Data shown as mean ± SD or median and interquartile range (IQR). fS—fasting serum, fP—fasting plasma, HDL—high-density lipoprotein, LDL—low-density lipoprotein, N—number of individuals, a One-way ANOVA test (continuous variable) or Chi2 test (categorical variable), After post hoc Bonferroni correction for multiple testing, * p value < 0.05 vs. normal liver.
Publisher’s Note: MDPI stays neutral with regard to jurisdictional claims in published maps and institutional affiliations.

