
Dysmagnesemia Is the Most Common Disturbance of the Calcium–Magnesium–Phosphorous Balance among Older Hospitalized People in Warsaw


Abstract
:1. Introduction
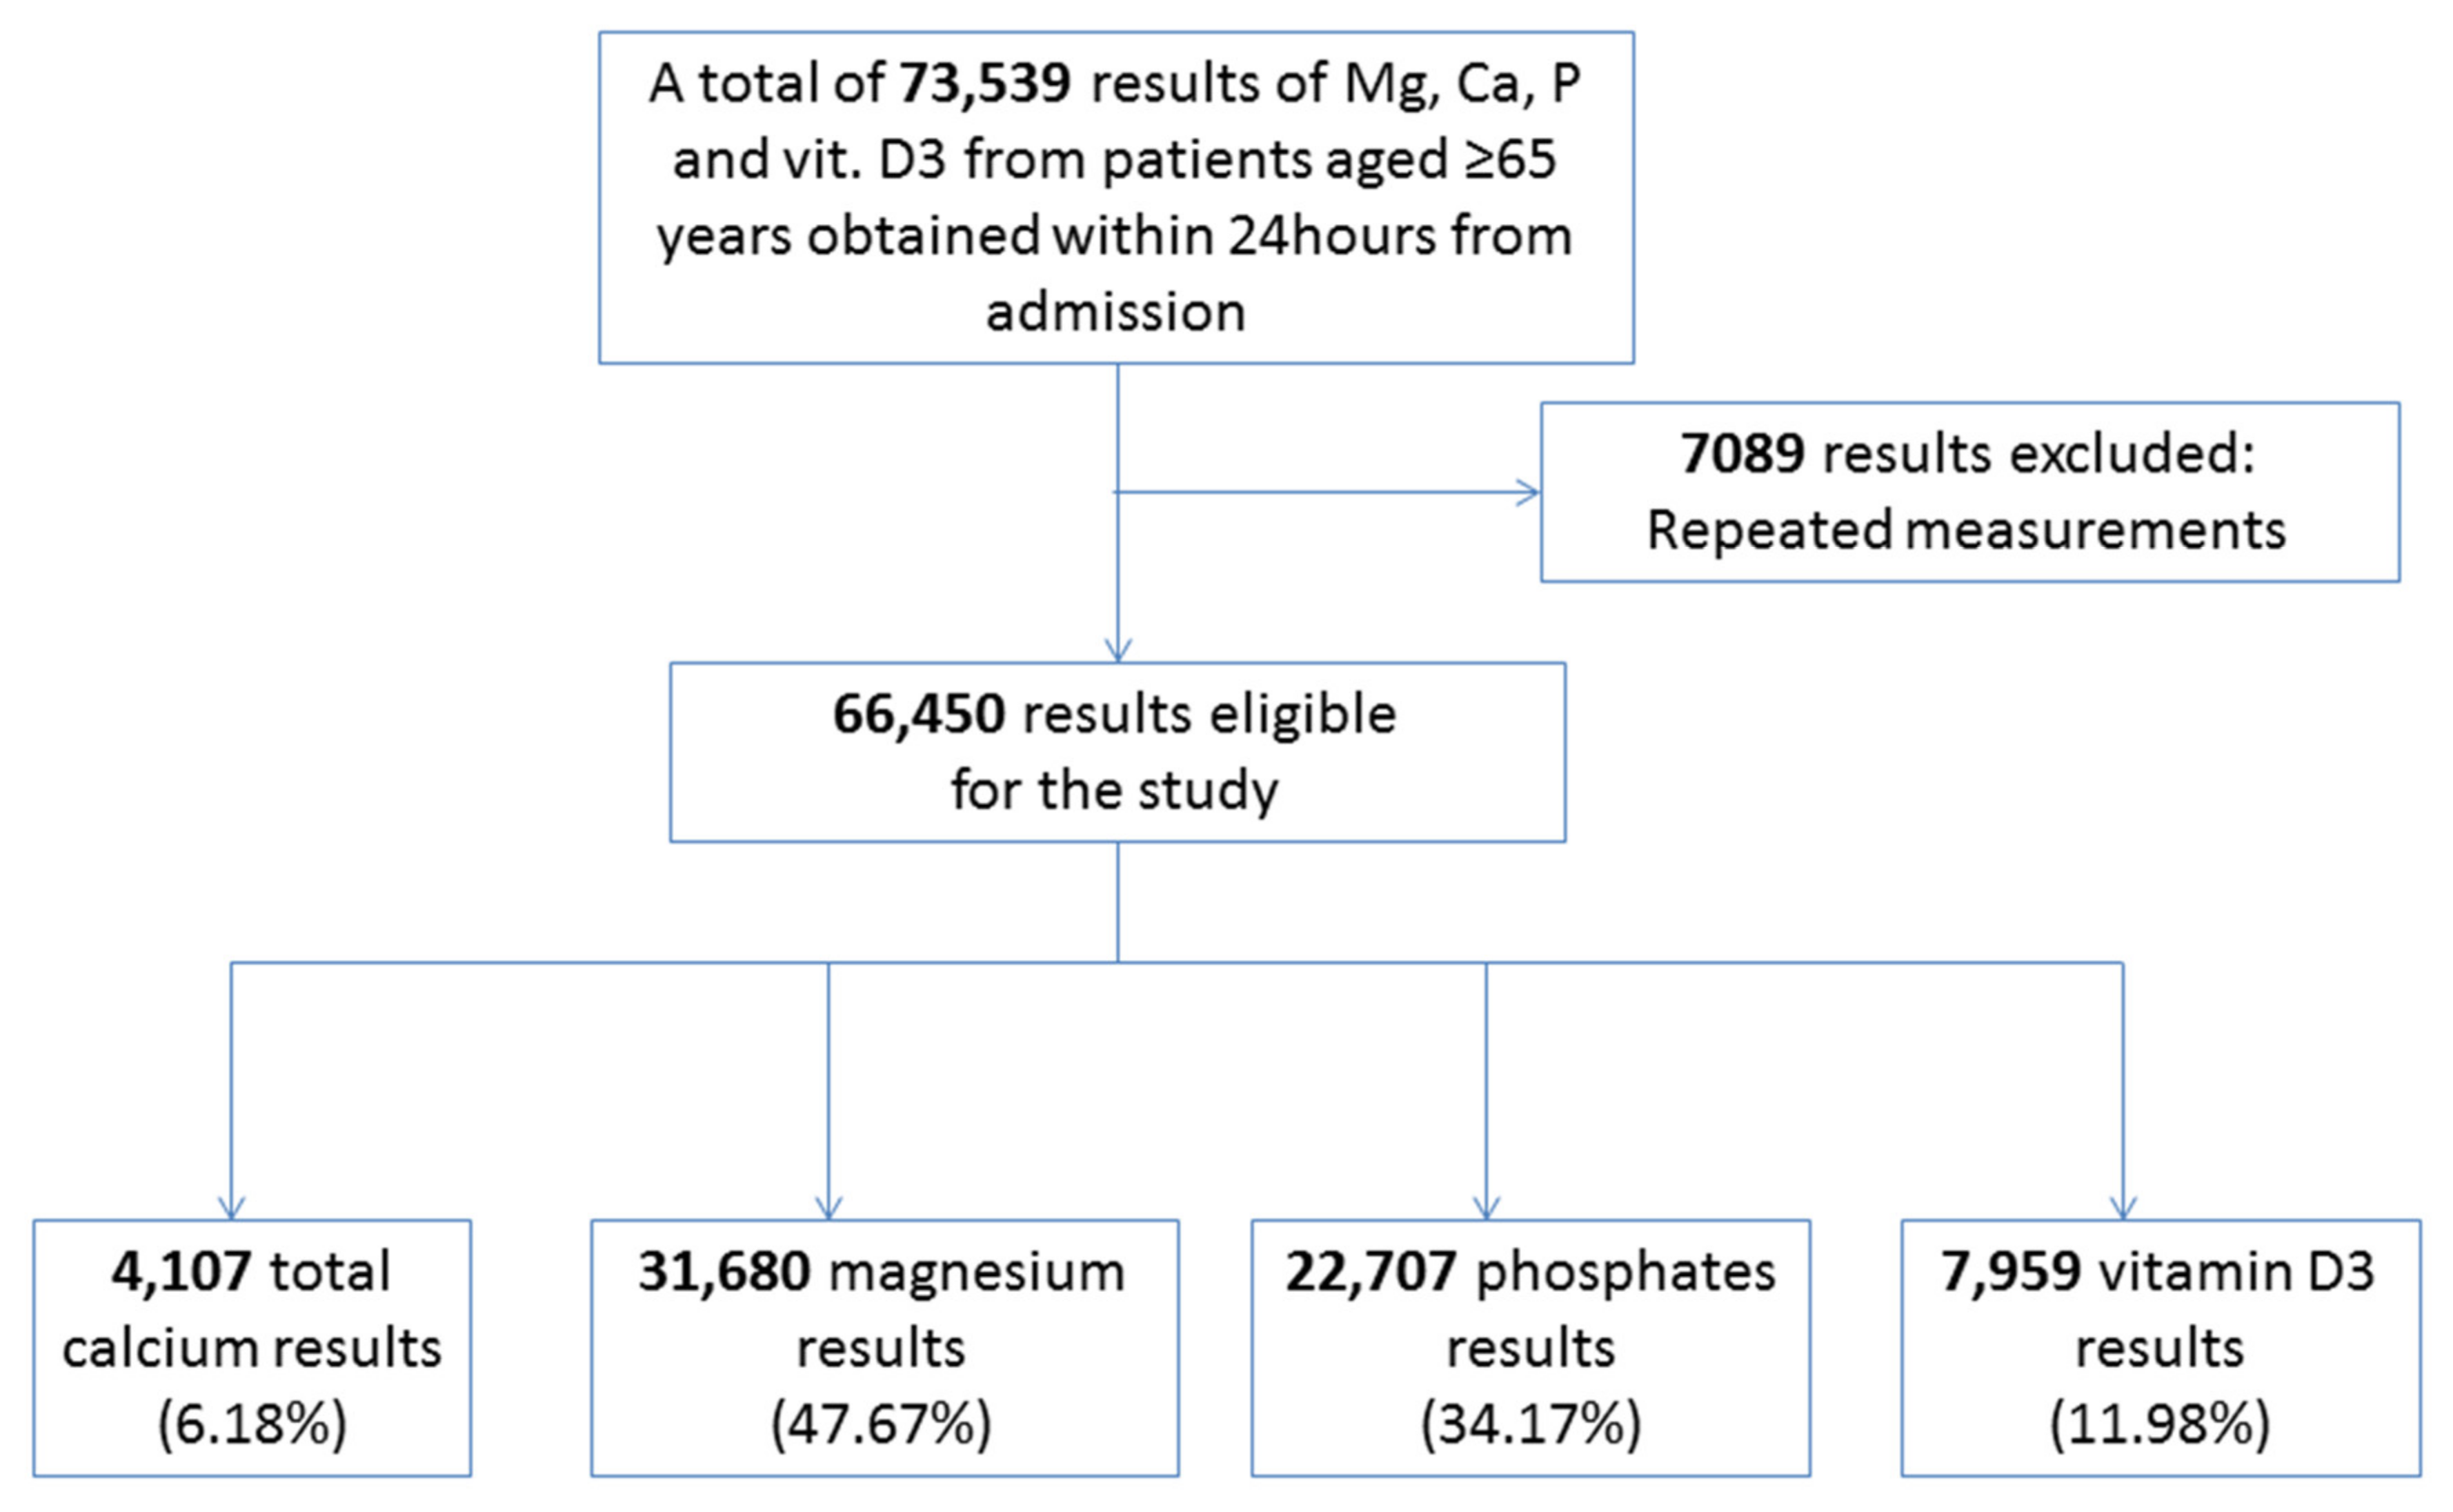
2. Materials and Methods
3. Results
3.1. Calcium
3.2. Magnesium
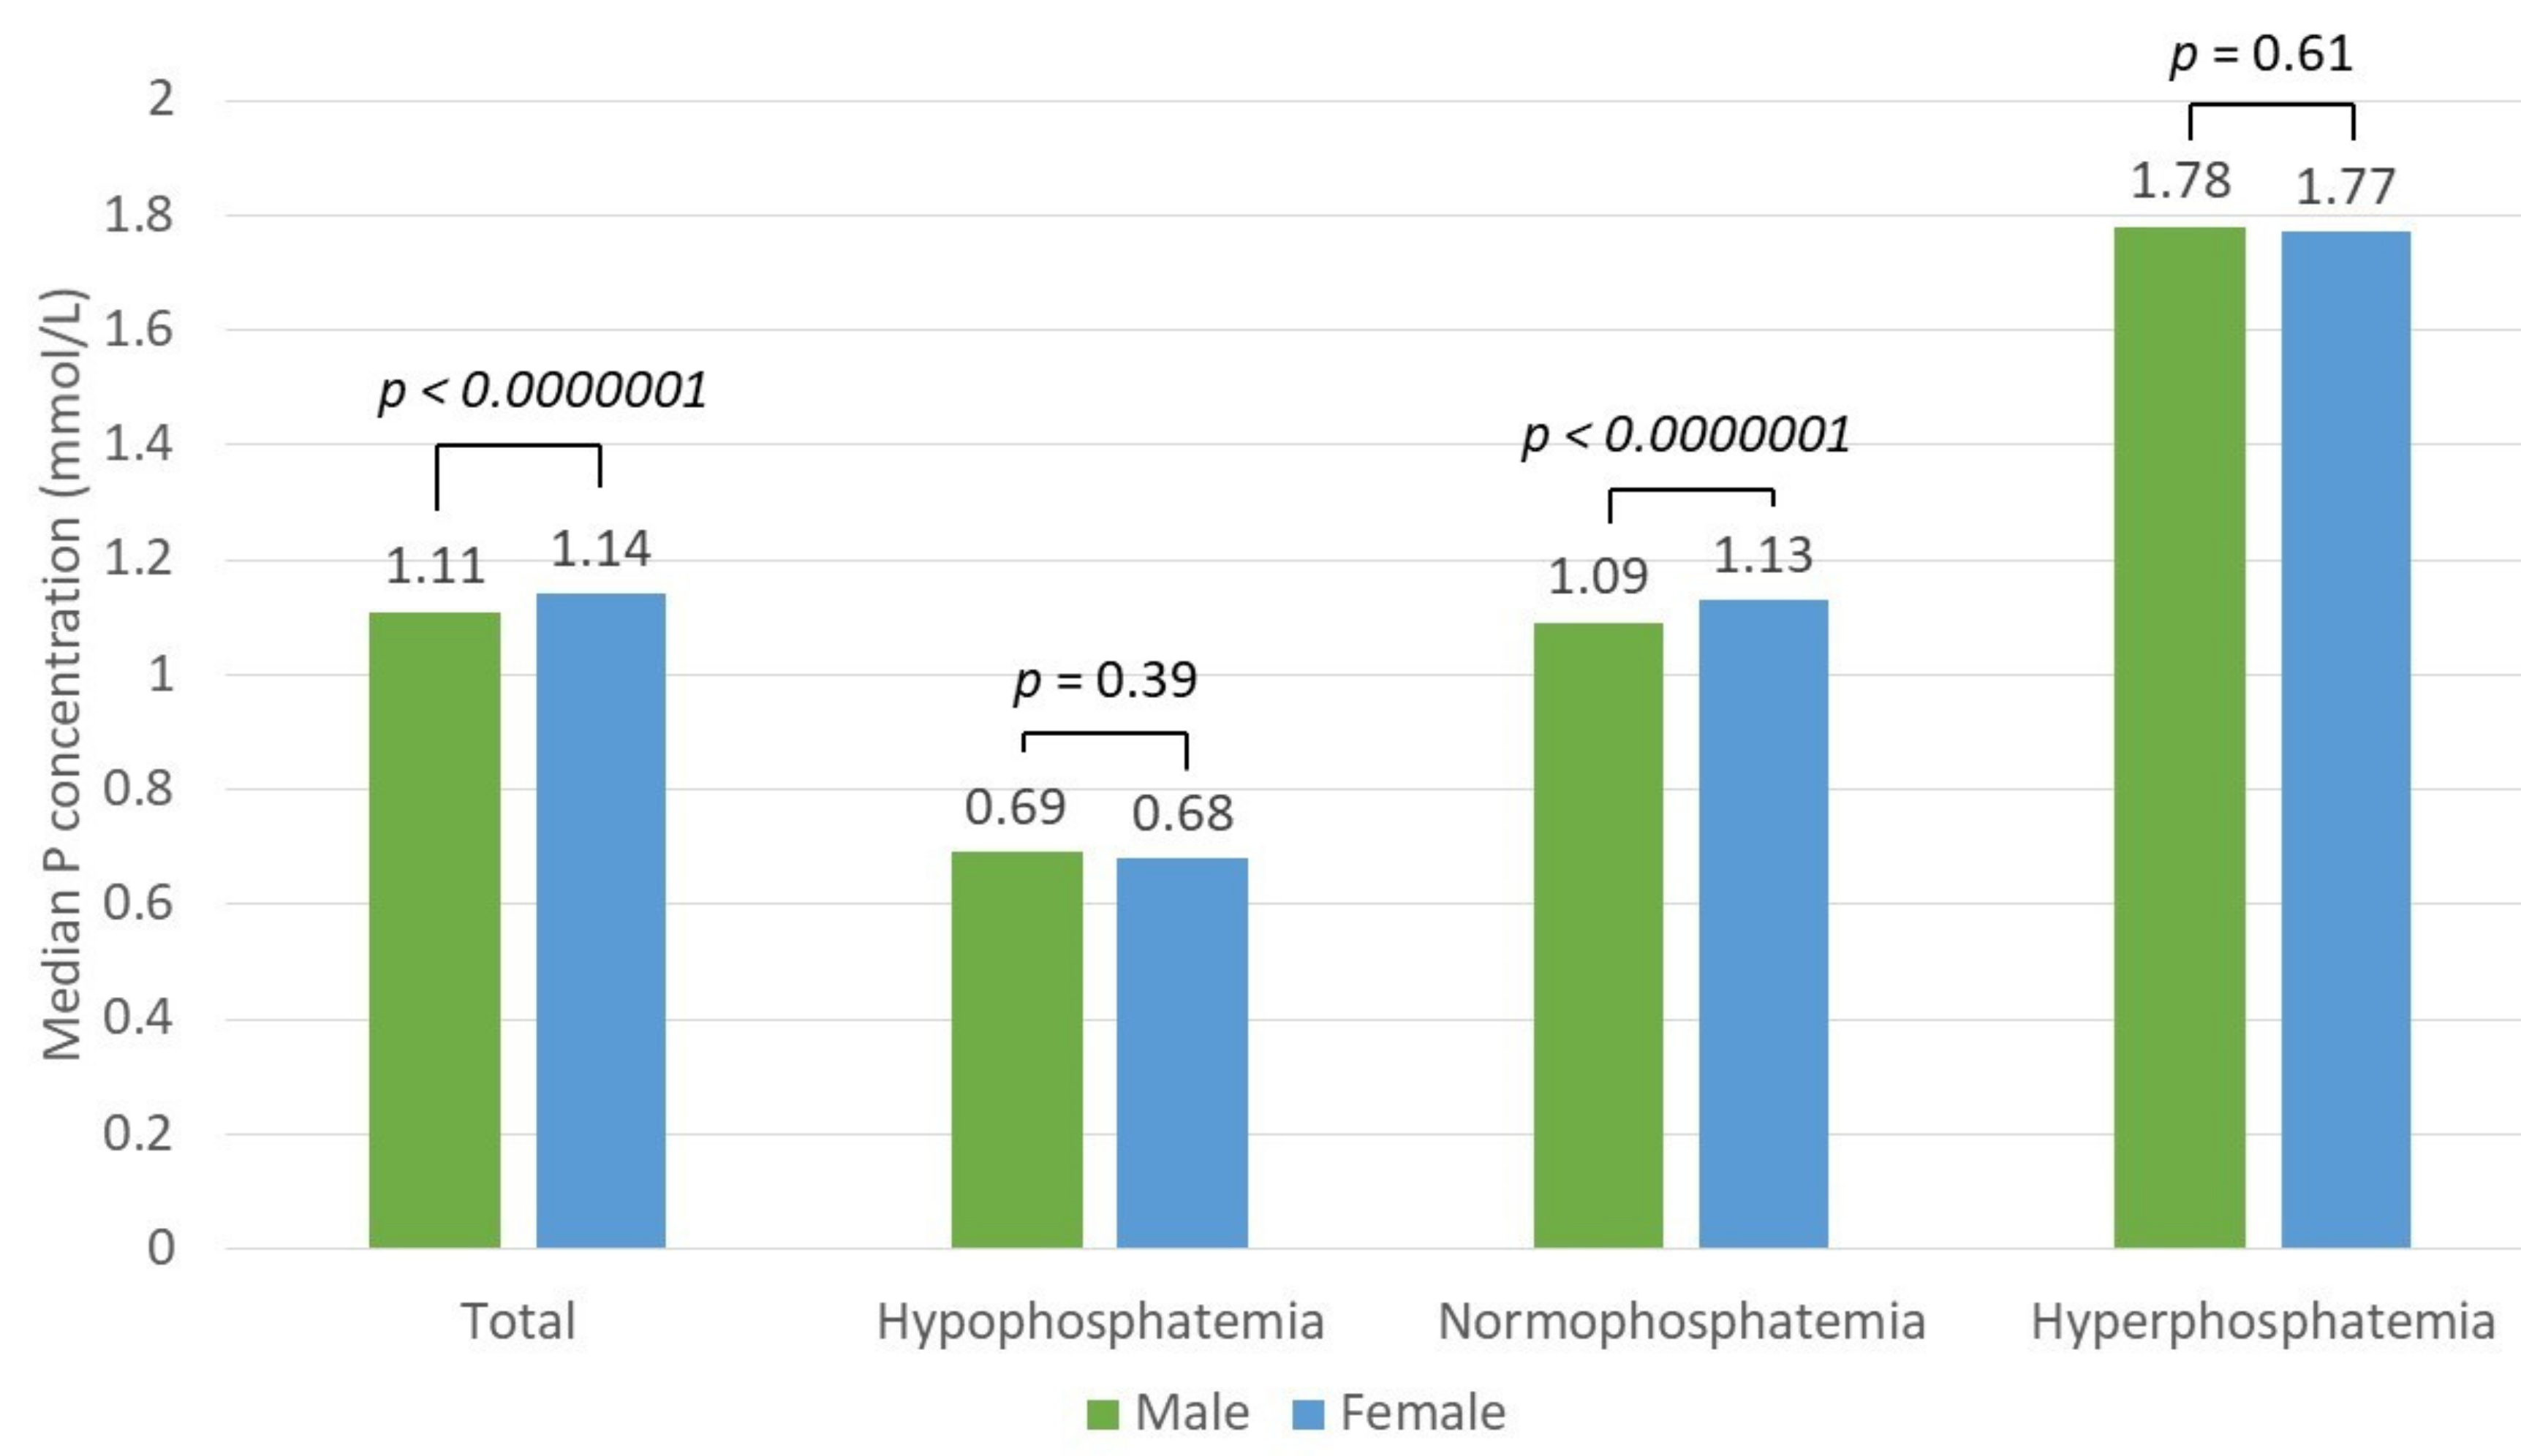
3.3. Phosphates
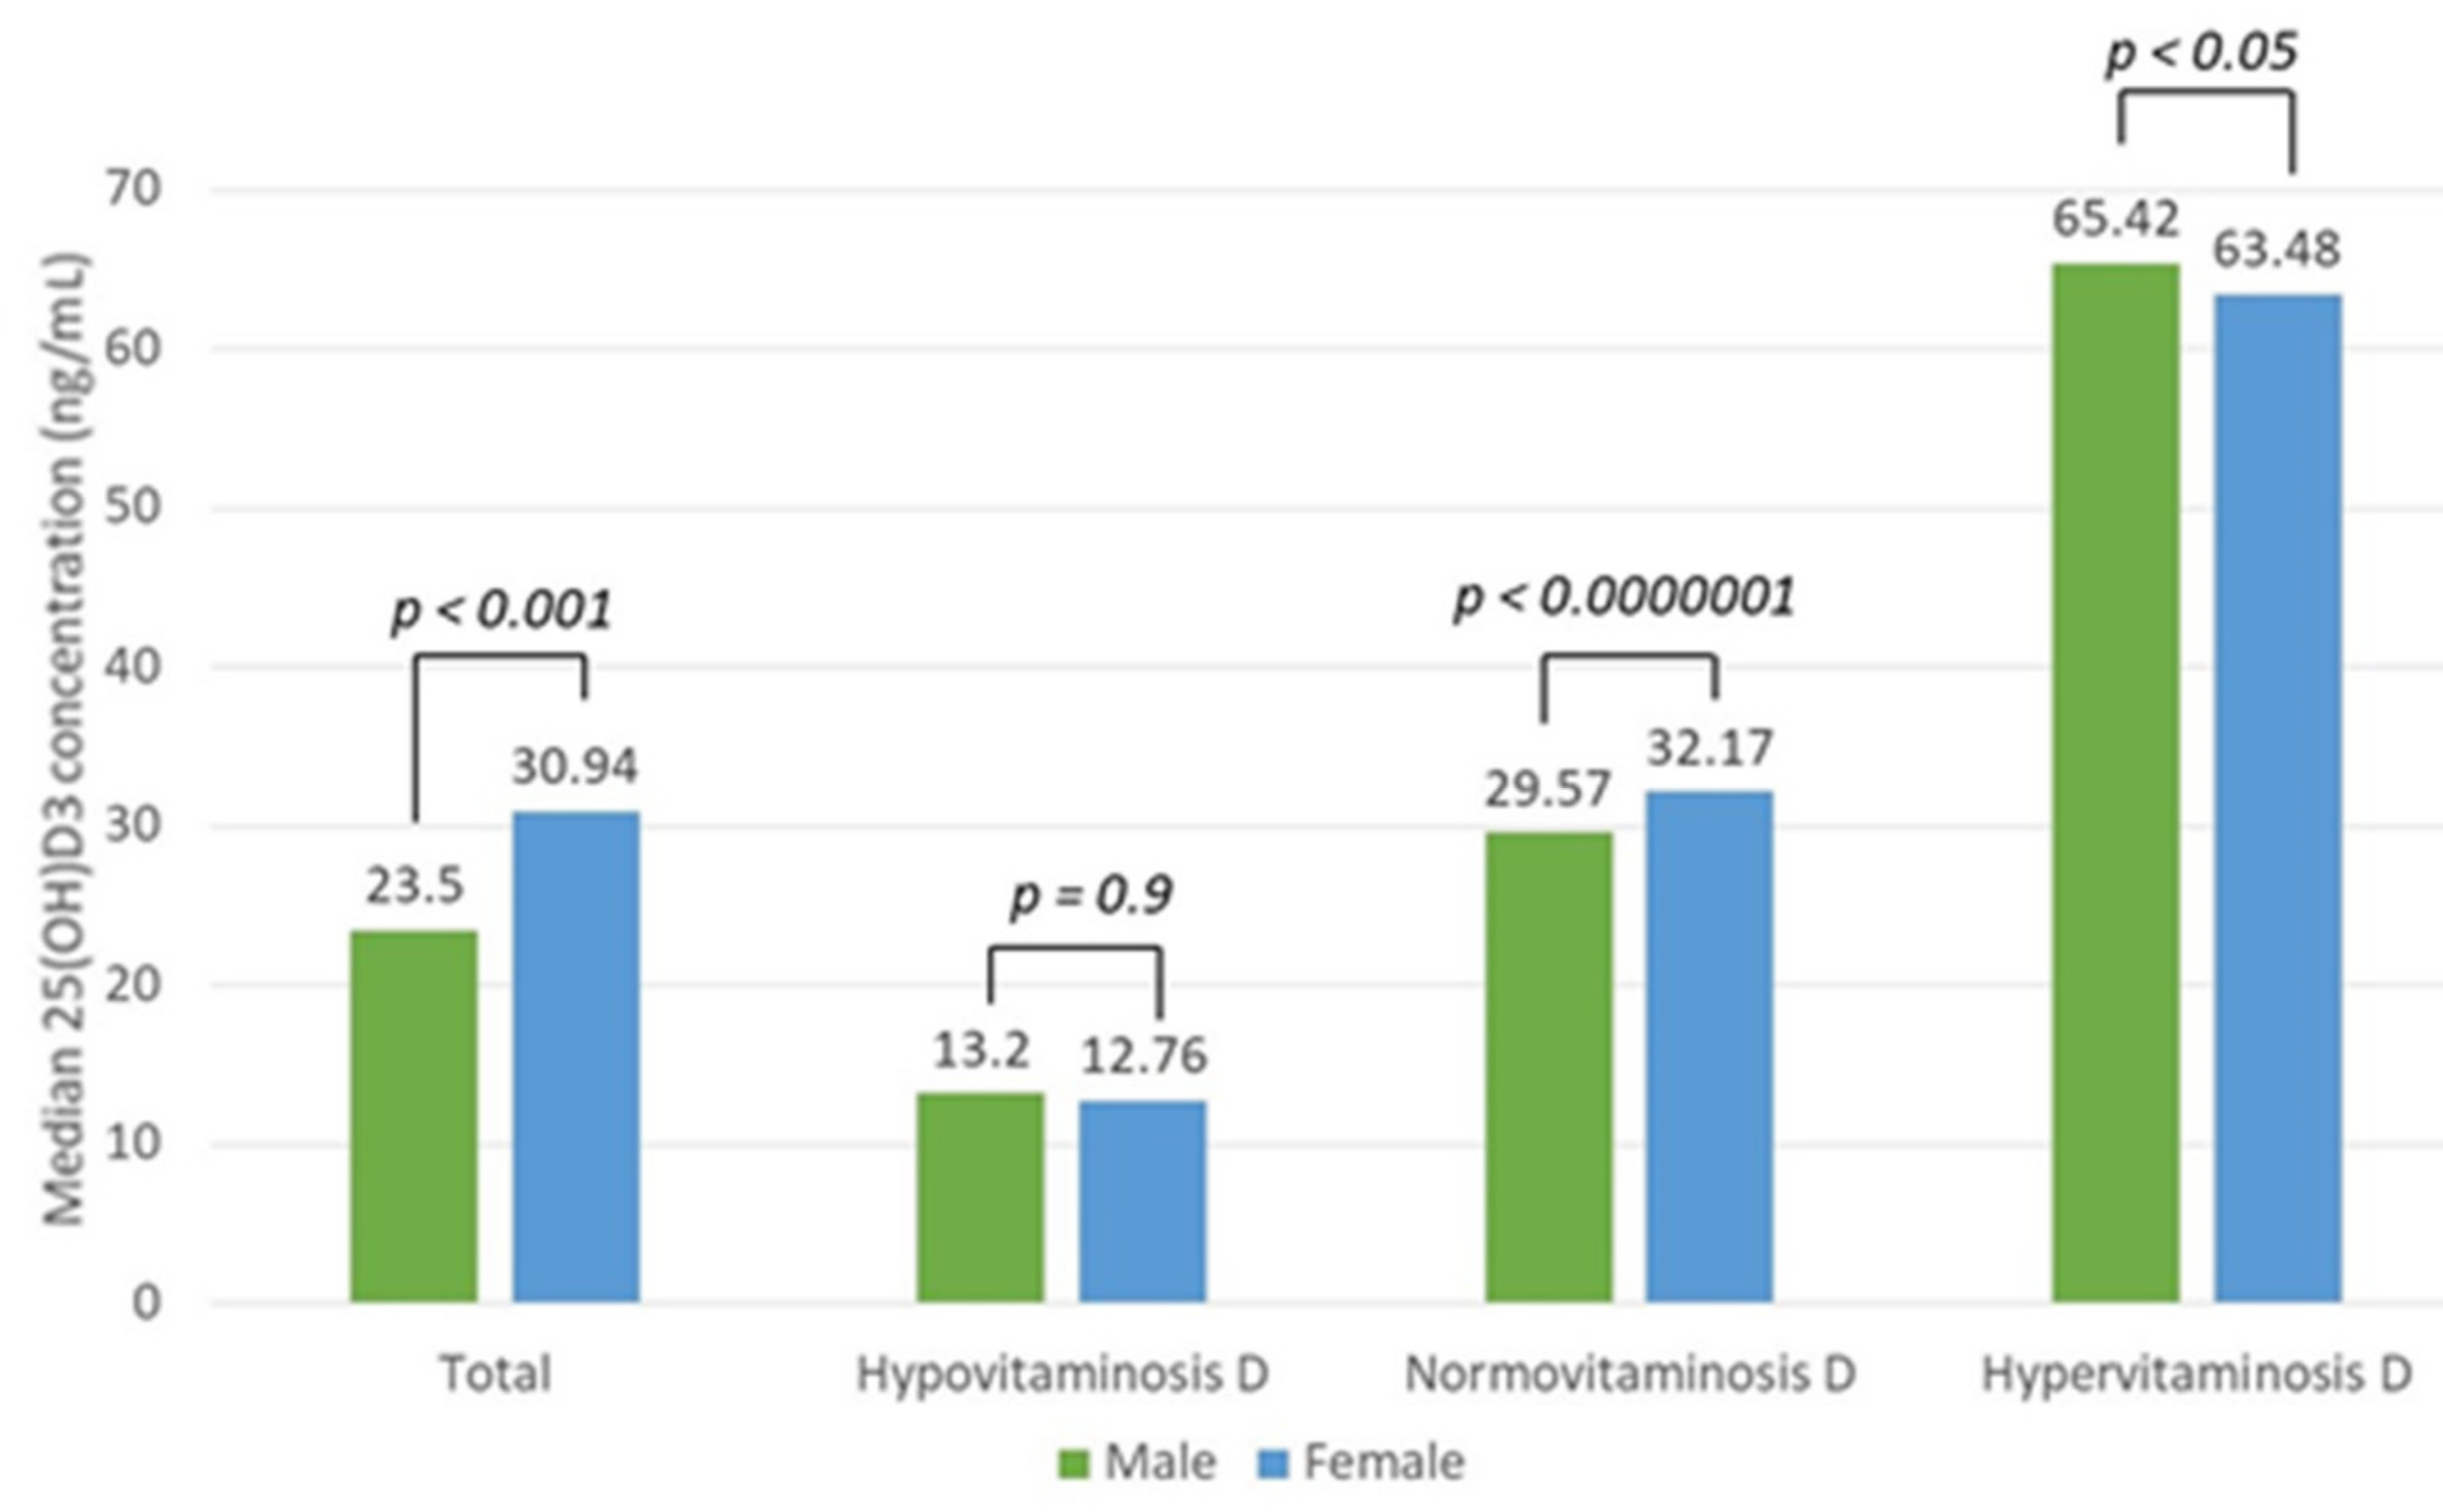
3.4. Vitamin D
3.5. Reference Values of 30–50 ng/mL
3.6. Reference Values of 20–50 ng/mL
3.7. Reference Values of 10–50 ng/mL
3.8. Vitamin D and Calcium
4. Discussion
5. Conclusions
Author Contributions
Funding
Institutional Review Board Statement
Informed Consent Statement
Data Availability Statement
Conflicts of Interest
Abbreviations
References
- England, K.; Muscat, N.A. Demographic trends and public health in Europe. Eur. J. Public Health 2017, 27 (Suppl. 4), 9–13. [Google Scholar] [CrossRef] [Green Version]
- Eurostat. Ageing Europe Looking at the Lives of Older People in the EU. 2019. Available online: https://ec.europa.eu/eurostat/en/web/products-statistical-books/-/KS-02-19-681 (accessed on 10 August 2021).
- Yannakoulia, M.; Ntanasi, E.; Anastasiou, C.A.; Scarmeas, N. Frailty and nutrition: From epidemiological and clinical evidence to potential mechanisms. Metabolism 2017, 68, 64–76. [Google Scholar] [CrossRef]
- Chang, W.-T.W.; Radin, B.; McCurdy, M.T. Calcium, Magnesium, and Phosphate Abnormalities in the Emergency Department. Emerg. Med. Clin. North Am. 2014, 32, 349–366. [Google Scholar] [CrossRef]
- Liamis, G.; Rodenburg, E.M.; Hofman, A.; Zietse, R.; Stricker, B.H.; Hoorn, E.J. Electrolyte Disorders in Community Subjects: Prevalence and Risk Factors. Am. J. Med. 2013, 126, 256–263. [Google Scholar] [CrossRef]
- Rosique-Esteban, N.; Guasch-Ferré, M.; Hernández-Alonso, P.; Salas-Salvadó, J. Dietary Magnesium and Cardiovascular Disease: A Review with Emphasis in Epidemiological Studies. Nutrients 2018, 10, 168. [Google Scholar] [CrossRef] [PubMed] [Green Version]
- Lutsey, P.L.; Alonso, A.; Michos, E.D.; Loehr, L.R.; Astor, B.C.; Coresh, J.; Folsom, A.R. Serum magnesium, phosphorus, and calcium are associated with risk of incident heart failure: The Atherosclerosis Risk in Communities (ARIC) Study. Am. J. Clin. Nutr. 2014, 100, 756–764. [Google Scholar] [CrossRef] [PubMed]
- Hisamatsu, T.; Miura, K.; Fujiyoshi, A.; Kadota, A.; Miyagawa, N.; Satoh, A.; Zaid, M.; Yamamoto, T.; Horie, M.; Ueshima, H.; et al. Serum magnesium, phosphorus, and calcium levels and subclinical calcific aortic valve disease: A population-based study. Atherosclerosis 2018, 273, 145–152. [Google Scholar] [CrossRef]
- Muñoz-Garach, A.; García-Fontana, B.; Muñoz-Torres, M. Vitamin D Status, Calcium Intake and Risk of Developing Type 2 Diabetes: An Unresolved Issue. Nutrients 2019, 11, 642. [Google Scholar] [CrossRef] [Green Version]
- Farsinejad-Marj, M.; Saneei, P.; Esmaillzadeh, A. Dietary magnesium intake, bone mineral density and risk of fracture: A systematic review and meta-analysis. Osteoporos. Int. 2015, 27, 1389–1399. [Google Scholar] [CrossRef] [PubMed]
- Nieves, J.W. Osteoporosis: The role of micronutrients. Am. J. Clin. Nutr. 2005, 81, 1232S–1239S. [Google Scholar] [CrossRef] [Green Version]
- Van Dronkelaar, C.; Van Velzen, A.; Abdelrazek, M.; Van der Steen, A.; Weijs, P.; Tieland, M. Minerals and Sarcopenia; The Role of Calcium, Iron, Magnesium, Phosphorus, Potassium, Selenium, Sodium, and Zinc on Muscle Mass, Muscle Strength, and Physical Performance in Older Adults: A Systematic Review. J. Am. Med. Dir. Assoc. 2018, 19, 6–11.e3. [Google Scholar] [CrossRef] [PubMed]
- Mosekilde, L. Vitamin D and the elderly. Clin. Endocrinol. 2005, 62, 265–281. [Google Scholar] [CrossRef]
- Malinowska, J.; Małecka, M.; Ciepiela, O. Variations in Magnesium Concentration Are Associated with Increased Mortality: Study in an Unselected Population of Hospitalized Patients. Nutrients 2020, 12, 1836. [Google Scholar] [CrossRef]
- Steele, T.; Kolamunnage-Dona, R.; Downey, C.; Toh, C.-H.; Welters, I. Assessment and clinical course of hypocalcemia in critical illness. Crit. Care 2013, 17, R106. [Google Scholar] [CrossRef] [PubMed] [Green Version]
- Yamaguchi, S.; Hamano, T.; Doi, Y.; Oka, T.; Kajimoto, S.; Kubota, K.; Yasuda, S.; Shimada, K.; Matsumoto, A.; Hashimoto, N.; et al. Hidden Hypocalcemia as a Risk Factor for Cardiovascular Events and All-Cause Mortality among Patients Undergoing Incident Hemodialysis. Sci. Rep. 2020, 10, 1–9. [Google Scholar] [CrossRef] [Green Version]
- Liu, J.; Han, P.; Wu, J.; Gong, J.; Tian, D. Prevalence and predictive value of hypocalcemia in severe COVID-19 patients. J. Infect. Public Health 2020, 13, 1224–1228. [Google Scholar] [CrossRef]
- Cirik, M.; Kilinç, M.; Doğanay, G.E.; Ünver, M.; Yildiz, M.; Avci, S. The relationship between magnesium levels and mortality in the respiratory intensive care unit. Medicine 2020, 99, e23290. [Google Scholar] [CrossRef] [PubMed]
- Alsumrain, M.H.; Jawad, S.A.; Imran, N.B.; Riar, S.; DeBari, V.A.; Adelman, M. Association of hypophosphatemia with failure-to-wean from mechanical ventilation. Ann. Clin. Lab. Sci. 2010, 40, 144–148. [Google Scholar]
- Limaye, C.S.; Londhey, V.A.; Nadkart, M.Y.; Borges, N.E. Hypomagnesemia in critically ill medical patients. J. Assoc. Physicians India 2011, 59, 19–22. [Google Scholar]
- Cheungpasitporn, W.; Thongprayoon, C.; Qian, Q. Dysmagnesemia in hospitalized patients: Prevalence and prognostic im-portance. Mayo Clin. Proc. 2015, 90, 1001–1010. [Google Scholar] [CrossRef] [Green Version]
- Goncalves, T.J.M.; Goncalves, S.E.A.B.; Guarnieri, A.; Risegato, R.C.; Guimaraes, M.P.; de Freitas, D.C.; Razuk-Filho, A.; Junior, P.B.B.; Parillo, E.F. Prevalence of obesity and hypovitaminosis D in elderly with severe acute respiratory syndrome coronavirus 2 (SARS-CoV-2). Clin. Nutr. ESPEN 2020, 40, 110–114. [Google Scholar] [CrossRef]
- MacKay, E.J.; Stubna, M.D.; Holena, D.N.; Reilly, P.M.; Seamon, M.J.; Smith, B.P.; Kaplan, L.J.; Cannon, J.W. Abnormal Calcium Levels During Trauma Resuscitation Are Associated with Increased Mortality, Increased Blood Product Use, and Greater Hospital Resource Consumption. Anesthesia Analg. 2017, 125, 895–901. [Google Scholar] [CrossRef] [PubMed]
- Catalano, A.; Chila, D.; Bellone, F.; Nicocia, G.; Martino, G.; Loddo, I.; Morabito, N.; Benvenga, S.; Loddo, S. Incidence of hypocalcemia and hypercalcemia in hospitalized patients: Is it changing? J. Clin. Transl. Endocrinol. 2018, 13, 9–13. [Google Scholar] [CrossRef] [PubMed]
- Silva, B.C.; Cusano, N.E.; Bilezikian, J.P. Primary hyperparathyroidism. Best Pract. Res. Clin. Endocrinol. Metab. 2018, 32, 593–607. [Google Scholar] [CrossRef] [Green Version]
- Han, C.H.; Fry, C.H.; Sharma, P.; Han, T.S. A clinical perspective of parathyroid hormone related hypercalcaemia. Rev. Endocr. Metab. Disord. 2019, 21, 77–88. [Google Scholar] [CrossRef] [PubMed] [Green Version]
- Dudenkov, D.V.; Yawn, B.P.; Oberhelman, S.S.; Fischer, P.R.; Singh, R.J.; Cha, S.S.; Maxson, J.A.; Quigg, S.M.; Thacher, T.D. Changing incidence of serum 25-hydroxyvitamin D values above 50 ng/mL: A 10-year population-based study. Mayo Clin. Proc. 2015, 90, 577–586. [Google Scholar] [CrossRef] [PubMed] [Green Version]
- Bove-Fenderson, E.; Mannstadt, M. Hypocalcemic disorders. Best Pract. Res. Clin. Endocrinol. Metab. 2018, 32, 639–656. [Google Scholar] [CrossRef]
- Fong, J.; Khan, A. Hypocalcemia: Updates in diagnosis and management for primary care. Can. Fam. Physician 2012, 58, 158–162. [Google Scholar] [PubMed]
- Khazai, N.; Judd, S.E.; Tangpricha, V. Calcium and vitamin D: Skeletal and extraskeletal health. Curr. Rheumatol. Rep. 2008, 10, 110–117. [Google Scholar] [CrossRef] [Green Version]
- Shea, M.K.; Houston, D.; Tooze, J.A.; Davis, C.C.; Johnson, M.A.; Hausman, D.B.; Cauley, J.A.; Bauer, D.C.; Tylavsky, F.; Harris, T.B.; et al. Correlates and Prevalence of Insufficient 25-Hydroxyvitamin D Status in Black and White Older Adults: The Health, Aging and Body Composition Study. J. Am. Geriatr. Soc. 2011, 59, 1165–1174. [Google Scholar] [CrossRef] [Green Version]
- Wu, F.; Wills, K.; Laslett, L.L.; Oldenburg, B.; Seibel, M.; Jones, G.; Winzenberg, T. Cut-points for associations between vitamin D status and multiple musculoskeletal outcomes in middle-aged women. Osteoporos. Int. 2016, 28, 505–515. [Google Scholar] [CrossRef] [PubMed]
- Holick, M.F. Vitamin D deficiency in 2010: Health benefits of vitamin D and sunlight: A D-bate. Nat. Rev. Endocrinol. 2011, 7, 73–75. [Google Scholar] [CrossRef]
- Lips, P.; Cashman, K.D.; Lamberg-Allardt, C.; Bischoff-Ferrari, H.; Obermayer-Pietsch, B.; Bianchi, M.L.; Stepan, J.; Fuleihan, G.E.-H.; Bouillon, R. Current vitamin D status in European and Middle East countries and strategies to prevent vitamin D deficiency: A position statement of the European Calcified Tissue Society. Eur. J. Endocrinol. 2019, 180, P23–P54. [Google Scholar] [CrossRef] [PubMed] [Green Version]
- Pérez-Barrios, C.; Hernández-Álvarez, E.; Blanco–Navarro, I.; Pérez-Sacristán, B.; Granado-Lorencio, F. Prevalence of hypercalcemia related to hypervitaminosis D in clinical practice. Clin. Nutr. 2016, 35, 1354–1358. [Google Scholar] [CrossRef]
- Taylor, P.N.; Davies, J.S. A review of the growing risk of vitamin D toxicity from inappropriate practice. Br. J. Clin. Pharmacol. 2018, 84, 1121–1127. [Google Scholar] [CrossRef] [Green Version]
- Jiang, P.; Lv, Q.; Lai, T.; Xu, F. Does Hypomagnesemia Impact on the Outcome of Patients Admitted to the Intensive Care Unit? A Systematic Review and Meta-Analysis. Shock 2017, 47, 288–295. [Google Scholar] [CrossRef]
- Hansen, B.-A.; Bruserud, Ø. Hypomagnesemia in critically ill patients. J. Intensiv. Care 2018, 6, 1–11. [Google Scholar] [CrossRef] [Green Version]
- Catalano, A.; Bellone, F.; Chila, D.; Loddo, S.; Corica, F. Magnesium disorders: Myth or facts? Eur. J. Intern. Med. 2019, 70, e22–e24. [Google Scholar] [CrossRef]
- Van Laecke, S. Hypomagnesemia and hypermagnesemia. Acta Clin. Belg. 2018, 74, 41–47. [Google Scholar] [CrossRef] [PubMed]
- Yang, Y.; Zhang, P.; Cui, Y.; Lang, X.B.; Yuan, J.; Jiang, H.; Lei, W.H.; Lv, R.; Zhu, Y.L.; Lai, E.Y.; et al. Hypophosphatemia during continuous veno-venous hemofiltration is associated with mortality in critically ill patients with acute kidney injury. Crit. Care 2013, 17, R205. [Google Scholar] [CrossRef] [PubMed] [Green Version]
- Haider, D.G.; Lindner, G.; Wolzt, M.; Ahmad, S.S.; Sauter, T.C.; Leichtle, A.B.; Fiedler, G.-M.; Fuhrmann, V.; Exadaktylos, A.K. Hyperphosphatemia Is an Independent Risk Factor for Mortality in Critically Ill Patients: Results from a Cross-Sectional Study. PLoS ONE 2015, 10, e0133426. [Google Scholar] [CrossRef] [PubMed] [Green Version]
- Wang, L.; Xiao, C.; Chen, L.; Zhang, X.; Kou, Q. Impact of hypophosphatemia on outcome of patients in intensive care unit: A retrospective cohort study. BMC Anesthesiol. 2019, 19, 86. [Google Scholar] [CrossRef]
- Tonelli, M.; Sacks, F.; Pfeffer, M.; Gao, Z.; Curhan, G. Relation Between Serum Phosphate Level and Cardiovascular Event Rate in People with Coronary Disease. Circulation 2005, 112, 2627–2633. [Google Scholar] [CrossRef] [PubMed] [Green Version]
- Talakoub, R.; Bahrami, M.; Honarmand, A.; Abbasi, S.; Gerami, H. The Predicting Ability of Serum Phosphorus to Assess the Duration of Mechanical Ventilation in Critically Ill Patients. Adv. Biomed. Res. 2017, 6, 51. [Google Scholar] [CrossRef] [PubMed]


| Departments | Percentage of Patients (%) |
|---|---|
| Diabetology | 6.10 |
| Cardiology | 5.20 |
| General Surgery | 2.92 |
| Endocrinology | 4.59 |
| Hematology and Oncology | 21.12 |
| Nephrology | 4.65 |
| Neurology | 4.65 |
| Laryngology | 1.20 |
| Intensive Care | 4.00 |
| Gastroenterological Surgery | 7.53 |
| Vascular Surgery | 3.59 |
| Hepatic Surgery | 7.13 |
| Neurosurgery | 2.05 |
| Cardiosurgery | 1.31 |
| Hypertensiology and Internal Medicine | 3.36 |
| Gastroenterology | 5.11 |
| Pneumonology | 2.73 |
| Nephrology and Dialysis | 5.43 |
| Hepatology | 7.34 |
| Calcium | Magnesium | Phosphates | Vitamin D | |
|---|---|---|---|---|
| Number of patients | 4107 | 31,680 | 22,707 | 7956 |
| Sex | 40% male | 52% male | 52% male | 37% male |
| Age (years), mean ± SD | 74.76 ± 7.6 | 75.0 ± 7.68 | 75 ± 7.4 | 74.4 ± 7.9 |
| Mean Concentration ± SD | 2.4 ± 0.2 mmol/L | 0.82 ± 0.14 mmol/L | 1.19 ± 0.4 mmol/L | 33 ± 23.5 ng/ml |
| Median | 2.39 mmol/L | 0.82 mmol/L | 1.125 mmol/L | 28.2 ng/ml |
| Minimum–maximum | 1.56–4.33 mmol/L | 0.14–3.14 mmol/L | 0.11–6.04 mmol/L | 3.03–149.54 ng/ml |
| Hypoconcentration | 18.5% | 26% | 11% | 54% |
| Hyperconcentration | 5% | 7% | 15% | 16% |
| Median Calcium Concentration | p | |
|---|---|---|
| Age group, 64–74 | 2.400 | <0.05 |
| Age group, 75–84 | 2.379 | |
| Age group, 65–74 | 2.400 | 0.3 |
| Age group, 85–94 | 2.390 | |
| Age group, 65–74 | 2.400 | 1 |
| Age group, ≥95 | 2.420 | |
| Age group, 75–84 | 2.379 | 1 |
| Age group, 85–94 | 2.390 | |
| Age group, 75–84 | 2.379 | 1 |
| Age group, ≥95 | 2.420 | |
| Age group, 85–94 | 2.390 | 1 |
| Age group, ≥95 | 2.420 |
| Median Phosphate Concentration | p | |
|---|---|---|
| Age group, 64–74 | 1.18 | 1 |
| Age group, 75–84 | 1.19 | |
| Age group, 65–74 | 1.18 | <0.05 |
| Age group, 85–94 | 1.2 | |
| Age group, 65–74 | 1.18 | 1 |
| Age group, ≥95 | 1.2 | |
| Age group, 75–84 | 1.19 | <0.05 |
| Age group, 85–94 | 1.2 | |
| Age group, 75–84 | 1.19 | 1 |
| Age group, ≥95 | 1.2 | |
| Age group, 85–94 | 1.2 | 1 |
| Age group, ≥95 | 1.2 |
| Median Vitamin D Concentration | p | |
|---|---|---|
| Age group, 64–74 | 32.9 | 0.4 |
| Age group, 75–84 | 34.0 | |
| Age group, 65–74 | 32.9 | <0.00001 |
| Age group, 85–94 | 31.0 | |
| Age group, 65–74 | 32.9 | <0.00001 |
| Age group, ≥95 | 22.4 | |
| Age group, 75–84 | 34.0 | <0.000001 |
| Age group, 85–94 | 31.0 | |
| Age group, 75–84 | 34.0 | <0.00001 |
| Age group, ≥95 | 22.4 | |
| Age group, 85–94 | 31.0 | <0.001 |
| Age group, ≥95 | 22.4 |
Publisher’s Note: MDPI stays neutral with regard to jurisdictional claims in published maps and institutional affiliations. |
© 2021 by the authors. Licensee MDPI, Basel, Switzerland. This article is an open access article distributed under the terms and conditions of the Creative Commons Attribution (CC BY) license (https://creativecommons.org/licenses/by/4.0/).
Share and Cite
Malinowska, J.; Małecka-Giełdowska, M.; Ciepiela, O. Dysmagnesemia Is the Most Common Disturbance of the Calcium–Magnesium–Phosphorous Balance among Older Hospitalized People in Warsaw. Nutrients 2021, 13, 3395. https://doi.org/10.3390/nu13103395
Malinowska J, Małecka-Giełdowska M, Ciepiela O. Dysmagnesemia Is the Most Common Disturbance of the Calcium–Magnesium–Phosphorous Balance among Older Hospitalized People in Warsaw. Nutrients. 2021; 13(10):3395. https://doi.org/10.3390/nu13103395
Chicago/Turabian StyleMalinowska, Justyna, Milena Małecka-Giełdowska, and Olga Ciepiela. 2021. "Dysmagnesemia Is the Most Common Disturbance of the Calcium–Magnesium–Phosphorous Balance among Older Hospitalized People in Warsaw" Nutrients 13, no. 10: 3395. https://doi.org/10.3390/nu13103395
APA StyleMalinowska, J., Małecka-Giełdowska, M., & Ciepiela, O. (2021). Dysmagnesemia Is the Most Common Disturbance of the Calcium–Magnesium–Phosphorous Balance among Older Hospitalized People in Warsaw. Nutrients, 13(10), 3395. https://doi.org/10.3390/nu13103395