Fibre Intake Is Associated with Cardiovascular Health in European Children

 , , , ,
  , ,
, ,
Abstract
1. Introduction
2. Materials and Methods
2.1. Study Design and Population
2.2. Dietary Intake Assessment
2.3. Health Variables
2.3.1. Anthropometry
2.3.2. Blood Pressure
2.3.3. Blood Sample Parameters
2.3.4. Cardiometabolic Risk Assessment
2.4. Ethics
2.5. Statistical Analyses
3. Results
3.1. Dietary Intake
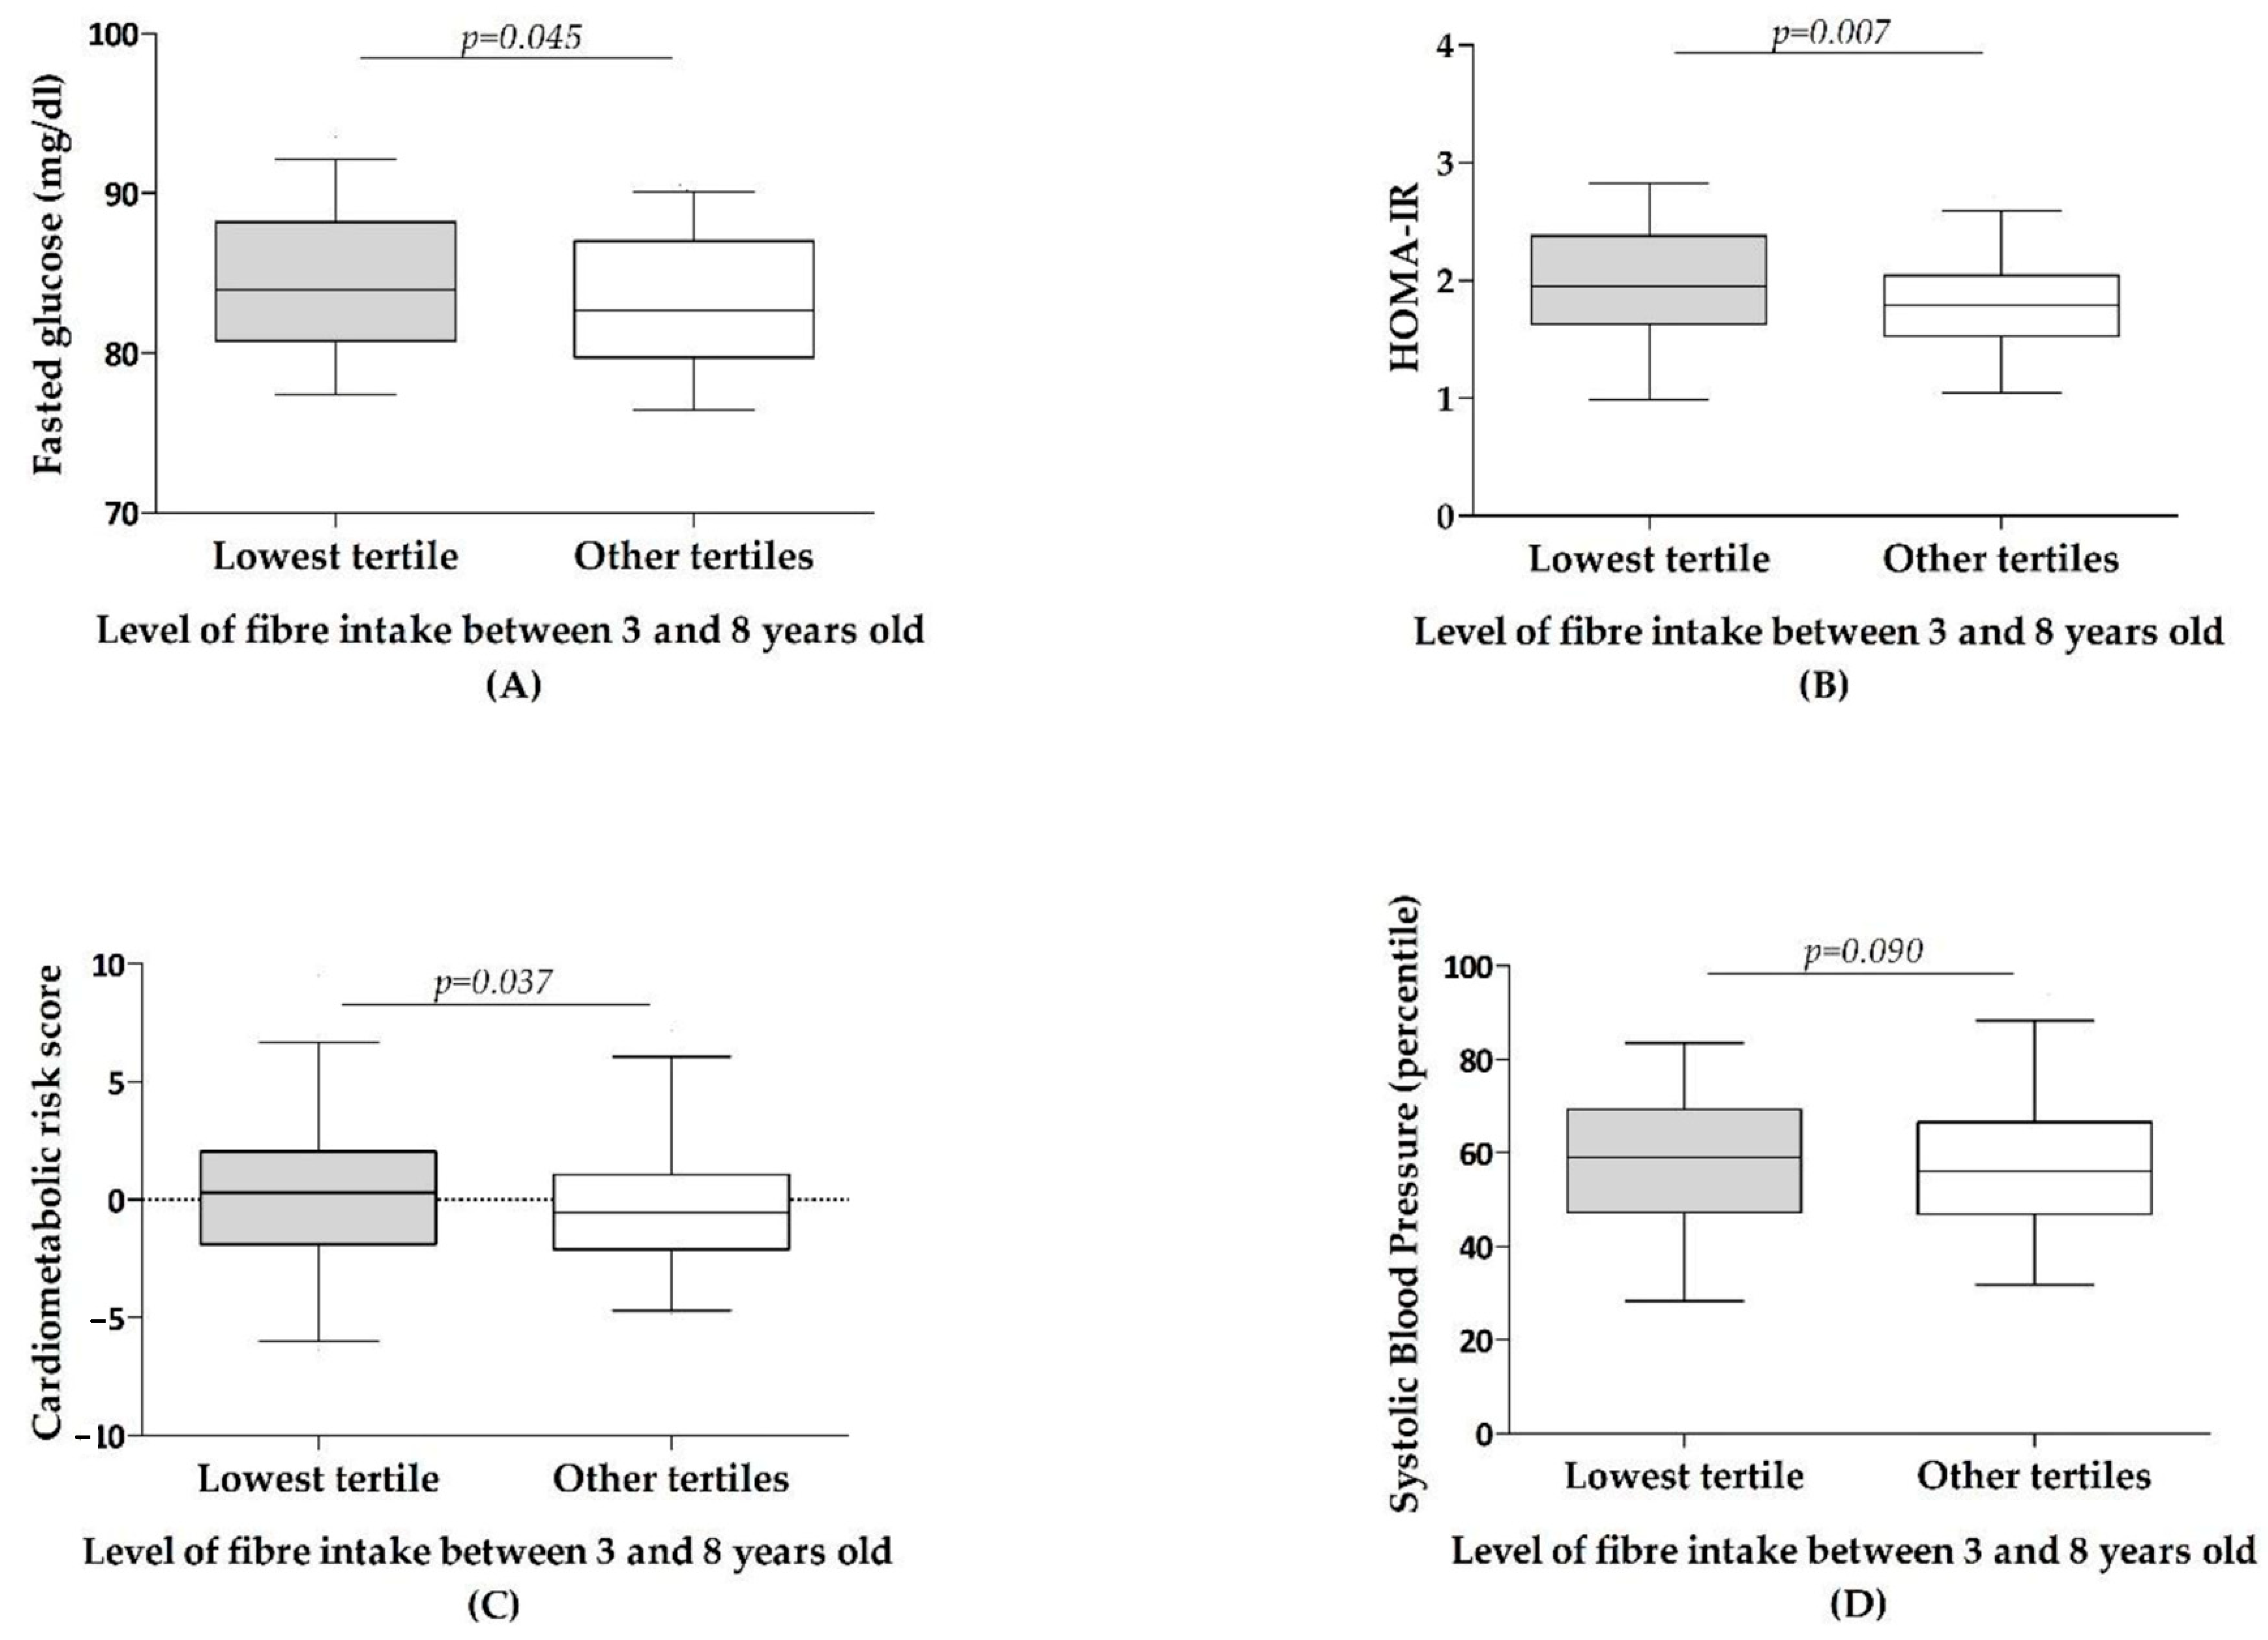
3.2. Association between Dietary Fibre Intake and Health in Children—Cross-Sectional Analyses
3.3. Fibre Intake According to Dietary Source and Association to Health—Cross-Sectional Analyses
3.4. Association between Dietary Fibre Intake and Health in Children—Longitudinal Analyses
4. Discussion
5. Conclusions
Author Contributions
Funding
Data Availability Statement
Acknowledgments
Conflicts of Interest
Appendix A. Description of The Study Sample and Comparison by Sex

| Energy (kcal/Day) Mean (±SD) | Proteins (g/Day) Mean (±SD) | Lipids (g/Day) Mean (±SD) | Carbohydrates (g/Day) Mean (±SD) | Total Fibre (g/Day) Mean (±SD) | Total Fibre (g/1000 kcal) Mean (±SD) | |
|---|---|---|---|---|---|---|
| Boys | ||||||
| 3 years, n = 253 | 1264 (1086, 1437) | 48.82 (39.62, 56.45) | 48.02 (39.36, 57.40) | 154.19 (129.74, 183.76) | 8.36 (6.04, 11.26) | 6.83 (5.19, 8.41) |
| 4 years, n = 253 | 1340 (1183, 1513) | 49.28 (41.15, 58.24) | 51.86 (43.20, 63.20) | 165.34 (143.97, 190.78) | 9.23 (7.08, 11.11) | 6.71 (5.33, 8.20) |
| 5 years, n = 217 | 1436 (1253, 1622) | 52.58 (45.62, 61.71) | 54.63 (44.61, 65.60) | 180.19 (150.28, 208.32) | 9.58 (7.48, 11.46) | 6.72 (5.36, 7.97) |
| 6 years, n = 227 | 1476 (1322, 1680) | 55.31 (47.28, 63.72) | 56.71 (48.88, 66.77) | 186.89 (162.88, 212.34) | 10.50 (8.56, 12.99) | 6.92 (5.83, 8.48) |
| 8 years, n = 193 | 1690 (1464, 1850) | 62.50 (52.87, 73.80) | 68.81 (56.48, 79.93) | 201.43 (172.33, 229.58) | 11.95 (9.88, 14.51) | 7.33 (6.07, 8.58) |
| Girls | ||||||
| 3 years, n = 281 | 1172 (1028, 1341) Φ | 44.71 (37.64, 52.32) ‡ | 45.89 (37.19, 53.65) ‡ | 144.72 (125.29, 168.39) ‡ | 7.67 (6.02, 9.98) | 6.66 (5.22, 8.13) |
| 4 years, n = 251 | 1262 (1138, 1405) ‡ | 47.54 (40.94, 56.31) | 50.00 (41.66, 57.80) * | 156.66 (137.69, 178.85) ‡ | 8.82 (7.01, 10.92) | 6.89 (5.44, 8.45) |
| 5 years, n = 230 | 1378 (1202, 1536) ‡ | 49.73 (41.11, 58.74) * | 53.60 (43.96, 61.65) | 170.42 (141.46, 194.76) ‡ | 9.48 (7.38, 12.01) | 7.13 (5.96, 8.48) |
| 6 years, n = 242 | 1465 (1270, 1615) | 54.36 (45.64, 61.35) | 56.39 (47.22, 66.33) | 179.88 (153.72, 203.71) * | 10.50 (8.12, 12.76) | 7.38 (5.75, 8.42) |
| 8 years, n = 207 | 1532 (1360, 1689) Φ | 56.36 (48.54, 64.86) Φ | 59.23 (51.10, 72.61) Φ | 182.05 (156.95, 210.66) Φ | 11.04 (9.17, 13.66) * | 7.19 (6.18, 9.16) |
| Insoluble | Soluble | Resistant Starch | Fibre from Pulses and Nuts | |||||
|---|---|---|---|---|---|---|---|---|
| g/Day | g/1000 kcal | g/Day | g/1000 kcal | g/Day | g/1000 kcal | g/Day | g/1000 kcal | |
| Boys | ||||||||
| 3 years, n = 253 | 3.55 (2.31, 4.55) | 2.77 (1.91, 3.69) | 3.38 (1.96, 5.10) | 2.70 (1.64, 4.16) | 0.39 (0.11, 0.75) | 0.32 (0.09, 0.56) | 0.00 (0.00, 0.00) | 0.00 (0.00, 0.00) |
| 4 years, n = 253 | 3.67 (2.63, 4.89) | 2.79 (2.10, 3.64) | 3.79 (2.41, 5.42) | 2.78 (1.76, 3.85) | 0.43 (0.14, 0.78) | 0.32 (0.11, 0.57) | 0.00 (0.00, 0.01) | 0.00 (0.00, 0.01) |
| 5 years, n = 217 | 4.16 (3.30, 5.37) | 2.99 (2.39, 3.56) | 3.88 (2.39, 5.55) | 2.66 (1.62, 3.78) | 0.41 (0.12, 0.78) | 0.29 (0.08, 0.53) | 0.00 (0.00, 0.01) | 0.00 (0.00, 0.01) |
| 6 years, n = 227 | 4.89 (3.85, 6.04) | 3.18 (2.65, 3.96) | 3.66 (2.41, 6.01) | 2.59 (1.69, 3.80) | 0.47 (0.14, 0.95) | 0.32 (0.09, 0.66) | 0.00 (0.00, 0.00) | 0.00 (0.00, 0.00) |
| 8 years, n = 193 | 5.94 (4.67, 7.49) | 3.55 (2.85, 4.31) | 4.19 (2.83, 5.98) | 2.57 (1.76, 3.58) | 0.59 (0.17, 1.09) | 0.35 (0.10, 0.63) | 0.00 (0.00, 0.08) | 0.00 (0.00, 0.03) |
| Girls | ||||||||
| 3 years, n = 281 | 3.17 (2.34, 4.31) | 2.70 (2.08, 3.58) | 0.35 (0.09, 0.61) | 0.29 (0.08, 0.51) | 3.19 (2.02, 4.75) | 2.76 (1.78, 3.94) | 0.00 (0.00, 0.00) | 0.00 (0.00, 0.00) |
| 4 years, n = 251 | 3.69 (2.63, 5.04) | 2.90 (2.26, 3.73) | 3.81 (2.39, 5.14) | 2.97 (1.82, 3.91) | 0.37 (0.00, 0.64) * | 0.28 (0.00, 0.48) | 0.00 (0.00, 0.00) | 0.00 (0.00, 0.00) |
| 5 years, n = 230 | 4.14 (3.12, 5.39) | 3.12 (2.43, 3.91) | 3.63 (2.43, 5.34) | 2.69 (1.88, 3.93) | 0.35 (0.00, 0.72) | 0.25 (0.00, 0.51) | 0.00 (0.00, 0.01) | 0.00 (0.00, 0.01) |
| 6 years, n = 242 | 4.63 (3.38, 5.73) | 3.16 (2.45, 3.94) | 3.95 (2.47, 5.90) | 2.74 (1.77, 3.86) | 0.39 (0.08, 0.78) * | 0.29 (0.05, 0.53) | 0.00 (0.00, 0.01) | 0.00 (0.00, 0.01) |
| 8 years, n = 207 | 5.54 (4.45, 7.06) | 3.60 (2.95, 4.57) | 2.58 (1.68, 3.80) | 3.93 (2.38, 5.45) | 0.52 (0.18, 0.95) | 0.34 (0.12, 0.67) | 0.00 (0.00, 0.01) | 0.00 (0.00, 0.00) |
Appendix B
| B | 95% CI (Min, Max) | p-Value | R2 | ||
|---|---|---|---|---|---|
| Unadjusted analyses | BMI z score | 0.076 | (0.000, 0.151) | 0.049 | 0.011 |
| Glucose (mg/dL) | −0.004 | (−0.006, −0.001) | 0.002 | 0.032 | |
| LDL cholesterol (mg/dL) | −1.434 | (−2.928, 0.060) | 0.060 | 0.010 | |
| HDL cholesterol (mg/dL) | −0.004 | (−0.011, 0.003) | 0.260 | 0.001 | |
| Triglycerides (mg/dL) | −0.004 | (−0.014, 0.005) | 0.392 | −0.001 | |
| HOMA-IR | −0.009 | (−0.019, 0.001) | 0.092 | 0.007 | |
| Systolic Blood Pressure (mmHg) | −2.126 | (−3.770, −0.482) | 0.011 | 0.020 | |
| Cardiometabolic risk score | −0.195 | (−0.432, 0.042) | 0.107 | 0.006 | |
| Adjusted analyses | BMI z score | 0.078 | (0.004, 0.152) | 0.039 | 0.048 |
| Glucose (mg/dL) | −0.002 | (−0.004, 0.000) | 0.064 | 0.257 | |
| LDL cholesterol (mg/dL) | −1.417 | (−2.922, 0.087) | 0.065 | 0.026 | |
| HDL cholesterol (mg/dL) | −0.006 | (−0.012, 0.001) | 0.075 | 0.180 | |
| Triglycerides (mg/dL) | −0.001 | (−0.010, 0.008) | 0.857 | 0.191 | |
| HOMA-IR | −0.006 | (−0.015, 0.003) | 0.167 | 0.347 | |
| Systolic Blood Pressure (mmHg) | −1.996 | (−3.495, −0.496) | 0.009 | 0.255 | |
| Cardiometabolic risk score | −0,149 | (−0.327, 0.029) | 0.101 | 0.489 | |
References
- Luque, V.; Escribano, J.; Closa-Monasterolo, R.; Zaragoza-Jordana, M.; Ferré, N.; Grote, V.; Koletzko, B.; Totzauer, M.; Verduci, E.; ReDionigi, A.; et al. Unhealthy Dietary Patterns Established in Infancy Track to Mid-Childhood: The EU Childhood Obesity Project. J. Nutr. 2018, 148, 752–759. [Google Scholar] [CrossRef] [PubMed]
- Van Gijssel, R.M.A.; Braun, K.V.E.; Kiefte-de Jong, J.C.; Jaddoe, V.W.V.; Franco, O.H.; Voortman, T. Associations between dietary fiber intake in infancy and cardiometabolic health at school age: The generation R study. Nutrients 2016, 8, 531. [Google Scholar] [CrossRef] [PubMed]
- Stephen, A.M.; Champ, M.M.J.; Cloran, S.J.; Fleith, M.; Van Lieshout, L.; Mejborn, H.; Burley, V.J. Dietary fibre in Europe: Current state of knowledge on definitions, sources, recommendations, intakes and relationships to health. Nutr. Res. Rev. 2017, 30, 149–190. [Google Scholar] [CrossRef] [PubMed]
- Aggett, P.J.; Agostoni, C.; Axelsson, I.; Edwards, C.A.; Goulet, O.; Hernell, O.; Koletzko, B.; Lafeber, H.N.; Micheli, J.L.; Michaelsen, K.F.; et al. Nondigestible carbohydrates in the diets of infants and young children: A commentary by the ESPGHAN committee on nutrition. J. Pediatr. Gastroenterol. Nutr. 2003, 36, 329–337. [Google Scholar] [CrossRef] [PubMed]
- Kim, Y. AGA technical review: Impact of dietary fiber on colon cancer occurrence. Gastroenterology 2000, 118, 1235–1257. [Google Scholar] [CrossRef]
- Escudero Álvarez, E.; González Sánchez, P. La fibra dietética. Nutr. Hosp. 2006, 21, 61–72. [Google Scholar]
- Peris, G.P.; Lesmes, B.; Cuerda, C.M.; Alvarez, C. Metabolismo colónico de la fibra. Nutr. Hosp. 2002, 17, 11–16. [Google Scholar]
- Trautwein, E.A.; Kunath-Rau, A.; Erbersdobler, H.F. Increased fecal bile acid excretion and changes in the circulating bile acid pool are involved in the hypocholesterolemic and gallstone-preventive actions of psyllium in hamsters. J. Nutr. 1999, 129, 896–902. [Google Scholar] [CrossRef]
- Gibson, G.R. Fibre and effects on probiotics (the prebiotic concept). Clin. Nutr. Suppl. 2004, 1, 25–31. [Google Scholar] [CrossRef]
- Galisteo, M.; Duarte, J.; Zarzuelo, A. Effects of dietary fibers on disturbances clustered in the metabolic syndrome. J. Nutr. Biochem. 2008, 19, 71–84. [Google Scholar] [CrossRef] [PubMed]
- Velázquez, O.C.; Zhou, D.; Seto, R.W.; Jabbar, A.; Choi, J.; Lederer, H.M.; Rombeau, J.L. In vivo crypt surface hyperproliferation is decreased by butyrate and increased by deoxycholate in normal rat colon: Associated in vivo effects on c-fos and c-jun expression. J. Parenter. Enter. Nutr. 1996, 20, 243–250. [Google Scholar] [CrossRef] [PubMed]
- Inan, M.S.; Rasoulpour, R.J.; Yin, L.; Hubbard, A.K.; Rosenberg, D.W.; Giardina, C. The luminal short-chain fatty acid butyrate modulates NF-κB activity in a human colonic epithelial cell line. Gastroenterology 2000, 118, 724–734. [Google Scholar] [CrossRef]
- Eckel, R.H.; Grundy, S.M.; Zimmet, P.Z. The metabolic syndrome. Lancet 2005, 365, 1415–1428. [Google Scholar] [CrossRef]
- Slavin, J. Fiber and prebiotics: Mechanisms and health benefits. Nutrients 2013, 5, 1417–1435. [Google Scholar] [CrossRef]
- Simpson, H.L.; Campbell, B.J. Review article: Dietary fibre-microbiota interactions. Aliment. Pharmacol. Ther. 2015, 42, 158–179. [Google Scholar] [CrossRef]
- Andoh, A.; Tsujikawa, T.; Fujiyama, Y. Role of Dietary Fiber and Short-Chain Fatty Acids in the Colon. Curr. Pharm. Des. 2005, 9, 347–358. [Google Scholar] [CrossRef]
- Chandalia, M.; Garg, A.; Lutjohann, D.; Von Bergmann, K.; Grundy, S.M.; Brinkley, L.J. Beneficial effects of high dietary fiber intake in patients with type 2 diabetes mellitus. N. Engl. J. Med. 2000, 342, 1392–1398. [Google Scholar] [CrossRef]
- Davy, B.M.; Melby, C.L. The effect of fiber-rich carbohydrates on features of Syndrome X. J. Am. Diet. Assoc. 2003, 103, 86–96. [Google Scholar] [CrossRef]
- Murphy, N.; Norat, T.; Ferrari, P.; Jenab, M.; Bueno-de-Mesquita, B.; Skeie, G.; Dahm, C.C.; Overvad, K.; Olsen, A.; Tjønneland, A.; et al. Dietary fibre intake and risks of cancers of the colon and rectum in the European prospective investigation into cancer and nutrition (EPIC). PLoS ONE 2012, 7, e39361. [Google Scholar] [CrossRef]
- Slavin, J.L. Position of the American Dietetic Association: Health implications of dietary fiber. J. Am. Diet. Assoc. 2008, 108, 1716–1731. [Google Scholar]
- European Food Safety Authority Scientific Opinion on Dietary Reference Values for carbohydrates and dietary fibre. EFSA J. 2010, 8, 1462.
- Amine, E.K.; Baba, N.H.; Belhadj, M.; Deurenberg-Yap, M.; Djazayery, A.; Forrestre, T.; Galuska, D.A.; Herman, S.; James, W.P.T.; M’Buyamba Kabangu, J.R.; et al. Diet, nutrition and the prevention of chronic diseases. World Health Organ. Tech. Rep. Ser. 2003, 916, 1–149. [Google Scholar]
- Fulgoni, V.L.; Brauchla, M.; Fleige, L.; Chu, Y.F. Association of whole-grain and dietary fiber intake with cardiometabolic risk in children and adolescents. Nutr. Health 2020, 26, 243–251. [Google Scholar] [CrossRef] [PubMed]
- White, J.; Jago, R.; Thompson, J.L. Dietary risk factors for the development of insulin resistance in adolescent girls: A 3-year prospective study. Public Health Nutr. 2012, 17, 361–368. [Google Scholar] [CrossRef] [PubMed]
- Weber, M.; Grote, V.; Closa-monasterolo, R.; Escribano, J.; Langhendries, J.; Dain, E.; Giovannini, M.; Verduci, E.; Gruszfeld, D.; Socha, P.; et al. Lower protein content in infant formula reduces BMI and obesity risk at school age: Follow-up of a randomized trial. Am. J. Clin. Nutr. 2014, 99, 1041–1051. [Google Scholar] [CrossRef]
- Koletzko, B.; Kries, V.; Closa, R.; Escribano, J.; Scaglioni, S.; Giovannini, M.; Beyer, J.; Demmelmair, H.; Gruszfeld, D.; Dobrzanska, A.; et al. Lower protein in infant formula is associated with lower weight up to age 2 y: A randomized clinical trial. Am. J. Clin. Nutr. 2009, 89, 1836–1845. [Google Scholar]
- Verwied-Jorky, S.; Schiess, S.; Luque, V.; Grote, V.; Scaglioni, S.; Vecchi, F.; Martin, F.; Stolarczyk, A.; Koletzko, B. Methodology for longitudinal assessment of nutrient intake and dietary habits in early childhood in a transnational multicenter study. J. Pediatr. Gastroenterol. Nutr. 2011, 52, 96–102. [Google Scholar] [CrossRef]
- Luque, V.; Escribano, J.; Mendez-Riera, G.; Schiess, S.; Koletzko, B.; Verduci, E.; Stolarczyk, A.; Martin, F.; Closa-Monasterolo, R. Methodological Approaches for Dietary Intake Assessment in Formula-fed Infants. J. Pediatr. Gastroenterol. Nutr. 2013, 56, 320–327. [Google Scholar] [CrossRef]
- Dehne, L.I.; Klemm, C.; Henseler, G.; Hermann-Kunz, E. The German Food Code and Nutrient Data Base (BLS II.2). Eur. J. Epidemiol. 1999, 15, 355–358. [Google Scholar] [CrossRef]
- Food and Nutrition Board; Institute of Medicine of the National Academies. Dietary, functional and total fiber. In Dietary Reference Intakes for Energy, Carbohydrate, Fiber, Fat, Fatty Acids, Cholesterol, Protein, and Amino Acids (Macronutrients); The National Academies Press: Washington, DC, USA, 2005; pp. 339–421. [Google Scholar]
- De Onis, M.; Onyango, A.W.; Borghi, E.; Siyam, A.; Nishida, C.; Siekmann, J. Development of a WHO growth reference for school-aged children and adolescents. Bull. World Health Organ. 2007, 85, 660–667. [Google Scholar] [CrossRef]
- Flynn, J.T.; Falkner, B.E. New clinical practice guideline for the management of high blood pressure in children and adolescents. Hypertension 2017, 70, 683–686. [Google Scholar] [CrossRef] [PubMed]
- Miller, W.G.; Myers, G.L.; Sakurabayashi, I.; Bachmann, L.M.; Caudill, P.; Dziekonski, A.; Edwards, S.; Kimberly, M.M.; Korzum, W.J.; Leary, E.T.; et al. Seven direct methods for measuring HDL and LDL cholesterol compared with ultracentrifugation reference measurement procedures. Clin. Chem. 2015, 56, 977–986. [Google Scholar] [CrossRef] [PubMed]
- Friedewald, W.T.; Levy, R.I.; Fredrickson, D.S. Estimation of the concentration of low-density lipoprotein cholesterol in plasma, without use of the preparative ultracentrifuge. Clin. Chem. 1972, 18, 499–502. [Google Scholar] [CrossRef]
- Besch, W.; Woltanski, W.; Keilacker, H.; Díaz-Alonso, J.M.; Schulz, B.; Amendt, P.; Kohnert, K.D.; Ziegler, M. Measurement of Insulin in Human Sera Using a New RIA Kit. Insulin determination in the absence of insulin antibodies–Conventional assay and micro modification. Exp. Clin. Endocrinol. 1987, 90, 271–277. [Google Scholar] [CrossRef] [PubMed]
- Matthews, D.R.; Hosker, J.R.; Rudenski, A.S.; Naylor, B.A.; Treacher, D.F.; Turner, R.C.; Infirmary, R. Homeostasis model assessment: Insulin resistance and b-cell function from fasting plasma glucose and insulin concentrations in man. Diabetologia 1985, 28, 412–419. [Google Scholar] [CrossRef]
- Mclaughlin, T.; Abbasi, F.; Cheal, K.; Chu, J.; Lamendola, C.; Reaven, G. Use of Metabolic Markers To Identify Overweight individuals who are insulin resistant. Ann. Intern. Med. 2003, 139, 802–809. [Google Scholar] [CrossRef]
- Eisenmann, J.C. On the use of a continuous metabolic syndrome score in pediatric research. Cardiovasc. Diabetol. 2008, 7, 1–6. [Google Scholar] [CrossRef]
- Voortman, T.; van den Hooven, E.H.; Tielemans, M.J.; Hofman, A.; Kiefte-de Jong, J.C.; Jaddoe, V.W.V.; Franco, O.H. Protein intake in early childhood and cardiometabolic health at school age: The Generation R Study. Eur. J. Nutr. 2016, 55, 2117–2127. [Google Scholar] [CrossRef]
- World Medical Association. WMA Declaration of Helsinki—Ethica Principles for Medical Research Involving Human Subjects; World Medical Association: Ferney-Voltaire, France, 2013. [Google Scholar]
- Reynolds, A.; Mann, J.; Cummings, J.; Winter, N.; Mete, E.; Te Morenga, L. Carbohydrate quality and human health: A series of systematic reviews and meta-analyses. Lancet 2019, 393, 434–445. [Google Scholar] [CrossRef]
- Pereira, M.A.; O’Reilly, E.; Augustsson, K.; Brown, M.M. Dietary fiber and risk of coronary heart disease: A pooled analysis of cohort studies. Arch. Intern. Med. 2004, 164, 370–376. [Google Scholar] [CrossRef]
- Threapleton, D.E.; Greenwood, D.C.; Evans, C.; Cleghorn, C.L.; Nykjaer, C.; Woodhead, C.; Burley, V.J. Dietary fibre intake and diabetes risk: A systematic review and meta-analysis of prospective studies. Proc. Nutr. Soc. 2013, 72, 2020. [Google Scholar] [CrossRef]
- Battista, M.; Murray, R.D.; Daniels, S.R. Use of the metabolic syndrome in pediatrics: A blessing and a curse. Semin. Pediatr. Surg. 2009, 18, 136–143. [Google Scholar] [CrossRef]
- Ford, E.S.; Li, C. Defining the Metabolic Syndrome in Children and Adolescents: Will the Real Definition Please Stand Up? J. Pediatr. 2008, 152, 160–164. [Google Scholar] [CrossRef] [PubMed]
- Kynde, I.; Johnsen, N.F.; Wedderkopp, N.; Bygbjerg, I.C.; Helge, J.W.; Heitmann, B.L. Intake of total dietary sugar and fibre is associated with insulin resistance among Danish 8-10- and 14-16-year-old girls but not boys. European Youth Heart Studies i and II. Public Health Nutr. 2010, 13, 1669–1674. [Google Scholar] [CrossRef]
- Gopinath, B.; Flood, V.M.; Rochtchina, E.; Baur, L.A.; Smith, W.; Mitchell, P. Diet and Blood Pressure Influence of High Glycemic Index and Glycemic Load Diets on Blood Pressure During Adolescence. Hypertension 2012, 59, 1272–1277. [Google Scholar] [CrossRef] [PubMed]
- Veldhuis, L.; Koppes, L.L.J.; Driessen, M.T.; Samoocha, D.; Twisk, J.W.R. Effects of dietary fibre intake during adolescence on the components of the metabolic syndrome at the age of 36 years: The Amsterdam Growth and Health Longitudinal Study. J. Hum. Nutr. Diet. 2010, 23, 601–608. [Google Scholar] [CrossRef] [PubMed]
- Ruottinen, S.; Lagström, H.K.; Niinikoski, H.; Rönnemaa, T.; Saarinen, M.; Pahkala, K.A.; Hakanen, M.; Viikari, J.S.A.; Simell, O. Dietary fiber does not displace energy but is associated with decreased serum cholesterol concentrations in healthy children. Am. J. Clin. Nutr. 2010, 91, 651–661. [Google Scholar] [CrossRef] [PubMed]
- Schiess, S.; Grote, V.; Scaglioni, S.; Luque, V.; Martin, F.; Stolarczyk, A.; Vecchi, F.; Koletzko, B. Introduction of complementary feeding in 5 European countries. J. Pediatr. Gastroenterol. Nutr. 2010, 50, 92–98. [Google Scholar] [CrossRef] [PubMed]
- Satija, A.; Hu, F.B. Cardiovascular Benefits of Dietary Fiber. Curr. Atheroscler. Rep. 2012, 14, 505–514. [Google Scholar] [CrossRef]
- Edwards, C.A.; Parrett, A.M. Dietary fibre in infancy and childhood. Proc. Nutr. Soc. 2003, 62, 17–23. [Google Scholar] [CrossRef]
- Yao, B.; Fang, H.; Xu, W.; Yan, Y.; Xu, H.; Liu, Y.; Mo, M.; Zhang, H.; Zhao, Y. Dietary fiber intake and risk of type 2 diabetes: A dose-response analysis of prospective studies. Eur. J. Epidemiol. 2014, 29, 79–88. [Google Scholar] [CrossRef] [PubMed]
- Almaraz, R.S.; Fuentes, M.M.; Milla, S.P.; Plaza, B.L. Indicaciones de diferentes tipos de fibra en distintas patologías. Nutr. Hosp. 2015, 31, 2372–2383. [Google Scholar]
- Fernandez, M.L. Soluble fiber and nondigestible carbohydrate effects on plasma lipids and cardiovascular risk. Curr. Opin. Lipidol. 2001, 12, 35–40. [Google Scholar] [CrossRef] [PubMed]
- Hollenberg, N.K. Effects on blood pressure of reduced dietary sodium and the dietary approaches to stop hypertension (DASH) diet: Editor’s comments. Curr. Hypertens. Rep. 2001, 3, 373. [Google Scholar]
- Ndanuko, R.N.; Tapsell, L.C.; Charlton, K.E.; Neale, E.P.; Batterham, M.J. Dietary patterns and blood pressure in adults: A systematic review and meta-analysis of randomized controlled trials. Adv. Nutr. 2016, 7, 76–89. [Google Scholar] [CrossRef]
- Chiavaroli, L.; Viguiliouk, E.; Nishi, S.K.; Mejia, S.B.; Rahelić, D.; Kahleová, H.; Salas-Salvadó, J.; Kendall, C.W.C.; Sievenpiper, J.L. DASH dietary pattern and cardiometabolic outcomes: An umbrella review of systematic reviews and meta-analyses. Nutrients 2019, 11, 338. [Google Scholar] [CrossRef]
- Després, J.P.; Lamarche, B.; Mauriège, P.; Cantin, B.; Dagenais, G.R.; Moorjani, S.; Lupien, P.J. Hyperinsulinemia as an independent risk factor for ischemic heart disease. N. Engl. J. Med. 1996, 334, 952–957. [Google Scholar] [CrossRef]
- Burke, V.; Hodgson, J.M.; Beilin, L.J.; Giangiulioi, N.; Rogers, P.; Puddey, I.B. Dietary Protein and Soluble Fiber Reduce Ambulatory Blood Pressure in Treated Hypertensives. Hypertension 2001, 38, 821–826. [Google Scholar] [CrossRef]
- Evans, C.E.L.; Greenwood, D.C.; Threapleton, D.E.; Cleghorn, C.L.; Nykjaer, C.; Woodhead, C.E.; Gale, C.P.; Burley, V.J. Effects of dietary fibre type on blood pressure: A systematic review and meta-analysis of randomized controlled trials of healthy individuals. J. Hypertens. 2015, 33, 897–911. [Google Scholar] [CrossRef]
- Mejia, S.B.; Kendall, C.W.C.; Viguiliouk, E.; Augustin, L.S.; Ha, V.; Cozma, A.I.; Mirrahimi, A.; Maroleanu, A.; Chiavaroli, L.; Leiter, L.A.; et al. Effect of tree nuts on metabolic syndrome criteria: A systematic review and meta-analysis of randomised controlled trials. BMJ Open 2014, 4. [Google Scholar] [CrossRef]
- Del Gobbo, L.C.; Falk, M.C.; Feldman, R.; Lewis, K.; Mozaffarian, D. Effects of tree nuts on blood lipids, apolipoproteins, and blood pressure: Systematic review, meta-analysis, and dose-response of 61 controlled intervention trials. Am. J. Clin. Nutr. 2015, 102, 1347–1356. [Google Scholar] [CrossRef]
- Jayalath, V.H.; De Souza, R.J.; Sievenpiper, J.L.; Ha, V.; Chiavaroli, L.; Mirrahimi, A.; Di Buono, M.; Bernstein, A.M.; Leiter, L.A.; Kris-Etherton, P.M.; et al. Effect of dietary pulses on blood pressure: A systematic review and meta-analysis of controlled feeding trials. Am. J. Hypertens. 2014, 27, 56–64. [Google Scholar] [CrossRef]
- Kim, Y.; Keogh, J.; Clifton, P.M. Nuts and cardio-metabolic disease: A review of meta-analyses. Nutrients 2018, 10, 1935. [Google Scholar] [CrossRef]
- Souza, R.G.M.; Gomes, A.C.; Naves, M.M.V.; Mota, J.F. Nuts and legume seeds for cardiovascular risk reduction: Scientific evidence and mechanisms of action. Nutr. Rev. 2015, 73, 335–347. [Google Scholar] [CrossRef]
- Kim, Y.; Keogh, J.B.; Clifton, P.M. Benefits of nut consumption on insulin resistance and cardiovascular risk factors: Multiple potential mechanisms of actions. Nutrients 2017, 9, 1271. [Google Scholar] [CrossRef]
- Lee, Y.P.; Puddey, I.B.; Hodgson, J.M. Protein, fibre and blood pressure: Potential benefit of legumes. Clin. Exp. Pharmacol. Physiol. 2008, 35, 473–476. [Google Scholar] [CrossRef]

| Energy (kcal/Day) Mean (±SD) | Proteins (g/Day) Mean (±SD) | Lipids (g/Day) Mean (±SD) | Carbohydrates (g/Day) Mean (±SD) | Total Fibre (g/Day) Mean (±SD) | Total Fibre (g/1000 kcal) Mean (±SD) | |
|---|---|---|---|---|---|---|
| 3 years, n = 534 | 1221 (243) | 47.0 (12.2) | 47.1 (12.8) | 152.6 (37.2) | 8.3 (3.3) | 6.9 (2.7) |
| 4 years, n = 504 | 1317 (249) | 50.0 (13.1) | 52.0 (14.4) | 163.2 (34.5) | 9.2 (3.4) | 7.1 (2.4) |
| 5 years, n = 447 | 1394 (268) | 52.1 (13.6) | 54.7 (14.4) | 174.5 (41.1) | 9.9 (3.5) | 7.2 (2.2) |
| 6 years, n = 469 | 1479 (253) | 55.2 (12.7) | 58.1 (14.3) | 184.8 (39.5) | 10.8 (3.6) | 7.3 (2.4) |
| 8 years, n = 400 | 1598 (304) | 61.1 (15.4) | 65.4 (17.8) | 192.4 (42.1) | 12.1 (4.0) | 7.7 (2.3) |
| Insoluble | Soluble | Resistant Starch | Fibre from Pulses and Nuts | |||||
|---|---|---|---|---|---|---|---|---|
| g/Day | g/1000 kcal | g/Day | g/1000 kcal | g/Day | g/1000 kcal | g/Day | g/1000 kcal | |
| 3 years, n = 531 | 3.32 (2.32, 4.41) | 2.73 (1.99, 3.62) | 3.27 (1.99, 4.98) | 2.72 (1.71, 4.08) | 0.36 (0.10, 0.66) | 0.30 (0.09, 0.54) | 0.00 (0.00, 0.00) | 0.00 (0.00, 0.00) |
| 4 years, n = 503 | 3.68 (2.63, 4.94) | 2.86 (2.15, 3.69) | 3.80 (2.41, 5.24) | 2.87 (1.79, 3.89) | 0.39 (0.07, 0.73) | 0.30 (0.05, 0.53) | 0.00 (0.00, 0.01) | 0.00 (0.00, 0.00) |
| 5 years, n = 445 | 4.15 (3.21, 5.38) | 3.06 (2.41, 3.73) | 3.76 (2.43, 5.47) | 2.65 (1.77, 3.84) | 0.39 (0.07, 0.73) | 0.27 (0.05, 0.52) | 0.00 (0.00, 0.01) | 0.00 (0.00, 0.01) |
| 6 years, n = 468 | 4.78 (3.64, 5.85) | 3.17 (2.57, 3.94) | 3.85 (2.46, 5.93) | 2.65 (1.73, 3.85) | 0.41 (0.10, 0.87) | 0.30 (0.07, 0.59) | 0.00 (0.00, 0.01) | 0.00 (0.00, 0.00) |
| 8 years, n = 399 | 5.68 (4.53, 7.23) | 3.60 (2.94, 4.49) | 4.03 (2.61, 5.80) | 2.58 (1.72, 3.65) | 0.55 (0.18, 1.02) | 0.35 (0.11, 0.63) | 0.00 (0.00, 0.02) | 0.00 (0.00, 0.01) |
| All | Boys | Girls | |
|---|---|---|---|
| Anthropometry | Mean (±SD) | Mean (±SD) | Mean (±SD) |
| Weight (kg) | 28.6 (6.1) | 28.7 (6.6) | 28.6 (5.7) |
| Height (cm) | 129.6 (5.7) | 130.2 (5.8) | 129.0 (5.6) * |
| BMI (kg/m2) | 16.9 (2.6) | 16.8 (2.8) | 17.0 (2.4) |
| Abdominal circumference (cm) | 59.4 (7.3) | 59.5 (7.5) | 59.3 (7.1) |
| Weight for age (z score) | 0.59 (1.19) | 0.59 (1.31) | 0.60 (1.07) |
| Height for age (z score) | 0.43 (0.99) | 0.47 (1.03) | 0.39 (0.96) |
| BMI for age (z score) | 0.46 (1.21) | 0.40 (1.37) | 0.52 (1.04) |
| Biochemical Parameters | Mean (±SD) | Mean (±SD) | Mean (±SD) |
| Glucose (mg/dL) | 84 (8) | 84 (7) | 83 (8) * |
| Total cholesterol (mg/dL) | 167 (27) | 164 (27) | 169 (27) |
| HDL cholesterol (mg/dL) | 60 (15) | 61 (16) | 59 (14) |
| LDL cholesterol (mg/dL) | 94 (25) | 91 (24) | 97 (25) * |
| Triglycerides (mg/dL) | 60 (26) | 55 (22) | 64 (29) ǂ |
| Insulin (µIU/mL) | 8.75 (3.15) | 8.43 (2.96) | 9.09 (3.32) * |
| HOMA-IR § | 1.82 (0.70) | 1.78 (0.66) | 1.88 (0.74) |
| Blood Pressure | Mean (±SD) | Mean (±SD) | Mean (±SD) |
| Systolic blood pressure (mmHg) | 100 (10) | 100 (9) | 100 (10) |
| Diastolic blood pressure (mmHg) | 57 (7) | 56 (7) | 58 (7) * |
| Systolic blood pressure (percentile) | 57.8 (27.5) | 55.6 (27.9) | 59.7 (28.2) |
| Diastolic blood pressure (percentile) | 44.5 (21.8) | 41.5 (21.4) | 47.2 (21.9) * |
| Cardiovascular Risk | Mean (±SD) | ||
| Cardiometabolic score | −0.20 (3.85) | −0.03 (3.87) | −0.39 (3.86) |
| HOMA-IR | Systolic Blood Pressure | Triglycerides | Cardiometabolic Risk Score | ||||||||||
|---|---|---|---|---|---|---|---|---|---|---|---|---|---|
| B | 95% CI (Min, Max) | p-Value | B | 95% CI (Min, Max) | p-Value | B | 95% CI (Min, Max) | p-Value | B | 95% CI (Min, Max) | p-Value | ||
| Unadjusted analyses | Insoluble fibre | 0.005 | (−0.008, 0.017) | 0.445 | 1.351 | (0.13, 2.56) | 0.030 | 0.006 | (−0.006, 0.017) | 0.346 | 0.148 | (−0.130, 0.426) | 0.296 |
| Resistant starch | 0.028 | (−0.009, 0.065) | 0.137 | 9.698 | (4.67, 14.72) | <0.001 | 0.015 | (−0.020, 0.050) | 0.397 | 1.323 | (0.495, 2,151) | 0.002 | |
| Soluble fibre | −0.010 | (−0.018, −0.001) | 0.028 | −0.358 | (−1.41, 0.69) | 0.505 | −0.001 | (−0.009, 0.006) | 0.709 | −0.068 | (−0.261, 0.124) | 0.486 | |
| Fibre from pulses and nuts | 0.015 | (−0.004, 0.034) | 0.131 | −1.917 | (−4.49, 0.65) | 0.144 | −0.008 | (−0.026, 0.010) | 0.381 | −0.301 | (−0.734, 0.131) | 0.171 | |
| R2 = 0.016 | R2 = 0.040 | NS | R2 = 0.37 | ||||||||||
| Adjusted analyses | Insoluble fibre | 0.000048 | (−0.010, 0.010) | 0.982 | −0.48 | (−1.70, 0.74) | 0.440 | 0.006 | (−0.005, 0.016) | 0.281 | 0.059 | (−0.14, 0.26) | 0.566 |
| Resistant starch | −0.014 | (−0.046, 0.017) | 0.370 | 4.60 | (0.06, 9.19) | <0.0496 | −0.023 | (−0.057, 0.011) | 0.104 | 0.087 | (−0.56, 0.74) | 0.793 | |
| Soluble fibre | −0.008 | (−0.016,−0.001) | 0.025 | −0.19 | (−1.16, 0.77) | 0.694 | −0.005 | (−0.014, 0.001) | 0.182 | −0.159 | (−0.30, −0.00) | 0.037 | |
| Fibre from pulses and nuts | 0.012 | (−0.004,0.028) | 0.148 | −2.24 | (−4.53, 0.05) | 0.055 | 0.012 | (−0.007, 0.027) | 0.183 | −0.045 | (−0.37, 0.20) | 0.784 | |
| R2 = 0.346 | R2 = 0.252 | R2 = 0.207 | R2 = 0.489 | ||||||||||
Publisher’s Note: MDPI stays neutral with regard to jurisdictional claims in published maps and institutional affiliations. |
© 2020 by the authors. Licensee MDPI, Basel, Switzerland. This article is an open access article distributed under the terms and conditions of the Creative Commons Attribution (CC BY) license (http://creativecommons.org/licenses/by/4.0/).
Share and Cite
Larrosa, S.; Luque, V.; Grote, V.; Closa-Monasterolo, R.; Ferré, N.; Koletzko, B.; Verduci, E.; Gruszfeld, D.; Xhonneux, A.; Escribano, J. Fibre Intake Is Associated with Cardiovascular Health in European Children. Nutrients 2021, 13, 12. https://doi.org/10.3390/nu13010012
Larrosa S, Luque V, Grote V, Closa-Monasterolo R, Ferré N, Koletzko B, Verduci E, Gruszfeld D, Xhonneux A, Escribano J. Fibre Intake Is Associated with Cardiovascular Health in European Children. Nutrients. 2021; 13(1):12. https://doi.org/10.3390/nu13010012
Chicago/Turabian StyleLarrosa, Susana, Veronica Luque, Veit Grote, Ricardo Closa-Monasterolo, Natalia Ferré, Berthold Koletzko, Elvira Verduci, Dariusz Gruszfeld, Annick Xhonneux, and Joaquin Escribano. 2021. "Fibre Intake Is Associated with Cardiovascular Health in European Children" Nutrients 13, no. 1: 12. https://doi.org/10.3390/nu13010012
APA StyleLarrosa, S., Luque, V., Grote, V., Closa-Monasterolo, R., Ferré, N., Koletzko, B., Verduci, E., Gruszfeld, D., Xhonneux, A., & Escribano, J. (2021). Fibre Intake Is Associated with Cardiovascular Health in European Children. Nutrients, 13(1), 12. https://doi.org/10.3390/nu13010012