Association between Nutrition Policies and Student Body Mass Index

 ,
,
Abstract
1. Introduction
2. Materials and Methods
2.1. Data and Design
2.2. Measures
2.2.1. Student BMI
2.2.2. School Competitive Food and Beverage Environments
2.2.3. Policy Measures
2.2.4. Control Measures
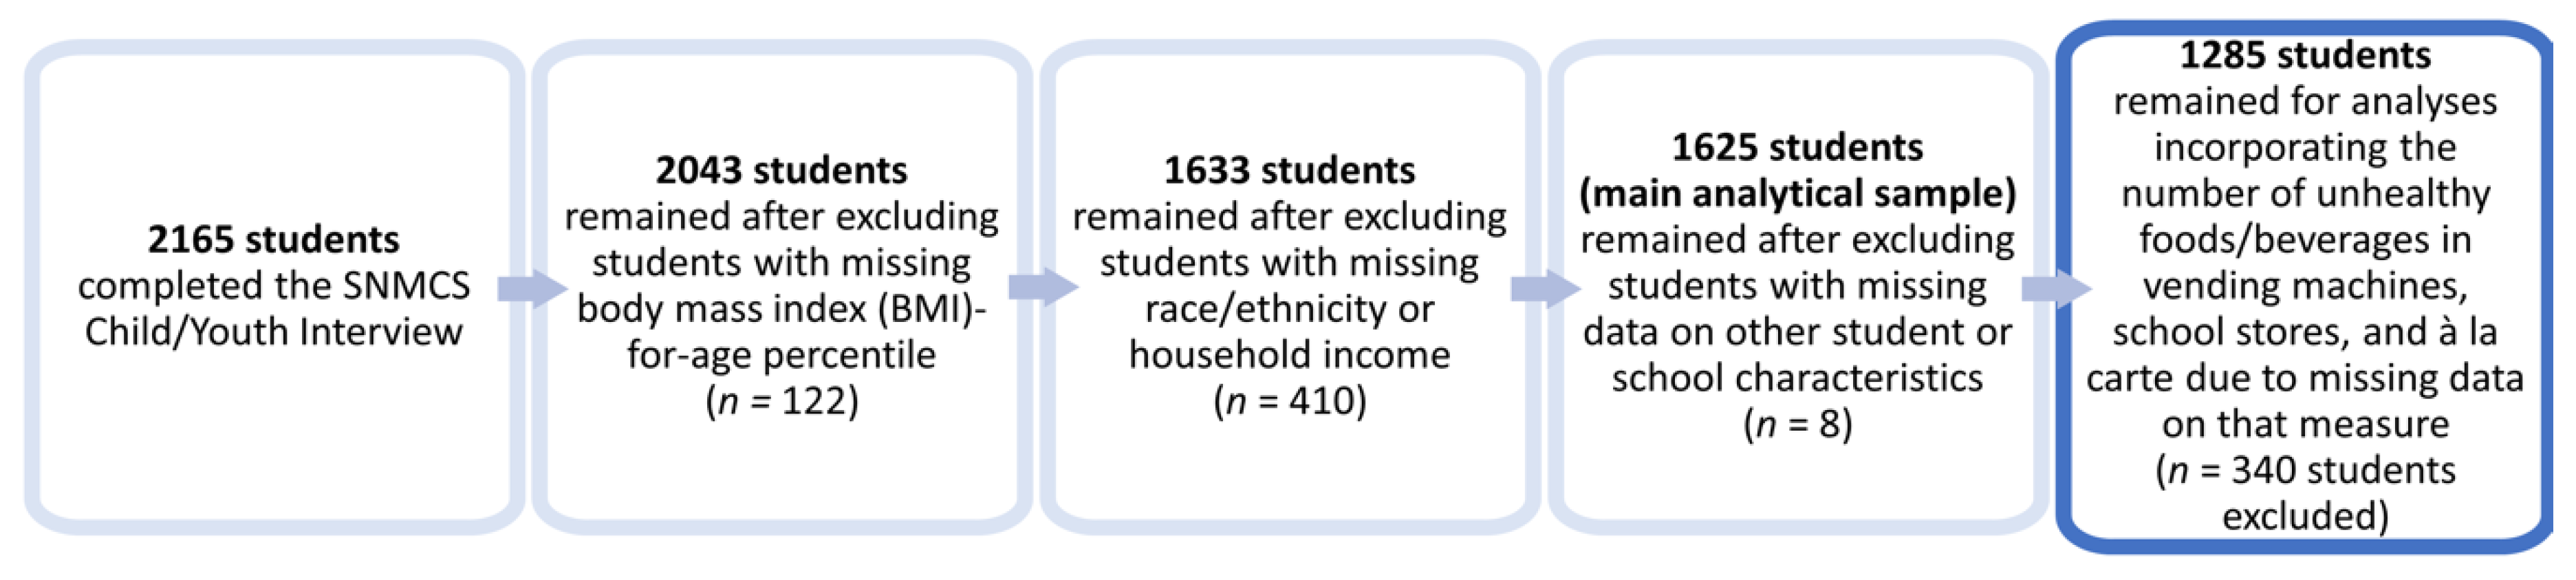
2.3. Study Sample
2.4. Data Analyses
3. Results
3.1. Sample Characteristics
3.2. Relationship between State Laws and Student BMI-for-Age Percentiles
3.3. Relationship between State Laws and Availability of Unhealthy Competitive Foods and Beverages in Schools
3.4. Relationship between the Availability of Unhealthy Competitive Foods and Beverages, State Law, and Student BMI-for-Age Percentiles
4. Discussions
Study Limitations
5. Conclusions
Author Contributions
Funding
Institutional Review Board Statement
Informed Consent Statement
Data Availability Statement
Acknowledgments
Conflicts of Interest
References
- U. S. Department of Agriculture. Foods Sold in Competition with USDA School Meal Programs: A Report to Congress; USDA: Washington, DC, USA, 2001.
- Kann, L.; Grunbaum, J.A.; McKenna, M.L.; Wechsler, H.; Galuska, D.A. Competitive foods and beverages available for purchase in secondary schools selected sites, United States, 2004. Morbid. Mortal. Wkly. Rep. 2005, 54, 917–921. [Google Scholar] [CrossRef]
- Brener, N.; O’Toole, T.G.; Kann, L.; Lowry, R.; Wechsler, H. Availability of less nutritious snack foods and beverages in secondary schools selected states, 2002–2008. Morbid. Mortal. Wkly. Rep. 2009, 58, 1102–1104. [Google Scholar]
- Fox, M.K.; Gordon, A.; Nogales, R.; Wilson, A. Availability and consumption of competitive foods in US public schools. J. Am. Diet. Assoc. 2009, 109, S57–S66. [Google Scholar] [CrossRef] [PubMed]
- Briefel, R.R.; Crepinsek, M.K.; Cabili, C.; Wilson, A.; Gleason, P.M. School food environments and practices affect dietary behaviors of US public school children. J. Am. Diet. Assoc. 2009, 109, S91–S107. [Google Scholar] [CrossRef] [PubMed]
- Larson, N.; Story, M. Are ‘competitive foods’ sold at school making our children fat? Health Aff. 2010, 29, 430–435. [Google Scholar] [CrossRef] [PubMed]
- Fox, M.K.; Dodd, A.H.; Wilson, A.; Gleason, P.M. Association between school food environment and practices and body mass index of US public school children. J. Am. Diet. Assoc. 2009, 109, S108–S117. [Google Scholar] [CrossRef] [PubMed]
- Dighe, S.; Lloyd, K.; Acciai, F.; Martinelli, S.; Yedidia, M.J.; Ohri-Vachaspati, P. Healthier school food and physical activity environments are associated with lower student body mass index. Prev. Med. Rep. 2020, 19, 101–115. [Google Scholar] [CrossRef]
- Child Nutrition and WIC Reauthorization Act of 2004. PL 108-265; 118 Stat 729. 2004 (108th Congress): Sec 204. Available online: https://www.gpo.gov/fdsys/pkg/PLAW-108publ265/pdf/PLAW-108publ265.pdf (accessed on 30 November 2020).
- Piekarz, E.; Schermbeck, R.M.; Young, S.K.; Leider, J.; Ziemann, M.; Chriqui, J.F. School District Wellness Policies: Evaluating Progress and Potential for Improving Children’s Health Eight Years after the Federal Mandate; Institute for Health Research and Policy, University of Illinois at Chicago: Chicago, IL, USA, 2016; Available online: https://www.ihrp.uic.edu/files/District-Monograph-1Jul16-norw.pdf (accessed on 29 November 2020).
- Piekarz-Porter, E.; Chriqui, J.F.; Schermbeck, R.M.; Leider, J.; Lin, W. The Active Roles States Have Played in Helping to Transform the School Wellness Environment through Policy, School Years 2006–07 through 2014–15; Institute for Health Research and Policy, University of Illinois at Chicago: Chicago, IL, USA, 2017; Available online: https://www.ihrp.uic.edu/files/NWPS_State_Report_508.pdf (accessed on 16 November 2020).
- United States Department of Agriculture. National School Lunch Program and School Breakfast Program: Nutrition Standards for All Foods Sold in School as Required by the Healthy, Hunger-Free Kids Act of 2010. Interim Final Rule. Fed Regist 2013, 78, 39068–39120. [Google Scholar]
- Chriqui, J.F.; Pickel, M.; Story, M. Influence of school competitive food and beverage policies on obesity, consumption, and availability: A systematic review. JAMA Pediatr. 2014, 168, 279–286. [Google Scholar] [CrossRef]
- Hoffman, J.A.; Rosenfeld, L.; Schmidt, N.; Cohen, J.F.; Gorski, M.; Chaffee, R.; Smith, L.; Rimm, E.B. Implementation of competitive food and beverage standards in a sample of Massachusetts schools: The NOURISH study (Nutrition Opportunities to Understand Reforms Involving Student Health). J. Acad. Nutr. Diet. 2015, 115, 1299–1307. [Google Scholar] [CrossRef]
- Gorski, M.T.; Cohen, J.F.; Hoffman, J.A.; Rosenfeld, L.; Chaffee, R.; Smith, L.; Rimm, E.B. Impact of nutrition standards on competitive food quality in Massachusetts middle and high schools. Am. J. Pub. Health 2016, 106, 1101–1108. [Google Scholar] [CrossRef] [PubMed]
- Cohen, J.F.; Findling, M.T.G.; Rosenfeld, L.; Smith, L.; Rimm, E.B.; Hoffman, J.A. The impact of 1 year of healthier school food policies on students’ diets during and outside of the school day. J. Acad. Nutr. Diet. 2018, 118, 2296–2301. [Google Scholar] [CrossRef] [PubMed]
- Turner, L.; Leider, J.; Piekarz-Porter, E.; Chriqui, J.F. Association of state laws regarding snacks in US schools with students’ consumption of solid fats and added sugars. JAMA Netw. Open 2020, 3, e1918436. [Google Scholar] [CrossRef] [PubMed]
- Taber, D.R.; Chriqui, J.F.; Chaloupka, F.J. Differences in nutrient intake associated with state laws regarding fat, sugar, and caloric content of competitive foods. Arch. Pediatr. Adolesc. Med. 2012, 166, 452–458. [Google Scholar] [PubMed]
- Datar, A.; Nicosia, N. The effect of state competitive food and beverage regulations on childhood overweight and obesity. J. Adolesc. Health 2017, 60, 520–527. [Google Scholar] [CrossRef] [PubMed][Green Version]
- Taber, D.R.; Chriqui, J.F.; Perna, F.M.; Powell, L.M.; Chaloupka, F.J. Weight status among adolescents in states that govern competitive food nutrition content. Pediatrics 2012, 130, 437–444. [Google Scholar] [CrossRef]
- Kenney, E.L.; Barrett, J.L.; Bleich, S.N.; Ward, Z.J.; Cradock, A.L.; Gortmaker, S.L. Impact of the Healthy, Hunger-Free Kids Act on obesity trends. Health Aff. 2020, 39, 1122–1129. [Google Scholar] [CrossRef]
- U.S. Department of Agriculture. Food and Nutrition Service, Office of Policy Support, School Nutrition and Meal Cost Study: Study Design, Sampling, and Data Collection by Eric Zeidman, Nicholas Beyler, Elizabeth Gearan et al. Alexandria, VA: April 2019. Available online: https://fns-prod.azureedge.net/sites/default/files/resource-files/SNMCS-Methods-Report.pdf (accessed on 24 April 2019).
- U.S. Department of Agriculture. Food and Nutrition Service, Office of Policy Support, School Nutrition and Meal Cost Study, Final Report Volume 1: School Meal Program Operations and School Nutrition Environments by Sarah Forrestal, Charlotte Cabili, Dallas Dotter et al. Alexandria, VA: April 2019. Available online: https://www.fns.usda.gov/sites/default/files/resource-files/SNMCS-Volume1.pdf (accessed on 24 April 2019).
- U.S. Department of Agriculture. Food and Nutrition Service, Office of Policy Support, School Nutrition and Meal Cost Study, Final Report Volume 4: Student Participation, Satisfaction, Plate Waste, and Dietary Intakes by Mary Kay Fox, Elizabeth Gearan, Charlotte Cabili et al. Alexandria, VA: April 2019. Available online: https://www.fns.usda.gov/sites/default/files/resource-files/SNMCS-Volume4.pdf (accessed on 24 April 2019).
- U.S. Department of Education, National Center for Education Statistics. Public Elementary/Secondary School Universe Survey, 2011–2012. Available online: https://nces.ed.gov/ccd/pubschuniv.asp (accessed on 1 August 2020).
- U.S. Census Bureau. Census Regions and Divisions of the United States. Available online: http://www2.census.gov/geo/pdfs/maps-data/maps/reference/us_regdiv.pdf (accessed on 13 July 2017).
- Micha, R.; Karageorgou, D.; Bakogianni, I.; Trichia, E.; Whitsel, L.P.; Story, M.; Penalvo, J.L.; Mozaffarian, D. Effectiveness of school food environment policies on children’s dietary behaviors: A systematic review and meta-analysis. PLoS ONE 2018, 13, e0194555. [Google Scholar] [CrossRef]
- Australian Government Department of Health (2014) National Healthy School Canteens: Guidelines for Healthy Foods and Drinks Supplied in School Canteens. Canberra: Commonwealth Government. Available online: https://www1.health.gov.au/internet/main/publishing.nsf/content/5ffb6a30ecee9321ca257bf0001dab17/$file/canteen%20guidelines.pdf (accessed on 13 December 2020).
- Haynes, A.; Morley, B.; Dixon, H.; Scully, M.; McAleese, A.; Gascoyne, C.; Busbridge, R.; Cigognini, M.; Regev, I.; Wakefield, M. Secondary school canteens in Australia: Analysis of canteen menus from a repeated cross-sectional national survey. Public Health Nutr. 2020. [Google Scholar] [CrossRef]
- Rose, K.; Lake, A.A.; Ells, L.J.; Brown, L. School food provision in England: A historical journey. Nutr. Bull. 2019, 283–291. [Google Scholar] [CrossRef]
- Department of Education. Guidance: Standards for school food in England. London: Department for Education. Available online: https://www.gov.uk/government/publications/standards-for-school-food-in-england (accessed on 13 December 2020).
- Jamie Oliver Food Foundation (JOFF). A Report on the Food Education Learning Landscape. Available online: http://www.akofoundation.org/wp-content/uploads/2017/11/2_0_fell-report-final.pdf.2017 (accessed on 13 December 2020).
- Leonard, P.S.J. Do school junk food banks improve student health? Evidence from Canada. Can. Public Policy 2017. [Google Scholar] [CrossRef]
- Hruby, A.; Manson, J.E.; Qi, L.; Malik, V.S.; Rimm, E.B.; Sun, Q.; Willett, W.C.; Hu, F.B. Determinants and consequences of obesity. Am. J. Public Health 2016, 106, 1656–1662. [Google Scholar] [CrossRef] [PubMed]
- Ward, Z.J.; Long, M.W.; Resch, S.C.; Giles, C.M.; Cradock, A.L.; Gortmaker, S.L. Simulation of growth trajectories of childhood obesity into adulthood. N. Engl. J. Med. 2017, 377, 2145–2153. [Google Scholar] [CrossRef] [PubMed]


| Variable | % or Mean (95% CI) |
|---|---|
| BMI-for-age percentile (Mean) | 66.1 (63.9, 68.2) |
| State law strength score for competitive foods and beverages in vending machines, school stores, and à la carte (0–100) (Mean) | 33.2 (25.6, 40.8) |
| Number of unhealthy foods and beverages in vending machines, school stores, and à la carte (Mean) | 7.5 (5.9, 9.1) |
| Race/Ethnicity of Students in School | |
| ≥50% Non-Hispanic White | 60.6 (50.3, 69.9) |
| ≥50% Non-Hispanic Black | 6.8 (3.0, 14.7) |
| ≥50% Hispanic | 15.2 (9.8, 22.9) |
| Mixed | 17.4 (12.1, 24.5) |
| Free/Reduced-Price Lunch Eligibility Rate Tertiles | |
| Low (0.00–37.42) | 35.3 (26.3, 45.5) |
| Medium (>37.42–63.37) | 30.2 (22.6, 39.2) |
| High (>63.37–100.00) | 34.5 (26.0, 44.0) |
| School Urbanicity | |
| Urban | 24.1 (16.8, 33.2) |
| Suburban | 49.1 (38.6, 59.7) |
| Rural | 26.8 (17.8, 38.3) |
| School Size | |
| Small (fewer than 500 students) | 25.3 (18.6, 33.4) |
| Medium (500 to 999 students) | 45.9 (37.5, 54.5) |
| Large (1000 or more students) | 28.9 (22.5, 36.2) |
| Census Region | |
| West | 18.2 (11.0, 28.8) |
| Midwest | 25.1 (16.1, 36.9) |
| South | 44.0 (32.7, 55.9) |
| Northeast | 12.7 (6.6, 23.1) |
| Student grade | |
| 1 | 8.3 (6.4, 10.8) |
| 2 | 9.9 (8.1, 11.9) |
| 3 | 10.9 (8.8, 13.5) |
| 4 | 9.1 (7.1, 11.6) |
| 5 | 8.8 (7.2, 10.7) |
| 6 | 7.7 (5.9, 10.0) |
| 7 | 7.0 (5.4, 9.1) |
| 8 | 7.0 (5.6, 8.6) |
| 9 | 9.8 (7.7, 12.5) |
| 10 | 7.9 (6.2, 10.2) |
| 11 | 8.4 (6.5, 10.8) |
| 12 | 5.3 (3.9, 7.1) |
| Student sex | |
| Male | 49.3 (46.5, 52.1) |
| Female | 50.7 (47.9, 53.5) |
| Student race/ethnicity | |
| White, non-Hispanic | 51.3 (44.3, 58.3) |
| Black, non-Hispanic | 13.5 (8.9, 19.9) |
| Hispanic | 26.0 (20.7, 32.2) |
| Other (includes multi-racial) | 9.2 (7.3, 11.4) |
| Household income as a percentage of poverty level | |
| ≤130% | 35.2 (30.1, 40.7) |
| >130–185% | 9.9 (7.8, 12.5) |
| >185% | 54.8 (48.8, 60.8) |
| Variable | Coeff. (95% CI) |
|---|---|
| State law strength score for competitive foods and beverages in vending machines, school stores, and à la carte (0–100) | −0.06 * (−0.12, −0.00) |
| Race/Ethnicity of Students in School | |
| ≥50% Non-Hispanic White | Referent |
| ≥50% Non-Hispanic Black | −3.42 (−10.50, 3.66) |
| ≥50% Hispanic | −3.44 (−8.98, 2.11) |
| Mixed | −5.90 * (−11.21, −0.59) |
| Free/Reduced-Price Lunch Eligibility Rate Tertiles | |
| Low (0.00–37.42) | Referent |
| Medium (>37.42–63.37) | 6.90 * (1.37, 12.42) |
| High (>63.37–100.00) | 15.75 *** (10.21, 21.28) |
| School Urbanicity | |
| Urban | Referent |
| Suburban | 5.16 * (0.19, 10.12) |
| Rural | 3.86 (−1.68, 9.40) |
| School Size | |
| Small (fewer than 500 students) | Referent |
| Medium (500 to 999 students) | 0.08 (−4.01, 4.16) |
| Large (1000 or more students) | −0.01 (−5.39, 5.38) |
| Census Region | |
| West | Referent |
| Midwest | 1.96 (−3.24, 7.17) |
| South | −0.28 (−5.31, 4.74) |
| Northeast | −0.49 (−5.35, 4.37) |
| Student grade (1–12) | 0.31 (−0.25, 0.86) |
| Student sex | |
| Male | Referent |
| Female | 2.30 (−1.24, 5.85) |
| Student race/ethnicity | |
| White, non-Hispanic | Referent |
| Black, non-Hispanic | 10.22 *** (4.54, 15.90) |
| Hispanic | 6.44 * (1.21, 11.68) |
| Other (includes multi-racial) | −3.83 (−9.92, 2.26) |
| Household income as a percentage of poverty level | |
| ≤130% | −3.30 (−8.69, 2.10) |
| >130–185% | −5.20 (−12.20, 1.80) |
| >185% | Referent |
| Constant | 54.29 *** (45.70, 62.87) |
| Adjusted mean student BMI-for-age percentile by state law strength score for competitive foods and beverages in vending machines, school stores, and à la carte | |
| State law strength score: 0 | 68.0 |
| State law strength score: 100 | 62.1 |
| Outcome: | Number of Unhealthy Competitive Foods and Beverages (Zero-Inflated Poisson Model) | BMI-for-Age Percentile | BMI-for-Age Percentile | |
|---|---|---|---|---|
| Model type: | Logistic | Poisson | Linear | Linear |
| Variable | OR (95% CI) | IRR (95% CI) | Coeff. (95% CI) | Coeff. (95% CI) |
| State law strength score for competitive foods and beverages in vending machines, school stores, and à la carte (0–100) | 1.02 * (1.00, 1.04) | 0.99 *** (0.99, 1.00) | -- | −0.04 (−0.11, 0.02) |
| Number of unhealthy foods and beverages in vending machines, school stores, and à la carte | -- | -- | 0.27 + (−0.04, 0.59) | 0.20 (−0.12, 0.51) |
| Race/Ethnicity of Students in School | ||||
| ≥50% Non-Hispanic White | Referent | Referent | Referent | Referent |
| ≥50% Non-Hispanic Black | 5.07 (0.72, 35.84) | 0.80 (0.38, 1.67) | 0.36 (−7.53, 8.26) | −0.49 (−8.32, 7.35) |
| ≥50% Hispanic | 1.82 (0.36, 9.07) | 0.68 + (0.44, 1.05) | −5.14 + (−10.55, 0.27) | −6.06 * (−11.77, −0.35) |
| Mixed | 1.96 (0.46, 8.32) | 1.16 (0.83, 1.62) | −6.57 * (−12.56, -0.58) | −6.89 * (-12.94, -0.84) |
| Free/Reduced-Price Lunch Eligibility Rate Tertiles | ||||
| Low (0.00–37.42) | Referent | Referent | Referent | Referent |
| Medium (>37.42–63.37) | 4.62 * (1.24, 17.24) | 1.03 (0.75, 1.40) | 7.52 * (1.15, 13.89) | 7.72 * (1.33, 14.12) |
| High (>63.37–100.00) | 2.23 (0.62, 7.95) | 0.80 (0.54, 1.20) | 17.18 *** (11.22, 23.14) | 17.24 *** (11.28, 23.20) |
| School Urbanicity | ||||
| Urban | Referent | Referent | Referent | Referent |
| Suburban | 0.37 (0.10, 1.35) | 1.17 (0.82, 1.66) | 2.09 (−2.93, 7.12) | 2.40 (−2.61, 7.41) |
| Rural | 0.47 (0.09, 2.39) | 1.14 (0.77, 1.70) | 1.83 (−3.83, 7.49) | 2.23 (−3.62, 8.07) |
| School Size | ||||
| Small (fewer than 500 students) | Referent | Referent | Referent | Referent |
| Medium (500 to 999 students) | 0.91 (0.20, 4.16) | 1.27 (0.89, 1.83) | 1.21 (−3.34, 5.75) | 1.55 (−2.97, 6.08) |
| Large (1000 or more students) | 0.01 ** (0.00, 0.15) | 2.25 *** (1.56, 3.24) | 0.57 (−6.06, 7.21) | 1.17 (−5.38, 7.72) |
| Census Region | ||||
| West | Referent | Referent | Referent | Referent |
| Midwest | 0.25 (0.04, 1.64) | 1.01 (0.64, 1.60) | 3.08 (−2.59, 8.74) | 2.25 (−3.46, 7.96) |
| South | 0.25 * (0.07, 0.92) | 1.24 (0.87, 1.78) | −0.06 (−5.63, 5.52) | −0.26 (−5.92, 5.41) |
| Northeast | 0.93 (0.15, 5.58) | 1.68 * (1.06, 2.67) | −2.89 (−8.78, 3.01) | −3.47 (−9.55, 2.61) |
| Student grade (1–12) | -- | -- | −0.05 (−0.77, 0.67) | −0.04 (−0.75, 0.67) |
| Student sex | ||||
| Male | -- | -- | Referent | Referent |
| Female | -- | -- | 1.45 (−2.54, 5.45) | 1.53 (−2.46, 5.52) |
| Student race/ethnicity | ||||
| White, non-Hispanic | -- | -- | Referent | Referent |
| Black, non-Hispanic | -- | -- | 6.53 * (0.83, 12.24) | 6.83 * (1.05, 12.60) |
| Hispanic | -- | -- | 7.68 ** (2.06, 13.30) | 7.65 ** (2.05, 13.25) |
| Other (includes multi-racial) | -- | -- | −3.29 (−9.75, 3.18) | −3.07 (−9.49, 3.35) |
| Household income as a percentage of poverty level | ||||
| ≤130% | -- | -- | −3.63 (−9.82, 2.56) | −3.74 (−9.94, 2.46) |
| >130–185% | -- | -- | −5.88 (−13.95, 2.19) | −5.91 (−13.97, 2.16) |
| >185% | -- | -- | Referent | Referent |
| Constant | 0.23 (0.02, 2.36) | 5.73 *** (2.79, 11.81) | 53.79 *** (45.68, 61.90) | 55.58 *** (46.35, 64.80) |
Publisher’s Note: MDPI stays neutral with regard to jurisdictional claims in published maps and institutional affiliations. |
© 2020 by the authors. Licensee MDPI, Basel, Switzerland. This article is an open access article distributed under the terms and conditions of the Creative Commons Attribution (CC BY) license (http://creativecommons.org/licenses/by/4.0/).
Share and Cite
Schwartz, M.B.; Leider, J.; Cohen, J.F.W.; Turner, L.; Chriqui, J.F. Association between Nutrition Policies and Student Body Mass Index. Nutrients 2021, 13, 13. https://doi.org/10.3390/nu13010013
Schwartz MB, Leider J, Cohen JFW, Turner L, Chriqui JF. Association between Nutrition Policies and Student Body Mass Index. Nutrients. 2021; 13(1):13. https://doi.org/10.3390/nu13010013
Chicago/Turabian StyleSchwartz, Marlene B., Julien Leider, Juliana F. W. Cohen, Lindsey Turner, and Jamie F. Chriqui. 2021. "Association between Nutrition Policies and Student Body Mass Index" Nutrients 13, no. 1: 13. https://doi.org/10.3390/nu13010013
APA StyleSchwartz, M. B., Leider, J., Cohen, J. F. W., Turner, L., & Chriqui, J. F. (2021). Association between Nutrition Policies and Student Body Mass Index. Nutrients, 13(1), 13. https://doi.org/10.3390/nu13010013