Article

Whole Blueberry and Isolated Polyphenol-Rich Fractions Modulate Specific Gut Microbes in an In Vitro Colon Model and in a Pilot Study in Human Consumers

1
School of Microbiology, University College Cork, T12 K8AF Cork, Ireland
2
APC Microbiome Ireland, University College Cork, T12 K8AF Cork, Ireland
3
Marucci Center for Blueberry Cranberry Research, Rutgers University, Chatsworth, NJ 08019, USA
4
Division of Nutritional Sciences, Cornell University, Ithaca, NY 14853, USA
5
Department of Cell, Developmental and Integrative Biology, University of Alabama at Birmingham, Birmingham, Alabama, AL 35294, USA
*
Author to whom correspondence should be addressed.
Nutrients 2020, 12(9), 2800; https://doi.org/10.3390/nu12092800
Submission received: 26 June 2020 / Revised: 8 September 2020 / Accepted: 8 September 2020 / Published: 12 September 2020
(This article belongs to the Special Issue Diet and Microbiome in Health and Aging)

Abstract

:
Blueberry (BB) consumption is linked to improved health. The bioconversion of the polyphenolic content of BB by fermentative bacteria in the large intestine may be a necessary step for the health benefits attributed to BB consumption. The identification of specific gut microbiota taxa that respond to BB consumption and that mediate the bioconversion of consumed polyphenolic compounds into bioactive forms is required to improve our understanding of how polyphenols impact human health. We tested the ability of polyphenol-rich fractions purified from whole BB—namely, anthocyanins/flavonol glycosides (ANTH/FLAV), proanthocyanidins (PACs), the sugar/acid fraction (S/A), and total polyphenols (TPP)—to modulate the fecal microbiota composition of healthy adults in an in vitro colon system. In a parallel pilot study, we tested the effect of consuming 38 g of freeze-dried BB powder per day for 6 weeks on the fecal microbiota of 17 women in two age groups (i.e., young and older). The BB ingredients had a distinct effect on the fecal microbiota composition in the artificial colon model. The ANTH/FLAV and PAC fractions were more effective in promoting microbiome alpha diversity compared to S/A and TPP, and these effects were attributed to differentially responsive taxa. Dietary enrichment with BB resulted in a moderate increase in the diversity of the microbiota of the older subjects but not in younger subjects, and certain health-relevant taxa were significantly associated with BB consumption. Alterations in the abundance of some gut bacteria correlated not only with BB consumption but also with increased antioxidant activity in blood. Collectively, these pilot data support the notion that BB consumption is associated with gut microbiota changes and health benefits.

1. Introduction

The gut microbiota is a recognized modulator of human health and is shaped by host genetics, environment, lifestyle, and diet [1,2]. Most studies investigated cohorts representing western populations and lifestyle and compared healthy subjects and individuals with diverse conditions. Despite significant inter-individual variations in the gut microbiota composition, a general description of the healthy adult gut microbiota has emerged [3], but the variation range of phylum proportional abundances in healthy subjects is still large. Factors working throughout the lifespan such as repeated antibiotic use, significant changes in dietary habits, and infections may lead to perturbations and reductions in the composition and phylogenetic diversity of the gut microbiota that are associated with disease [4].
Immuno-senescence, hospitalization, and changes in dietary habits may collectively contribute to the age-related gut microbiota alterations observed in older individuals and that are linked in turn to the increase in the inflammatory state of older adults, a known risk factor for mortality in humans and animal models [5,6]. In conditions characterized by an altered microbiome at any point in life, gut microbiota manipulation can be a target for prevention, improvement, or even therapy [7,8]. This could be achieved with the use of probiotics, fecal microbiota transplants (FMT), live biotherapeutics, or prebiotics [9]. Accumulating evidence suggests that polyphenols are a dietary component with potential prebiotic activity [10,11].
Polyphenols are plant-derived dietary components that can be grouped into non-flavonoids and flavonoids [12]. Non-flavonoids include compounds such as tannins, phenolic acids, and lignans [12]. Flavonoids include isoflavones; neoflavonoids; and others such as chalcones, flavones, and flavonols, which are the building blocks of proanthocyanidins and anthocyanins [13]. Anthocyanins are present in plants as glycosylated anthocyanidins conjugated with sugars including glucose, galactose, arabinose, rhamnose, and xylose [14]. The dietary intake of these compounds has been associated with health benefits based on in vitro and in vivo experimental models and human studies [10,15].
The levels of flavonoid consumption reported for adult populations vary significantly, likely due at least in part to differences in the analytical methods and associated reference standards used to assess the flavonoid content in food products, but also because of widely varying dietary habits [14,16,17]. Adults in the US, Europe, and the UK have a daily consumption of flavonoids that ranges from 177 mg/d up to 428 mg/d, and a consumption of anthocyanidins that ranges from 4.2 mg/d up to 19 mg/d [16,18,19].
Unabsorbed phenolic compounds reach the colon, where they may serve as substrates for fecal microbiota fermentation [20]. Several in vitro [21,22], in vivo [23,24,25,26,27], and human studies [28,29,30] indicate health benefits and the potential for polyphenols to modulate the gut microbiota. There is also scientific interest in the combined effect of dietary polyphenols and fiber on the gut microbiota [31]. In this context, blueberry (BB) consumption may provide adequate amounts of dietary polyphenols with potential health benefits [32].
To further elucidate the interactions between BB ingredients and the human gut microbiome, we profiled the compositional changes that occurred in batch fermentations inoculated with the fecal microbiota of healthy young adults and supplemented with isolated BB polyphenol-rich fractions. These fractions are individually enriched for different major classes of presumptive bioactive BB ingredients, and have been tested for their activity in multiple previous publications [33,34,35,36,37]. To detect microbiota taxa that are responsive to human BB consumption, 17 healthy female volunteers in two age groups consumed freeze-dried BB for 6 weeks, and their gut microbiota composition was analyzed before and after the dietary intervention. The data indicate that BB ingredients or whole BB fruit can affect the microbiota both in in vitro colon model systems and in human consumers, but the effects on microbiota diversity are greater in older consumers.

2. Materials and Methods

2.1. Faecal Inocula and the In Vitro Colon Model

A pool of 5 fecal microbiota samples was used to inoculate the fermenter vessels comprising an artificial colon model. The five fecal samples were collected from healthy young donors (coded as follows: HYD3 32 years old (yrs), HA4 26 yrs, HA6 29 yrs, HA7 29 yrs, HA8 35 yrs) under a procedure approved by the local clinical research ethics committee. All the subjects gave their informed consent for inclusion before they participated in the study. The study was conducted in accordance with the Declaration of Helsinki, and the protocol was approved by the Ethics Committee/Institutional Review Board at Cornell University (Protocol ID#: 1706007263).
Fecal samples were collected and transferred to an anaerobic cabinet no later than one hour after passing. Each fecal sample was homogenized in a reduced sterile solution of PBS containing 20% glycerol and stored at −80 °C. Before each fermentation run, an aliquot of each of the 5 fecal samples (i.e., microbiota samples) was thoroughly thawed in an anaerobic cabinet and mixed in equal volumes for the inoculum.
Batch fermentations were used to simulate the colonic bacterial fermentation of the selected substrates [38]. One percent (w/v) fecal inoculum was prepared to inoculate each of three parallel single vessels with a 150 mL working volume in each vessel. A continuous flow of NO2 was used to maintain anaerobic conditions during the 24 h pH (6.8) and temperature (37 °C)-controlled fermentation runs, with continuous stirring and atmosphere monitoring. Adaptation to in vitro media results in reduced microbiota diversity, as observed in previous studies [39]. To reduce this loss of microbiota diversity, the basal fermentation medium was supplemented with a mix of prebiotic fibres (referred to as MIX) (xylan 2 g/L; pectin 2 g/L; arabinogalactan 2 g/L; soluble starch 4 g/L) plus amylopectin (1 g/L), beta glucan (0.5 g/L), and glucose (2 g/L) [40,41].
The MIX medium was supplemented separately with each of 4 different BB polyphenol fractions: i. anthocyanins/flavonol glycosides (200 mg/L); ii. proanthocyanidins (200 mg/L); iii. sugar/acid fraction; and iv. total polyphenolics (333 mg/L). These were prepared as described in Section 2.4. A fermentation run without any supplementation was performed as a control. Samples from the fermentation culture were retrieved at 0, 16, and 24 h and centrifuged immediately, and the pellet and supernatants were kept at −20 °C for further analysis.

2.2. Bacterial DNA Extraction for In Vitro and Human Study

A 200 mg quantity of fecal pellet was weighed as instructed in the QIamp Fast DNA Stool (Qiagen, Manchester, UK) extraction kit protocol. The samples were homogenized mechanically in sterile tubes containing InhibitEX solution and zirconia glass beads of three sizes—0.1, 0.5, and 1.0 mm (Thistle Scientific Ltd., Glasgow, UK)—using a Mini-Beadbeader (Biospec Products, Inc., Bartlesville, OK, USA). The subsequent steps of gDNA extraction were performed as previously described by our laboratory [39].

2.3. Microbiome Profiling of In Vitro and Human Study Samples

The primers S-D-Bact-0341-b-S-17 (5′-CCTACGGGNGGCWGCAG-3′)/S-D-Bact-0785-a-A-21 (5′GACTACHVGGGTATC TAATC C-3′) 5′ [42] were used to amplify the V3/V4 variable region of the 16S rRNA gene for the profiling of the bacterial fecal microbiota using the Phusion High-Fidelity PCR Master Mix (ThermoFisher Scientific, Waltham, MA, USA). After PCR product purification, the Illumina MiSeq system protocol was used for library preparation. Indexing PCR was performed to amply the dual-index barcodes to the amplicon (Nextera XT V.2 Index Kits; Illumina, San Diego, CA, USA). The purification of the barcoded amplicons was performed with the Agencourt AMPure XP-PCR Purification system (Beckman Coutler, Inc., Brea, CA, USA). The Qubit dsDNA HS Assay Kit (Thermo Fischer Scientific, Waltham, MA, USA) was used to quantify the products. Equal concentrations of all the purified amplicons were pooled into a library that was sequenced (2 × 300 bp) on a MiSeq Illumina platform in the Teagasc Food Research Centre sequencing facility (Teagasc Moorepark, Fermoy, Ireland). ENA accession number: PRJEB39031.

2.4. Isolation of Enriched Fractions for Bioassay

Four major ingredient fractions of BB were prepared essentially as previously described in several previous publications [32,33,34,35,36,37]. In detail, whole frozen BB, cv. “Coville”, were extracted, and fractions of total polyphenolics (TPP), proanthocyanidins (PACs), anthocyanin/flavonol glycosides (ANTH/FLAV), and sugars/acids (S/A) were isolated using solid-phase chromatography according to Howell et al., 2005 [43]. Briefly, BBs were homogenized with water in a blender and applied to a C18 column (Waters Corp., Milford, MA, USA) preconditioned with MeOH followed by dH2O. The S/A fraction was collected as the column was washed with dH2O then dH2O:MeOH (85:15) (v/v), followed by elution with acidified aqueous methanol. Solvents were removed from the S/A fraction under reduced pressure. The TPP fraction containing anthocyanins, flavonol glycosides, and PACs (confirmed using reverse-phase HPLC with diode array detection) was eluted with 1% HOAc in MeOH (v/v). All the fractions were dried under reduced pressure to remove the solvent. The TPP fraction was then suspended in 50% EtOH, and applied to a Sephadex™ LH-20 (Sigma Chemical Co., St. Louis, MO) column that was pre-equilibrated overnight in EtOH:dH2O (50:50) (v/v). The ANTH/FLAV fraction was eluted with 50% EtOH and dried to remove the solvent. The PAC fraction was eluted from the LH-20 column with 70% aqueous acetone, and monitored for purity using diode array detection at 280 nm. The absence of absorption at 360 nm and 450 nm confirmed that flavonol glycosides and anthocyanins, respectively, were removed. Acetone was evaporated under reduced pressure, and the resulting purified PAC fraction was dried. Analytical tools, including mass spectrometry and NMR spectrometry, have been routinely utilized to confirm the composition of these BB fractions using the method of Schmidt et al. (2004) and others [44,45,46].

2.5. Human Study Design

This study was approved by the Cornell University institutional review board and complies with the Helsinki Declaration. This trial is registered at clinicaltrials.gov (NCT04262258). All the participants provided written informed consent prior to participation in the study.
Seventeen healthy young (aged 21–39 yrs, n = 11) and old (aged 65–77 yrs, n = 6) women participated in the study. Potential participants were screened using an online survey to assess eligibility. After initial eligibility was established, the participants came to the Human Metabolic Research Unit at Cornell University to complete a health history questionnaire and provide information on current and recent medications. Inclusion criteria were females between the ages of 21 and 40 yrs y and 60 and 79 yrs. Participants were excluded if they had a musculoskeletal disease (e.g., rheumatoid arthritis) or other disorder that would impact skeletal muscle function (e.g., diabetes or cancer), were taking immunosuppressive medication, were pregnant or breastfeeding, had a high alcohol intake (>11 drink per week), had an allergy or intolerance to blueberries, and had antibiotic use within the past 6 months.
After the participants were enrolled in the study, they began a 2-week washout period in which they were asked to avoid foods rich in polyphenols and anthocyanins. Following the 2-week washout period, the participants began the blueberry enriched diet (BED); the participants were instructed to consume 38 g (two packages of 19 g) of freeze-dried BBs (Vaccinium virgatum (ashei)/Vaccinium corymbosum) with water daily for 6 weeks. Compliance was monitored through a supplement compliance log and empty BB packets returned by the participants to the study personnel.
Fasting stool and blood samples were obtained at four time points (washout, week 2, week 4, and week 6) throughout the BED study. The participants were given pre-labelled stool sample collection kits, and samples were collected outside of the lab. The participants transported samples to the lab with an insulated bag that contained an ice pack. The samples were immediately placed in −80 °C freezer until they were processed. To obtain plasma, venous blood samples (~10 mL) were collected in ethylenediaminetetraacetic acid (EDTA) tubes (Becton Dickinson Vacutainer system; Becton Dickinson, Franklin Lakes, NJ, USA) and then immediately centrifuged (4 °C at 1200× g for 10 min) to obtain plasma. Plasma was transferred to a new tube (volume ~500 uL) and stored in a −80 °C freezer until all the participants had completed the study and the samples were ready for analysis.
The participants BED_001, 002, 003, 006, 007, 008, 009, 011, 013, 015, and 016 belonged to the young age group and the participants BED_004, 005, 010, 014, 018, and 020 belonged to the older age group (Table 1).

2.6. Plasma FRAP Assay

The ferric-reducing antioxidant power (FRAP) was determined in plasma from the BED donors following established methods [47]. Briefly, a solution of sodium acetate (EMDMillipore, Burlington, MA, USA), 2,4,6 tripyridyl-S-triazine (TPTZ, ACROS Organics, Geel, Belgium), and ferric chloride (Fisher Scientific, Waltham, MA, USA) was incubated with plasma samples or ferrous sulfate (assay standard, Fisher Scientific, Waltham, MA, USA) for 4 min at 37 °C. The absorbance was measured at 593 nm and standardized to the absorbance of the ferrous sulfate standard to derive the FRAP value (μmol/L). Four technical replicates were measured. The absorbance of the blank was subtracted from each measurement, and the FRAP value of each sample was determined using the following formula: (sample absorbance)/(assay standard absorbance) * (assay standard concentration (1000 μmol/L)).

2.7. Plasma Glucose and CRP Measurements

Routine panels were conducted on stored fasting plasma samples (glucose and C-reactive protein) at Cornell University’s Human Nutritional Chemistry Service Laboratory. Glucose was analyzed on a Dimension Xpand chemistry analyzer (Siemens Healthineers, Malvern, PA, USA), and CRP was measured on an Immulite 2000 immunoassay system (Siemens Healthineers, Malvern, PA, USA).

2.8. Microbiota Composition and Statistical Analysis

The pipeline for the microbiota composition analysis was described before [48] and comprised the following steps. Paired-end reads were joined with FLASH [49] and quality filtering was performed in Qiime (v.1.9.1) using the split_libraries_fastq.py script [50]. The forward and reverse primers were removed using cutadapt [51] and the script truncate_reverse_primer.py, respectively. For additional quality filtering and de novo operational taxonomic unit (OTU) clustering, USEARCH was used. Filtering by length and size was performed before single unique sequences were excluded. Clustering in OTUs was performed using 97% identity for the sequences after the various filtering steps. Chimeras were removed based on the use of UCHIME with the GOLD reference database. The OTUs were used to map sequences initially filtered for quality (97% identity). The mothur suite of tools (v1.36.1) and the RDP (trainset 14) were used for the OTU classification (classify.seqs) with a 80% confidence threshold [52]. The OTUs were classified down to the species level with SPINGO [53].
The PyNast tool [54] in Qiime (along with the diversity function of the vegan package version 2.4.3 of the R programming interface v 3.5.4) was used to align the sequences and calculate the alpha (α) diversity indices—i.e., Shannon, Simpson, Chao1, Phylogenetic Diversity (PD), Observed Species, and beta (β) diversity indices (i.e., Weighted Unifrac and Unweighted Unifrac). Weighted Unifrac and Spearman distances were used for principal coordinates analysis (PCoA) (ade4 package) using the R programming interface (v 3.5.4). PERMANOVA analysis was performed using the adonis function implemented in the vegan package (version 2.4.3) of the R programming interface. The reads assigned to taxa at various levels (OTU, species, and genus) were cumulated and divided by the total number of reads per sample.
For the artificial colon reactor analysis, the differentially abundant taxa in the different supplementations were identified by Kruskal–Wallis H-test followed by Dunns’ test, and the p values were adjusted for multiple testing by Benjamini Hochberg (BH) (padj). Significant results were indicated with * (padj < 0.05), and marginal differences with # (padj < 0.1). The dunn.test package of the R programming interface was used for this purpose (run with the method = “bh” argument to specify adjustment procedure to Benjamini Hochberg-BH). For this analysis, supplementation-specific abundances of the various taxa at 16 h and 24 h were combined. For each of these taxa, we also checked whether their abundances exhibited significant variations in their abundances at 16 h and 24 h using Wilcoxon Signed Rank Tests. The same approach (as described above) was also adopted for testing differences in the α diversity measures. The microbiota profiles resulting from the supplementation regimes were grouped into two groups (G1 and G2), as described in the results. The “Within G1” and “Within G2” distances were obtained as follows. For each microbiota resulting from a given supplementation, the median of the Weighted Unifrac distances of the microbiota with all the other microbiotas belonging to the same supplementation (that is, all the other microbiotas belonging to either G1 or G2 at 16 h and 24 h) was obtained. These median distances represented the microbiota variations within that given supplementation group. For the “Across G1 and G2” variations, for each sample belonging to a given supplementation, the median of the Weighted Unifrac distances of the microbiota with all the other microbiotas belonging to the other supplementations (that is, all the other microbiotas belonging to either G1 or G2 at 16 h and 24 h) was obtained. The wilcox.test function of the R programming interface v 3.5.4 was then used for comparing the within and across-group median distances.
For the human study, the OTU co-abundance groups (CAGs) demonstrating similar mean abundance pattern trends across time points were identified. The identification of taxa CAGs and their distinct taxonomic/temporal abundance profiles was conducted as follows. The mean abundance of each OTU was obtained for W0, W2, W4, and W6, providing a mean temporal trend of each OTU across time points. Subsequently, the Kendall correlations (taus) across all pairs of OTUs were obtained and then converted to Kendall distances. The Kendall distance between any two pairs of OTUs was calculated as 1—(Kendall tau)/2. The OTUs were clustered into CAGs based on their mutual abundance pattern (Ward-D2 method). The heatmap.2 function of R v 3.5.4 was used to visualize the clustering of the CAGs with the colors assigned using the RColorBrewer function. The Kruskal–Wallis H test followed by Dunns’ test was used for a CAG abundance comparison across time points (using the dunn.test function, as described earlier for the differentially abundant taxa analysis in colonic reactor models). The OTUs were classified using SPINGO (0.65 threshold). For each CAG, OTUs with defined species classifications were obtained, and the frequency of each species in a given CAG was computed. The representation of the different species in the various CAGs were depicted using word clouds using the “wordcloud” module of the R programming interface v 3.5.4. A PERMANOVA analysis (Spearman distances at OTUs and CAG abundances level) was performed for the association between the taxa abundances (OTU and CAG level) and CRP, glucose, and FRAP.
For the FRAP values, the associations were further validated using Random Forest models (using the combination of the rfcv and randomForest functions of the randomForest module of R v 3.5.4). A total of 100 iterations of the Random Forest models were performed, each time taking 50% of the samples for training and testing on the other 50%. For each sample, the mean predicted FRAP values were then correlated with the actual FRAP values to ascertain the strength of the association. A key advantage of the Random Forest models is that they can not only be used to predict a given trait (either quantitative or categorical; in this case, the quantitative FRAP values) from a dataset of multiple predictor features (in this case, the OTUs), but they can provide the relative importance of each of the features to predict the given trait. This enables the identification of the most optimal set of associated features for predicting a given trait. Using these scores, the core list of FRAP-positive and FRAP-negative marker OTUs was identified, as described in detail in the Results section. The enrichment of the different CAGs in the two FRAP-associated marker OTUs was observed using Fishers’ exact test. Spearman correlations (and the associated p values) were computed using the corr.test function of the psych package of the R programming interface (run with the adjust = “fdr” argument for p value correction-false discovery rate FDR). The volcano plots showing the positive and negative associations of the various taxa with the clinical metadata were using the ggplot and ggrepel modules of R v 3.5.4.

3. Results

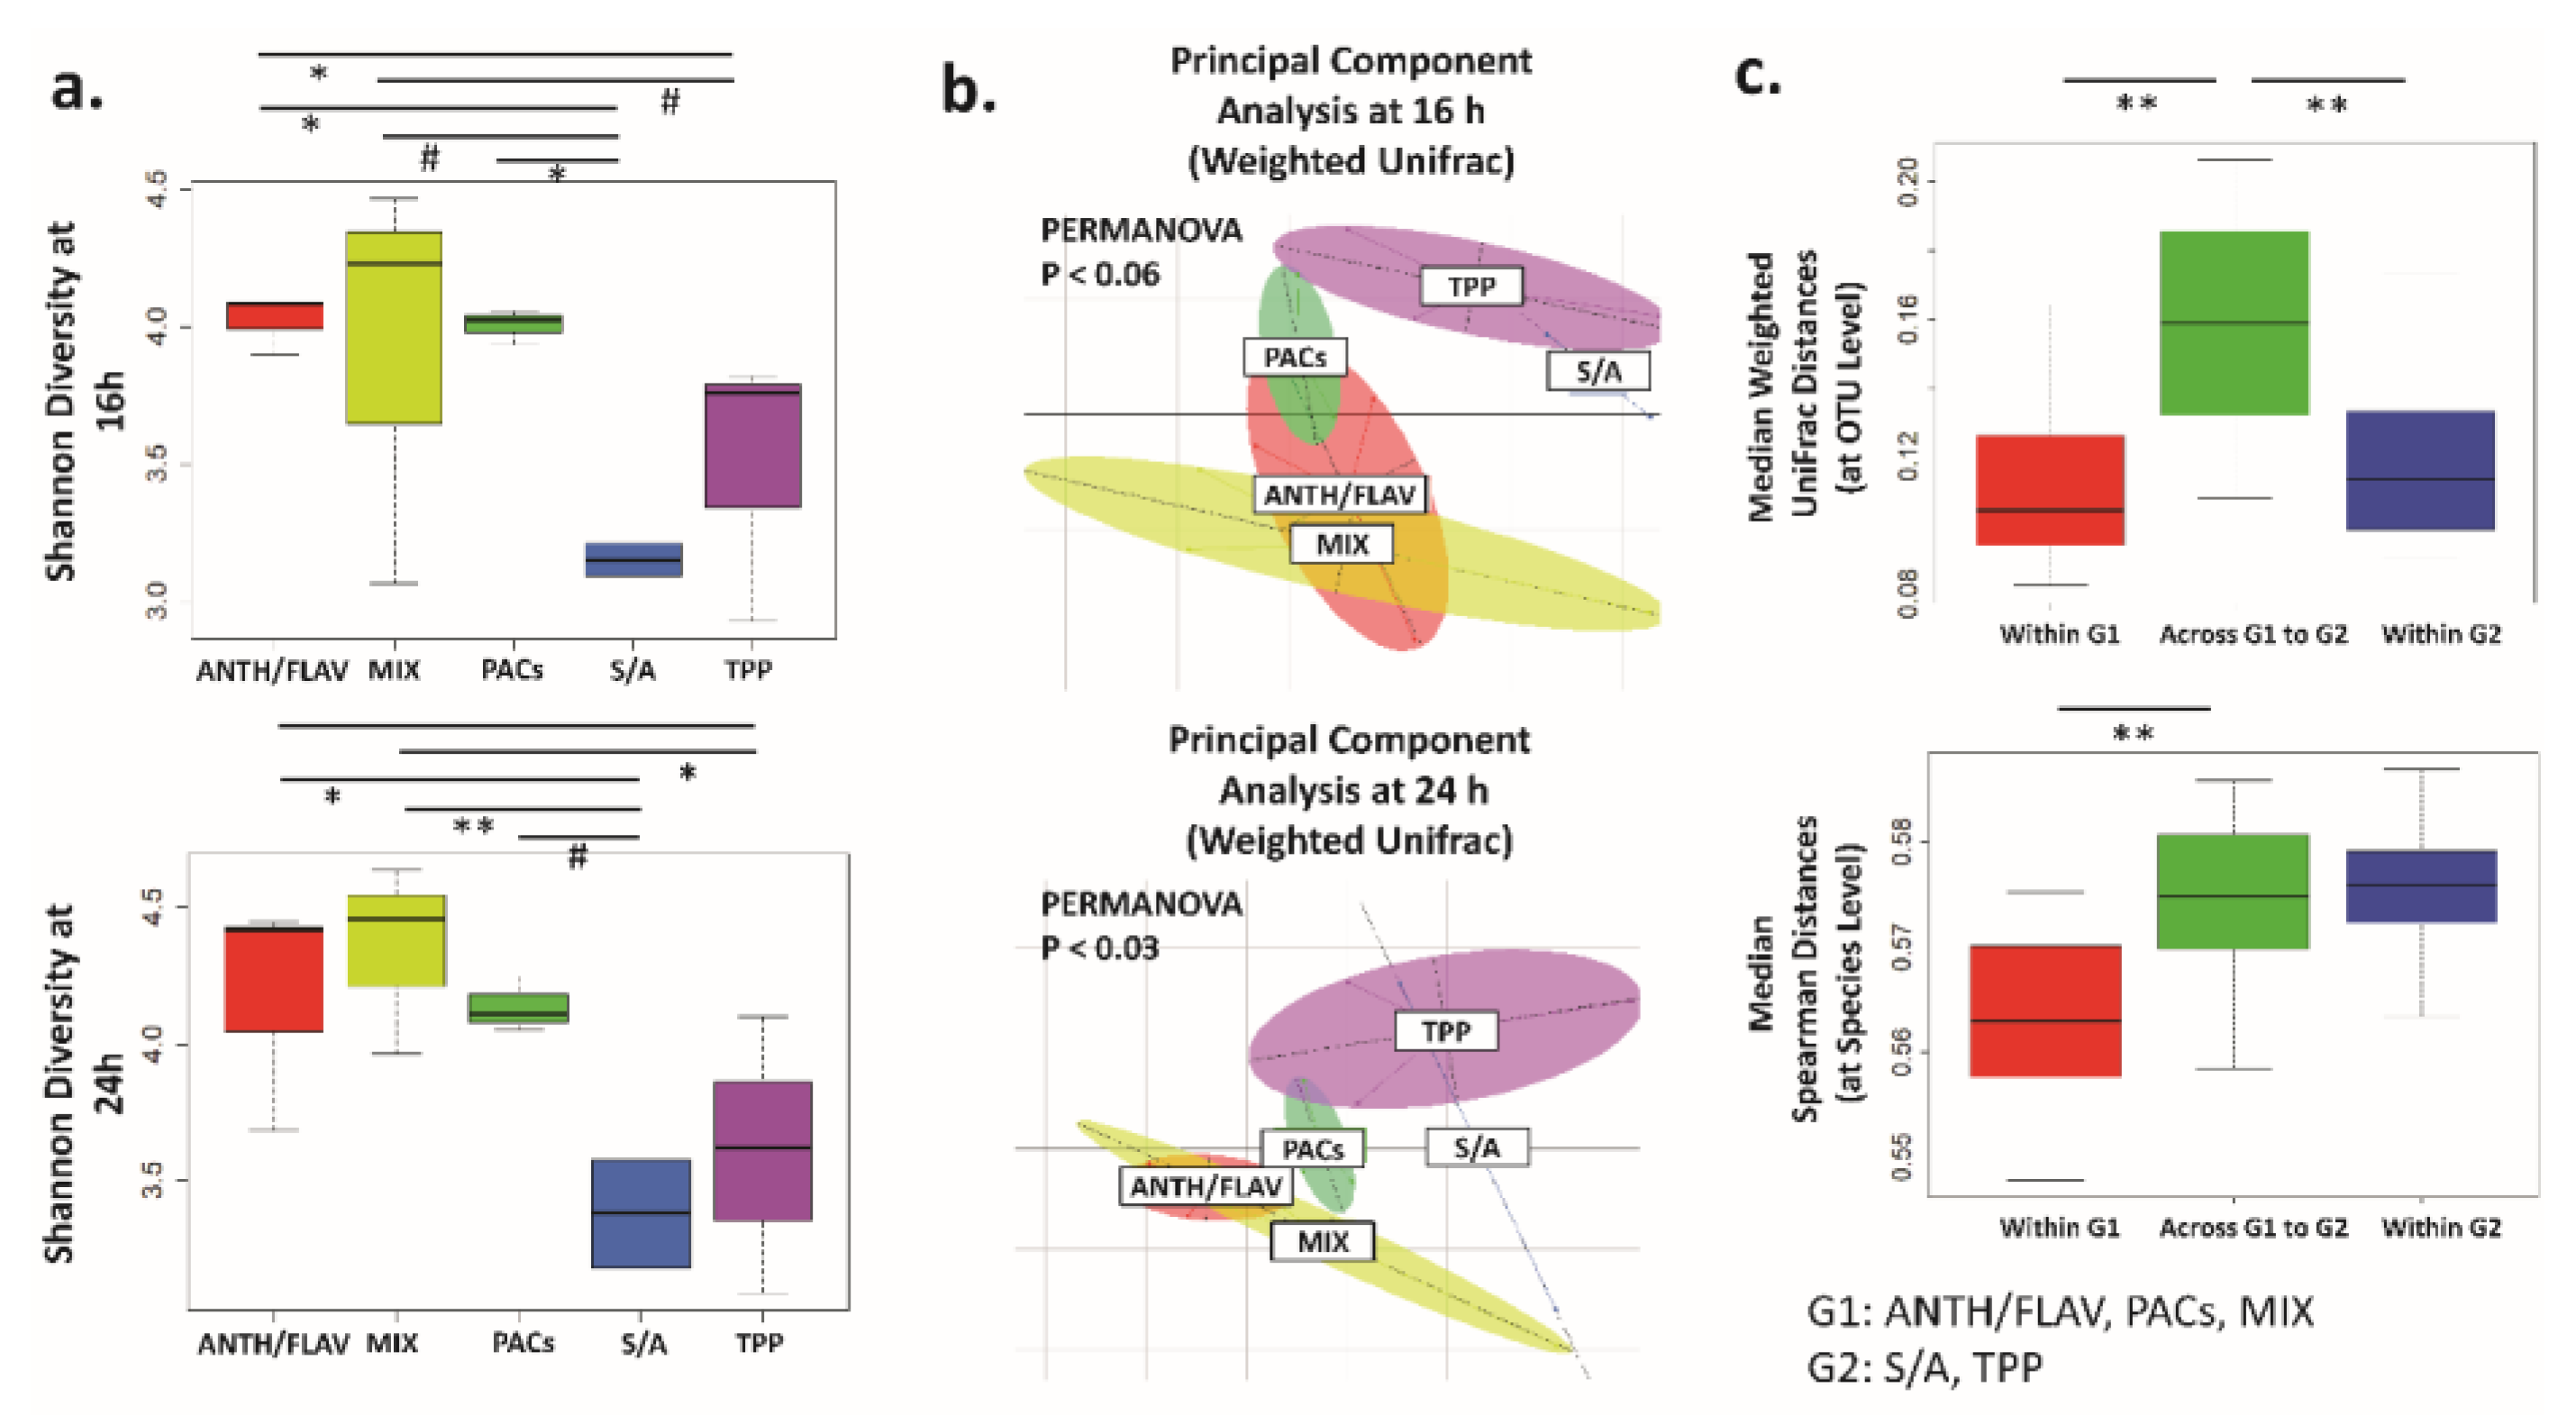
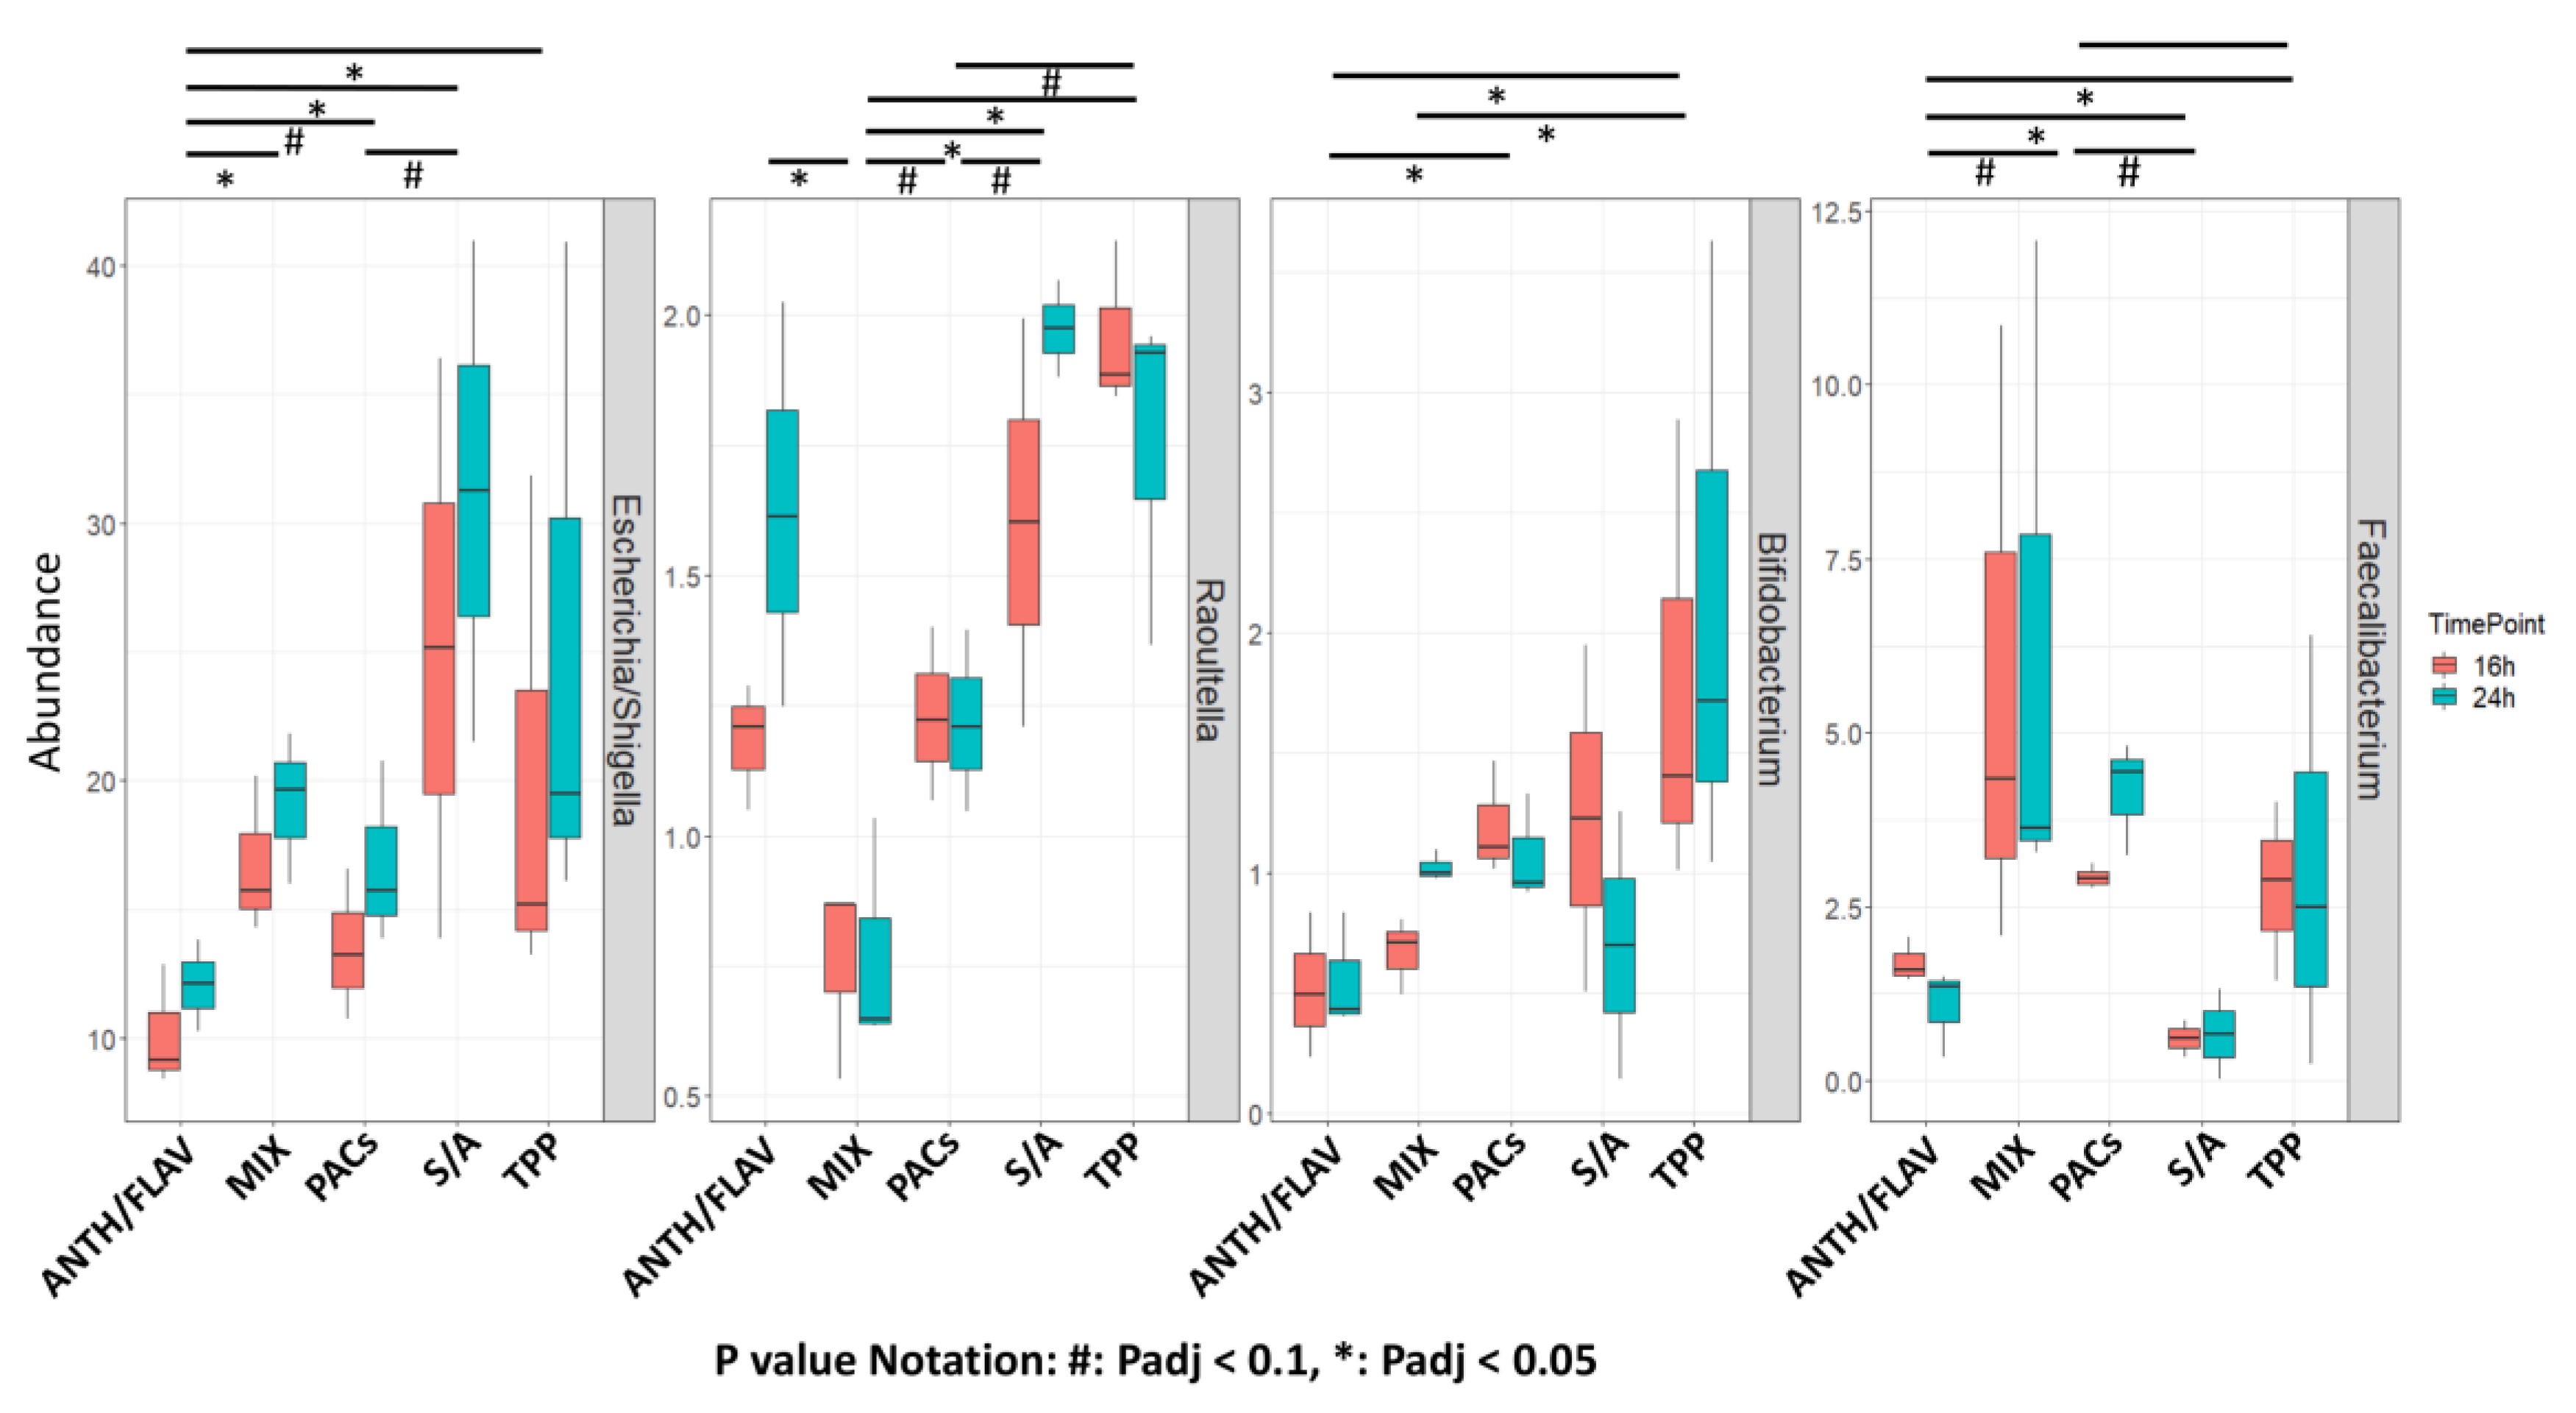
3.1. A Prebiotic MIX, PACs, or ANTH/FLAV Have a Similar Effect on Microbiota Structure in the In Vitro Colon Model

The fecal microbiota α diversity (Shannon and Observed Species) was reduced over the 24 h of fermentation (observed at the 16 h and 24 h time points) compared to the baseline 0 h (Supplementary Materials Figure S1), which is a typical feature of in vitro colon models [43]. Supplementation with ANTH/FLAV, PACs, and prebiotic MIX resulted in microbiota communities displaying similar Shannon and Observed Species diversity index values that were noticeably higher than in the fermentations with either S/A and TPP supplementation (significant for PACs/MIX versus S/A with padj < 0.5) (Figure 1a; Figure S2). Thus, in the in vitro colon model used in this study, isolated BB components such as the polyphenol-rich fractions ANTH/FLAV and PACs were more efficient in promoting microbiota diversity than the other polyphenol-rich fractions used in this study—i.e., TPP or the S/A fraction.
To visualize the global effect of supplementing the fecal fermentation with BB polyphenol-rich fractions, we performed Principal Coordinate Analysis (PCoA) based on weighted and unweighted Unifrac distance measures (Figure 1b; Figure S3). Unweighted Unifrac analysis, where the taxa presence/absence is taken into account, showed that TPP supplementation led to a separation of the microbiota at 16 h that was not sustained through the 24 h (Figure S3). Weighted Unifrac analysis, in which the abundance of dominant taxa is more impactful on β diversity measurement, showed that TPP and S/A supplementation led to a microbiota profile separate from that of the other supplementation regimes at both 16 h (marginal but not significant variation; PERMANOVA p < 0.06) and 24 h (significant; PERMANOVA p < 0.03) (Figure 1b). Supplementation with the ANTH/FLAV and PACs fractions resulted in a microbiota β diversity close to that promoted by MIX (Figure 1b). Thus, the BB polyphenols tested had distinct effects on the fecal microbiota. The PCoA analysis showed that the supplementations could be grouped into G1, consisting of ANTH/FLAV, MIX, and PACs; and G2, consisting of S/A and TPP. The relatedness of samples within G1 and G2 and across G1 and G2 are shown in Figure 1c.
The differences in α diversity observed between ANTH/FLAV, PACS, and MIX and TPP and S/A supplementation could be partially attributed to certain taxa dominating in relative abundance in the microbiota at 16 h and 24 h; non-significant microbiota differences were observed between the two time points per supplementation (Table S1; Figure S4). The supplementation-specific differences in various taxa were investigated by first performing a descriptive analysis and comparison of the supplementation-specific taxa at the family level (Figure S4), followed by a statistical comparison of the taxa abundances (genus and family level) (across supplementation combining the 16 h and 24 h time points) (Figure 2; Figure S5). The decrease in α diversity observed in the fecal microbiota fermented with TPP and S/A supplementation could be explained by the comparatively higher abundance of Enterobacteriaceae (49.77% and 47.49% average relative abundance, respectively) observed by compositional analysis of the fecal microbiota after 16 h and 24 h of fermentation (Figure S4). The lowest Enterobacteriaceae abundance was observed upon ANTH/FLAV supplementation and MIX (average relative abundance of 31.46% and 29.11%, respectively) (Figure S4). ANTH/FLAV supplementation resulted in a significantly lower Escherichia/Shigella (Enterobacteriaceae) relative abundance compared to the prebiotic MIX (padj < 0.05), S/A fraction (padj < 0.05), and TPP (padj < 0.05) supplementation (Figure 2). Lachnospiraceae was a major microbiota family that was reduced in abundance compared to baseline (34.4% average relative abundance) across fermentation regimes, potentially due to the in vitro conditions (Figure S4). Supplementation with ANTH/FLAV, PACs, or prebiotic MIX sustained the highest Lachnospiraceae (average relative abundance of 14.52%) in the microbiota (Figure S4). Similarly, the Bacteroidaceae relative abundance was higher upon ANTH/FLAV, PACs, and prebiotic MIX supplementation (16.61%, 15.1%, and 12.95% average relative abundance, respectively), and overall increased in abundance from baseline (average relative abundance of 6.89%) across supplementations (Figure S4).
The abundance of the health-relevant genus Bifidobacterium spp. (Bifidobacteriaceae; 2.54% average abundance at 0 h (Figure 2; Figure S4) was significantly increased upon TPP supplementation (1.95% average relative abundance) compared to MIX (0.85% average relative abundance; padj < 0.05) and ANTH/FLAV supplementation (0.54% average relative abundance; padj < 0.05) (Figure 2). The health-relevant taxon Faecalibacterium was present at an average relative abundance of 6.04% (median abundance of 4%) upon MIX supplementation, which was marginally higher compared to PACs (padj < 0.1), and significantly higher compared to the TPP (padj < 0.05) and S/A (padj < 0.05) fraction supplementation (Figure 2).
Apart from the aforementioned supplementation effects on the dominant taxa, the low abundance taxa (<1% average relative abundance) were also differentially abundant in the microbiota depending on the supplementation of the fermentation medium (Figure S5). Supplementation with ANTH/FLAV resulted in an increased relative abundance of Phascolarctobacterium compared to MIX (significant; padj < 0.05), S/A (marginal; padj < 0.1) and TPP (significant; padj < 0.05) supplementation, and of Gemmiger compared to MIX and PACs (padj < 0.05 for both supplementations). The Clostridium cluster XIVb relative abundance was increased with PACs supplementation (padj < 0.05 compared to ANTH/FLAV, S/A, and TPP). The Sutterella relative abundance was increased upon ANTH/FLAV supplementation (padj < 0.05 compared to S/A and TPP). The Oscillibacter and Flavonifractor relative abundance was significantly increased with MIX and PACs supplementation, whereas the Burkholderiales relative abundance was highest after the PAC supplementation (significantly higher: padj < 0.05 compared to TPP; marginally higher: padj < 0.1 as compared to ANTH/FLAV) (Figure S5). The unclassified Erysipelotrichaceae had the lowest relative abundance after S/A supplementation, whereas Parasuterella had the lowest relative abundance after the ANTH/FLAV and TPP supplementation (Figure S5).

3.2. A Trend Towards Increased Microbiota α Diversity in Older Women Consuming BB

The α diversity of the fecal microbiota in the human trial subjects did not show significant difference across time points for any of the α diversity indices measured (Shannon, Simpson, Chao1, PD, and Observed Species) (Figure S6). The lower sample size, especially of the group of older women, reduced the statistical power of the comparisons. However, investigating the time point-specific distributions of the diversity measures separately for the young and the older women indicated that, for the older group, for most of the measures (with the exception of Shannon) the α diversities at time points W4 and W6 were observed to be similar and higher than that at the pre-intervention W0 time point, indicating an increasing albeit non-significant trend for the elderly (Figure S6). We then investigated this further to check if any differences in the microbiota α diversity were observed by comparing the pre (W0) and post (W4 and W6) intervention time points on a per-individual basis (separately for each age group) (Figure S7a). In the fecal microbiota of five out of six older subjects, the Shannon diversity was increased during the intervention (mean of W4 and W6 aggregated) from the baseline W1 (Figure S7a). Similar results were not observed for the young subjects (Figure S7b).

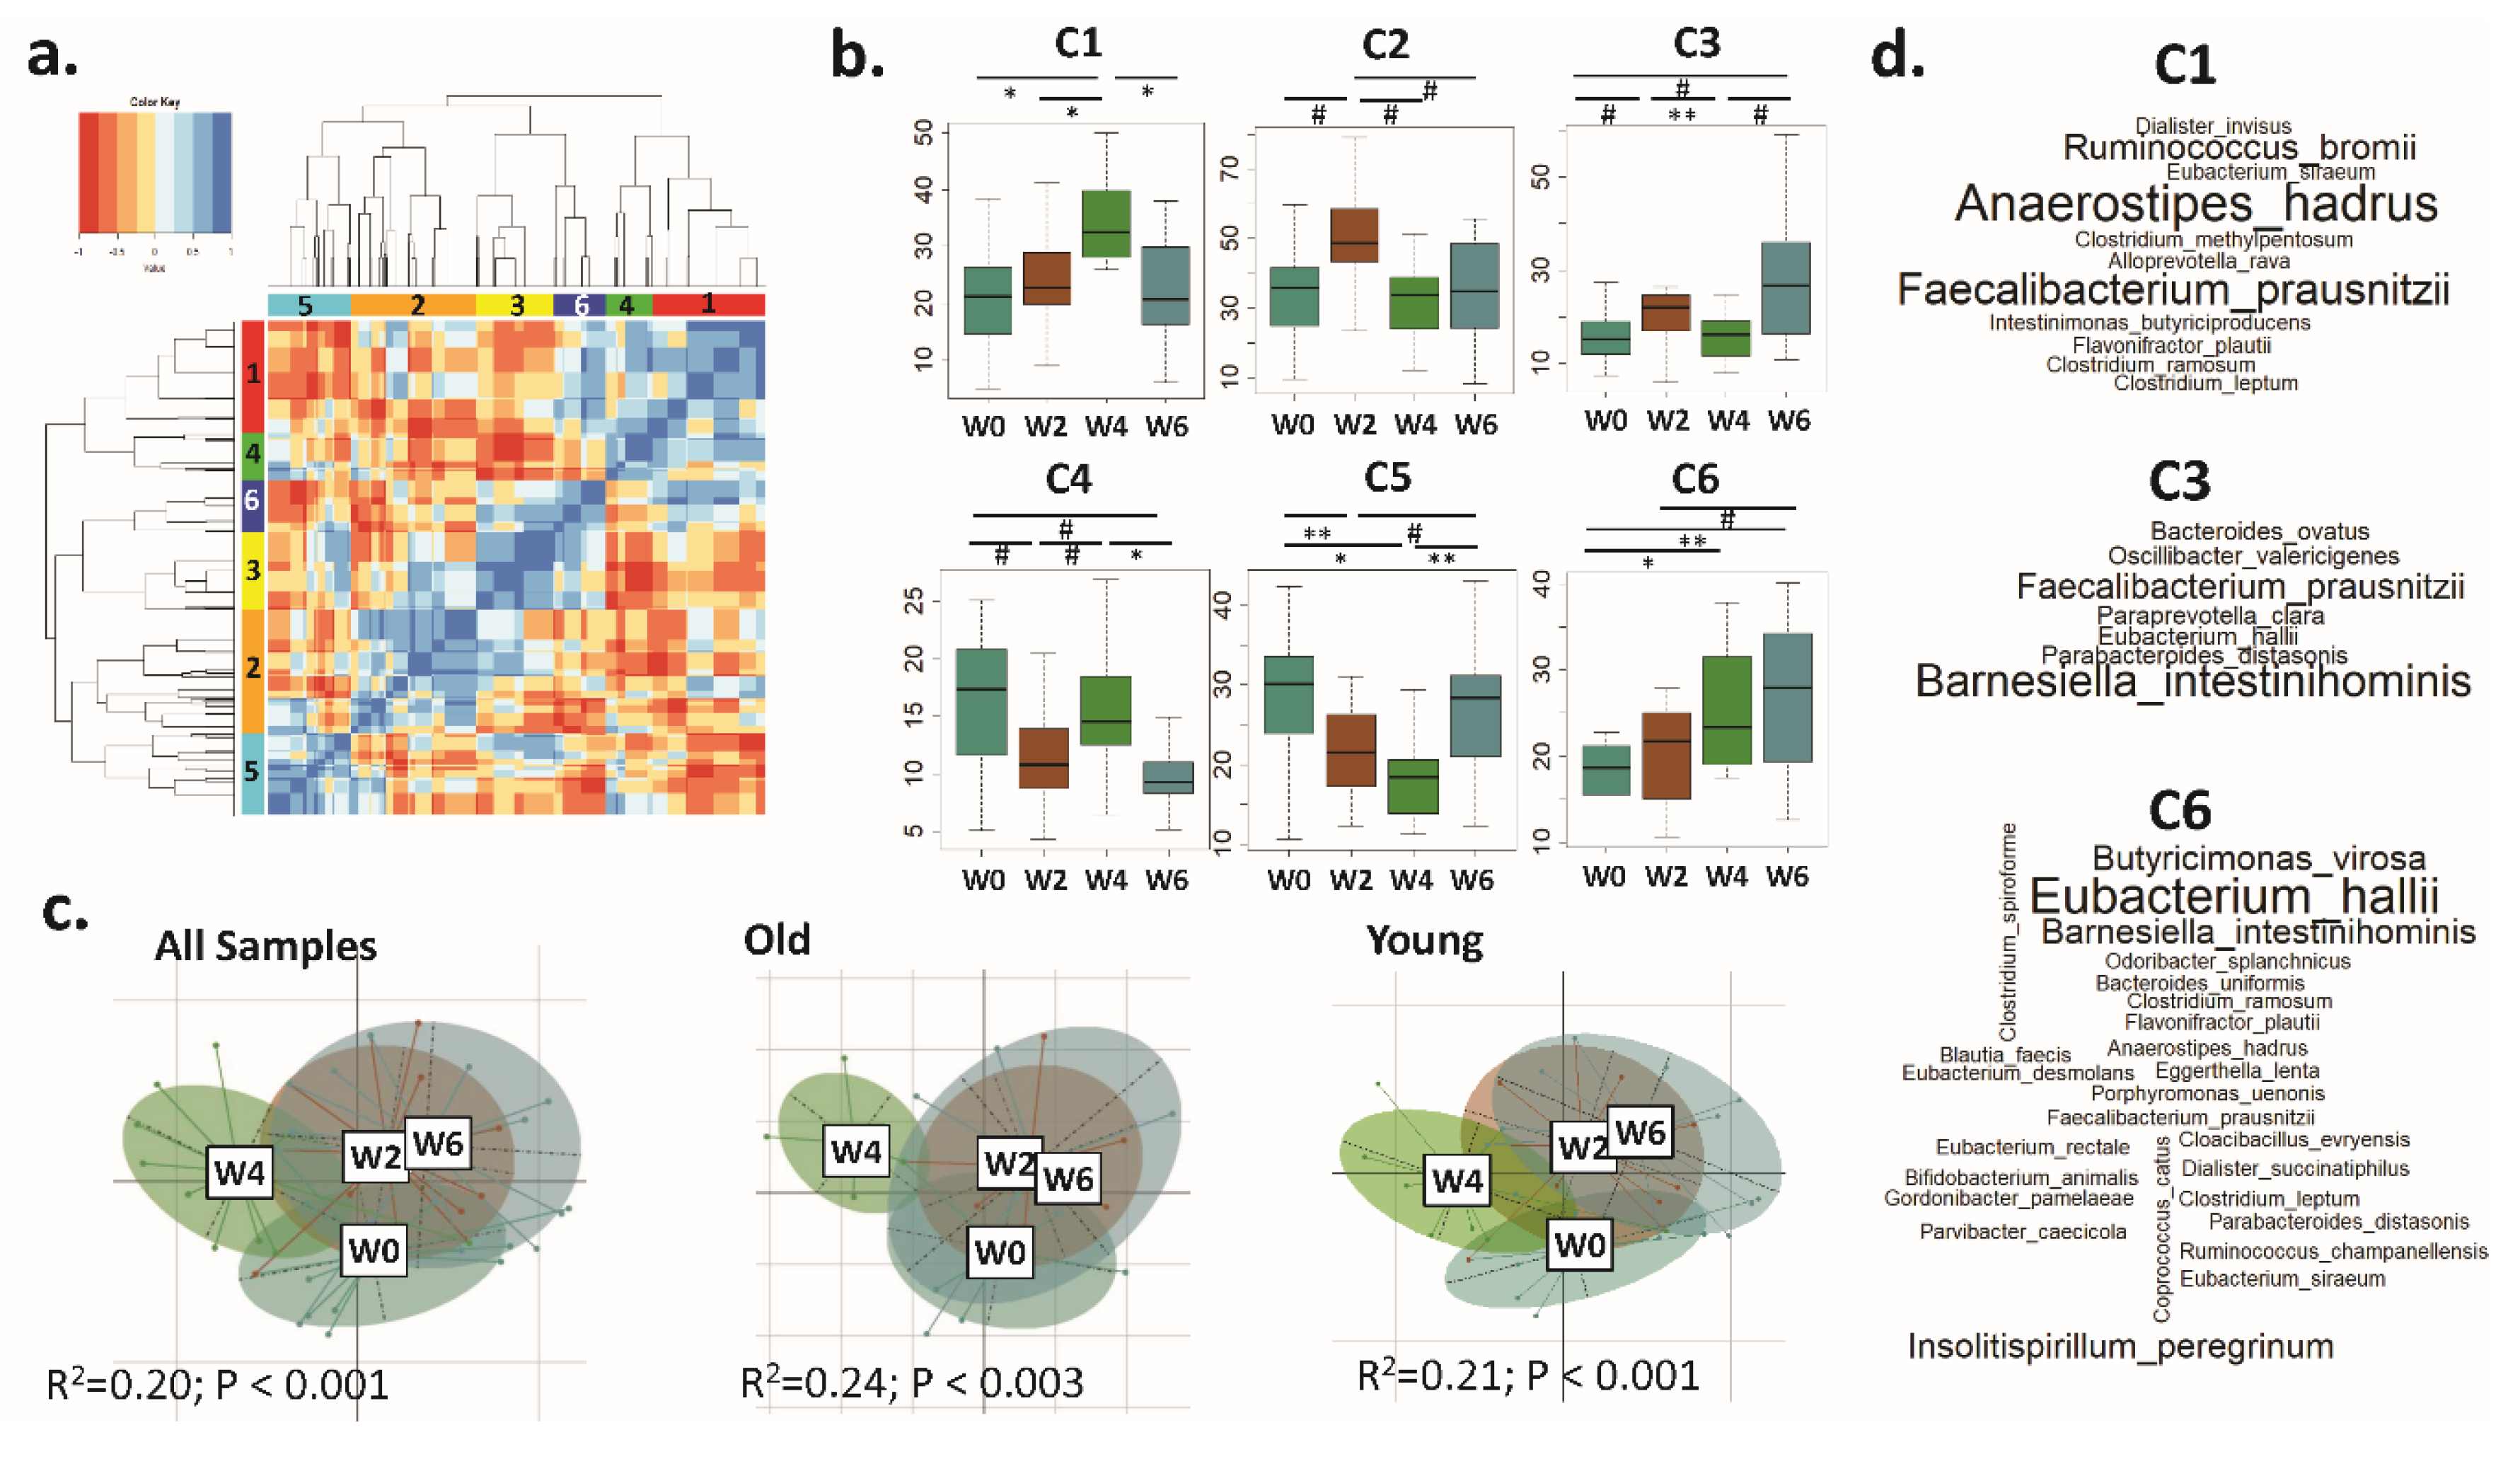
3.3. Distinct CAGs Represented by Health-Promoting Taxa Were Associated with BB Consumption at Each Time Point

Based on β diversity, the fecal microbiota of the older subjects formed a distinct cluster at W4, albeit with high intra-sample variation (Figure S8a). Given the lower sample size and high intra-sample variability, the trends were not significant (PERMANOVA R2 = 0.03). The fecal microbiota of the younger women showed no β diversity shifts throughout the intervention (PERMANOVA R2 = 0.002) (Figure S8b).
Despite the lack of clear β diversity in the BB consumption-associated signatures, a significant lower intra-sample microbiota variability at intervention time points was observed for both sub-groups (at W4 versus W2 and W6, and at W6 compared to W2 and W4, respectively) (Figure S8c). This observation could indicate that, in spite of the high inter-individual variability, specific taxa groups may have changed across time points concurrently (enriched or depleted), resulting in a significantly lower inter-individual variability [55].
Microbiome configuration analysis offers a more refined approach to monitor microbiota changes compared to individual taxa analysis, because OTUs that co-occur at similar proportions may have trophic and functional interactions relevant for gut ecology [55]. In an analysis of the aggregated microbiota data from all study participants and based on the aforementioned variability trends, six CAGs of OTUs were identified (C1 to C6) (Figure 3a). Interestingly, while the abundance of each of these CAGs exhibited significant differences at W2, W4, and W6 (Figure 3b; Figure S9) when investigating for variability trends in old and young women, no significant differences in the OTUs’ (of the six CAGs) cumulated abundance variation were observed. This indicated that, while the individual constituents may show a high inter-individual variability, the CAGs as a whole exhibit significant time point-specific trends (irrespective of the age group of the participants), even at the individual level (thereby indicating their reliability).
CAG-level PERMANOVA analysis at the different time points revealed significant differences (Figure 3c). The analysis revealed a distinct gut microbiome composition at W4, while W2 and W6 clustered closer; this was observed for both the old and young sub-groups. No significant differences in the cumulated abundances variation in the OTUs belonging to the six CAGs separately within the old and the young were observed (Figure S9).
The C1, C3, and C6 CAGs’ cumulated abundances increased significantly with BB consumption (at W4 and W6). C1 increased from W0 to W4 and decreased at W6, whereas C3 and C6 progressively increased from W0 to W6 (Figure 3b). Several health-relevant species were abundant in these CAGs—e.g., Faecalibacterium prausnitzii, Barnesiella intestinihominis, Eubacterium halii, Anaerostipes hadrus, and Ruminococcus bromii (Figure 3d). These results indicate the putative beneficial effect of BB consumption on the gut microbiota.

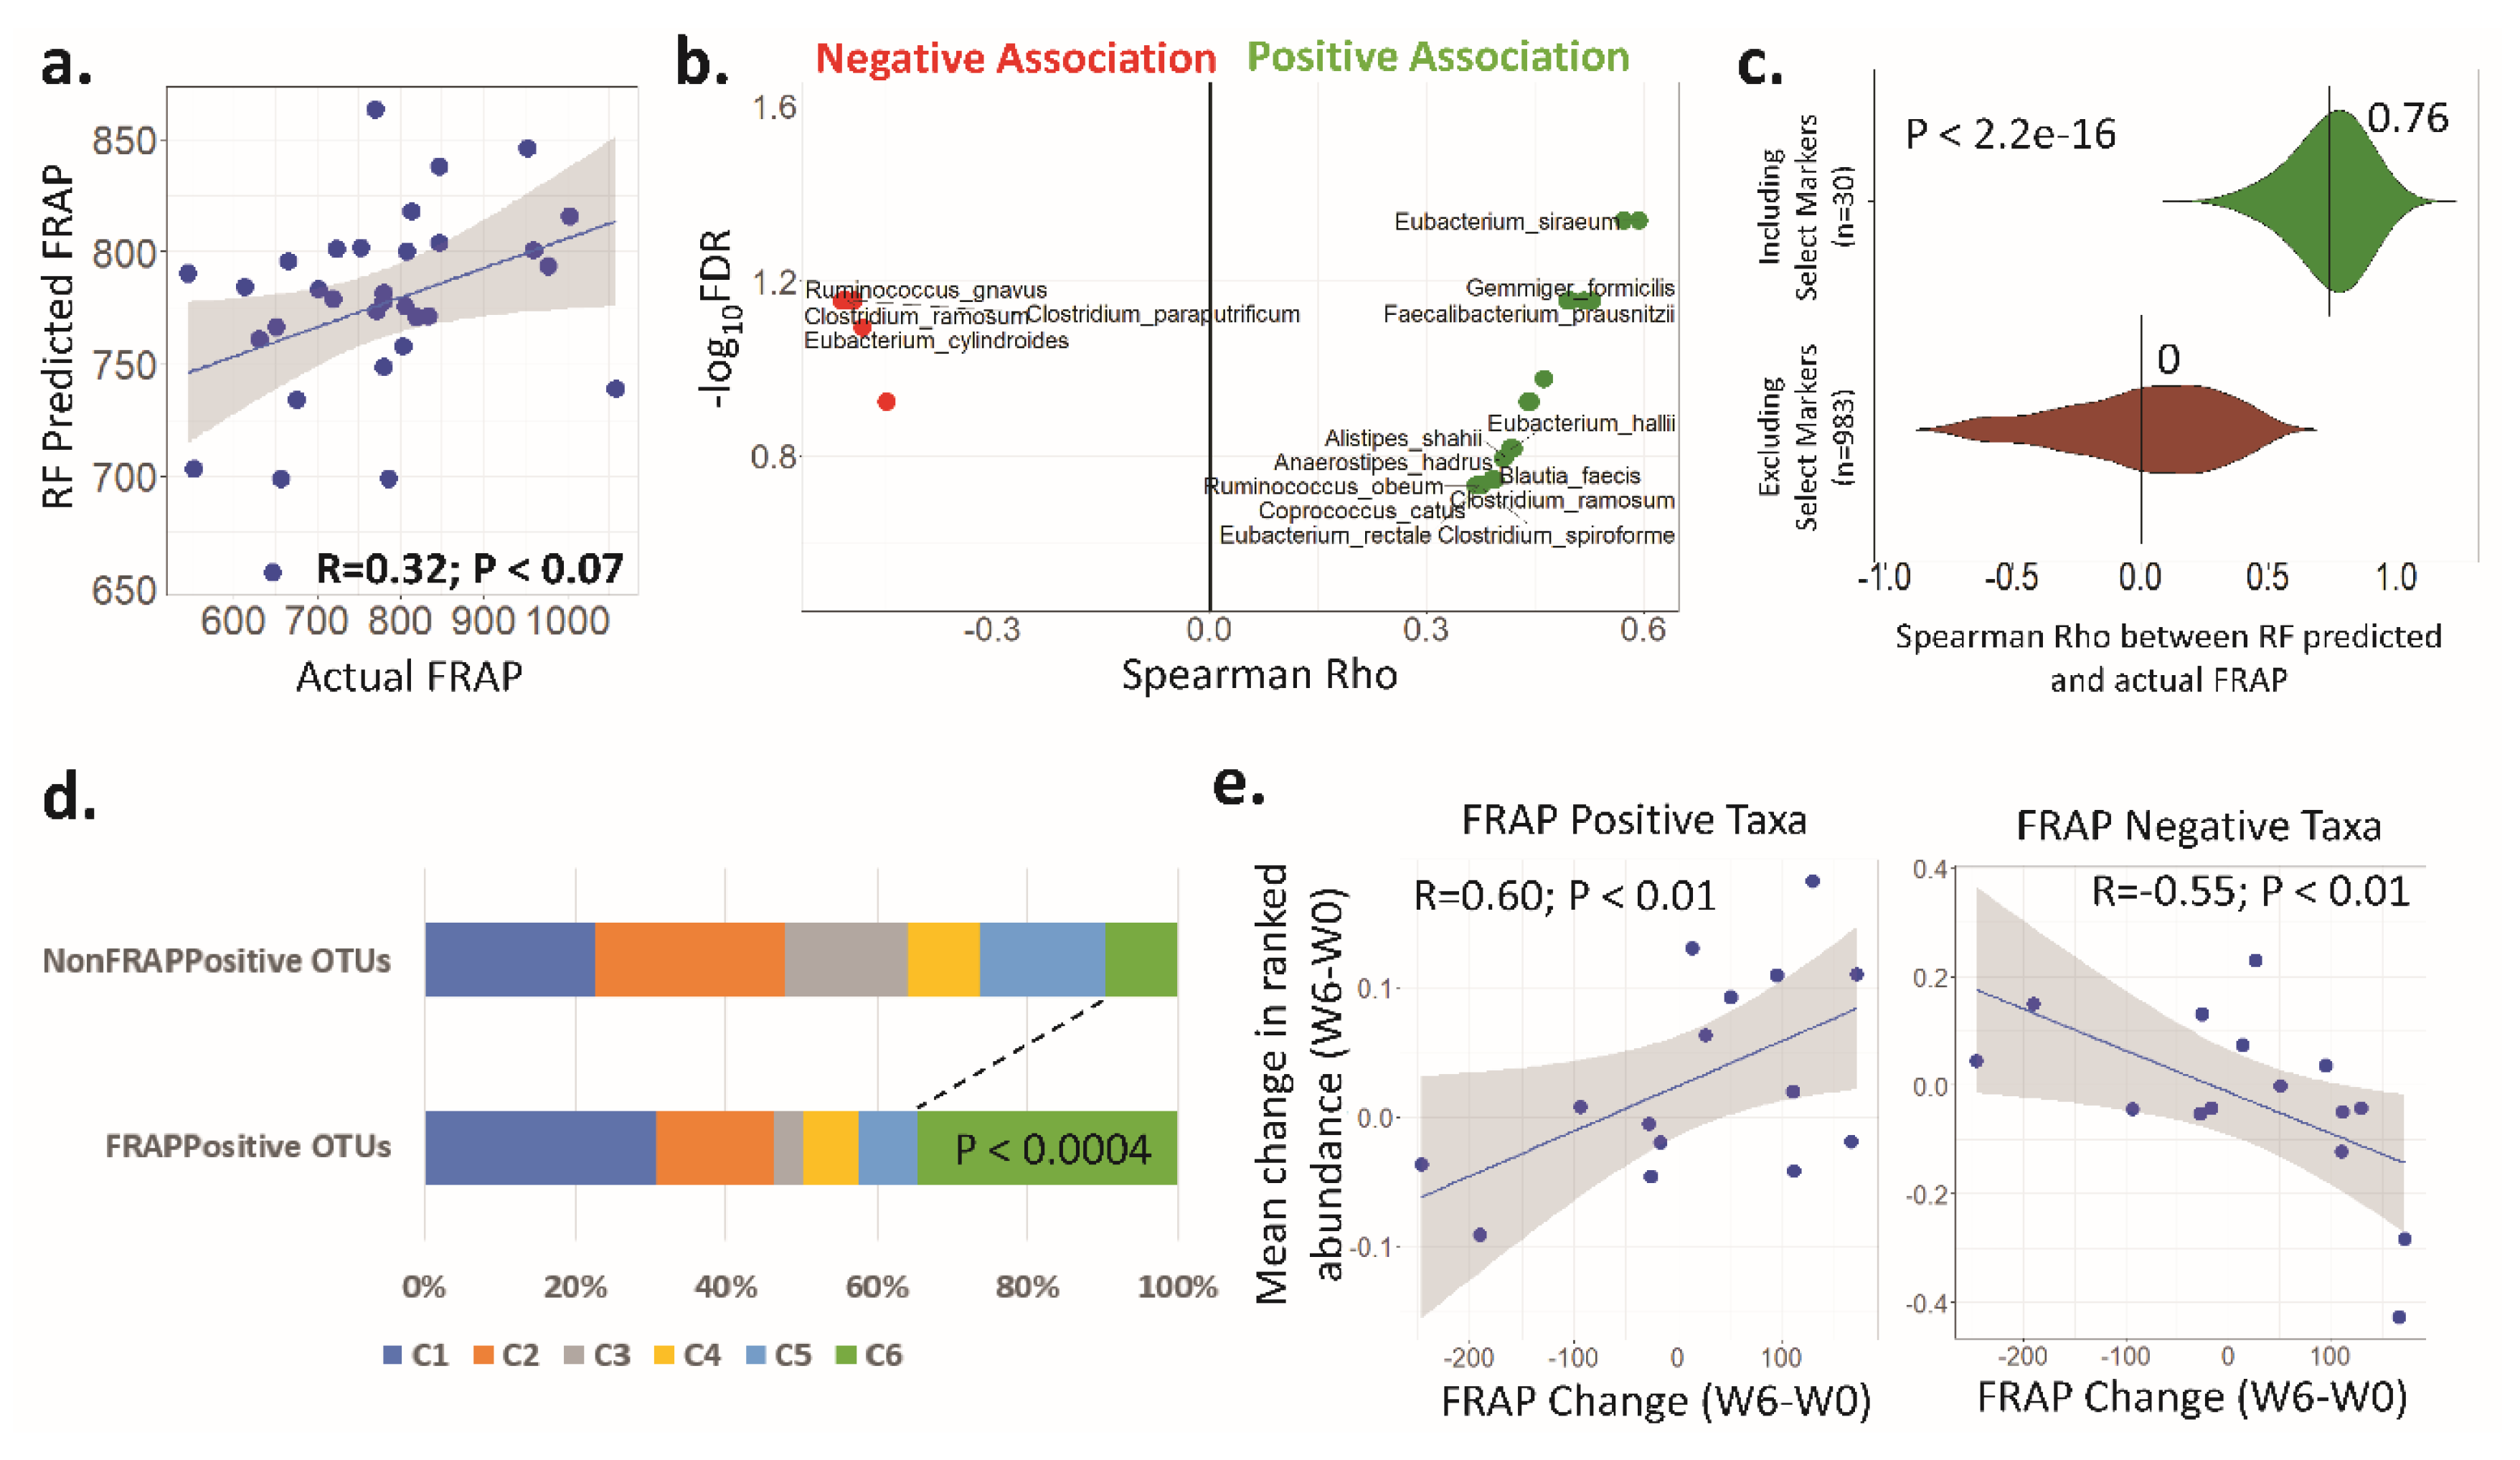
3.4. Antioxidant Activity (FRAP) Is Significantly Associated with the Faecal Microbiota

The levels of plasma CRP, glucose, and FRAP assay measures were collected at W0 and W6 for 10 young and 5 old women. Using PERMANOVA analysis, the association of the gut microbiota at both OTU and CAG level with CRP, glucose, and FRAP was investigated (Table 2). No association between the gut microbiota composition with either the CRP or glucose levels was observed. However, the FRAP assay measures showed significant association with the gut microbiota at both the OTU and CAG level (Table 2).
Random Forest models were built to predict the FRAP assay measure of an individual (at a given time point) based on their gut microbiota composition (at the OTU level) (as described in Materials and Methods). The validation of these models using an iterative leave-one-out-strategy (i.e., excluding from the training model the sample to be predicted) indicated a marginally positive Spearman correlation of 0.32 (p < 0.07), further indicating an association of the microbiome with plasma antioxidant activity (Figure 4a). Thus, in the current study the OTUs were initially ranked in increasing order of their feature importance scores, and subsequently the variation in these feature importance scores across them was investigated.
An exponential increase in scores for the last 150 taxa (or OTUs) as compared to the rest was observed (Figure S10a). The list of the 150 taxa was filtered by selecting only those OTUs that showed significant association with FRAP measures with BH-corrected FDR < 0.1 (Figure S10b). This provided the 30 top predictors of FRAP measures at the OTU level (Figure 4b). While 25 of these top markers were positively associated with FRAP (FRAP-positive markers), five were negatively associated with FRAP (FRAP-negative markers).
The efficacy of these top 30 markers was further evaluated using two variants of iterative Random Forest models, one using only these top 30 and the other using the remaining OTUs (Table S1). A comparison of the performances of the two variants indicated that models created using only these 30 top markers could still predict FRAP measures with a median Spearman Rho of 0.76 (p < 1 × 10⁻⁵), which was significantly higher than those created using the remaining 983 non-marker OTUs (median Rho = 0.02) (p < 2.2 × 10⁻¹⁶) (Figure 4c).
Distinct changes in the markers of FRAP assay measures during the intervention time points were as follows. The FRAP assay measures increased for 9 of the 15 subjects (4 out of 5 old, 5 out of 10 young) (Figure S10c). An overlap between some of the species that were positively associated with FRAP measures and those enriched during BB consumption was observed (Figure 4b). These included gut bacterial species such as F. prausnitzii, E. halii, E. siraeum, C. catus, and A. hadrus.
The representation of the different previously identified CAGs in the subset of FRAP-positive markers was explored. Seventeen out of the 25 FRAP positive markers belonged to either the C1 or the C6 CAGs that were significantly enriched in W4 and W6 time points, respectively (Figure 3b; Figure 4b) Thus, a subset of taxa that were identified as belonging to reportedly beneficial microbial groups enriched in the later stages of BB consumption also showed positive associations with the antioxidant activity. This indicates that BB consumption is associated with microbiome changes that are positively associated with antioxidant activity.
Interestingly, the across-time point changes in FRAP assay measures showed negative associations with the corresponding changes in the plasma glucose levels (Spearman Rho = −0.46; p < 0.05) (Figure S10d). A similar negative association was also observed between the FRAP positive-markers and the plasma glucose levels. Thus, these results overall seem to suggest a step-wise association between BB consumption and plasma glucose levels, wherein the consumption of BBs is associated with the enrichment of specific taxonomic groups, and a subset is positively associated with circulating antioxidant activity, which in turn is negatively associated with the plasma glucose levels. The associations of these OTUs with FRAP were both sample-specific and distinct for time points.

4. Discussion

We have previously reported the reduction in the fecal microbiota α diversity due to the loss of fastidious taxa while the microbiota is adapting to the in vitro conditions of the artificial colon model [39,56]. To retain much of the stool diversity throughout the fermentation period, the basal fermentation medium was supplemented with a mix of indigestible and prebiotic carbohydrates often used in continuous in vitro systems [57]. Importantly, the supplementation of the fermentation medium with the polyphenol-rich fractions ANTH/FLAV, PACs, or prebiotic MIX substrates resulted in a favorable (i.e., health-associated) microbiota profile. Although the content of these fractions was not yet investigated by chromatographic separation, the fractions tested were prepared in the same way as in multiple previous publications, and so they are directly comparable in terms of evaluating their bioactive properties. The α diversity and the abundance of the major microbiota families Lachnospiraceae and Bacteroidaceae were comparatively higher, whereas the Enterobacteriaceae relative abundance was lower compared to TPP and S/A supplementation. The sugar content of the S/A fractions and potential residual sugars in the TPP fraction, which would be expected to be absorbed in the small intestine in humans, may have resulted in the significantly increased relative abundance of these organisms that are potent utilizers of simple sugars [58]. Apart from this explanation, Enterobacteriaceae have been reported to be involved in the metabolism of polyphenols in the gut [27,59]. Importantly, not all Enterobacteriaceae are harmful, with some playing an important role in the “healthy” gut microbiota [9].
Bifidobacteria residing in the colon may be utilizing the polyphenolic sugar content that reaches distal gastrointestinal parts [60,61]. TTP followed by PACs (but not ANTH/FLAV) supplementation were the most efficient additives to maintain the Bifidobacterium abundance levels in the suboptimal in vitro environment. Previous in vitro fermentation studies have yielded conflicting results on the effect of polyphenol-rich fractions on Bifidobacterium spp. abundance in the microbiota [21,62]. Limitations of the in vitro systems and baseline microbiota variations may have contributed to these discrepancies. Human studies have confirmed some effect of polyphenols on bifidobacteria [63].
We observed a trend for microbiota α diversity increase in the group of older women consuming BB, and although the β diversity did not change throughout the intervention period, health-relevant taxa were significantly enriched with BB consumption in subjects of both age groups. We acknowledge the limitations of the small sample size in this study, due in part to the complexity of running a human dietary intervention trial in which the primary objective was to test the effect of BB consumption on the human muscle progenitor cell (hMPC) function [64]. Nevertheless, the current study serves adequately as a pilot study to investigate the potential of regular BB consumption to improve the microbiota diversity in older healthy people. Maintaining microbiota diversity is relevant throughout the lifespan. Risk factors for non-communicable disease are associated with a Western lifestyle [65,66,67]. Decreased gut microbiota diversity as in low species richness and low counts of bacterial genes may correlate to metabolic disease, and therefore global microbiota modulations can promote health in the general population [68,69].
The enrichment of the fecal microbiota in Anaerostipes hadrus, F. prausnitzii, and to a lesser extent Ruminococcus bromii (CAG C1)—all taxa of the “healthy” microbiota [70]—two weeks after BB intervention indicated a potential microbiota adaptation to BB consumption. Enrichment in the major fibrolytic taxon R. bromii [71,72] may represent an adaptation to the regular fibre derived from whole BB fruit. Ruminococcus bromii releases substrates from complex polysaccharides that other microbiota members such as A. hadrus and F. prausnitzii can metabolize [73]. Anaerostipes hadrus is a butyrate producer previously reported to be stimulated by prebiotic fibres [74,75]. The ecological context is important when evaluating the health benefit of taxa that are “prebiotically” stimulated. In the case of A. hadrus, it was reported that it exerted beneficial outcomes in “healthy” microbiota and adverse in dysbiotic microbiota in a mouse model [76], potentially involved in energy harvesting and blood glucose [77]. Faecalibacterium prausnitzii is a key butyrate producer with anti-inflammatory properties, and its reduced abundance in the microbiota has been associated with various gastrointestinal conditions [9,78]. A few studies in mice and humans have shown Faecalibacterium responsiveness to polyphenols, accompanied by metabolism improvement [79,80,81].
Taxa such as E. hallii, B. intestinihominis, and Butyrisimonas virosa (CAG C6) and B. intestinihominis and F. prausnitzii (CAG C3) showed a gradual increase in abundance from baseline towards later intervention time points. The increased abundance of E. hallii, a butyrate producer of the Lachnospiraceae family [70], identified here to be associated with BB consumption, may contribute to improved insulin sensitivity according to in vivo and human studies [82,83]. Other Eubacterium spp. taxa of the Lachnospiraceae family (e.g., E. ramulus and E. rectale) may be involved in the metabolism of polyphenolic compounds (e.g., flavonols, flavanols, and lignans) [84,85]. Similarly, intervention with a polyphenol-rich diet was associated with enrichment in B. intestinihominis and improved metabolism in mice and humans [86,87].
There was some moderate albeit significant correlation of OTUs and CAGs with the FRAP measurements that, in turn, positively correlated with BB consumption, especially in the older group. Conversely, FRAP measurements were negatively correlated with plasma glucose. Many studies on healthy adults have contributed evidence for the antioxidant and anti-inflammatory benefits of the regular consumption of polyphenol-rich foods, such as BB and other berry fruits [88]. There is evidence from cohort and clinical studies of reduced all-cause mortality, lower risk of CVD, improved insulin sensitivity, and lower type 2 diabetes (T2D) risk associated with BB and specifically anthocyanin intake [32]. Importantly, in older age groups anthocyanins appear to lower the risk of cognitive decline [32]. However, there is a lack of human studies investigating the consumption of polyphenol-rich berries, metabolic improvement, and the microbiota, with the majority of relevant data derived from animal studies [27,89,90,91,92]. Importantly, we recognize critics of FRAP assays and that, according to the literature, more oxidative damage markers should be added to allow robust conclusions to be drawn [88].
Here, we report taxa that not only were associated with BB consumption forming distinct CAGs (i.e., E. hallii, B. intestinihominis, A. hadrus, F.prausnitzii) as discussed, but that taxa that mostly belong to the significant CAGs were associated with improved FRAP measurements. In this part of the analysis, we found that E. siraeum (Clostridium cluster IV Ruminococcaceae taxon) and the phylogenetically close F. prausnitzii and G. formicilis [70] were positively associated with FRAP. Interestingly, in humans serum markers of insulin resistance were associated with reduced E. siraeum and Butyrivibrio crossotus abundance [93]. Conversely, G. formicilis and C. catus, identified in this study to be positively associated with FRAP, were associated with obesity [94,95,96,97].

5. Conclusions

In vitro conditions place constraints on microbiota responsiveness to supplementation tests [98]. Notwithstanding this, the investigational studies as presented here offer a straightforward experimental model to test the initial hypothesis and provide insight into informed in vivo study design [99]. In future studies, the potential of the in vitro-identified microbiota response to BB polyphenol-rich fractions can be extended to the development of next-generation symbiotics.
The human study contributed evidence for specific microbiota modulation due to BB consumption in correlation with antioxidant activity in healthy adults. The association of fibrolytic taxa with whole BB consumption may indicate that the BB can contribute to health by both its polyphenolic content and its fibre content that, in effect, may render the fibre-bound polyphenols more accessible to microbiota fermentation [100]. In the context of healthy ageing, BB consumption may increase colonic short chain fatty acid (SCFA) production through fiber contribution to the fibrolytic members of the microbiota and promote health [101]. Importantly, non-pathobionts in the “healthy” microbiota, such as the taxa C. catus or A. hadrus mentioned in our study, may play a variant role within a different health context and in response to external dietary stimuli [102,103]. Strain-level identification is important in order to explain why individuals may respond differently to microbiota modulation [101,104]. Interindividual variation can be of relevance in the way dietary polyphenols impact health, given the fact that their bioavailability largely depends on the gut microbiota enzymatic armor [105]. Future large-scale clinical studies including both women and men and examining the metabolic impact of BB consumption in correlation with microbiota changes, inflammatory markers, and gender will allow for a deeper understanding of the role of BB consumption in human health. At the same time, a detailed chromatographic analysis of the BB fractions described here is desirable to generate greater granularity and detail on what individual compounds are present in each starting fraction, and what they are metabolized into, in the context of the microbiome changes described already in this report.

Supplementary Materials

The following are available online at https://www.mdpi.com/2072-6643/12/9/2800/s1: Figure S1: Boxplots showing the supplementation-independent significant decrease in α diversity measures (a. Shannon and b. Observed Species) for 24 h fermentation. Figure S2: Observed Species α diversity of the fecal microbiota after different BB polyphenol-rich fractions supplementations at 16 h and 24 h. Figure S3: Principal Component Analysis (PCoA) based on Weighted Unifrac distances of microbiota after in vitro fermentation with BB polyphenols. Figure S4: Fecal microbiota compositional description at Family level during 24 h in vitro fermentation with BB polyphenol-rich fractions. Figure S5: Differentially abundant taxa (genus level) in the fecal microbiota after in vitro supplementation with BB polyphenol-rich fractions (average relative abundance < 1%). Figure S6: Alpha diversity of the fecal microbiota of a. young and b. older women of the human trial across all time points. Figure S7: Shannon diversity showing the fecal microbiota α diversity development pre (W0) and post (mean of W4 and W6) BB consumption intervention. Figure S8 Variation in within cohort beta diversity for the Young and Old women. Figure S9: Variation in the cumulated abundances of the OTUs belonging to the six CAGs specifying for old and the young women. Figure S10: Identification of FRAP responsive taxa, their variation across time points and their association with glucose levels. Table S1: padj values of Wilcoxon Signed Rank tests comparing the abundances of the various taxa in fermenter samples belonging to the various supplementation groups. Table S2: Taxonomic classifications of (A) FRAP-positive and (B) FRAP-negative OUT markers obtained using SPINGO.

Author Contributions

A.N.: in vitro study co-design, fecal samples for fermenter experiments collection, performed the in vitro experiments, DNA extractions, 16S rRNA sequencing library preparation, 16S rRNA analysis pipeline, co-wrote and edited the manuscript. T.S.G.: performed bioinformatics and statistical analysis for the in vitro and human study, figure generation, manuscript editing, data deposition. T.T.T.T.: statistics for the in vitro study. M.C.N. collected fecal samples for fermenter inoculation. P.P. and K.V. performed DNA extractions. A.T.-M., J.E.B., and M.E.G. designed, conducted, and collected samples for the human intervention and analyzed clinical parameters and oxidative markers. A.H. performed chromatographic extractions on blueberries to obtain individual fractions. P.W.O. conceived and co-designed the in vitro fermenter analyses, co-analyzed the data, designed and co-analyzed the human microbiome studies and ensuing data, and co-wrote the manuscript. All authors have read and agreed to the published version of the manuscript.

Funding

This research was funded by the following: Work in PWOT’s laboratory is supported by the Government of Ireland National Development Plan by way of a Department of Agriculture, Food, and the Marine (DAFM) under a Food Institutional Research Measure (FIRM) award (14F828), and by a centre award to APC Microbiome Ireland (12/RC/2273_P2) from Science Foundation Ireland. Work in ATM’s laboratory is supported by the National Science Foundation Graduate Research Fellowship Program under Grant No. DGE-1650441 (to JEB). This research was also funded by a grant from the U.S. Highbush Blueberry Council to ATM.

Acknowledgments

We thank the US Highbush Blueberry Council for providing the standardized freeze-dried BB powder for the human dietary intervention. Any opinions, findings, and conclusions or recommendations expressed in this material are those of the author(s) and do not necessarily reflect the views of the National Science Foundation.

Conflicts of Interest

The human intervention study was funded by a grant from the U.S. Highbush Blueberry Council to ATM. The Highbush Blueberry Council was not involved in study design, analysis, or data interpretation, nor did they influence the decision to publish. The role of the Highbush Blueberry Council in the study implementation was limited to provision of the freeze-dried blueberries.

References

  1. Sonnenburg, J.L.; Bäckhed, F. Diet-microbiota interactions as moderators of human metabolism. Nature 2016, 535, 56–64. [Google Scholar] [CrossRef] [PubMed]
  2. Messer, J.S.; Liechty, E.R.; Vogel, O.A.; Chang, E.B. Evolutionary and ecological forces that shape the bacterial communities of the human gut. Mucosal Immunol. 2017, 10, 567–579. [Google Scholar] [CrossRef] [PubMed] [Green Version]
  3. Marchesi, J.R.; Adams, D.H.; Fava, F.; Hermes, G.D.; Hirschfield, G.M.; Hold, G.; Quraishi, M.N.; Kinross, J.; Smidt, H.; Tuohy, K.M.; et al. The gut microbiota and host health: A new clinical frontier. Gut 2016, 65, 330–339. [Google Scholar] [CrossRef] [PubMed] [Green Version]
  4. Petersen, C.; Round, J.L. Defining dysbiosis and its influence on host immunity and disease. Cell. Microbiol. 2014, 16, 1024–1033. [Google Scholar] [CrossRef]
  5. Jeffery, I.B.; Lynch, D.B.; O’Toole, P.W. Composition and temporal stability of the gut microbiota in older persons. ISME J. 2016, 10, 170–182. [Google Scholar] [CrossRef] [Green Version]
  6. Thevaranjan, N.; Puchta, A.; Schulz, C.; Naidoo, A.; Szamosi, J.C.; Verschoor, C.P.; Loukov, D.; Schenck, L.P.; Jury, J.; Foley, K.P.; et al. Age-associated microbial dysbiosis promotes intestinal permeability, systemic inflammation, and macrophage dysfunction. Cell Host Microbe 2017, 21, 455–466.e4. [Google Scholar] [CrossRef]
  7. McCarville, J.L.; Caminero, A.; Verdu, E.F. Novel perspectives on therapeutic modulation of the gut microbiota. Therap. Adv. Gastroenterol. 2016, 9, 580–593. [Google Scholar] [CrossRef] [Green Version]
  8. Salazar, N.; Valdés-Varela, L.; González, S.; Gueimonde, M.; de Los Reyes-Gavilán, C.G. Nutrition and the gut microbiome in the elderly. Gut Microbes 2017, 8, 82–97. [Google Scholar] [CrossRef]
  9. O’Toole, P.W.; Marchesi, J.R.; Hill, C. Next-generation probiotics: The spectrum from probiotics to live biotherapeutics. Nat. Microbiol. 2017, 2, 17057. [Google Scholar] [CrossRef]
  10. Fraga, C.G.; Croft, K.D.; Kennedy, D.O.; Tomás-Barberán, F.A. The effects of polyphenols and other bioactives on human health. Food Funct. 2019, 10, 514–528. [Google Scholar] [CrossRef] [Green Version]
  11. Van Hul, M.; Cani, P.D. Targeting carbohydrates and polyphenols for a healthy microbiome and healthy weight. Curr. Nutr. Rep. 2019, 8, 307–316. [Google Scholar] [CrossRef] [PubMed] [Green Version]
  12. Durazzo, A.; Lucarini, M.; Souto, E.B.; Cicala, C.; Caiazzo, E.; Izzo, A.A.; Novellino, E.; Santini, A. Polyphenols: A concise overview on the chemistry, occurrence, and human health. Phyther. Res. 2019, 33, 2221–2243. [Google Scholar] [CrossRef] [PubMed] [Green Version]
  13. Panche, A.N.; Diwan, A.D.; Chandra, S.R. Flavonoids: An overview. J. Nutr. Sci. 2016, 5, 1–15. [Google Scholar] [CrossRef] [PubMed] [Green Version]
  14. Pojer, E.; Mattivi, F.; Johnson, D.; Stockley, C.S. The case for anthocyanin consumption to promote human health: A review. Compr. Rev. Food Sci. Food Saf. 2013, 12, 483–508. [Google Scholar] [CrossRef]
  15. Li, D.; Wang, P.; Luo, Y.; Zhao, M.; Chen, F. Health benefits of anthocyanins and molecular mechanisms: Update from recent decade. Crit. Rev. Food Sci. Nutr. 2017, 57, 1729–1741. [Google Scholar] [CrossRef] [PubMed]
  16. Chun, O.K.; Chung, S.J.; Song, W.O. Estimated dietary flavonoid intake and major food sources of U.S. adults. J. Nutr. 2007, 137, 1244–1252. [Google Scholar] [CrossRef] [PubMed] [Green Version]
  17. Chun, O.K.; Lee, S.G.; Wang, Y.; Vance, T.; Song, W.O. Estimated flavonoid intake of the elderly in the United States and around the world. J. Nutr. Gerontol. Geriatr. 2012, 31, 190–205. [Google Scholar] [CrossRef] [PubMed]
  18. Beking, K.; Vieira, A. An assessment of dietary flavonoid intake in the UK and Ireland. Int. J. Food Sci. Nutr. 2011, 62, 17–19. [Google Scholar] [CrossRef]
  19. Vogiatzoglou, A.; Mulligan, A.A.; Lentjes, M.A.H.; Luben, R.N.; Spencer, J.P.E.; Schroeter, H.; Khaw, K.T.; Kuhnle, G.G.C. Flavonoid intake in European adults (18 to 64 Years). PLoS ONE 2015, 10, e0128132. [Google Scholar] [CrossRef] [PubMed]
  20. Rowland, I.; Gibson, G.; Heinken, A.; Scott, K.; Swann, J.; Thiele, I.; Tuohy, K. Gut microbiota functions: Metabolism of nutrients and other food components. Eur. J. Nutr. 2018, 57, 1–24. [Google Scholar] [CrossRef] [Green Version]
  21. Dueñas, M.; Muñoz-González, I.; Cueva, C.; Jiménez-Girón, A.; Sánchez-Patán, F.; Santos-Buelga, C.; Moreno-Arribas, M.V.; Bartolomé, B. A survey of modulation of gut microbiota by dietary polyphenols. Biomed. Res. Int. 2015, 2015, 15. [Google Scholar] [CrossRef] [PubMed]
  22. Zhang, X.; Yang, Y.; Wu, Z.; Weng, P. The modulatory effect of anthocyanins from purple sweet potato on human intestinal microbiota in vitro. J. Agric. Food Chem. 2016, 64, 2582–2590. [Google Scholar] [CrossRef] [PubMed]
  23. Lacombe, A.; Li, R.W.; Klimis-Zacas, D.; Kristo, A.S.; Tadepalli, S.; Krauss, E.; Young, R.; Wu, V.C.H. Lowbush wild blueberries have the potential to modify gut microbiota and xenobiotic metabolism in the rat colon. PLoS ONE 2013, 8, e67497. [Google Scholar] [CrossRef]
  24. Anhê, F.F.; Roy, D.; Pilon, G.; Dudonné, S.; Matamoros, S.; Varin, T.V.; Garofalo, C.; Moine, Q.; Desjardins, Y.; Levy, E.; et al. A polyphenol-rich cranberry extract protects from diet-induced obesity, insulin resistance and intestinal inflammation in association with increased Akkermansia spp. population in the gut microbiota of mice. Gut 2015, 64, 872–883. [Google Scholar] [CrossRef] [Green Version]
  25. Baldwin, J.; Collins, B.; Wolf, P.G.; Martinez, K.; Shen, W.; Chuang, C.C.; Zhong, W.; Cooney, P.; Cockrell, C.; Chang, E.; et al. Table grape consumption reduces adiposity and markers of hepatic lipogenesis and alters gut microbiota in butter fat-fed mice. J. Nutr. Biochem. 2016, 27, 123–135. [Google Scholar] [CrossRef] [Green Version]
  26. Fotschki, B.; Juśkiewicz, J.; Jurgoński, A.; Kołodziejczyk, K.; Milala, J.; Kosmala, M.; Zduńczyk, Z. Anthocyanins in strawberry polyphenolic extract enhance the beneficial effects of diets with fructooligosaccharides in the rat cecal environment. PLoS ONE 2016, 11, 1–17. [Google Scholar] [CrossRef] [PubMed]
  27. Lee, S.; Keirsey, K.I.; Kirkland, R.; Grunewald, Z.I.; Fischer, J.G.; de La Serre, C.B. Blueberry supplementation influences the gut microbiota, inflammation, and insulin resistance in high-fat-diet–fed rats. J. Nutr. 2018, 148, 209–219. [Google Scholar] [CrossRef] [Green Version]
  28. Bekiares, N.; Krueger, C.G.; Meudt, J.J.; Shanmuganayagam, D.; Reed, J.D. Effect of sweetened dried cranberry consumption on urinary proteome and fecal microbiome in healthy human subjects. Omi. A J. Integr. Biol. 2018, 22, 145–153. [Google Scholar] [CrossRef] [Green Version]
  29. Rodríguez-Morató, J.; Matthan, N.R.; Liu, J.; de la Torre, R.; Chen, C.-Y.O. Cranberries attenuate animal-based diet-induced changes in microbiota composition and functionality: A randomized crossover controlled feeding trial. J. Nutr. Biochem. 2018, 62, 76–86. [Google Scholar] [CrossRef] [Green Version]
  30. Gómez-Juaristi, M.; Sarria, B.; Martínez-López, S.; Clemente, L.B.; Mateos, R. Flavanol bioavailability in two cocoa products with different phenolic content. A comparative study in humans. Nutrients 2019, 11, 1441. [Google Scholar] [CrossRef] [Green Version]
  31. Fallani, M.; Amarri, S.; Uusijarvi, A.; Adam, R.; Khanna, S.; Aguilera, M.; Gil, A.; Vieites, J.M.; Norin, E.; Young, D.; et al. Determinants of the human infant intestinal microbiota after the introduction of first complementary foods in infant samples from five European centres. Microbiology 2011, 157, 1385–1392. [Google Scholar] [CrossRef] [PubMed] [Green Version]
  32. Kalt, W.; Cassidy, A.; Howard, L.R.; Krikorian, R.; Stull, A.J.; Tremblay, F.; Zamora-ros, R. Recent research on the health benefits of blueberries and their anthocyanins. Adv. Nutr. 2020, 11, 224–236. [Google Scholar] [CrossRef] [PubMed]
  33. Kalt, W.; McDonald, J.E.; Donner, H. Antioxidant capacity of processed lowbush blueberry products. Food Chem. Toxicol. 2000, 65, 390–393. [Google Scholar]
  34. Naczk, M.; Amarowicz, R.; Zadernowski, R.; Pegg, R.; Shahidi, F. Antioxidant activity of crude phenolic extracts from wild blueberry leaves. Pol. J. Food Nutr. Sci. 2003, 12, 166–169. [Google Scholar]
  35. Nackz, M.; Zadernowski, R.; Shahidi, F. Antioxidant Capacity of Phenolic Extracts from Selected Food By-Products; American Chemical Society: Washington, DC, USA, 2007; pp. 184–194. ISBN 0841274282. [Google Scholar]
  36. Krikorian, R.; Shidler, M.D.; Nash, T.A.; Kalt, W.; Vinqvist-Tymchuk, M.R.; Shukitt-Hale, B.; Joseph, J.A. Blueberry supplementation improves memory in older adults. J. Agric. Food Chem. 2010, 58, 3996–4000. [Google Scholar] [CrossRef] [PubMed] [Green Version]
  37. Zhou, T.; Wei, C.; Lan, W.; Zhao, Y.; Pan, Y.; Sun, X.; Wu, V.C.H. The effect of Chinese wild blueberry fractions on the growth and membrane integrity of various foodborne pathogens. J. Food Sci. 2020, 85, 1513–1522. [Google Scholar] [CrossRef] [PubMed]
  38. Hidalgo, M.; Oruna-Concha, M.J.; Kolida, S.; Walton, G.E.; Kallithraka, S.; Spencer, J.P.E.; Gibson, G.R.; De Pascual-Teresa, S. Metabolism of anthocyanins by human gut microflora and their influence on gut bacterial growth. J. Agric. Food Chem. 2012, 60, 3882–3890. [Google Scholar] [CrossRef] [PubMed]
  39. Ntemiri, A.; Chonchúir, F.N.; O’Callaghan, T.F.; Stanton, C.; Ross, R.P.; O’Toole, P.W. Glycomacropeptide sustains microbiota diversity and promotes specific taxa in an artificial colon model of elderly gut microbiota. J. Agric. Food Chem. 2017, 65, 1836–1846. [Google Scholar] [CrossRef]
  40. Duncan, S.H.; Holtrop, G.; Lobley, G.E.; Calder, A.G.; Stewart, C.S.; Flint, H.J. Contribution of acetate to butyrate formation by human faecal bacteria. Br. J. Nutr. 2004, 91, 915–923. [Google Scholar] [CrossRef] [Green Version]
  41. Tzounis, X. Flavanol monomer-induced changes to the human faecal microflora. Br. J. Nutr. 2008, 99, 782–792. [Google Scholar] [CrossRef] [Green Version]
  42. Klindworth, A.; Pruesse, E.; Schweer, T.; Peplies, J.; Quast, C.; Horn, M.; Glöckner, F.O. Evaluation of general 16S ribosomal RNA gene PCR primers for classical and next-generation sequencing-based diversity studies. Nucleic Acids Res. 2012, 41, 1–11. [Google Scholar] [CrossRef] [PubMed]
  43. Howell, A.B.; Reed, J.D.; Krueger, C.G.; Winterbottom, R.; Cunningham, D.G.; Leahy, M. A-type cranberry proanthocyanidins and uropathogenic bacterial anti-adhesion activity. Phytochemistry 2005, 66, 2281–2291. [Google Scholar] [CrossRef] [PubMed]
  44. Youdim, K.A.; McDonald, J.; Kalt, W.; Joseph, J.A. Potential role of dietary flavonoids in reducing microvascular endothelium vulnerability to oxidative and inflammatory insults. J. Nutr. Biochem. 2002, 13, 282–288. [Google Scholar] [CrossRef]
  45. Schmidt, B.M.; Howell, A.B.; McEniry, B.; Knight, C.T.; Seigler, D.; Erdman, J.W.; Lila, M.A. Effective separation of potent antiproliferation and antiadhesion components from wild blueberry (Vaccinium angustifolium Ait.) fruits. J. Agric. Food Chem. 2004, 52, 6433–6442. [Google Scholar] [CrossRef] [PubMed]
  46. Yi, W.; Fischer, J.; Krewer, G.; Akoh, C.C. Phenolic compounds from blueberries can inhibit colon cancer cell proliferation and induce apoptosis. J. Agric. Food Chem. 2005, 53, 7320–7329. [Google Scholar] [CrossRef]
  47. Benzie, I.F.F.; Devaki, M. The Ferric Reducing/Antioxidant Power (FRAP) assay for non-enzymatic antioxidant capacity: Concepts, procedures, limitations and applications. In Measurement of Antioxidant Activity & Capacity Functional Food Science and Technology Series, 1st ed.; Apak, R., Capanoglu, E., Shahidi, F., Eds.; John Wiley & Sons, Inc.: Hoboken, NJ, USA, 2018; ISBN 9781119135357. [Google Scholar]
  48. Ntemiri, A.; Ribière, C.; Stanton, C.; Ross, R.P.; O’Connor, E.M.; O’Toole, P.W. Retention of microbiota diversity by lactose-free milk in a mouse model of elderly gut microbiota. J. Agric. Food Chem. 2019, 67, 2098–2112. [Google Scholar] [CrossRef] [Green Version]
  49. Magoc, T.; Salzberg, S.L. FLASH: Fast length adjustment of short reads to improve genome assemblies. Bioinformatics 2011, 27, 2957–2963. [Google Scholar] [CrossRef]
  50. Caporaso, J.G.; Kuczynski, J.; Stombaugh, J.; Bittinger, K.; Bushman, F.D.; Costello, E.K.; Fierer, N.; Gonzalez Peña, A.; Goodrich, J.K.; Gordon, J.I.; et al. QIIME allows analysis of high-throughput community sequencing data. Nat. Methods 2010, 7, 335–336. [Google Scholar] [CrossRef] [Green Version]
  51. Martin, M. Cutadapt removes adapter sequences from high-throughput sequencing reads. EMBnet. J. 2011, 17, 10. [Google Scholar] [CrossRef]
  52. Schloss, P.D.; Westcott, S.L.; Ryabin, T.; Hall, J.R.; Hartmann, M.; Hollister, E.B.; Lesniewski, R.A.; Oakley, B.B.; Parks, D.H.; Robinson, C.J.; et al. Introducing mothur: Open-source, platform-independent, community-supported software for describing and comparing microbial communities. Appl. Environ. Microbiol. 2009, 75, 7537–7541. [Google Scholar] [CrossRef] [Green Version]
  53. Allard, G.; Ryan, F.J.; Jeffery, I.B.; Claesson, M.J. SPINGO: A rapid species-classifier for microbial amplicon sequences. BMC Bioinform. 2015, 16, 1–8. [Google Scholar] [CrossRef] [PubMed] [Green Version]
  54. Caporaso, J.G.; Bittinger, K.; Bushman, F.D.; Desantis, T.Z.; Andersen, G.L.; Knight, R. PyNAST: A flexible tool for aligning sequences to a template alignment. Bioinformatics 2010, 26, 266–267. [Google Scholar] [CrossRef] [PubMed] [Green Version]
  55. Ghosh, T.S.; Rampelli, S.; Jeffery, I.B.; Santoro, A.; Neto, M.; Capri, M.; Giampieri, E.; Jennings, A.; Candela, M.; Turroni, S.; et al. Mediterranean diet intervention alters the gut microbiome in older people reducing frailty and improving health status: The NU-AGE 1-year dietary intervention across five European countries. Gut 2020, 69, 1218–1228. [Google Scholar] [CrossRef] [PubMed] [Green Version]
  56. Macfarlane, G.T.; Macfarlane, S. Models for intestinal fermentation: Association between food components, delivery systems, bioavailability and functional interactions in the gut. Curr. Opin. Biotechnol. 2007, 18, 156–162. [Google Scholar] [CrossRef] [PubMed]
  57. Aguirre, M.; Eck, A.; Koenen, M.E.; Savelkoul, P.H.M.; Budding, A.E.; Venema, K. Evaluation of an optimal preparation of human standardized fecal inocula for in vitro fermentation studies. J. Microbiol. Methods 2015, 117, 78–84. [Google Scholar] [CrossRef]
  58. Zoetendal, E.G.; Raes, J.; van den Bogert, B.; Arumugam, M.; Booijink, C.C.; Troost, F.J.; Bork, P.; Wels, M.; de Vos, W.M.; Kleerebezem, M. The human small intestinal microbiota is driven by rapid uptake and conversion of simple carbohydrates. ISME J. 2012, 6, 1415–1426. [Google Scholar] [CrossRef]
  59. Shao, Y.; Ding, R.; Xu, B.; Hua, R.; Shen, Q.; He, K.; Yao, Q. Alterations of gut microbiota after Roux-en-Y gastric bypass and sleeve gastrectomy in sprague-dawley rats. Obes. Surg. 2017, 27, 295–302. [Google Scholar] [CrossRef]
  60. Kawabata, K.; Yoshioka, Y.; Terao, J. Role of intestinal microbiota in the bioavailability and physiological functions of dietary polyphenols. Molecules 2019, 24, 370. [Google Scholar] [CrossRef] [Green Version]
  61. Pokusaeva, K.; Fitzgerald, G.F.; van Sinderen, D. Carbohydrate metabolism in Bifidobacteria. Genes Nutr. 2011, 6, 285–306. [Google Scholar] [CrossRef] [Green Version]
  62. Sánchez-Patán, F.; Barroso, E.; van de Wiele, T.; Jiménez-Girón, A.; Martín-Alvarez, P.J.; Moreno-Arribas, M.V.; Martínez-Cuesta, M.C.; Peláez, C.; Requena, T.; Bartolomé, B. Comparative in vitro fermentations of cranberry and grape seed polyphenols with colonic microbiota. Food Chem. 2015, 183, 273–282. [Google Scholar] [CrossRef]
  63. Guglielmetti, S.; Fracassetti, D.; Taverniti, V.; Del Bo’, C.; Vendrame, S.; Klimis-Zacas, D.; Arioli, S.; Riso, P.; Porrini, M. Differential modulation of human intestinal bifidobacterium populations after consumption of a wild blueberry (vaccinium angustifolium) drink. J. Agric. Food Chem. 2013, 61, 8134–8140. [Google Scholar] [CrossRef] [PubMed]
  64. Blum, J.; Gheller, B.; Hwang, S.; Bender, E.; Gheller, M.; Thalacker-Mercer, A. Consumption of a blueberry-enriched diet by women for 6 weeks alters determinants of human muscle progenitor cell function. J. Nutr. 2020, 1, 2412–2418. [Google Scholar] [CrossRef] [PubMed]
  65. Lusis, A.J.; Attie, A.D.; Reue, K. Metabolic syndrome: From epidemiology to systems biology. Nat. Rev. Genet. 2008, 9, 819–830. [Google Scholar] [CrossRef] [PubMed]
  66. Catrysse, L.; van Loo, G. Inflammation and the metabolic syndrome: The tissue-specific functions of NF-κB. Trends Cell Biol. 2017, 27, 417–429. [Google Scholar] [CrossRef] [PubMed]
  67. Christ, A.; Latz, E. The Western lifestyle has lasting effects on metaflammation. Nat. Rev. Immunol. 2019, 19, 267–268. [Google Scholar] [CrossRef] [PubMed]
  68. Le Chatelier, E.; Nielsen, T.; Qin, J.; Prifti, E.; Hildebrand, F.; Falony, G.; Almeida, M.; Arumugam, M.; Batto, J.-M.; Kennedy, S.; et al. Richness of human gut microbiome correlates with metabolic markers. Nature 2013, 500, 541–546. [Google Scholar] [CrossRef]
  69. Moeller, A.H. The shrinking human gut microbiome. Curr. Opin. Microbiol. 2017, 38, 30–35. [Google Scholar] [CrossRef]
  70. Rajilić-Stojanović, M.; de Vos, W.M. The first 1000 cultured species of the human gastrointestinal microbiota. FEMS Microbiol. Rev. 2014, 38, 996–1047. [Google Scholar] [CrossRef]
  71. Abell, G.C.J.; Cooke, C.M.; Bennett, C.N.; Conlon, M.A.; McOrist, A.L. Phylotypes related to Ruminococcus bromii are abundant in the large bowel of humans and increase in response to a diet high in resistant starch. FEMS Microbiol. Ecol. 2008, 66, 505–515. [Google Scholar] [CrossRef] [Green Version]
  72. Ze, X.; Duncan, S.H.; Louis, P.; Flint, H.J. Ruminococcus bromii is a keystone species for the degradation of resistant starch in the human colon. ISME J. 2012, 6, 1535–1543. [Google Scholar] [CrossRef]
  73. Cockburn, D.W.; Koropatkin, N.M. Polysaccharide degradation by the intestinal microbiota and its influence on human health and disease. J. Mol. Biol. 2016, 428, 3230–3252. [Google Scholar] [CrossRef] [PubMed]
  74. Scott, K.P.; Martin, J.C.; Duncan, S.H.; Flint, H.J. Prebiotic stimulation of human colonic butyrate-producing bacteria and bifidobacteria, in vitro. FEMS Microbiol. Ecol. 2014, 87, 30–40. [Google Scholar] [CrossRef] [PubMed] [Green Version]
  75. Vandeputte, D.; Falony, G.; Vieira-Silva, S.; Wang, J.; Sailer, M.; Theis, S.; Verbeke, K.; Raes, J. Prebiotic inulin-type fructans induce specific changes in the human gut microbiota. Gut 2017, 66, 1968–1974. [Google Scholar] [CrossRef] [PubMed]
  76. Aron-Wisnewsky, J.; Prifti, E.; Belda, E.; Ichou, F.; Kayser, B.D.; Dao, M.C.; Verger, E.O.; Hedjazi, L.; Bouillot, J.-L.; Chevallier, J.-M.; et al. Major microbiota dysbiosis in severe obesity: Fate after bariatric surgery. Gut 2019, 68, 70–82. [Google Scholar] [CrossRef]
  77. Zeevi, D.; Korem, T.; Zmora, N.; Israeli, D.; Rothschild, D.; Weinberger, A.; Ben-Yacov, O.; Lador, D.; Avnit-Sagi, T.; Lotan-Pompan, M.; et al. Personalized nutrition by prediction of glycemic responses. Cell 2015, 163, 1079–1095. [Google Scholar] [CrossRef] [PubMed] [Green Version]
  78. Koh, A.; De Vadder, F.; Kovatcheva-Datchary, P.; Bäckhed, F. From dietary fiber to host physiology: Short-chain fatty acids as key bacterial metabolites. Cell 2016, 165, 1332–1345. [Google Scholar] [CrossRef] [PubMed] [Green Version]
  79. Heyman-Lindén, L.; Kotowska, D.; Sand, E.; Bjursell, M.; Plaza, M.; Turner, C.; Holm, C.; Fåk, F.; Berger, K. Lingonberries alter the gut microbiota and prevent low-grade inflammation in high-fat diet fed mice. Food Nutr. Res. 2016, 60, 29993. [Google Scholar] [CrossRef] [PubMed] [Green Version]
  80. Moreno-Indias, I.; Sánchez-Alcoholado, L.; Pérez-Martínez, P.; Andrés-Lacueva, C.; Cardona, F.; Tinahones, F.; Queipo-Ortuño, M.I. Red wine polyphenols modulate fecal microbiota and reduce markers of the metabolic syndrome in obese patients. Food Funct. 2016, 7, 1775–1787. [Google Scholar] [CrossRef] [Green Version]
  81. González-Sarrías, A.; Romo-Vaquero, M.; García-Villalba, R.; Cortés-Martín, A.; Selma, M.V.; Espín, J.C. The endotoxemia marker lipopolysaccharide-binding protein is reduced in overweight-obese subjects consuming pomegranate extract by modulating the gut microbiota: A randomized clinical trial. Mol. Nutr. Food Res. 2018, 62, 1800160. [Google Scholar] [CrossRef]
  82. Vrieze, A.; Van Nood, E.; Holleman, F.; Salojärvi, J.; Kootte, R.S.; Bartelsman, J.F.W.M.; Dallinga-Thie, G.M.; Ackermans, M.T.; Serlie, M.J.; Oozeer, R.; et al. Transfer of intestinal microbiota from lean donors increases insulin sensitivity in individuals with metabolic syndrome. Gastroenterology 2012, 143, 913–916.e7. [Google Scholar] [CrossRef]
  83. Udayappan, S.; Manneras-Holm, L.; Chaplin-Scott, A.; Belzer, C.; Herrema, H.; Dallinga-Thie, G.M.; Duncan, S.H.; Stroes, E.S.G.; Groen, A.K.; Flint, H.J.; et al. Oral treatment with Eubacterium hallii improves insulin sensitivity in db/db mice. NPJ Biofilms Microbiomes 2016, 2, 16009. [Google Scholar] [CrossRef] [PubMed] [Green Version]
  84. Marín, L.; Miguélez, E.M.; Villar, C.J.; Lombó, F. Bioavailability of dietary polyphenols and gut microbiota metabolism: Antimicrobial properties. Biomed. Res. Int. 2015, 2015, 1–18. [Google Scholar] [CrossRef] [PubMed] [Green Version]
  85. Ozdal, T.; Sela, D.A.; Xiao, J.; Boyacioglu, D.; Chen, F.; Capanoglu, E. The reciprocal interactions between polyphenols and gut microbiota and effects on bioaccessibility. Nutrients 2016, 8, 78. [Google Scholar] [CrossRef] [PubMed]
  86. Anhê, F.F.; Nachbar, R.T.; Varin, T.V.; Vilela, V.; Dudonné, S.; Pilon, G.; Fournier, M.; Lecours, M.-A.; Desjardins, Y.; Roy, D.; et al. A polyphenol-rich cranberry extract reverses insulin resistance and hepatic steatosis independently of body weight loss. Mol. Metab. 2017, 6, 1563–1573. [Google Scholar] [CrossRef] [PubMed]
  87. Anhê, F.F.; Nachbar, R.T.; Varin, T.V.; Trottier, J.; Dudonné, S.; Le Barz, M.; Feutry, P.; Pilon, G.; Barbier, O.; Desjardins, Y.; et al. Treatment with camu camu ( Myrciaria dubia ) prevents obesity by altering the gut microbiota and increasing energy expenditure in diet-induced obese mice. Gut 2019, 68, 453–464. [Google Scholar] [CrossRef] [PubMed] [Green Version]
  88. Del Bo, C.; Martini, D.; Porrini, M.; Klimis-Zacas, D.; Riso, P. Berries and oxidative stress markers: An overview of human intervention studies. Food Funct. 2015, 6, 2890–2917. [Google Scholar] [CrossRef] [PubMed]
  89. Wankhade, U.D.; Zhong, Y.; Lazarenko, O.P.; Chintapalli, S.V.; Piccolo, B.D.; Chen, J.R.; Shankar, K. Sex-specific changes in gut microbiome composition following blueberry consumption in C57Bl/6J mice. Nutrients 2019, 11, 313. [Google Scholar] [CrossRef] [Green Version]
  90. De Freitas Carvalho, M.M.; Lage, N.N.; de Souza Paulino, A.H.; Pereira, R.R.; de Almeida, L.T.; da Silva, T.F.; de Brito Magalhães, C.L.; de Lima, W.G.; Silva, M.E.; Pedrosa, M.L.; et al. Effects of açai on oxidative stress, ER stress, and inflammation-related parameters in mice with high fat diet-fed induced NAFLD. Sci. Rep. 2019, 9, 1–11. [Google Scholar] [CrossRef] [Green Version]
  91. Frolinger, T.; Sims, S.; Smith, C.; Wang, J.; Cheng, H.; Faith, J.; Ho, L.; Hao, K.; Pasinetti, G.M. The gut microbiota composition affects dietary polyphenols-mediated cognitive resilience in mice by modulating the bioavailability of phenolic acids. Sci. Rep. 2019, 9, 1–10. [Google Scholar] [CrossRef] [Green Version]
  92. Rodríguez-Daza, M.C.; Daoust, L.; Boutkrabt, L.; Pilon, G.; Varin, T.; Dudonné, S.; Levy, É.; Marette, A.; Roy, D.; Desjardins, Y. Wild blueberry proanthocyanidins shape distinct gut microbiota profile and influence glucose homeostasis and intestinal phenotypes in high-fat high-sucrose fed mice. Sci. Rep. 2020, 10, 1–16. [Google Scholar] [CrossRef] [Green Version]
  93. Pedersen, H.K.; Gudmundsdottir, V.; Nielsen, H.B.; Hyotylainen, T.; Nielsen, T.; Jensen, B.A.H.; Forslund, K.; Hildebrand, F.; Prifti, E.; Falony, G.; et al. Human gut microbes impact host serum metabolome and insulin sensitivity. Nature 2016, 535, 376–381. [Google Scholar] [CrossRef] [PubMed]
  94. Kasai, C.; Sugimoto, K.; Moritani, I.; Tanaka, J.; Oya, Y.; Inoue, H.; Tameda, M.; Shiraki, K.; Ito, M.; Takei, Y.; et al. Comparison of the gut microbiota composition between obese and non-obese individuals in a Japanese population, as analyzed by terminal restriction fragment length polymorphism and next-generation sequencing. BMC Gastroenterol. 2015, 15, 1–10. [Google Scholar] [CrossRef] [PubMed] [Green Version]
  95. Lagkouvardos, I.; Kläring, K.; Heinzmann, S.S.; Platz, S.; Scholz, B.; Engel, K.-H.; Schmitt-Kopplin, P.; Haller, D.; Rohn, S.; Skurk, T.; et al. Gut metabolites and bacterial community networks during a pilot intervention study with flaxseeds in healthy adult men. Mol. Nutr. Food Res. 2015, 59, 1614–1628. [Google Scholar] [CrossRef]
  96. Patrone, V.; Vajana, E.; Minuti, A.; Callegari, M.L.; Federico, A.; Loguercio, C.; Dallio, M.; Tolone, S.; Docimo, L.; Morelli, L. Postoperative changes in fecal bacterial communities and fermentation products in obese patients undergoing bilio-intestinal bypass. Front. Microbiol. 2016, 7, 1–13. [Google Scholar] [CrossRef] [PubMed] [Green Version]
  97. Zeng, Q.; Li, D.; He, Y.; Li, Y.; Yang, Z.; Zhao, X.; Liu, Y.; Wang, Y.; Sun, J.; Feng, X.; et al. Discrepant gut microbiota markers for the classification of obesity-related metabolic abnormalities. Sci. Rep. 2019, 9, 1–10. [Google Scholar] [CrossRef] [PubMed] [Green Version]
  98. Guerra, A.; Etienne-Mesmin, L.; Livrelli, V.; Denis, S.; Blanquet-Diot, S.; Alric, M. Relevance and challenges in modeling human gastric and small intestinal digestion. Trends Biotechnol. 2012, 30, 591–600. [Google Scholar] [CrossRef] [PubMed]
  99. Schmidt, T.S.B.; Raes, J.; Bork, P. The human gut microbiome: From association to modulation. Cell 2018, 172, 1198–1215. [Google Scholar] [CrossRef] [PubMed]
  100. Edwards, C.A.; Havlik, J.; Cong, W.; Mullen, W.; Preston, T.; Morrison, D.J.; Combet, E. Polyphenols and health: Interactions between fibre, plant polyphenols and the gut microbiota. Nutr. Bull. 2017, 42, 356–360. [Google Scholar] [CrossRef]
  101. Duncan, S.H.; Flint, H.J. Probiotics and prebiotics and health in ageing populations. Maturitas 2013, 75, 44–50. [Google Scholar] [CrossRef]
  102. Cani, P.D. Human gut microbiome: Hopes, threats and promises. Gut 2018, 67, 1716–1725. [Google Scholar] [CrossRef]
  103. Cirstea, M.; Radisavljevic, N.; Finlay, B.B. Good bug, bad bug: Breaking through microbial stereotypes. Cell Host Microbe 2018, 23, 10–13. [Google Scholar] [CrossRef] [PubMed] [Green Version]
  104. De Filippis, F.; Pellegrini, N.; Laghi, L.; Gobbetti, M.; Ercolini, D. Unusual sub-genus associations of faecal Prevotella and Bacteroides with specific dietary patterns. Microbiome 2016, 4, 1–6. [Google Scholar] [CrossRef] [PubMed] [Green Version]
  105. Anhê, F.F.; Choi, B.S.Y.; Dyck, J.R.B.; Schertzer, J.D.; Marette, A. Host–microbe interplay in the cardiometabolic benefits of dietary polyphenols. Trends Endocrinol. Metab. 2019, 30, 384–395. [Google Scholar] [CrossRef] [PubMed]
Figure 1. Differential fecal microbiota structure patterns due to the blueberry (BB) polyphenol-rich fraction supplementation in the in vitro colon model. (a). Boxplots showing the Shannon α diversity index in different supplementation regimes at 16 h and 24 h. (b). Principal Components Analysis (PCoA) based on the weighted Unifrac distances of the fecal microbiota for 16 h and 24 h in vitro fermentations. PERMANOVA p values for each time point are indicated. (c). Boxplots showing the microbiota variation within in each group “Within G1” and “Within G2” (16 h and 24 h microbiotas combined) and “Across G1 to G2”. Horizontal bar plots highlight the significant differences across the supplementation regimes: * padj < 0.05; ** padj < 0.01. Marginal differences are also noted: # padj < 0.10. ANTH/FLAV: anthocyanin/flavonols glycoside supplementation; MIX: prebiotic fibers mix supplementation; PACs: proanthocyanidins supplementation; S/A: sugar/acid fraction supplementation; TPP: total BB polyphenols.
Nutrients 12 02800 g001
Figure 2. Differentially abundant taxa (genus level) in the fecal microbiota after in vitro supplementation with blueberry (BB) polyphenol-rich fractions. The results of relative abundance (>1%) from 16 h and 24 h fermentations are shown in pink and green color, respectively. Significant differences for comparisons combining the 16 h and 24 h data (post-hoc Dunn’s test with Benjamini-Hochberg (BH) padj) between the corresponding pairs per supplementation across supplementations are indicated in horizontal bas plots: * padj < 0.05. Marginal differences are also indicated: # padj < 0.10. ANTH/FLAV: anthocyanin/flavonol glycoside supplementation; MIX: prebiotic fibers mix supplementation; PACs: proanthocyanidin supplementation; S/A: sugar/acid fraction supplementation; TPP: total BB polyphenols.
Nutrients 12 02800 g002
Figure 3. Associations of blueberry (BB) consumption with the enrichment of specific co-abundance taxonomic groups (CAGs). (a). Heatmap showing the Kendall tau between the different operational taxonomic units (OTUs) (that is, the OTU to OTU correlations) obtained based on their mean abundances across the different time points. Based on their association patterns, the OTUs were categorized into 6 co-abundance groups or CAGs. The 6 CAGs (C1 to C6) are indicated in colors on the left and top panels. (b). Boxplots showing the variation in the OTUs’ cumulated relative abundances (y axis) belonging to the 6 CAGs across the four time points (x axis). padj values showing the significant differences in the CAG abundances (Dunn’s post-hoc test) across time points are indicated: *: padj < 0.05; **: padj < 0.01. Marginal differences are also noted: #: padj < 0.1. (c). Principal Coordinates Analysis (PCoA) showing gut microbiota grouping based on the abundances of the 6 different CAGs. The PCoA plots are shown for all the microbiotas aggregated and separated for the old and young sub-groups. The PERMANOVA R2 and p values are indicated in each plot. (d). Word clouds showing the species’ enrichment in the CAGs C1, C3, and C6 dominant at either W4 or W6 or both. The species name is proportional to the frequency of that species.
Nutrients 12 02800 g003
Figure 4. Fecal microbiota components were associated with increased ferric-reducing antioxidant power (FRAP) measures and with the co-abundance groups (CAGs) enriched upon blueberry (BB) consumption. (a). Scatter plot showing the correlation between the actual and the Random Forest-predicted FRAP values. (b). Violin plot showing the association of the top 30 operational taxonomic unit (OTU) markers with the FRAP assay measures. X axis: Spearman Rho between the OTU abundances and the FRAP assay measures. Y axis: log of the Benjamini-Hochberg (BH) false discovery rate (FDR) with base 10. OTUs on the left: negatively associated; OTUs on the right: positively associated. Green color: the top 30 OTU markers showing significant association with FRAP measures (with FDR < 0.2) (positively associated); red color: negatively associated markers. (c). Bean plots showing the Spearman Rho measures distribution obtained for the predicted and the actual FRAP across the 100 iterations of the two variants of Random Forest models. (d). Stacked bar plots showing the relative representation of the different CAGs in the FRAP positive OTUs and the other non-marker OTUs. Seventeen out of the 25 FRAP-positive OTUs belonged to either CAG C1 (8) or C6 (9). Fishers’ exact test showed a significant association between C6 and the FRAP-positive OTUs (indicated in the Figure). (e). Scatter plots showing the correlation between the FRAP-positive and FRAP-negative OTUs’ mean abundances change across time points with the corresponding changes in FRAP measures.
Nutrients 12 02800 g004
Table 1. Human study participant demographics.
Young (n = 10 a)Old (n = 6)
Age (yrs)28 ± 269 ± 2
Weight (kg)64.31 ± 2.3362.44 ± 3.84
Height (cm)166.3 ± 1.5161.3 ± 2.9
BMI (kg/m2)23.3 ± 0.924.2 ± 2.0
Glucose (mg/dL, Range: 74–106)89.5 ± 2.4498.0 ± 1.7
CRP (mg/L, Range: <1.1)1.21 ± 0.330.76 ± 0.28
All values are presented as means ± standard error. BMI: body mass index; CRP: C-reactive protein. a One outlier value excluded.
Table 2. Gut microbiota composition was significantly associated with ferric-reducing antioxidant power (FRAP). R2 and p values of the PERMANOVA analysis associating the clinical parameters with the gut microbiota at the operational taxonomic unit (OTU) and co-abundance group (CAG) level are shown in the table.
Clinical IndicatorOTU-Level MicrobiotaCAG-Level Microbiota
R2p ValueR2p Value
CRP0.030.950.020.81
Glucose0.030.540.020.79
FRAP0.040.010.060.05

