Effects of Omega-3 Polyunsaturated Fatty Acid Supplementation on Non-Alcoholic Fatty Liver: A Systematic Review and Meta-Analysis


Abstract
1. Introduction
2. Materials and Methods
2.1. Data Sources and Literature Search Strategy
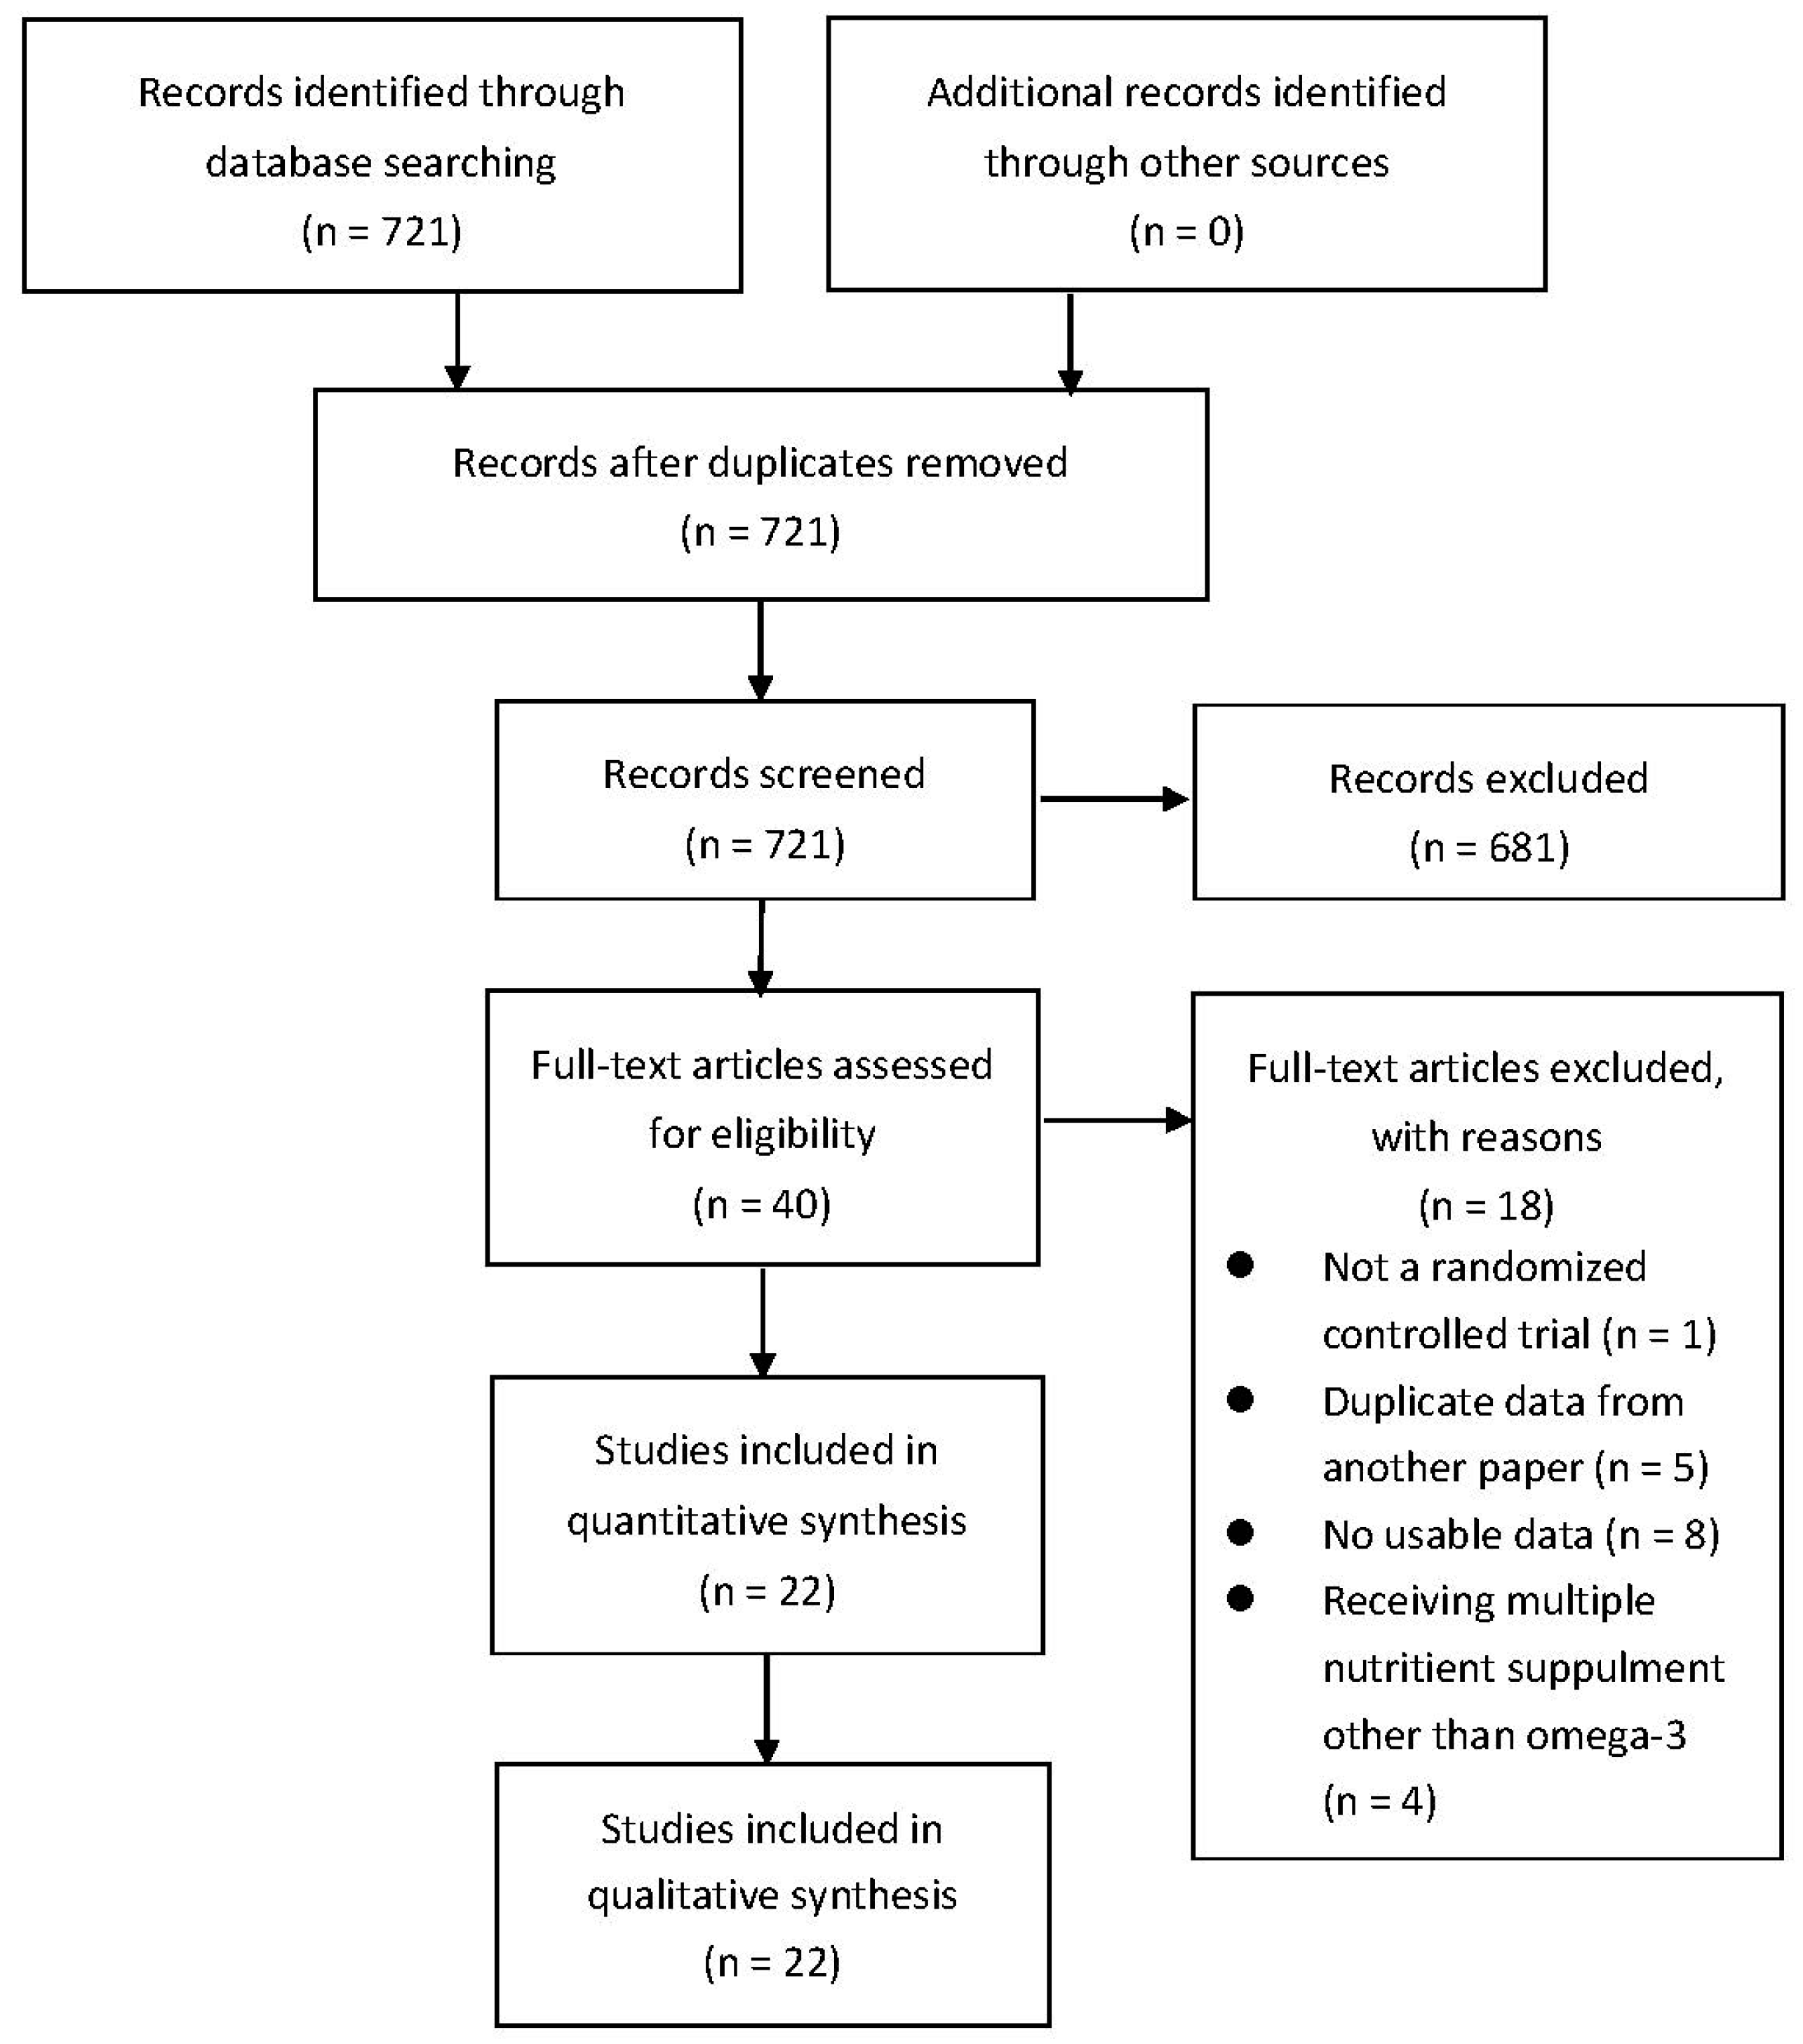
2.2. Study Selection
2.3. Data Extraction
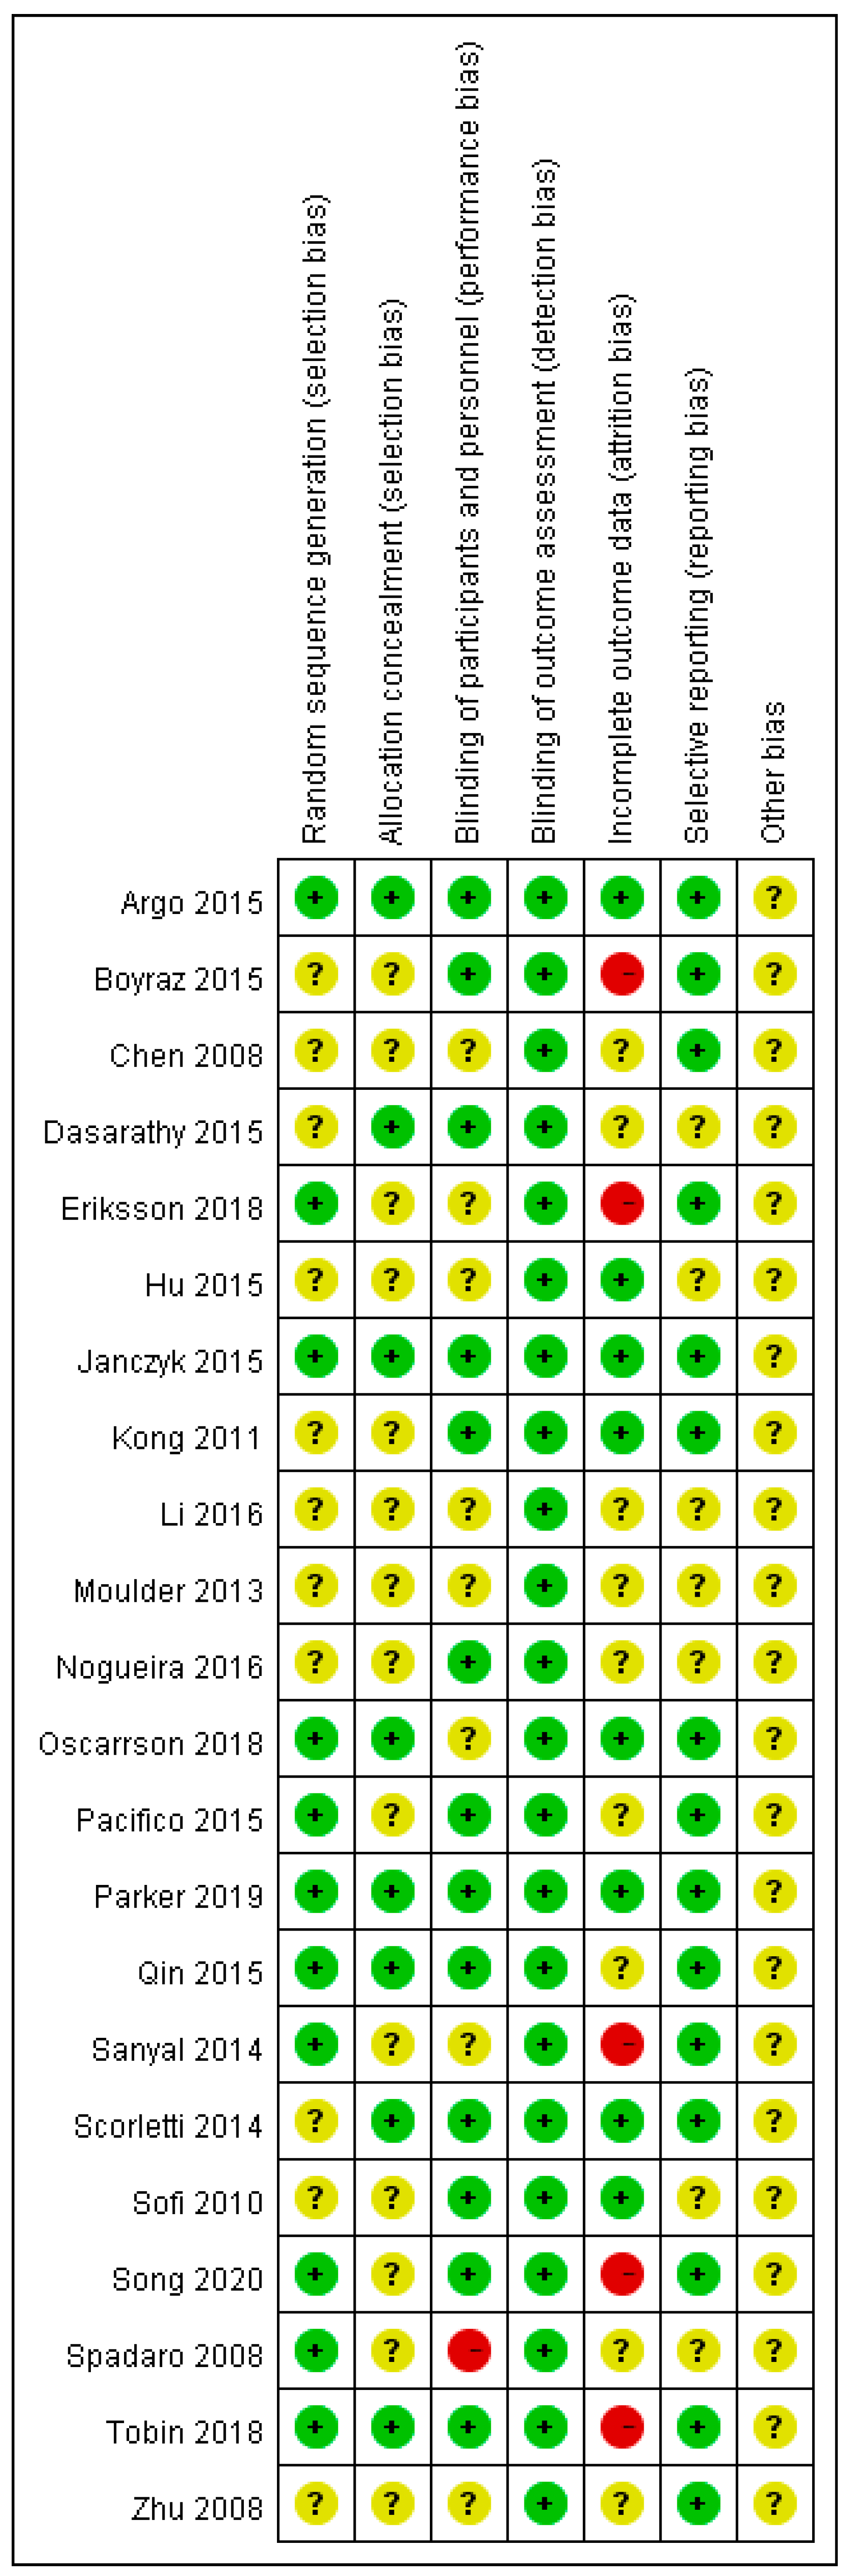
2.4. Risk of Bias Assessment
2.5. Statistical Analysis
3. Results
3.1. Characteristics of Included Studies
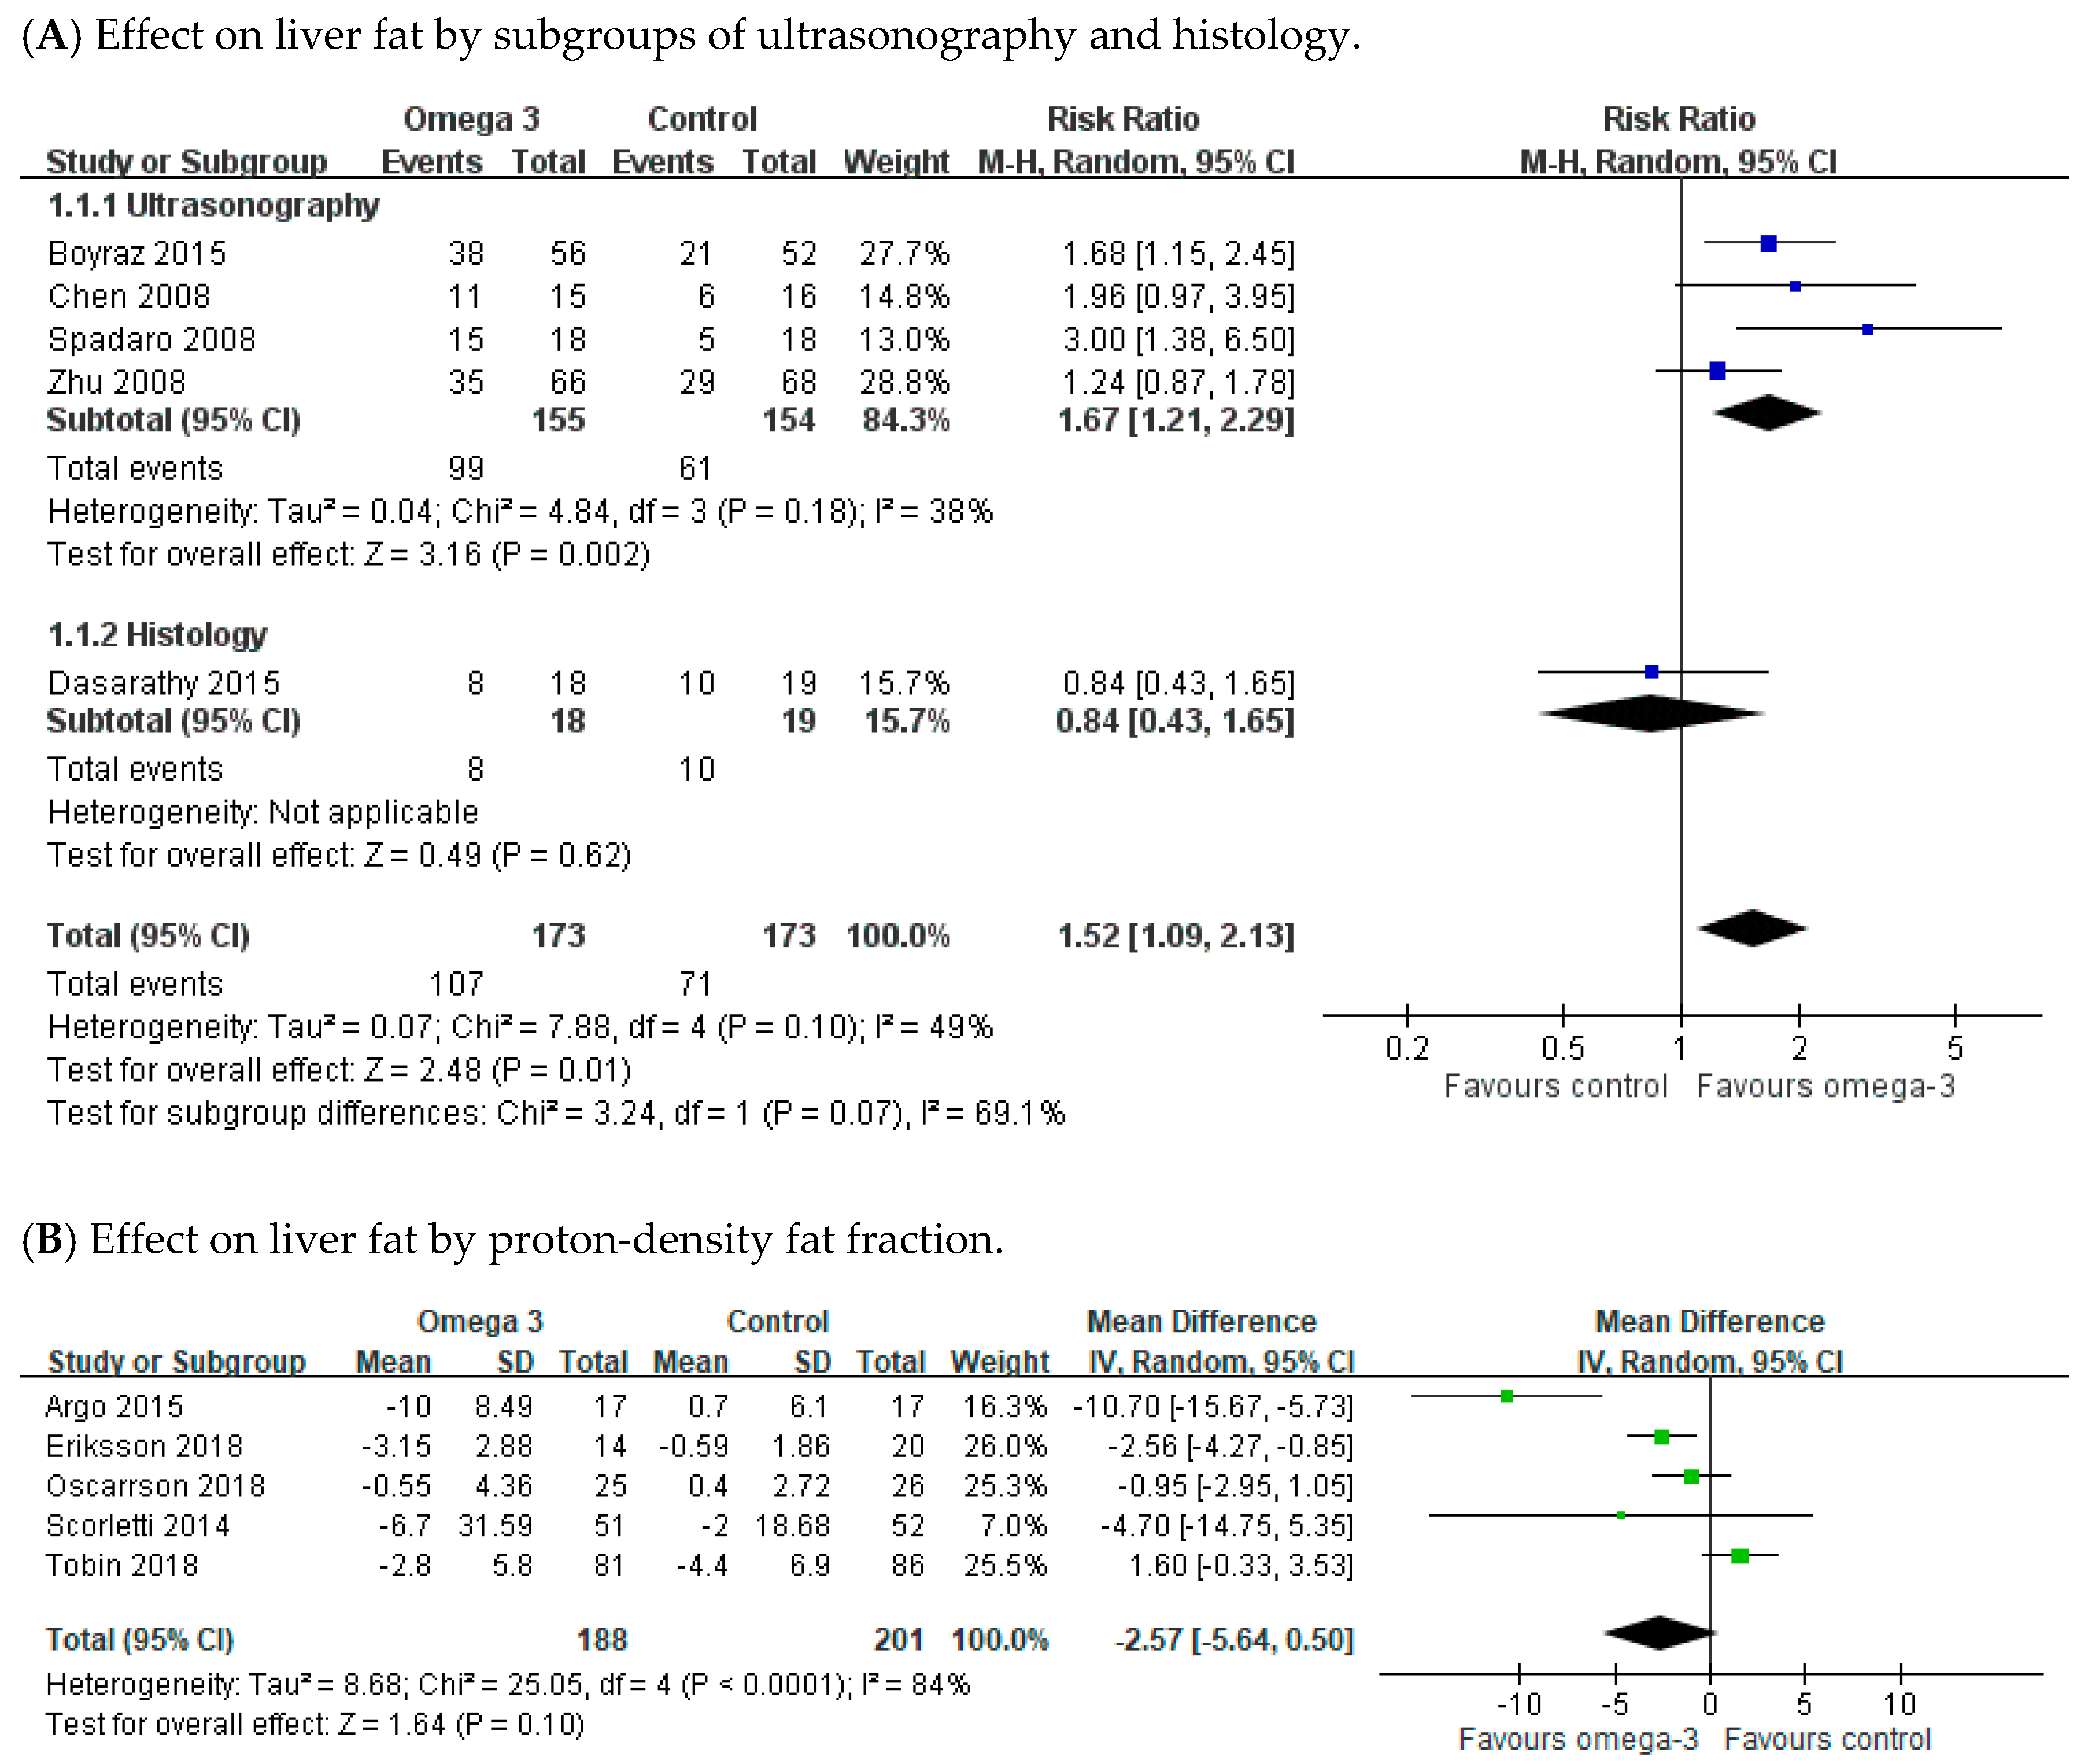
3.2. Effect of Omega-3 Polyunsaturated Fatty Acids (n-3 PUFAs) on Liver Fat and Histology
3.3. Effect of n-3 PUFAs on Hepatic Enzyme Parameters
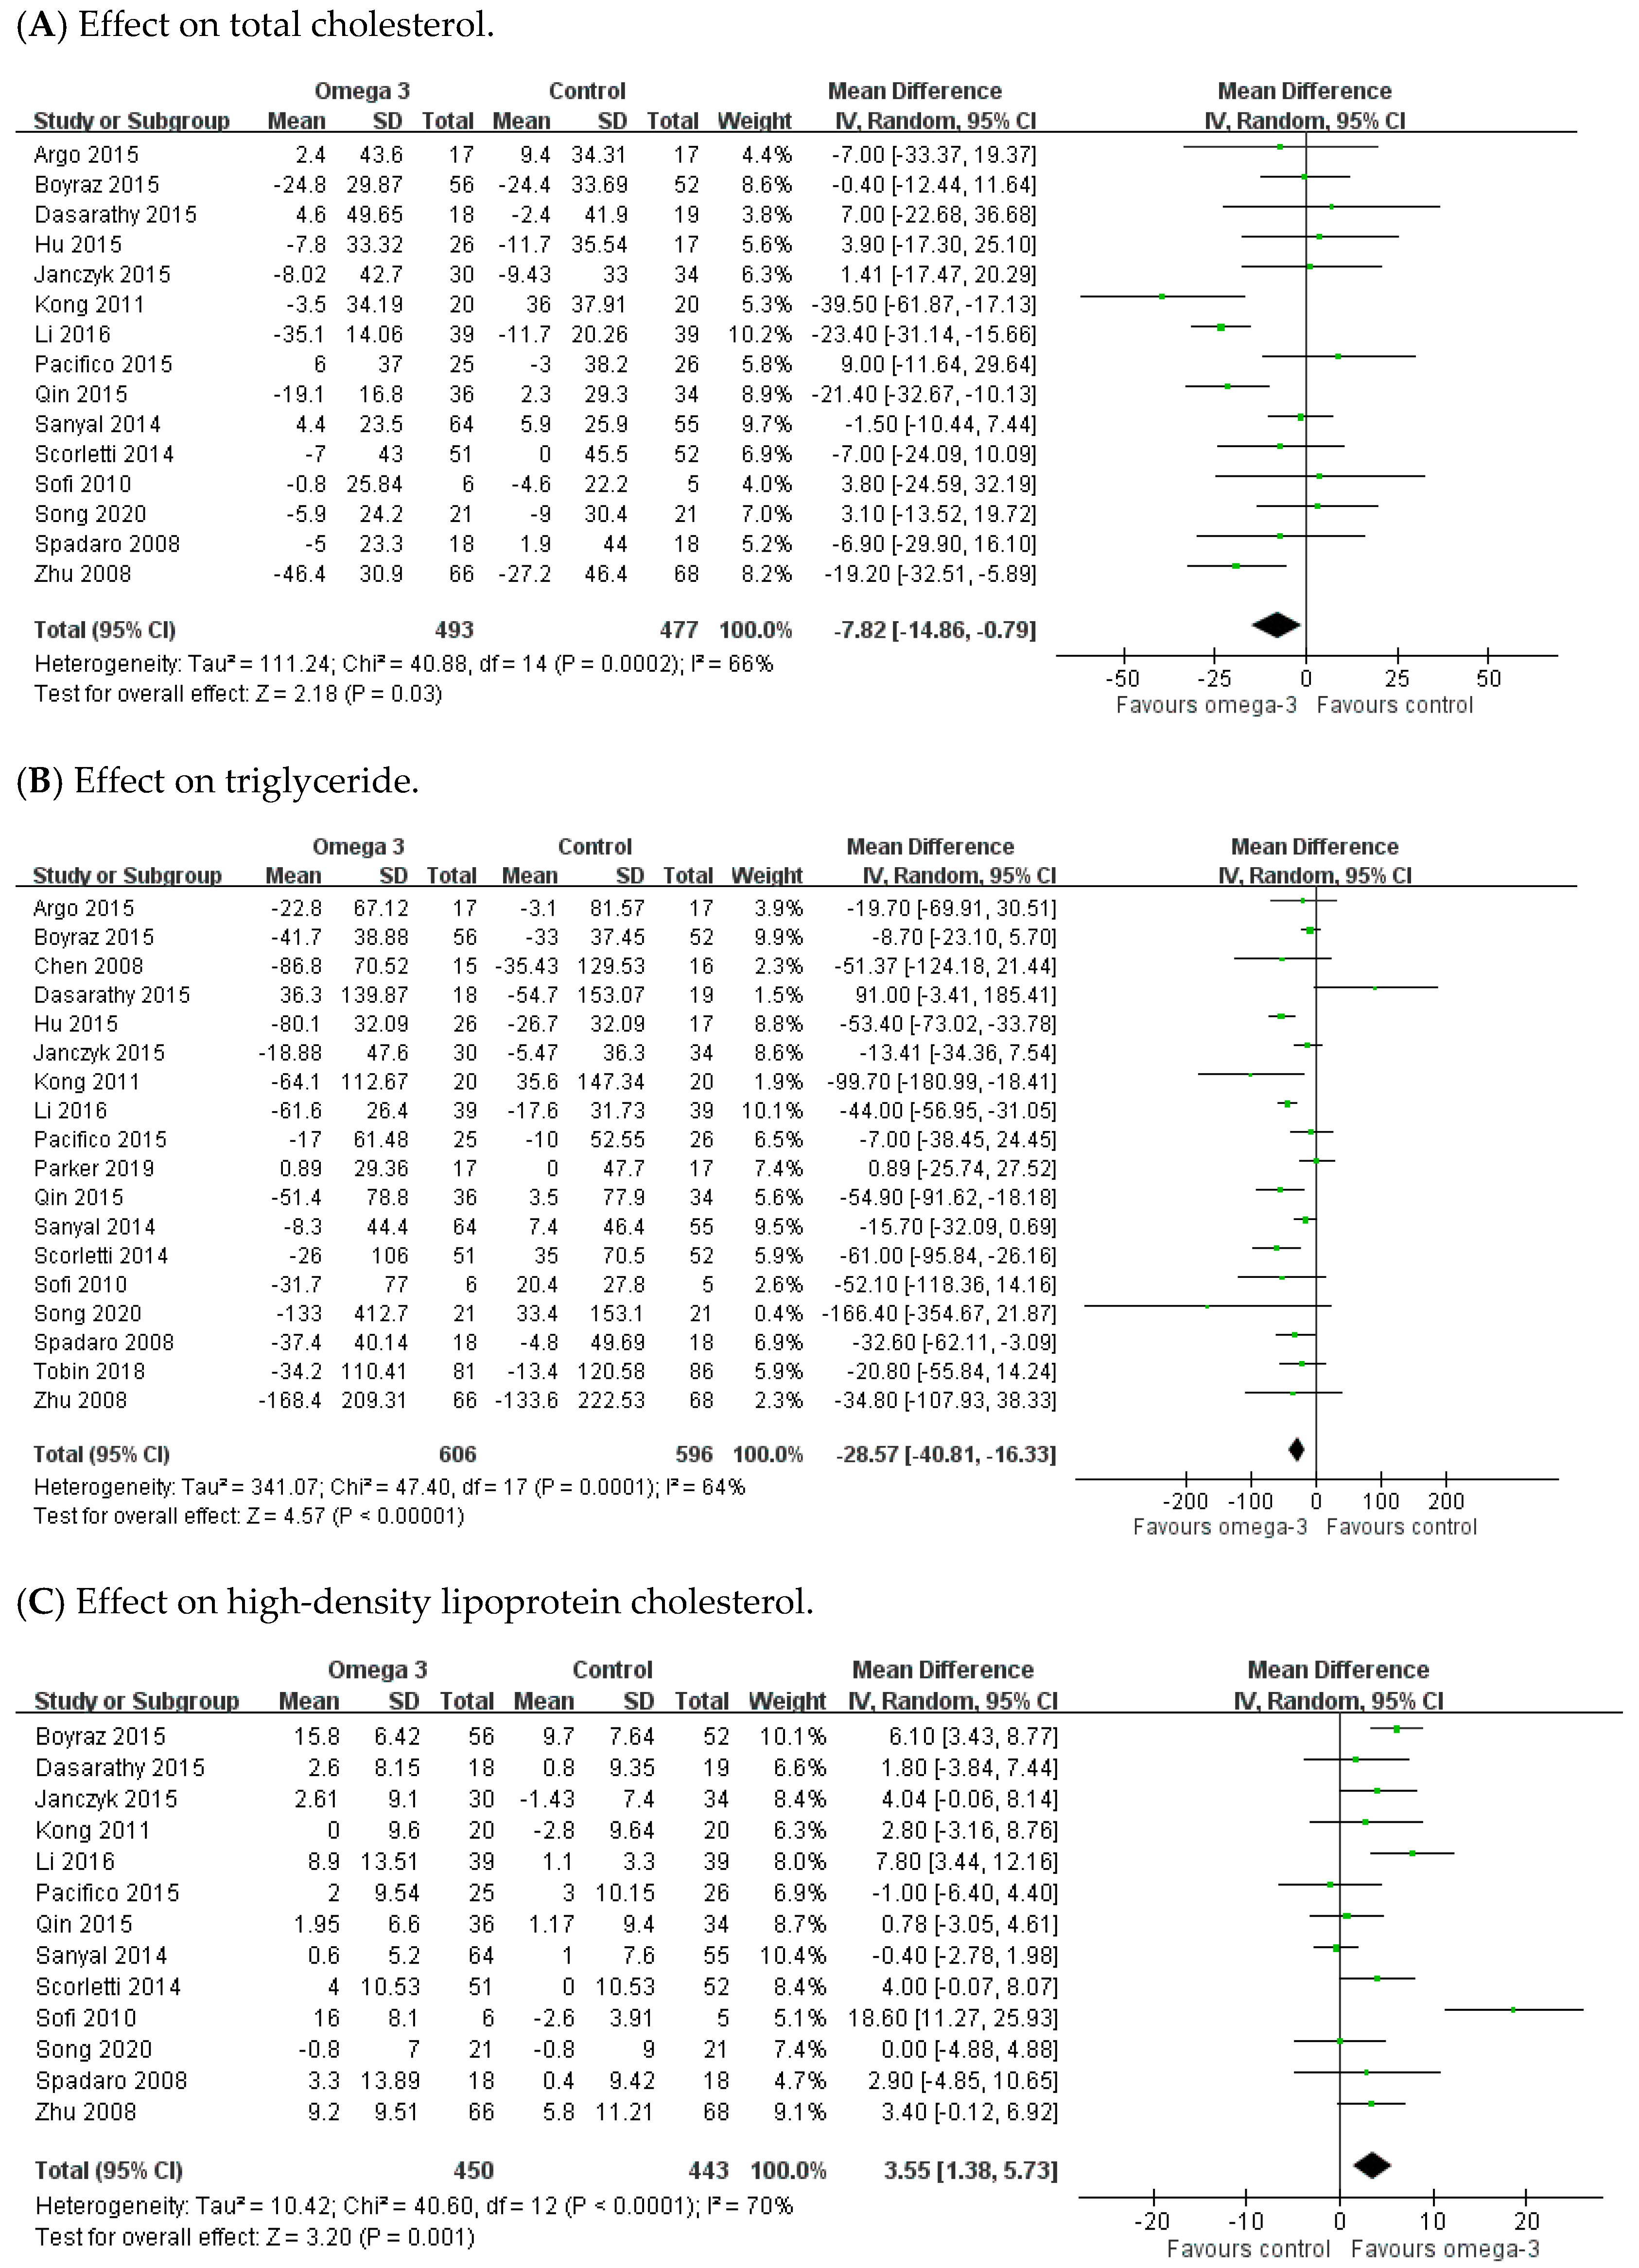
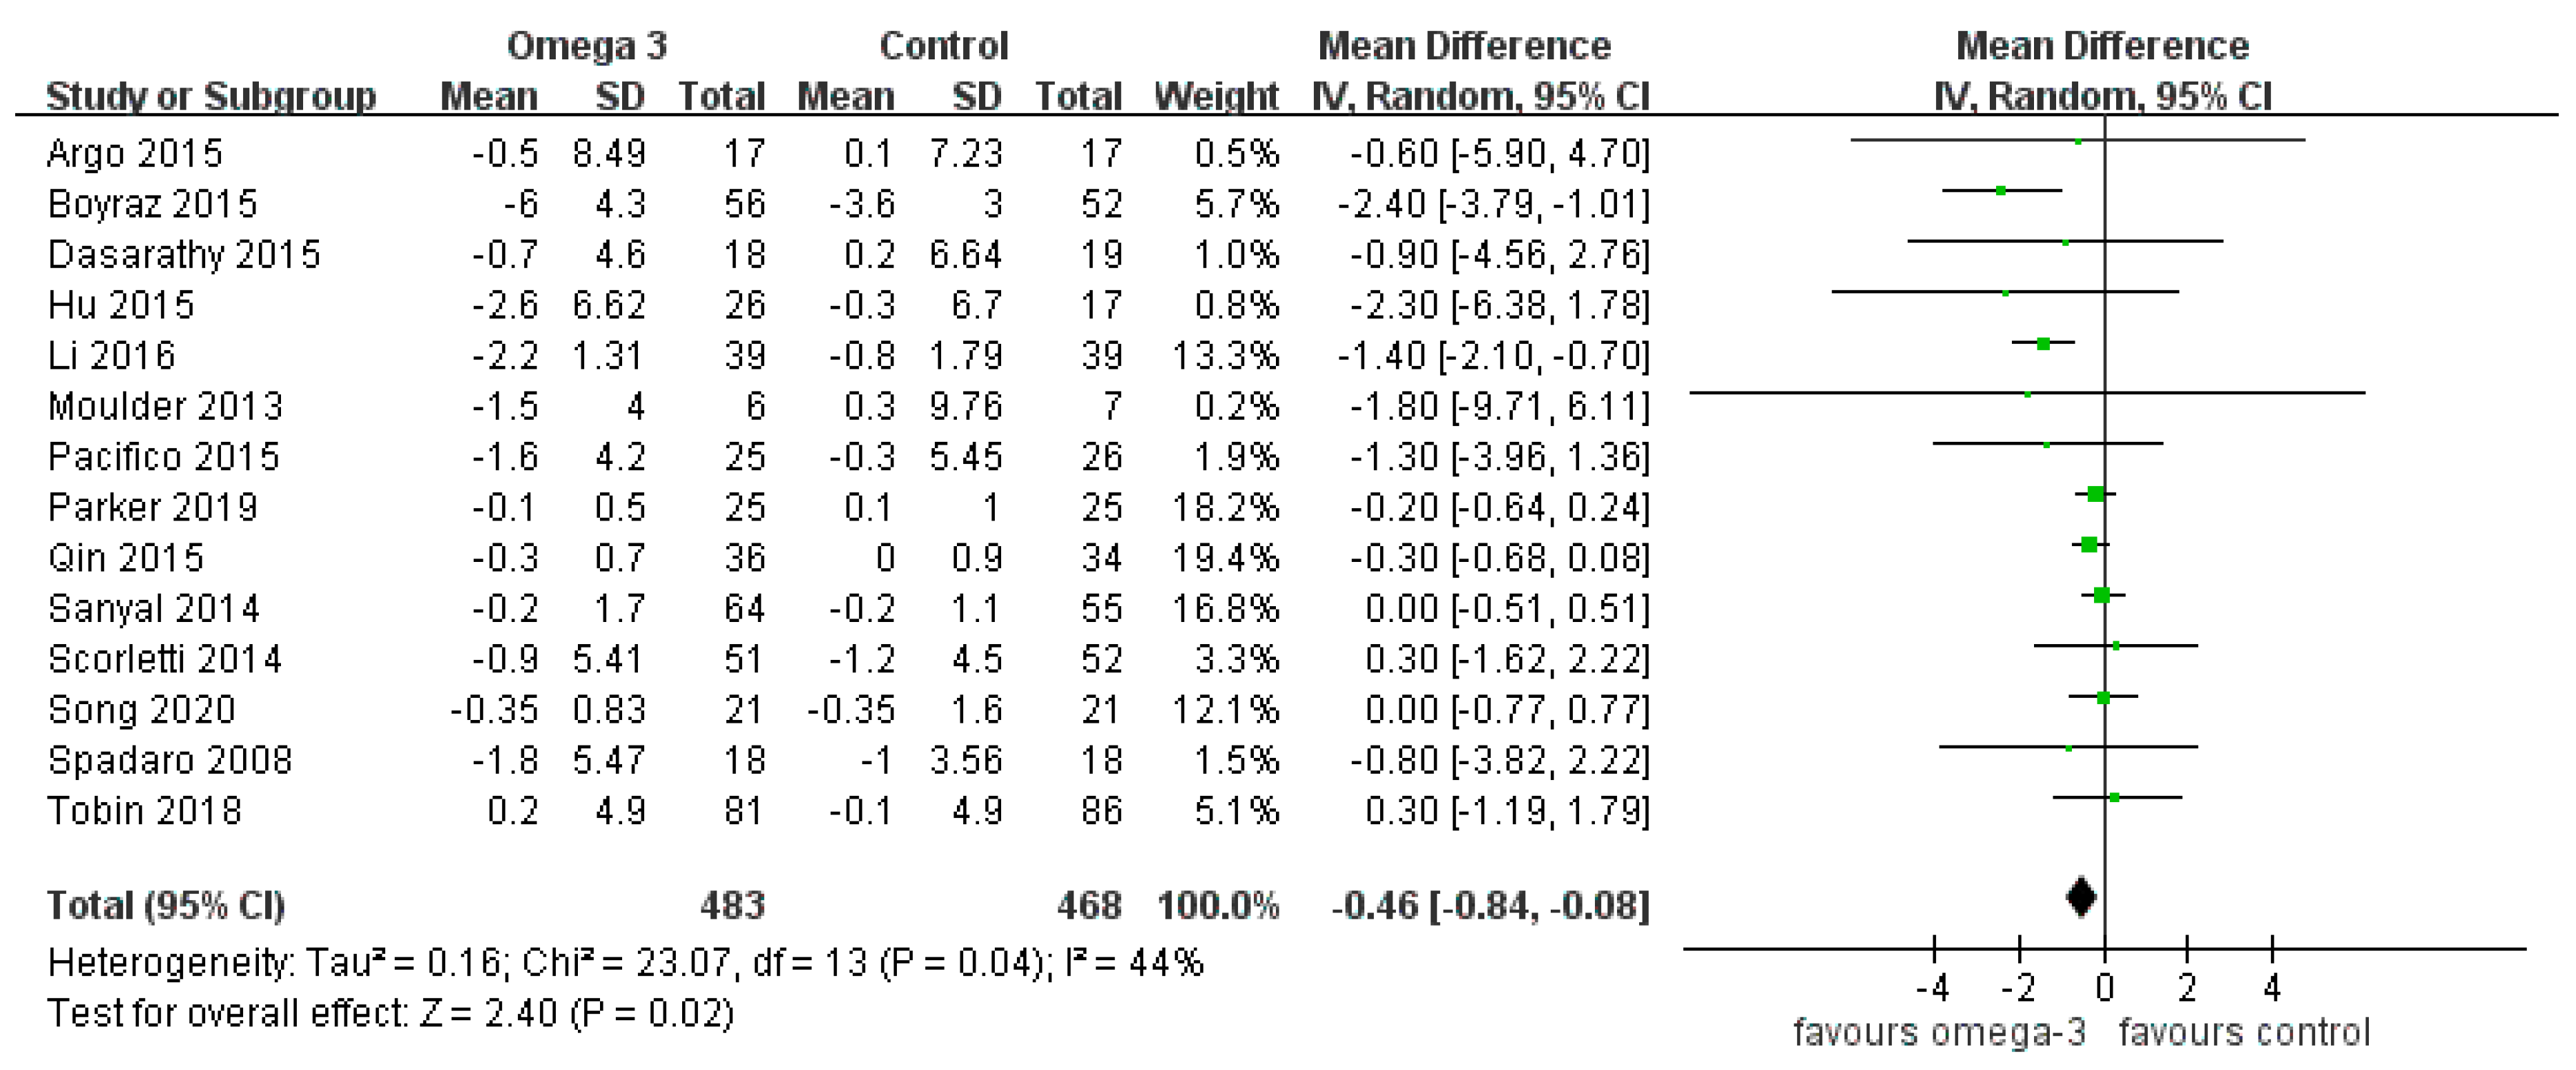
3.4. Effect of n-3 PUFAs on Serum Lipid Profiles
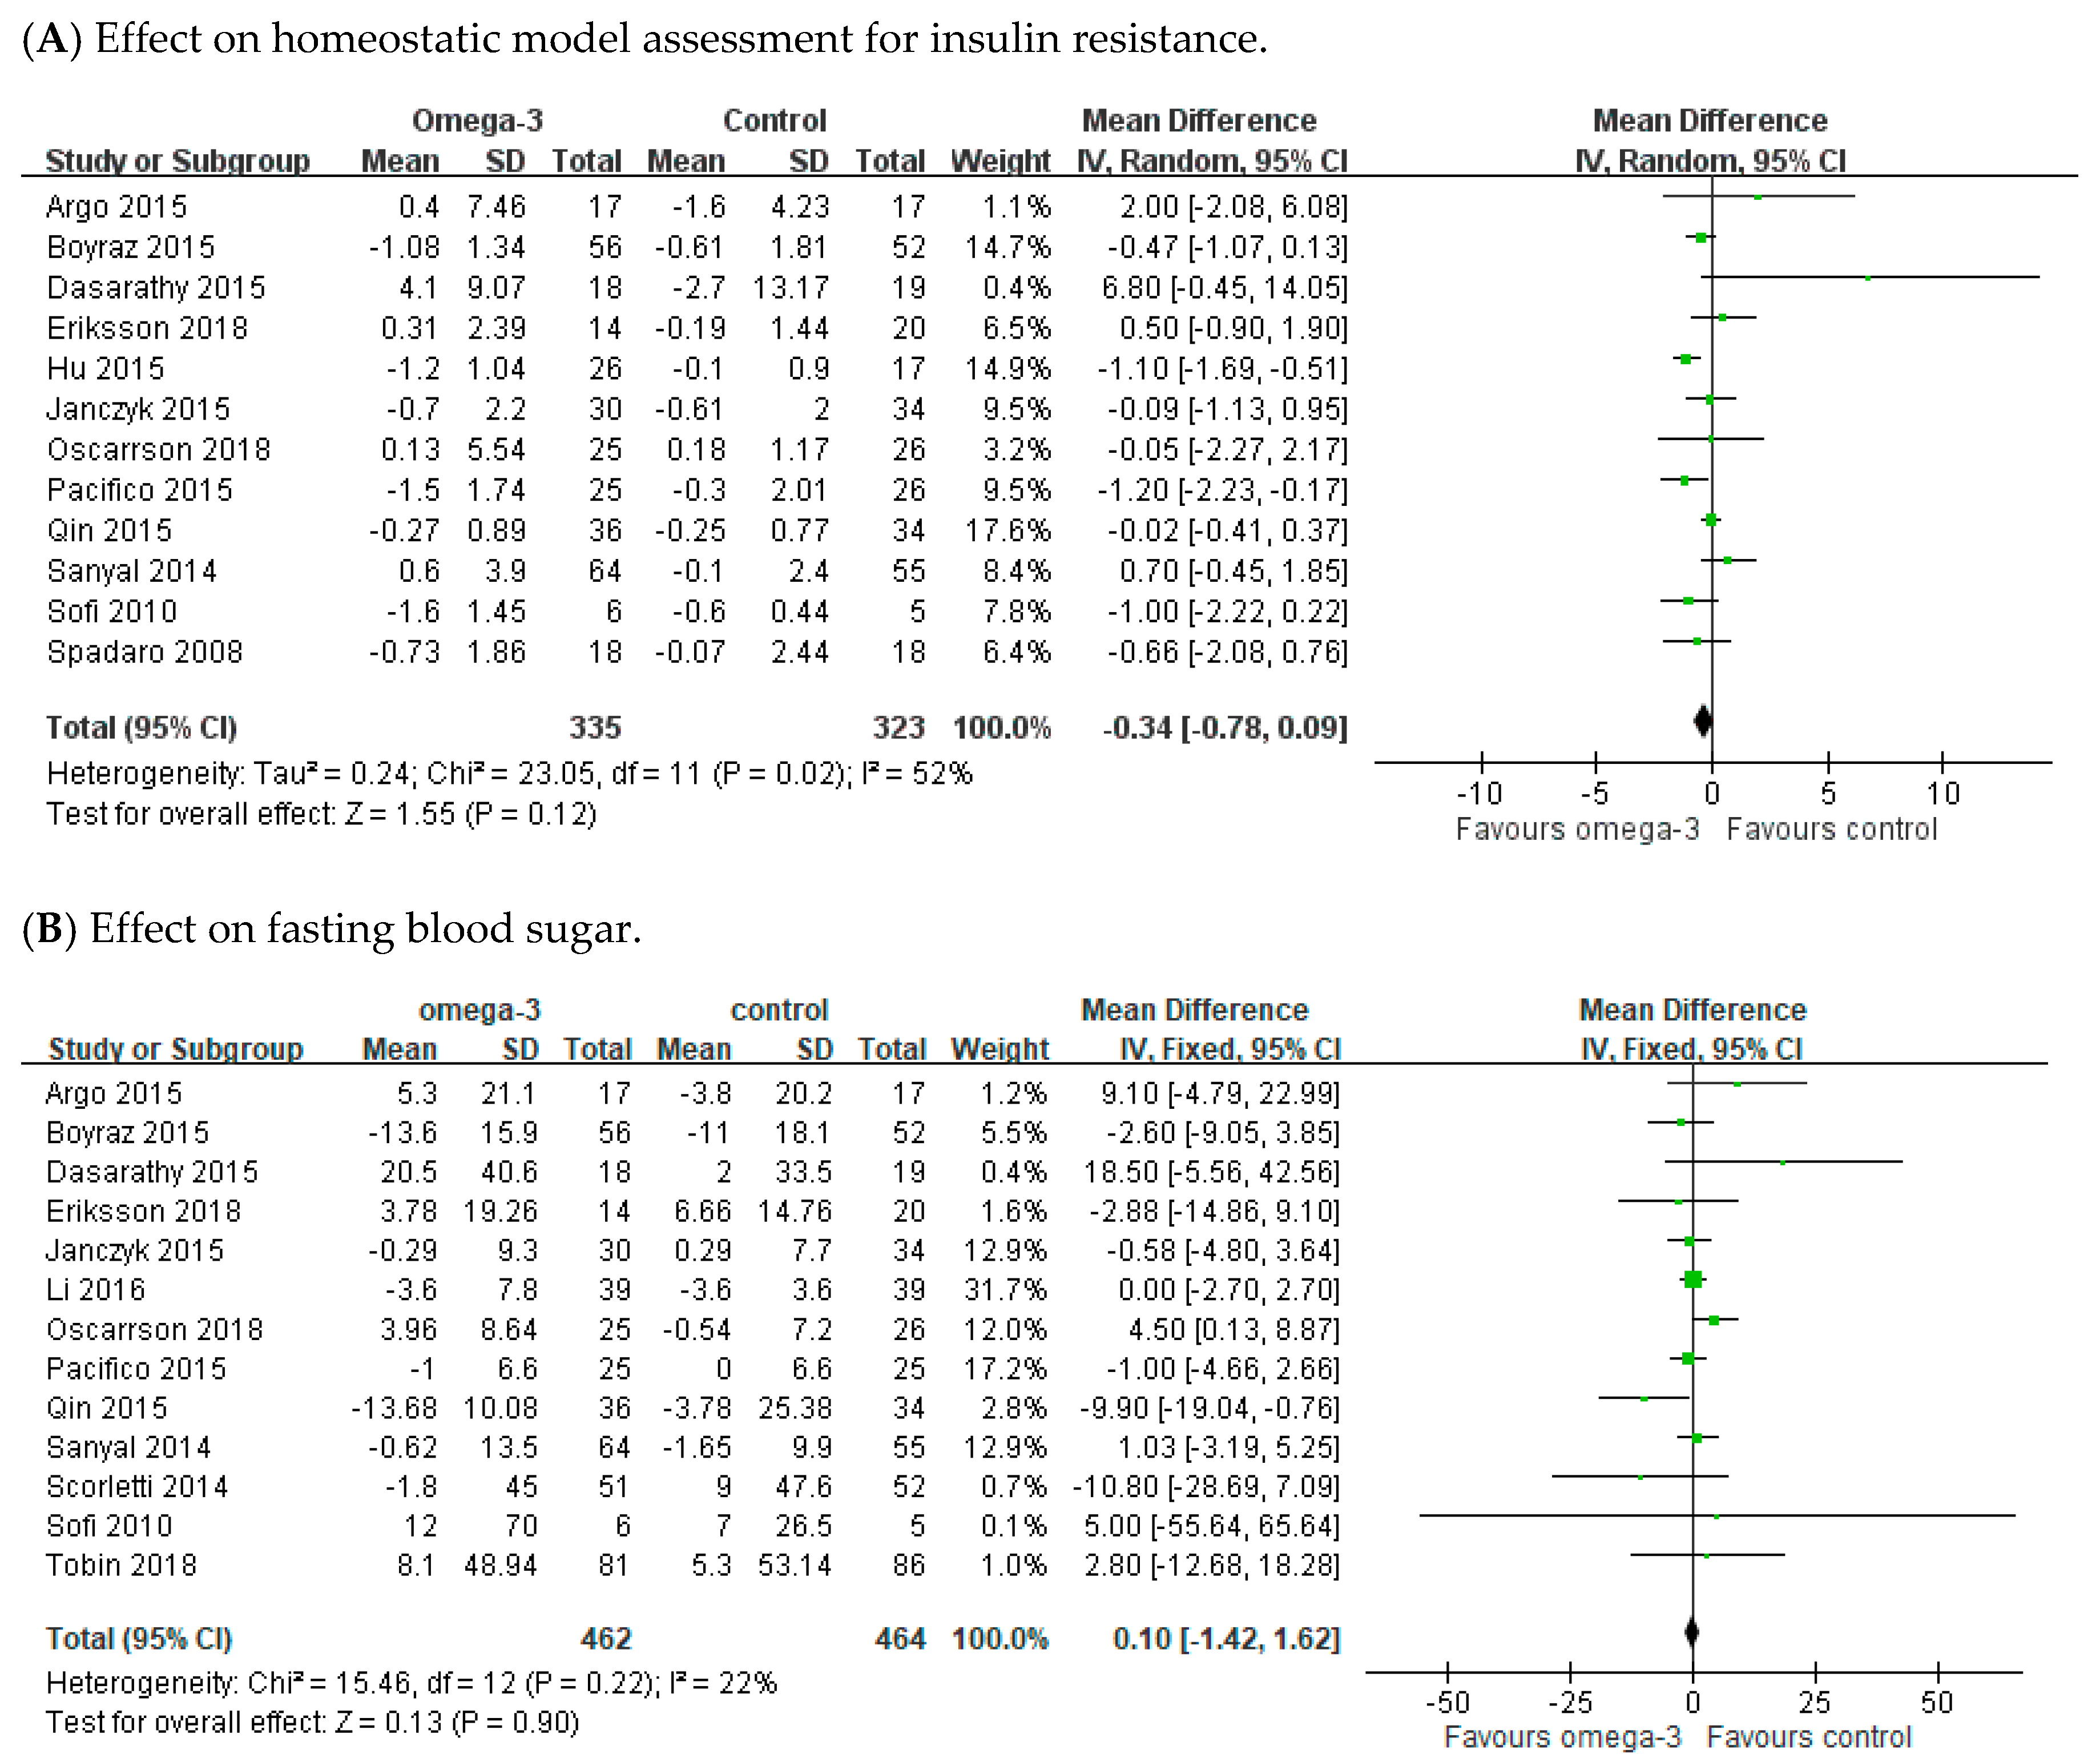
3.5. Effect of n-3 PUFAs on Fasting Blood Sugar and Homeostatic Model Assessment for Insulin Resistance
3.6. Effect of n-3 PUFAs on Body Mass Index
3.7. Adverse Events
4. Discussion
5. Conclusions
Author Contributions
Funding
Conflicts of Interest
References
- Younossi, Z.M.; Koenig, A.B.; Abdelatif, D.; Fazel, Y.; Henry, L.; Wymer, M. Global epidemiology of nonalcoholic fatty liver disease-Meta-analytic assessment of prevalence, incidence, and outcomes. Hepatology 2016, 64, 73–84. [Google Scholar] [CrossRef] [PubMed]
- Disease, G.B.D.; Injury, I.; Prevalence, C. Global, regional, and national incidence, prevalence, and years lived with disability for 354 diseases and injuries for 195 countries and territories, 1990–2017: A systematic analysis for the global burden of disease study 2017. Lancet 2018, 392, 1789–1858. [Google Scholar] [CrossRef]
- Scorletti, E.; Bhatia, L.; McCormick, K.G.; Clough, G.F.; Nash, K.; Hodson, L.; Moyses, H.E.; Calder, P.C.; Byrne, C.D. Effects of purified eicosapentaenoic and docosahexaenoic acids in nonalcoholic fatty liver disease: Results from the Welcome* study. Hepatology 2014, 60, 1211–1221. [Google Scholar] [CrossRef] [PubMed]
- Alkhouri, N.; McCullough, A.J. Noninvasive diagnosis of NASH and liver fibrosis within the spectrum of NAFLD. Gastroenterol. Hepatol. 2012, 8, 661–668. [Google Scholar]
- McCullough, A.J. The clinical features, diagnosis and natural history of nonalcoholic fatty liver disease. Clin. Liver Dis. 2004, 8, 521–533, viii. [Google Scholar] [CrossRef]
- Dulai, P.S.; Singh, S.; Patel, J.; Soni, M.; Prokop, L.J.; Younossi, Z.; Sebastiani, G.; Ekstedt, M.; Hagstrom, H.; Nasr, P.; et al. Increased risk of mortality by fibrosis stage in nonalcoholic fatty liver disease: Systematic review and meta-analysis. Hepatology 2017, 65, 1557–1565. [Google Scholar] [CrossRef]
- Adams, L.A.; Sanderson, S.; Lindor, K.D.; Angulo, P. The histological course of nonalcoholic fatty liver disease: A longitudinal study of 103 patients with sequential liver biopsies. J. Hepatol. 2005, 42, 132–138. [Google Scholar] [CrossRef]
- Ekstedt, M.; Franzen, L.E.; Mathiesen, U.L.; Thorelius, L.; Holmqvist, M.; Bodemar, G.; Kechagias, S. Long-term follow-up of patients with NAFLD and elevated liver enzymes. Hepatology 2006, 44, 865–873. [Google Scholar] [CrossRef]
- Pagadala, M.R.; McCullough, A.J. The relevance of liver histology to predicting clinically meaningful outcomes in nonalcoholic steatohepatitis. Clin. Liver Dis. 2012, 16, 487–504. [Google Scholar] [CrossRef]
- Wong, V.W.; Wong, G.L.; Choi, P.C.; Chan, A.W.; Li, M.K.; Chan, H.Y.; Chim, A.M.; Yu, J.; Sung, J.J.; Chan, H.L. Disease progression of non-alcoholic fatty liver disease: A prospective study with paired liver biopsies at 3 years. Gut 2010, 59, 969–974. [Google Scholar] [CrossRef]
- Marchesini, G.; Brizi, M.; Bianchi, G.; Tomassetti, S.; Bugianesi, E.; Lenzi, M.; McCullough, A.J.; Natale, S.; Forlani, G.; Melchionda, N. Nonalcoholic fatty liver disease: A feature of the metabolic syndrome. Diabetes 2001, 50, 1844–1850. [Google Scholar] [CrossRef]
- Speliotes, E.K.; Massaro, J.M.; Hoffmann, U.; Vasan, R.S.; Meigs, J.B.; Sahani, D.V.; Hirschhorn, J.N.; O’Donnell, C.J.; Fox, C.S. Fatty liver is associated with dyslipidemia and dysglycemia independent of visceral fat: The framingham heart study. Hepatology 2010, 51, 1979–1987. [Google Scholar] [CrossRef] [PubMed]
- Younossi, Z.M.; Golabi, P.; de Avila, L.; Paik, J.M.; Srishord, M.; Fukui, N.; Qiu, Y.; Burns, L.; Afendy, A.; Nader, F. The global epidemiology of NAFLD and NASH in patients with type 2 diabetes: A systematic review and meta-analysis. J. Hepatol. 2019, 71, 793–801. [Google Scholar] [CrossRef]
- Mantovani, A.; Scorletti, E.; Mosca, A.; Alisi, A.; Byrne, C.D.; Targher, G. Complications, morbidity and mortality of nonalcoholic fatty liver disease. Metabolism 2020, 154170. [Google Scholar] [CrossRef]
- Rinella, M.E. Nonalcoholic fatty liver disease: A systematic review. JAMA 2015, 313, 2263–2273. [Google Scholar] [CrossRef]
- Petta, S.; Gastaldelli, A.; Rebelos, E.; Bugianesi, E.; Messa, P.; Miele, L.; Svegliati-Baroni, G.; Valenti, L.; Bonino, F. Pathophysiology of non alcoholic fatty liver disease. Int. J. Mol. Sci. 2016, 17, 2082. [Google Scholar] [CrossRef]
- Haas, J.T.; Francque, S.; Staels, B. Pathophysiology and mechanisms of nonalcoholic fatty liver disease. Annu. Rev. Physiol. 2016, 78, 181–205. [Google Scholar] [CrossRef]
- Imamura, F.; Micha, R.; Wu, J.H.; de Oliveira Otto, M.C.; Otite, F.O.; Abioye, A.I.; Mozaffarian, D. Effects of saturated fat, polyunsaturated fat, monounsaturated fat, and carbohydrate on glucose-insulin homeostasis: A systematic review and meta-analysis of randomised controlled feeding trials. PLoS Med. 2016, 13, e1002087. [Google Scholar] [CrossRef]
- Maximos, M.; Bril, F.; Portillo Sanchez, P.; Lomonaco, R.; Orsak, B.; Biernacki, D.; Suman, A.; Weber, M.; Cusi, K. The role of liver fat and insulin resistance as determinants of plasma aminotransferase elevation in nonalcoholic fatty liver disease. Hepatology 2015, 61, 153–160. [Google Scholar] [CrossRef]
- Angulo, P. Nonalcoholic fatty liver disease. N. Engl. J. Med. 2002, 346, 1221–1231. [Google Scholar] [CrossRef]
- Ganz, M.; Szabo, G. Immune and inflammatory pathways in NASH. Hepatol. Int. 2013, 7 (Suppl. 2), 771–781. [Google Scholar] [CrossRef] [PubMed]
- Seki, E.; Schwabe, R.F. Hepatic inflammation and fibrosis: Functional links and key pathways. Hepatology 2015, 61, 1066–1079. [Google Scholar] [CrossRef] [PubMed]
- Vonghia, L.; Michielsen, P.; Francque, S. Immunological mechanisms in the pathophysiology of non-alcoholic steatohepatitis. Int. J. Mol. Sci. 2013, 14, 19867–19890. [Google Scholar] [CrossRef] [PubMed]
- Siriwardhana, N.; Kalupahana, N.S.; Moustaid-Moussa, N. Health benefits of n-3 polyunsaturated fatty acids: Eicosapentaenoic acid and docosahexaenoic acid. Adv. Food Nutr. Res. 2012, 65, 211–222. [Google Scholar] [CrossRef]
- Dyall, S.C. Long-chain omega-3 fatty acids and the brain: A review of the independent and shared effects of EPA, DPA and DHA. Front. Aging Neurosci. 2015, 7, 52. [Google Scholar] [CrossRef]
- Shahidi, F.; Ambigaipalan, P. Omega-3 polyunsaturated fatty acids and their health benefits. Annu. Rev. Food Sci. Technol. 2018, 9, 345–381. [Google Scholar] [CrossRef]
- De Roos, B.; Mavrommatis, Y.; Brouwer, I.A. Long-chain n-3 polyunsaturated fatty acids: New insights into mechanisms relating to inflammation and coronary heart disease. Br. J. Pharmacol. 2009, 158, 413–428. [Google Scholar] [CrossRef]
- Leaf, A.; Weber, P.C. Cardiovascular effects of n-3 fatty acids. N. Engl. J. Med. 1988, 318, 549–557. [Google Scholar] [CrossRef]
- Phillipson, B.E.; Rothrock, D.W.; Connor, W.E.; Harris, W.S.; Illingworth, D.R. Reduction of plasma lipids, lipoproteins, and apoproteins by dietary fish oils in patients with hypertriglyceridemia. N. Engl. J. Med. 1985, 312, 1210–1216. [Google Scholar] [CrossRef]
- Yang, S.J.; Chi, C.C. Effects of fish oil supplement on psoriasis: A meta-analysis of randomized controlled trials. BMC Complement. Altern. Med. 2019, 19, 354. [Google Scholar] [CrossRef]
- Lepretti, M.; Martucciello, S.; Burgos Aceves, M.A.; Putti, R.; Lionetti, L. Omega-3 fatty acids and insulin resistance: Focus on the regulation of mitochondria and endoplasmic reticulum stress. Nutrients 2018, 10, 350. [Google Scholar] [CrossRef] [PubMed]
- Pahlavani, M.; Ramalho, T.; Koboziev, I.; LeMieux, M.J.; Jayarathne, S.; Ramalingam, L.; Filgueiras, L.R.; Moustaid-Moussa, N. Adipose tissue inflammation in insulin resistance: Review of mechanisms mediating anti-inflammatory effects of omega-3 polyunsaturated fatty acids. J. Investig. Med. 2017, 65, 1021–1027. [Google Scholar] [CrossRef] [PubMed]
- Chalasani, N.; Younossi, Z.; Lavine, J.E.; Diehl, A.M.; Brunt, E.M.; Cusi, K.; Charlton, M.; Sanyal, A.J. The diagnosis and management of non-alcoholic fatty liver disease: Practice Guideline by the American association for the study of liver diseases, American College of gastroenterology, and the American gastroenterological association. Hepatology 2012, 55, 2005–2023. [Google Scholar] [CrossRef]
- European Association for the Study of the Liver; European Association for the Study of Diabetes; European Association for the Study of Obesity. EASL-EASD-EASO Clinical Practice Guidelines for the management of non-alcoholic fatty liver disease. J. Hepatol. 2016, 64, 1388–1402. [Google Scholar] [CrossRef] [PubMed]
- Moher, D.; Liberati, A.; Tetzlaff, J.; Altman, D.G.; Group, P. Preferred reporting items for systematic reviews and meta-analyses: The PRISMA statement. Open Med. 2009, 3, e123–e130. [Google Scholar]
- Follmann, D.; Elliott, P.; Suh, I.; Cutler, J. Variance imputation for overviews of clinical trials with continuous response. J. Clin. Epidemiol. 1992, 45, 769–773. [Google Scholar] [CrossRef]
- Higgins, J.P.; Green, S. Cochrane Handbook for Systematic Reviews of Interventions; Chichester Wiley: Chichester, UK, 2011. [Google Scholar]
- Higgins, J.P.; Altman, D.G.; Gøtzsche, P.C.; Jüni, P.; Moher, D.; Oxman, A.D.; Savovic, J.; Schulz, K.F.; Cochrane Bias Methods Group; Cochrane Statistical Methods Group; et al. The Cochrane Collaboration’s tool for assessing risk of bias in randomised trials. BMJ 2011, 18, d5928. [Google Scholar] [CrossRef]
- AlGhamdi, K.; Khurrum, H. Methotrexate for the treatment of generalized vitiligo. Saudi. Pharm. J. 2013, 21, 423–424. [Google Scholar] [CrossRef]
- Argo, C.K.; Patrie, J.T.; Lackner, C.; Henry, T.D.; De Lange, E.E.; Weltman, A.L.; Shah, N.L.; Al-Osaimi, A.M.; Pramoonjago, P.; Jayakumar, S.; et al. Effects of n-3 fish oil on metabolic and histological parameters in NASH: A double-blind, randomized, placebo-controlled trial. J. Hepatol. 2015, 62, 190–197. [Google Scholar] [CrossRef]
- Boyraz, M.; Pirgon, Ö.; Dündar, B.; Çekmez, F.; Hatipoğlu, N. Long-term treatment with n-3 polyunsaturated fatty acids as a monotherapy in children with nonalcoholic fatty liver disease. J. Clin. Res. Pediatric Endocrinol. 2015, 7, 121–127. [Google Scholar] [CrossRef]
- Dasarathy, S.; Dasarathy, J.; Khiyami, A.; Yerian, L.; Hawkins, C.; Sargent, R.; McCullough, A.J. Double-blind randomized placebo-controlled clinical trial of omega 3 fatty acids for the treatment of diabetic patients with nonalcoholic steatohepatitis. J. Clin. Gastroenterol. 2015, 49, 137–144. [Google Scholar] [CrossRef]
- Eriksson, J.W.; Lundkvist, P.; Jansson, P.A.; Johansson, L.; Kvarnström, M.; Moris, L.; Miliotis, T.; Forsberg, G.B.; Risérus, U.; Lind, L.; et al. Effects of dapagliflozin and n-3 carboxylic acids on non-alcoholic fatty liver disease in people with type 2 diabetes: A double-blind randomised placebo-controlled study. Diabetologia 2018, 61, 1923–1934. [Google Scholar] [CrossRef]
- Janczyk, W.; Lebensztejn, D.; Wierzbicka-Rucinska, A.; Mazur, A.; Neuhoff-Murawska, J.; Matusik, P.; Socha, P. Omega-3 fatty acids therapy in children with nonalcoholic fatty liver disease: A randomized controlled trial. J. Pediatrics 2015, 166, 1358–1363, e1353. [Google Scholar] [CrossRef]
- Li, Y.H.; Yang, L.H.; Sha, K.H.; Liu, T.G.; Zhang, L.G.; Liu, X.X. Efficacy of poly-unsaturated fatty acid therapy on patients with nonalcoholic steatohepatitis. World J. Gastroenterol. 2016, 22, 7008–7013. [Google Scholar] [CrossRef] [PubMed]
- Moulder, G.; Smith, E.Z.; Caldwell, S.H.; Argo, C.K. RBC lipid composition is favorably altered in NASH patients treated with omega-3 fish oil versus placebo. Hepatology 2013, 58, 499A. [Google Scholar] [CrossRef]
- Nogueira, M.A.; Oliveira, C.P.; Ferreira Alves, V.A.; Stefano, J.T.; Rodrigues, L.S.; Torrinhas, R.S.; Cogliati, B.; Barbeiro, H.; Carrilho, F.J.; Waitzberg, D.L. Omega-3 polyunsaturated fatty acids in treating non-alcoholic steatohepatitis: A randomized, double-blind, placebo-controlled trial. Clin. Nutr. 2016, 35, 578–586. [Google Scholar] [CrossRef]
- Oscarsson, J.; Önnerhag, K.; Risérus, U.; Sundén, M.; Johansson, L.; Jansson, P.A.; Moris, L.; Nilsson, P.M.; Eriksson, J.W.; Lind, L. Effects of free omega-3 carboxylic acids and fenofibrate on liver fat content in patients with hypertriglyceridemia and non-alcoholic fatty liver disease: A double-blind, randomized, placebo-controlled study. J. Clin. Lipidol. 2018, 12, 1390–1403.e1394. [Google Scholar] [CrossRef] [PubMed]
- Pacifico, L.; Bonci, E.; Di Martino, M.; Versacci, P.; Andreoli, G.; Silvestri, L.M.; Chiesa, C. A double-blind, placebo-controlled randomized trial to evaluate the efficacy of docosahexaenoic acid supplementation on hepatic fat and associated cardiovascular risk factors in overweight children with nonalcoholic fatty liver disease. Nutr. Metab. Cardiovasc. Dis. NMCD 2015, 25, 734–741. [Google Scholar] [CrossRef]
- Parker, H.M.; Cohn, J.S.; O’Connor, H.T.; Garg, M.L.; Caterson, I.D.; George, J.; Johnson, N.A. Effect of fish oil supplementation on hepatic and visceral fat in overweight men: A randomized controlled trial. Nutrients 2019, 11, 475. [Google Scholar] [CrossRef]
- Qin, Y.; Zhou, Y.; Chen, S.H.; Zhao, X.L.; Ran, L.; Zeng, X.L.; Wu, Y.; Chen, J.L.; Kang, C.; Shu, F.R.; et al. Fish oil supplements lower serum lipids and glucose in correlation with a reduction in plasma fibroblast growth factor 21 and prostaglandin E2 in nonalcoholic fatty liver disease associated with hyperlipidemia: A randomized clinical trial. PLoS ONE 2015, 10, e0133496. [Google Scholar] [CrossRef]
- Chen, R.; Guo, Q.; Zhu, W.J.; Xie, Q.; Wang, H.; Cai, W. Therapeutic efficacy of omega-3 polyunsaturated fatty acid capsule in treatment of patients with non-alcoholic fatty liver disease. World Chin. J. Dig. 2008, 16, 2002–2006. [Google Scholar] [CrossRef]
- Sanyal, A.J.; Abdelmalek, M.F.; Suzuki, A.; Cummings, O.W.; Chojkier, M. No significant effects of ethyl-eicosapentanoic acid on histologic features of nonalcoholic steatohepatitis in a phase 2 trial. Gastroenterology 2014, 147, 377–384, e371. [Google Scholar] [CrossRef]
- Sofi, F.; Giangrandi, I.; Cesari, F.; Corsani, I.; Abbate, R.; Gensini, G.F.; Casini, A. Effects of a 1-year dietary intervention with n-3 polyunsaturated fatty acid-enriched olive oil on non-alcoholic fatty liver disease patients: A preliminary study. Int. J. Food Sci. Nutr. 2010, 61, 792–802. [Google Scholar] [CrossRef] [PubMed]
- Song, L.; Zhao, X.; Ouyang, P.; Guan, Q.; Yang, L.; Peng, F.; Du, H.; Yin, F.; Yan, W.; Yu, W.; et al. Combined effect of omega-3 fatty acids and phytosterol ester on alleviating hepatic steatosis in NAFLD subjects: A double-blind placebo-controlled clinical trial. Br. J. Nutr. 2020. [Google Scholar] [CrossRef] [PubMed]
- Spadaro, L.; Magliocco, O.; Spampinato, D.; Piro, S.; Oliveri, C.; Alagona, C.; Papa, G.; Rabuazzo, A.M.; Purrello, F. Effects of n-3 polyunsaturated fatty acids in subjects with nonalcoholic fatty liver disease. Dig. Liver Dis. 2008, 40, 194–199. [Google Scholar] [CrossRef]
- Tobin, D.; Brevik-Andersen, M.; Qin, Y.; Innes, J.K.; Calder, P.C. Evaluation of a high concentrate omega-3 for correcting the omega-3 fatty acid nutritional deficiency in non-alcoholic fatty liver disease (CONDIN). Nutrients 2018, 10, 1126. [Google Scholar] [CrossRef]
- Kong, X. A Basic and Clinical Reseach of ω-3 Polyunsaturated Fatty Acids to Seal Non-alcoholic Fatty Liver Disease. Master‘s Thesis, Dalian Medical University, Dalian, China, 2011. [Google Scholar]
- Zhu, F.S.; Liu, S.; Chen, X.M.; Huang, Z.G.; Zhang, D.W. Effects of n-3 polyunsaturated fatty acids from seal oils on nonalcoholic fatty liver disease associated with hyperlipidemia. World J. Gastroenterol. 2008, 14, 6395–6400. [Google Scholar] [CrossRef] [PubMed]
- Hu, Z.W. Therapeutic effect of seal oil on non-alcoholic fatty liver disease. Acad. J. Guangzhou Med. Univ. 2015, 4, 31–33. [Google Scholar]
- Hernaez, R.; Lazo, M.; Bonekamp, S.; Kamel, I.; Brancati, F.L.; Guallar, E.; Clark, J.M. Diagnostic accuracy and reliability of ultrasonography for the detection of fatty liver: A meta-analysis. Hepatology 2011, 54, 1082–1090. [Google Scholar] [CrossRef] [PubMed]
- Saadeh, S.; Younossi, Z.M.; Remer, E.M.; Gramlich, T.; Ong, J.P.; Hurley, M.; Mullen, K.D.; Cooper, J.N.; Sheridan, M.J. The utility of radiological imaging in nonalcoholic fatty liver disease. Gastroenterology 2002, 123, 745–750. [Google Scholar] [CrossRef]
- Guido, M.; Rugge, M. Liver biopsy sampling in chronic viral hepatitis. Semin. Liver Dis. 2004, 24, 89–97. [Google Scholar] [CrossRef] [PubMed]
- Tannapfel, A.; Denk, H.; Dienes, H.P.; Langner, C.; Schirmacher, P.; Trauner, M.; Flott-Rahmel, B. Histopathological diagnose of non-alcoholic and alcoholic fatty liver disease. Z. Gastroenterol. 2010, 48, 486–498. [Google Scholar] [CrossRef] [PubMed]
- Marsman, H.A.; Heger, M.; Kloek, J.J.; Nienhuis, S.L.; van Werven, J.R.; Nederveen, A.J.; Ten Kate, F.J.; Stoker, J.; van Gulik, T.M. Reversal of hepatic steatosis by omega-3 fatty acids measured non-invasively by (1) H-magnetic resonance spectroscopy in a rat model. J. Gastroenterol. Hepatol. 2011, 26, 356–363. [Google Scholar] [CrossRef] [PubMed]
- Parker, H.M.; Johnson, N.A.; Burdon, C.A.; Cohn, J.S.; O’Connor, H.T.; George, J. Omega-3 supplementation and non-alcoholic fatty liver disease: A systematic review and meta-analysis. J. Hepatol. 2012, 56, 944–951. [Google Scholar] [CrossRef]
- Yu, L.; Yuan, M.; Wang, L. The effect of omega-3 unsaturated fatty acids on non-alcoholic fatty liver disease: A systematic review and meta-analysis of RCTs. Pak. J. Med. Sci. 2017, 33, 1022–1028. [Google Scholar] [CrossRef]
- Zivkovic, A.M.; German, J.B.; Sanyal, A.J. Comparative review of diets for the metabolic syndrome: Implications for nonalcoholic fatty liver disease. Am. J. Clin. Nutr. 2007, 86, 285–300. [Google Scholar] [CrossRef]
- Calder, P.C. Omega-3 polyunsaturated fatty acids and inflammatory processes: Nutrition or pharmacology? Br. J. Clin. Pharmacol. 2013, 75, 645–662. [Google Scholar] [CrossRef]
- Wall, R.; Ross, R.P.; Fitzgerald, G.F.; Stanton, C. Fatty acids from fish: The anti-inflammatory potential of long-chain omega-3 fatty acids. Nutr. Rev. 2010, 68, 280–289. [Google Scholar] [CrossRef]
- Skulas-Ray, A.C.; Wilson, P.W.F.; Harris, W.S.; Brinton, E.A.; Kris-Etherton, P.M.; Richter, C.K.; Jacobson, T.A.; Engler, M.B.; Miller, M.; Robinson, J.G.; et al. Omega-3 fatty acids for the management of hypertriglyceridemia: A science advisory from the American Heart Association. Circulation 2019, 140, e673–e691. [Google Scholar] [CrossRef]


| Database | Search Strategy |
|---|---|
| Cochrane Central Register of Controlled Trials |
|
| Embase |
|
| MEDLINE |
|
| First Author, Year, Country | Participants | Intervention/Control | Outcome of Interest |
|---|---|---|---|
| Argo, 2015, USA | Steatohepatitis within 6 months. |
| Anthropometric assessment Histologic assessment LFT Insulin resistance and lipid profile Abdominal MRI Markers of hepatocyte injury |
| Boyraz, 2015, Turkey | Obese patients with NAFLD, persistently elevated serum aminotransferase levels |
| Anthropometric assessment LFT Insulin resistance and lipid profile Liver ultrasonography |
| Chen, 2008, China | NAFLD patients with abnormal lipid test |
| LFT Lipid profile tests Liver ultrasonography |
| Dasarathy, 2015, USA | Well-controlled diabetes and NASH patients with NAS ≥ 4 within 6 months |
| Anthropometric assessment LFT Insulin resistance and lipid profile Histologic assessment |
| Eriksson, 2018, Sweden | T2DM, MRI showed PDFF > 5.5% (NAFLD) and BMI of 25–40 kg/m2. |
| Lipid profile Sugar and insulin resistance Plasma levels of DHA, EPA and Oxidative stress biomarkers MRI |
| Hu, 2015, China | Patients who are pathologically diagnosed NAFLD, aged 20–60 years old |
| LFT Lipid profile and insulin resistance Abdominal ultrasound Histologic assessment |
| Janczyk, 2015, Poland |
|
| Anthropometric measurements LFT Lipid profile and insulin resistance Abdominal ultrasound |
| Kong, 2011, China | NAFLD patients |
| LFT Lipid profile CT of abdomen |
| Li, 2015, China | Patients pathologically diagnosed with NASH |
| Anthropometric measurements LFT Lipid profile Histological evaluation |
| Moulder, 2013 (Abstract), USA | NASH, proven by histology |
| NASH biomarkers Insulin and lipid profile tests Erythrocyte fatty acid levels MRI of abdomen Liver biopsy and histological evaluation |
| Nogueira, 2016, Brazil | People with a proven histological diagnosis of NASH. |
| Liver histopathology, biochemical tests, and anthropometric data |
| Oscarsson 2018, Sweden | 40–75 years old, BMI of 25–40, TG ≥ 150 mg/dL, PDFF-MRI ≥ 5.5%. |
| Anthropometric measurements Glucose and insulin resistance Lipid profile LFT MRI of liver |
| Pacifico, 2015, Italy | Age < 18 years; BMI > 85th percentile elevated ALT level; MRI-diagnosed NAFLD; liver biopsy consistent with NAFLD |
| Anthropometric measurements Lipid profile and insulin resistance LFT Abdominal MRI Echocardiographic parameters Liver biopsy |
| Parker, 2019, Australia | Men aged from 18 to 60 years, BMI 25.0~29.9 and WC > 94 cm |
| Anthropometric assessment Lipid profile LFT Omega-3 Index MRI and proton MRS |
| Qin, 2015, China | NAFLD patients with hyperlipidemia |
| Anthropometric parameters Lipid profile and sugar Insulin resistance LFT, kidney parameters Serum cytokines |
| Sanyal, 2014, North America | Patients with biopsy-confirmed NASH |
| LFT Serum lipids and insulin resistance Liver biopsy and histological evaluation |
| Scorletti, 2014, North America | NAFLD patients confirmed by image or histology |
| Anthropometric parameters LFT Serum lipid tests and glucose level Fibrosis markers Quantification of erythrocyte enrichment with DHA + EPA MRI of abdomen |
| Sofi, 2010, Italy | Patients with NAFLD characterized by ultrasonography |
| Anthropometric parameters Physical activity Liver enzymes Serum lipids and insulin resistance Oxidative stress markers Fatty liver evaluation |
| Song, 2020, China | Adult participants diagnosed fatty liver by ultrasound and were dyslipidemic status |
| Anthropometric measurements Liver enzymes Serum lipids and glucose level CT examination Cytokine determination Serum DHA and EPA concentration analysis |
| Spadaro, 2008, Italy | NAFLD patients diagnosed by ultrasonography with increased in ALT levels for ≥6 months |
| Anthropometric measurements Liver enzymes Serum lipids and insulin resistance Ultrasound |
| Tobin, 2018, USA | Adults with NAFLD and BMI between 18–39.9 kg/m2 |
| Anthropometric data LFT Lipid profile RBC fatty acid content: RBC EPA + DHA, EPA, and DHA Values MRI-PDFF liver fat percentage |
| Zhu, 2008, China | Patients (age 18–65) with NAFLD with dyslipidemia, elevated liver enzymes |
| Anthropometric data LFT Lipid profile Liver ultrasonography |
© 2020 by the authors. Licensee MDPI, Basel, Switzerland. This article is an open access article distributed under the terms and conditions of the Creative Commons Attribution (CC BY) license (http://creativecommons.org/licenses/by/4.0/).
Share and Cite
Lee, C.-H.; Fu, Y.; Yang, S.-J.; Chi, C.-C. Effects of Omega-3 Polyunsaturated Fatty Acid Supplementation on Non-Alcoholic Fatty Liver: A Systematic Review and Meta-Analysis. Nutrients 2020, 12, 2769. https://doi.org/10.3390/nu12092769
Lee C-H, Fu Y, Yang S-J, Chi C-C. Effects of Omega-3 Polyunsaturated Fatty Acid Supplementation on Non-Alcoholic Fatty Liver: A Systematic Review and Meta-Analysis. Nutrients. 2020; 12(9):2769. https://doi.org/10.3390/nu12092769
Chicago/Turabian StyleLee, Cheng-Han, Yun Fu, Shih-Jyun Yang, and Ching-Chi Chi. 2020. "Effects of Omega-3 Polyunsaturated Fatty Acid Supplementation on Non-Alcoholic Fatty Liver: A Systematic Review and Meta-Analysis" Nutrients 12, no. 9: 2769. https://doi.org/10.3390/nu12092769
APA StyleLee, C.-H., Fu, Y., Yang, S.-J., & Chi, C.-C. (2020). Effects of Omega-3 Polyunsaturated Fatty Acid Supplementation on Non-Alcoholic Fatty Liver: A Systematic Review and Meta-Analysis. Nutrients, 12(9), 2769. https://doi.org/10.3390/nu12092769