The Facts about Food after Cancer Diagnosis: A Systematic Review of Prospective Cohort Studies

 ,
,  ,
,  , ,
, ,  , , ,
, , , 

Abstract
1. Introduction
2. Methods
2.1. Eligibility Criteria
- Population: adult (≥18 years old) patients diagnosed with breast, gastrointestinal (gastric, pancreatic, colorectal), gynecological (uterine, cervical, ovarian, endometrial, vulvar), lung and urological (prostate, bladder) cancers.
- Exposure: any post-diagnostic dietary exposure such as dietary patterns or individual food components exposure (fruit, vegetables, dairy, meat, fish, cereals) or use of diet quality indices.
- Study design: prospective or retrospective cohort studies.
- Outcomes of interest: overall survival (OS) or all-cause mortality (ACM), cancer-specific mortality (CSM), death from a cause other than specific cancer, cancer progression, disease-free survival (DFS), cancer recurrence and recurrence-free survival (RFS).
2.2. Definitions of Outcomes
2.3. Data Sources and Search Strategy
2.4. Study Selection
2.5. Data Extraction
2.6. Quality Assessment
2.7. Data Synthesis
3. Results
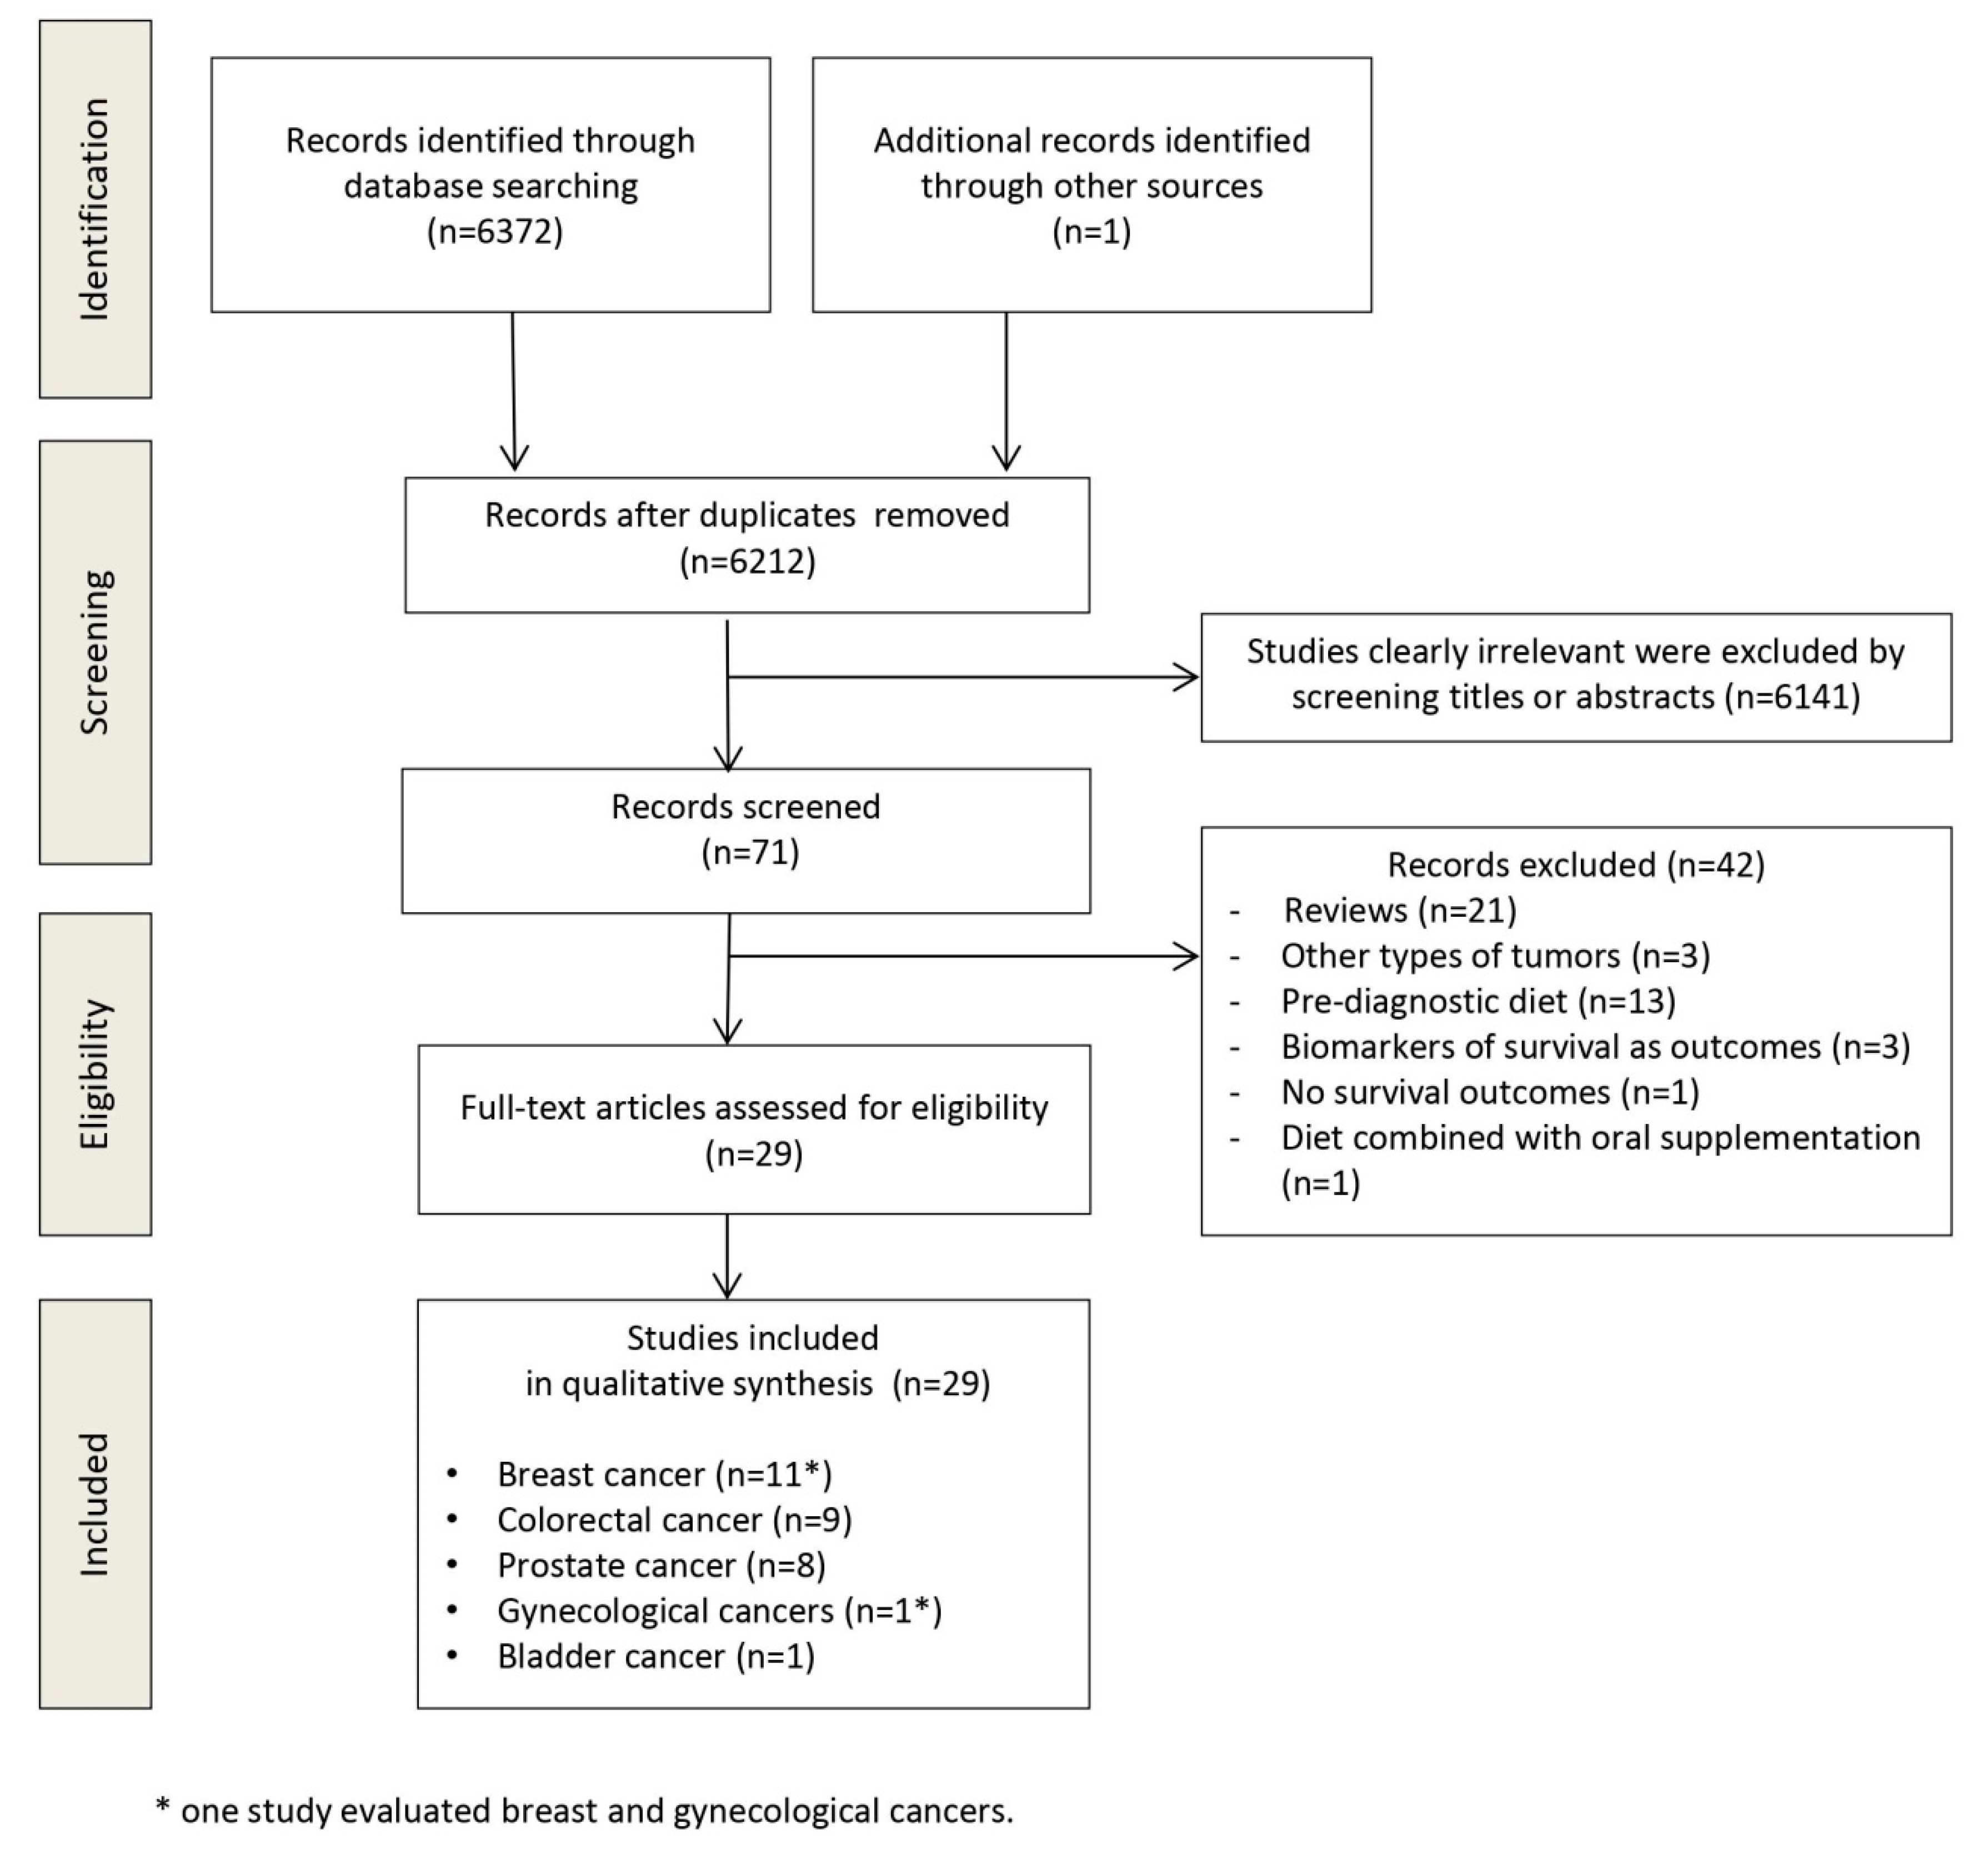
3.1. Study Selection
3.2. Study Characteristics
3.3. Quality Assessment
3.4. Summary of Findings
3.4.1. Breast Cancer
Dietary Patterns
Dietary Factors
3.4.2. Colorectal Cancer
Dietary Patterns
Dietary Factors
3.4.3. Prostate Cancer
Dietary Patterns
Dietary Factors
3.4.4. Bladder Cancer
3.4.5. Gynecological Cancers
3.4.6. Lung, Gastric and Pancreatic Cancers
4. Discussion
5. Conclusions
Supplementary Materials
Author Contributions
Funding
Conflicts of Interest
References
- World Health Organization. Press Release n° 263. 12 September 2018. Available online: https://www.who.int/cancer/PRGlobocanFinal.pdf (accessed on 12 February 2020).
- Grosso, G.; Bella, F.; Godos, J.; Sciacca, S.; Del Rio, D.; Ray, S.; Galvano, F.; Giovannucci, E.L. Possible role of diet in cancer: Systematic review and multiple meta-analyses of dietary patterns, lifestyle factors, and cancer risk. Nutr. Rev. 2017, 75, 405–419. [Google Scholar] [CrossRef] [PubMed]
- Schwingshackl, L.; Schwedhelm, C.; Galbete, C.; Hoffmann, G. Adherence to Mediterranean Diet and Risk of Cancer: An Updated Systematic Review and Meta-Analysis. Nutrients 2017, 9, 1063. [Google Scholar] [CrossRef] [PubMed]
- Schwingshackl, L.; Hoffmann, G. Adherence to Mediterranean diet and risk of cancer: A systematic review and meta-analysis of observational studies. Int. J. Cancer 2014, 135, 1884–1897. [Google Scholar] [CrossRef]
- Cederholm, T.; Barazzoni, R.; Austin, P.; Ballmer, P.; Biolo, G.; Bischoff, S.C.; Compher, C.; Correia, I.; Higashiguchi, T.; Holst, M.; et al. ESPEN guidelines on definitions and terminology of clinical nutrition. Clin. Nutr. 2017, 36, 49–64. [Google Scholar] [CrossRef] [PubMed]
- Muscaritoli, M.; Lucia, S.; Farcomeni, A.; Lorusso, V.; Saracino, V.; Barone, C.; Plastino, F.; Gori, S.; Magarotto, R.; Carteni, G.; et al. Prevalence of malnutrition in patients at first medical oncology visit: The PreMiO study. Oncotarget 2017, 45, 79884–79896. [Google Scholar] [CrossRef] [PubMed]
- Muscaritoli, M.; Molfino, A.; Gioia, G.; Laviano, A.; Rossi Fanelli, F. The “parallel pathway”: A novel nutritional and metabolic approach to cancer patients. Int. Emerg. Med. 2011, 6, 105–112. [Google Scholar] [CrossRef] [PubMed]
- Rinninella, E.; Persiani, R.; D’Ugo, D.; Pennestrì, F.; Cicchetti, A.; Di Brino, E.; Cintoni, M.; Miggiano, G.A.D.; Gasbarrini, A.; Mele, M.C. NutriCatt protocol in the Enhanced Recovery After Surgery (ERAS) program for colorectal surgery: The nutritional support improves clinical and cost-effectiveness outcomes. Nutrition 2018, 50, 74–81. [Google Scholar] [CrossRef] [PubMed]
- Arends, J.; Bachmann, P.; Baracos, V.; Barthelemy, N.; Bertz, H.; Bozzetti, F.; Fearon, K.; Hütterer, E.; Isenring, E.; Kaasa, S.; et al. ESPEN guidelines on nutrition in cancer patients. Clin. Nutr. 2017, 36, 11–48. [Google Scholar] [CrossRef]
- Zick, S.M.; Snyder, D.; Abrams, D.I. Pros and cons of dietary strategies popular among cancer patients. Oncology 2018, 32, 542–547. [Google Scholar]
- Holmes, M.D.; Wang, J.; Hankinson, S.E.; Tamimi, R.M.; Chen, W.Y. Protein intake and breast cancer survival in the Nurses’ Health Study. J. Clin. Oncol. 2017, 35, 325–333. [Google Scholar] [CrossRef]
- Meyerhardt, J.A.; Niedzwiecki, D.; Hollis, D.; Saltz, L.B.; Hu, F.B.; Mayer, R.J.; Nelson, H.; Whittom, R.; Hantel, A.; Thomas, J.; et al. Association of dietary patterns with cancer recurrence and survival in patients with stage III colon cancer. JAMA 2007, 298, 754–764. [Google Scholar] [CrossRef] [PubMed]
- Fadelu, T.; Zhang, S.; Niedzwiecki, D.; Ye, X.; Saltz, L.B.; Mayer, R.J.; Mowat, R.B.; Whittom, R.; Hantel, A.; Benson, A.B.; et al. Nut Consumption and Survival in Patients with Stage III Colon Cancer: Results from CALGB 89803 (Alliance). J. Clin. Oncol. 2018, 36, 1112–1120. [Google Scholar] [CrossRef] [PubMed]
- Richman, E.L.; Stampfer, M.J.; Paciorek, A.; Broering, J.M.; Carroll, P.R.; Chan, J.M. Intakes of meat, fish, poultry, and eggs and risk of prostate cancer progression. Am. J. Clin. Nutr. 2010, 91, 712–721. [Google Scholar] [CrossRef]
- Ratjen, I.; Schafmayer, C.; di Giuseppe, R.; Waniek, S.; Plachta-Danielzik, S.; Koch, M.; Nöthlings, U.; Hampe, J.; Schlesinger, S.; Lieb, W. Postdiagnostic Mediterranean, and Healthy Nordic Dietary Patterns Are Inversely Associated with All-Cause Mortality in Long-Term Colorectal Cancer Survivors. J. Nutr. 2017, 147, 636–644. [Google Scholar] [CrossRef] [PubMed]
- Jochems, S.H.J.; van Osch, F.H.M.; Reulen, R.C.; van Hensbergen, M.; Nekeman, D.; Pirrie, S.; Wesselius, A.; van Schooten, F.J.; James, N.D.; Wallace, D.M.A.; et al. Fruit and vegetable intake and the risk of recurrence in patients with non-muscle invasive bladder cancer: A prospective cohort study. Cancer Causes Control 2018, 29, 573–579. [Google Scholar] [CrossRef] [PubMed]
- Cochrane Handbook for Systematic Reviews of Interventions Version 5.1.0 [Updated March 2011]. Available online: www.cochrane-handbook.org (accessed on 28 February 2020).
- Moher, D.; Liberati, A.; Tetzlaff, J.; Altman, D.G.; Prisma Group. Preferred reporting items for systematic reviews and meta-analyses: The Prisma statement. BMJ 2009, 339. [Google Scholar] [CrossRef]
- Hayden, J.; van der Windt, D.A.; Cartwright, J.L.; Côté, P.; Bombardier, C. Assessing bias in studies of prognostic factors. Ann. Int. Med. 2013, 158, 280–286. [Google Scholar] [CrossRef]
- Holmes, M.D.; Stampfer, M.J.; Colditz, G.A.; Rosner, B.; Hunter, D.J.; Willett, W.C. Dietary factors and the survival of women with breast carcinoma. Cancer 1999, 86, 826–835. [Google Scholar] [CrossRef]
- Kroenke, C.H.; Chen, W.Y.; Rosner, B.; Holmes, M.D. Weight, weight gain, and survival after breast cancer diagnosis. J. Clin. Oncol. 2005, 23, 1370–1378. [Google Scholar] [CrossRef]
- Kwan, M.L.; Weltzien, E.; Kushi, L.H.; Castillo, A.; Slattery, M.L.; Caan, B.J. Dietary patterns and breast cancer recurrence and survival among women with early-stage breast cancer. J. Clin. Oncol. 2009, 27, 919–926. [Google Scholar] [CrossRef]
- Shu, X.O.; Zheng, Y.; Cai, H.; Gu, K.; Chen, Z.; Zheng, W.; Lu, W. Soy food and breast cancer survival. JAMA 2009, 302, 2437–2443. [Google Scholar] [CrossRef] [PubMed]
- Beasley, J.M.; Newcomb, P.A.; Trentham-Dietz, A.; Hampton, J.M.; Bersch, A.J.; Passarelli, M.N.; Holick, C.N.; Titus-Ernstof, L.; Egan, K.M.; Holmes, M.D.; et al. Post-diagnosis dietary factor and survival after invasive breast cancer. Breast Cancer Res. Treat. 2011, 128, 229–236. [Google Scholar] [CrossRef]
- Kim, E.H.; Willett, W.C.; Fung, T.; Rosner, B.; Holmes, M.D. Diet quality indices and postmenopausal breast cancer survival. Nutr. Cancer 2011, 63, 381–388. [Google Scholar] [CrossRef] [PubMed]
- Nechuta, S.J.; Caan, B.J.; Chen, W.Y.; Lu, W.; Chen, Z.; Kwan, M.L.; Flatt, S.W.; Zheng, Y.; Zheng, W.; Pierce, J.P.; et al. Soy food intake after diagnosis of breast cancer and survival: An in-depth analysis of combined evidence from cohort studies of US and Chinese women. Am. J. Clin. Nutr. 2012, 96, 123–132. [Google Scholar] [CrossRef] [PubMed]
- Kroenke, C.H.; Kwan, M.L.; Sweeney, C.; Castillo, A.; Caan, B.J. High- and low-fat dairy intake, recurrence, and mortality after breast cancer diagnosis. J. Natl. Cancer Inst. 2013, 105, 616–623. [Google Scholar] [CrossRef]
- Andersen, J.L.M.; Hansen, L.; Thomsen, B.L.R.; Christiansen, L.R.; Dragsted, L.O.; Olsen, A. Pre- and post-diagnostic intake of whole grain and dairy products and breast cancer prognosis: The Danish Diet, Cancer, and Health cohort. Breast Cancer Res. Treat. 2019, 179, 743–753. [Google Scholar] [CrossRef]
- Karavasiloglou, N.; Pestoni, G.; Faeh, D.; Rohrmann, S. Post-Diagnostic Diet Quality and Mortality in Females with Self-Reported History of Breast or Gynecological Cancers: Results from the Third National Health and Nutrition Examination Survey (NHANES III). Nutrients 2019, 11, 2558. [Google Scholar] [CrossRef]
- McCullough, M.L.; Gapstur, S.M.; Shah, R.; Jacobs, E.J.; Campbell, P.T. Association between red and processed meat intake and mortality among colorectal cancer survivors. J. Clin. Oncol. 2013, 31, 2773–2782. [Google Scholar] [CrossRef]
- Fung, T.T.; Kashambwa, R.; Sato, K.; Chiuve, S.E.; Fuchs, C.S.; Wu, K.; Giovannucci, E.; Ogino, S.; Hu, F.B.; Meyerhardt, J.A. Post diagnosis diet quality and colorectal cancer survival in women. PLoS ONE 2014, 9, 115377. [Google Scholar] [CrossRef]
- Yang, B.; McCullough, M.L.; Gapstur, S.M.; Jacobs, E.J.; Bostick, R.M.; Fedirko, V.; Flanders, W.D.; Campbell, P.T. Calcium, vitamin D, dairy products, and mortality among colorectal cancer survivors: The Cancer Prevention Study-II Nutrition Cohort. J. Clin. Oncol. 2014, 32, 2335–2343. [Google Scholar] [CrossRef]
- Van Blarigan, E.L.; Fuchs, C.S.; Niedzwiecki, D.; Ye, X.; Zhang, S.; Song, M.; Saltz, L.B.; Mayer, R.J.; Mowat, R.B.; Whittom, R.; et al. Marine ω-3 Polyunsaturated Fatty Acid and Fish Intake after Colon Cancer Diagnosis and Survival: CALGB 89803 (Alliance). Cancer Epidemiol. Biomark. Prev. 2018, 27, 438–445. [Google Scholar] [CrossRef] [PubMed]
- Tamakoshi, A.; Nakamura, K.; Ukawa, S.; Okada, E.; Hirata, M.; Nagai, A.; Matsuda, K.; Kamatani, Y.; Muto, K.; Kiyohara, Y.; et al. Characteristics and prognosis of Japanese colorectal cancer patients: The BioBank Japan Project. J. Epidemiol. 2017, 27, 36–42. [Google Scholar] [CrossRef] [PubMed]
- Song, M.; Wu, K.; Meyerhardt, J.; Ogino, S.; Wang, M.; Fuchs, C.S.; Giovannucci, E.L.; Chan, A.T. Fiber Intake and Survival After Colorectal Cancer Diagnosis. JAMA Oncol. 2018, 4, 71–79. [Google Scholar] [CrossRef] [PubMed]
- Chan, J.M.; Holick, C.N.; Leitzmann, M.F.; Rimm, E.B.; Willett, W.C.; Stampfer, M.J.; Giovannucci, E.L. Diet after diagnosis and the risk of prostate cancer progression, recurrence, and death (United States). Cancer Causes Control 2006, 17, 199–208. [Google Scholar] [CrossRef]
- Pettersson, A.; Kasperzyk, J.L.; Kenfield, S.A.; Richman, E.L.; Chan, J.M.; Willett, W.C.; Stampfer, M.J.; Mucci, L.A.; Giovannucci, E.L. Milk and dairy consumption among men with prostate cancer and risk of metastases and prostate cancer death. Cancer Epidemiol. Biomark. Prev. 2012, 21, 428–436. [Google Scholar] [CrossRef]
- Richman, E.L.; Carroll, P.R.; Chan, J.M. Vegetable and fruit intake after diagnosis and risk of prostate cancer progression. Int. J. Cancer 2012, 131, 201–210. [Google Scholar] [CrossRef]
- Richman, E.L.; Kenfield, S.A.; Chavarro, J.E.; Stampfer, M.J.; Giovannucci, E.L.; Willett, W.C.; Chan, J.M. Fat intake after diagnosis and risk of lethal prostate cancer and all-cause mortality. JAMA Int. Med. 2013, 173, 1318–1326. [Google Scholar] [CrossRef]
- Song, Y.; Chavarro, J.E.; Cao, Y.; Qiu, W.; Mucci, L.; Sesso, H.D.; Stampfer, M.J.; Giovannucci, E.; Pollak, M.; Liu, S.; et al. Whole milk intake is associated with prostate cancer-specific mortality among U.S. male physicians. J. Nutr. 2013, 143, 189–196. [Google Scholar] [CrossRef]
- Kenfield, S.A.; DuPre, N.; Richman, E.L.; Stampfer, M.J.; Chan, J.M.; Giovannucci, E.L. Mediterranean diet and prostate cancer risk and mortality in the Health Professionals Follow-up Study. Eur. Urol. 2014, 65, 887–894. [Google Scholar] [CrossRef]
- Van Blarigan, E.L.; Kenfield, S.A.; Yang, M.; Sesso, H.D.; Ma, J.; Stampfer, M.J.; Chan, J.M.; Chavarro, J.E. Fat intake after prostate cancer diagnosis and mortality in the Physicians’ Health Study. Cancer Causes Control 2015, 26, 1117–11126. [Google Scholar] [CrossRef]
- Saxe, G.A.; Rock, C.L.; Wicha, M.S.; Schottenfeld, D. Diet and risk for breast cancer recurrence and survival. Breast Cancer Res. Treat. 1999, 53, 241–253. [Google Scholar] [CrossRef] [PubMed]
- Aune, D.; Chan, D.S.; Greenwood, D.C.; Vieira, A.R.; Rosenblatt, D.A.; Vieira, R.; Norat, T. Dietary fiber and breast cancer risk: A systematic review and meta-analysis of prospective studies. Ann. Oncol. 2012, 23, 1394–1402. [Google Scholar] [CrossRef] [PubMed]
- Ingram, D. Diet and subsequent survival in women with breast cancer. Br. J. Cancer 1994, 69, 592–595. [Google Scholar] [CrossRef] [PubMed]
- Monroe, K.R.; Murphy, S.P.; Henderson, B.E.; Kolonel, L.N.; Stanczyk, F.Z.; Adlercreutz, H.; Pike, M.C. Dietary fiber intake and endogenous serum hormone levels in naturally postmenopausal Mexican American women: The Multiethnic Cohort Study. Nutr. Cancer 2007, 58, 127–135. [Google Scholar] [CrossRef] [PubMed]
- Rose, D.P.; Goldman, M.; Connolly, J.M.; Strong, L.E. High-fiber diet reduces serum estrogen concentrations in premenopausal women. Am. J. Clin. Nutr. 1991, 54, 520–525. [Google Scholar] [CrossRef] [PubMed]
- Brand-Miller, J.C.; Holt, S.H.; Pawlak, D.B.; McMillan, J. Glycemic index and obesity. Am. J. Clin. Nutr. 2002, 76, 281–285. [Google Scholar] [CrossRef]
- Carbone, J.W.; Pasiakos, S.M. Dietary Protein and Muscle Mass: Translating Science to Application and Health Benefit. Nutrients 2019, 11, 1136. [Google Scholar] [CrossRef]
- Rinninella, E.; Cintoni, M.; Raoul, P.; Pozzo, C.; Strippoli, A.; Bria, E.; Tortora, G.; Gasbarrini, A.; Mele, M.C. Muscle mass, assessed at diagnosis by L3-CT scan as a prognostic marker of clinical outcomes in patients with gastric cancer: A systematic review and meta-analysis. Clin. Nutr. 2019. [Google Scholar] [CrossRef]
- Rinninella, E.; Fagotti, A.; Cintoni, M.; Raoul, P.; Scaletta, G.; Scambia, G.; Gasbarrini, A.; Mele, M.C. Skeletal muscle mass as a prognostic indicator of outcomes in ovarian cancer: A systematic review and meta-analysis. Int. J. Gynecol. Cancer 2020. [Google Scholar] [CrossRef]
- Farinetti, A.; Zurlo, V.; Manenti, A.; Coppi, F.; Mattioli, A.V. Mediterranean diet and colorectal cancer: A systematic review. Nutrition 2017, 43, 83–88. [Google Scholar] [CrossRef]
- Fung, T.T.; McCullough, M.L.; Newby, P.K.; Manson, J.E.; Meigs, J.B.; Rifai, N.; Willett, W.C.; Hu, F.B. Diet-quality scores and plasma concentrations of markers of inflammation and endothelial dysfunction. Am. J. Clin. Nutr. 2005, 82, 163–173. [Google Scholar] [CrossRef]
- Whisner, C.M.; Athena Aktipis, C. The Role of the Microbiome in Cancer Initiation and Progression: How Microbes and Cancer Cells Utilize Excess Energy and Promote One Another’s Growth. Curr. Nutr. Rep. 2019, 8, 42–51. [Google Scholar] [CrossRef] [PubMed]
- Zeng, H.; Lazarova, D.L.; Bordonaro, M. Mechanisms linking dietary fiber, gut microbiota and colon cancer prevention. World J. Gastrointest Oncol. 2014, 6, 41–51. [Google Scholar] [CrossRef] [PubMed]
- Rinninella, E.; Cintoni, M.; Raoul, P.; Lopetuso, L.R.; Scaldaferri, F.; Pulcini, G.; Miggiano, G.A.D.; Gasbarrini, A.; Mele, M.C. Food Components and Dietary Habits: Keys for a Healthy Gut Microbiota Composition. Nutrients 2019, 11, 2393. [Google Scholar] [CrossRef]
- Wang, T.; Cai, G.; Qiu, Y.; Fei, N.; Zhang, M.; Pang, X.; Jia, W.; Cai, S.; Zhao, L. Structural segregation of gut microbiota between colorectal cancer patients and healthy volunteers. ISME J. 2012, 6, 320–329. [Google Scholar] [CrossRef] [PubMed]
- Shen, X.J.; Rawls, J.F.; Randall, T.; Burcal, L.; Mpande, C.N.; Jenkins, N.; Jovov, B.; Abdo, Z.; Sandler, R.S.; Keku, T.O. Molecular characterization of mucosal adherent bacteria and associations with colorectal adenomas. Gut Microbes 2010, 1, 138–147. [Google Scholar] [CrossRef]
- Kostic, A.D.; Gevers, D.; Pedamallu, C.S.; Michaud, M.; Duke, F.; Earl, A.M.; Ojesina, A.I.; Jung, J.; Bass, A.J.; Tabernero, J.; et al. Genomic analysis identifies association of Fusobacterium with colorectal carcinoma. Genome Res. 2012, 22, 292–298. [Google Scholar] [CrossRef]
- Nomura, M.; Nagatomo, R.; Doi, K.; Shimizu, J.; Baba, K.; Saito, T.; Matsumoto, S.; Inoue, K.; Muto, M. Association of Short-Chain Fatty Acids in the Gut Microbiome With Clinical Response to Treatment With Nivolumab or Pembrolizumab in Patients With Solid Cancer Tumors. JAMA Netw. Open 2020, 3, 202895. [Google Scholar] [CrossRef]
- Nagel, J.M.; Brinkoetter, M.; Magkos, F.; Liu, X.; Chamberland, J.P.; Shah, S.; Zhou, J.; Blackburn, G.; Mantzoros, C.S. Dietary walnuts inhibit colorectal cancer growth in mice by suppressing angiogenesis. Nutrition 2012, 28, 67–75. [Google Scholar] [CrossRef]
- Lee, J.; Kim, Y.S.; Lee, J.; Heo, S.C.; Lee, K.L.; Choi, S.W. Walnut Phenolic Extract and Its Bioactive Compounds Suppress Colon Cancer Cell Growth by Regulating Colon Cancer Stemness. Nutrients 2016, 8, 439. [Google Scholar] [CrossRef]
- Yang, T.; Fang, S.; Zhang, H.X.; Xu, L.X.; Zhang, Z.Q.; Yuan, K.T.; Xue, C.L.; Yu, H.L.; Zhang, S.; Li, Y.F.; et al. N-3 PUFAs have antiproliferative and apoptotic effects on human colorectal cancer stem-like cells in vitro. J. Nutr. Biochem. 2013, 24, 744–753. [Google Scholar] [CrossRef] [PubMed]
- Serini, S.; Cassano, R.; Corsetto, P.A.; Rizzo, A.M.; Calviello, G.; Trombino, S. Omega-3 PUFA Loaded in Resveratrol-Based Solid Lipid Nanoparticles: Physicochemical Properties and Antineoplastic Activities in Human Colorectal Cancer Cells In Vitro. Int. J. Mol. Sci. 2018, 19, 586. [Google Scholar] [CrossRef]
- Fung, T.T.; Rimm, E.B.; Spiegelman, D.; Rifai, N.; Tofler, G.H.; Willett, W.C.; Hu, F.B. Association between dietary patterns and plasma biomarkers of obesity and cardiovascular disease risk. Am. J. Clin. Nutr. 2001, 73, 61–67. [Google Scholar] [CrossRef] [PubMed]
- Sandhu, M.S.; Dunger, D.B.; Giovannucci, E.L. Insulin, insulin-like growth factor-I (IGF-I), IGF binding proteins, their biologic interactions, and colorectal cancer. J. Natl. Cancer Inst. 2002, 94, 972–980. [Google Scholar] [CrossRef] [PubMed]
- Huxley, R.R.; Ansary-Moghaddam, A.; Clifton, P.; Czernichow, S.; Parr, C.L.; Woodward, M. The impact of dietary and lifestyle risk factors on risk of colorectal cancer: A quantitative overview of the epidemiological evidence. Int. J. Cancer 2009, 125, 171–180. [Google Scholar] [CrossRef]
- Muscaritoli, M.; Amabile, M.I.; Molfino, A. Foods and their components promoting gastrointestinal cancer. Curr. Opin. Clin. Nutr. Metab. Care 2016, 19, 377–381. [Google Scholar] [CrossRef]
- Zubair, H.; Bhardwaj, A.; Ahmad, A.; Srivastava, S.K.; Khan, M.A.; Patel, G.K.; Singh, S.; Singh, A.P. Hydroxytyrosol induces apoptosis and cell cycle arrest and suppresses multiple oncogenic signaling pathways in prostate cancer cells. Nutr. Cancer 2017, 69, 932–942. [Google Scholar] [CrossRef]
- Luo, C.; Li, Y.; Wang, H.; Cui, Y.; Feng, Z.; Li, H.; Li, Y.; Wang, Y.; Wurtz, K.; Weber, P.; et al. Hydroxytyrosol promotes superoxide production and defects in autophagy leading to anti-proliferation and apoptosis on human prostate cancer cells. Curr. Cancer Drug Targets. 2013, 13, 625–639. [Google Scholar] [CrossRef]
- Yang, C.M.; Lu, I.H.; Chen, H.Y.; Hu, M.L. Lycopene inhibits the proliferation of androgen-dependent human prostate tumor cells through activation of PPARγ-LXRα-ABCA1 pathway. J. Nutr. Biochem. 2012, 23, 8–17. [Google Scholar] [CrossRef]
- Soundararajan, P.; Kim, J.S. Anti-Carcinogenic Glucosinolates in Cruciferous Vegetables and Their Antagonistic Effects on Prevention of Cancers. Molecules 2018, 23, 2983. [Google Scholar] [CrossRef]
- Reiter, R.J.; Tan, D.X.; Manchester, L.C.; Korkmaz, A.; Fuentes-Broto, L.; Hardman, W.E. A walnut-enriched diet reduces the growth of LNCaP human prostate cancer xenografts in nude mice. Cancer Investig. 2013, 31, 365–373. [Google Scholar] [CrossRef] [PubMed]
- Sanchez-Gonzalez, C.; Ciudad, C.J.; Noe, V.; Izquierdo-Pulido, M. Walnut polyphenol metabolites, urolithins A and B, inhibit the expression of the prostate-specific antigen and the androgen receptor in prostate cancer cells. Food Funct. 2014, 5, 2922–2930. [Google Scholar] [CrossRef] [PubMed]
- Shankar, E.; Bhaskaran, N.; MacLennan, G.T.; Liu, G.; Daneshgari, F.; Gupta, S. Inflammatory Signaling Involved in High-Fat Diet Induced Prostate Diseases. J. Urol. Res. 2015, 2, 1018. [Google Scholar] [PubMed]
- Di Sebastiano, K.M.; Mourtzakis, M. The role of dietary fat throughout the prostate cancer trajectory. Nutrients 2014, 6, 6095–6109. [Google Scholar] [CrossRef] [PubMed]
- Liska, D.J.; Cook, C.M.; Wang, D.D.; Gaine, P.C.; Baer, D.J. Trans fatty acids and cholesterol levels: An evidence map of the available science. Food Chem. Toxicol. 2016, 98, 269–281. [Google Scholar] [CrossRef] [PubMed]
- Hayes, K.C. Saturated fats and blood lipids: New slant on an old story. Can. J. Cardiol. 1995, 11 (Suppl. G), 39–46. [Google Scholar]
- Krycer, J.R.; Brown, A.J. Cholesterol accumulation in prostate cancer: A classic observation from a modern perspective. Biochim. Biophys. Acta 2013, 1835, 219–229. [Google Scholar] [CrossRef]
- Ackerstaff, E.; Pflug, B.R.; Nelson, J.B.; Bhujwalla, Z.M. Detection of increased choline compounds with proton nuclear magnetic resonance spectroscopy subsequent to malignant transformation of human prostatic epithelial cells. Cancer Res. 2001, 61, 3599–3603. [Google Scholar]
- Richman, E.L.; Kenfield, S.A.; Stampfer, M.J.; Giovannucci, E.L.; Zeisel, S.H.; Willett, W.C.; Chan, J.M. Choline intake and risk of lethal prostate cancer: Incidence and survival. Am. J. Clin. Nutr. 2012, 96, 855–863. [Google Scholar] [CrossRef]
- Rinninella, E.; Cintoni, M.; Raoul, P.; Pozzo, C.; Strippoli, A.; Bria, E.; Tortora, G.; Gasbarrini, A.; Mele, M.C. Effects of nutritional interventions on nutritional status in patients with gastric cancer: A systematic review and meta-analysis of randomized controlled trials. Clin. Nutr. ESPEN 2020, 38, 28–42. [Google Scholar] [CrossRef]
- Payne, C.; Larkin, P.J.; McIlfatrick, S.; Dunwoody, L.; Gracey, J.H. Exercise and nutrition interventions in advanced lung cancer: A systematic review. Curr. Oncol. 2013, 20, 321–337. [Google Scholar] [CrossRef] [PubMed]
- Hamaguchi, R.; Narui, R.; Wada, H. Effects of Alkalization Therapy on Chemotherapy Outcomes in Metastatic or Recurrent Pancreatic Cancer. Anticancer Res. 2020, 40, 873–880. [Google Scholar] [CrossRef] [PubMed]
- Shukla, S.K.; Gebregiworgis, T.; Purohit, V.; Chaika, N.V.; Gunda, V.; Radhakrishnan, P.; Mehla, K.; Pipinos, I.I.; Powers, R.; Yu, F.; et al. Metabolic reprogramming induced by ketone bodies diminishes pancreatic cancer cachexia. Cancer Metab. 2014, 2, 18. [Google Scholar] [CrossRef]
- Schwartz, L.; Seyfried, T.; Alfarouk, K.O.; Da Veiga Moreira, J.; Fais, S. Out of Warburg effect: An effective cancer treatment targeting the tumor-specific metabolism and dysregulated pH. Semin. Cancer Biol. 2017, 43, 134–138. [Google Scholar] [CrossRef] [PubMed]


| First Author, Year | Country | Type of Cancer | Years of Diagnosis | N° of Cases (% of Cases Completed Follow-Up) | Cancer Stage at Diagnosis | Median Duration of Follow-Up | Type of Diet/Food Evaluated | Outcomes |
|---|---|---|---|---|---|---|---|---|
| Holmes, 1999 [20] | USA | Breast | 1976–1990 | 1982 (95) | NR | 18 years | Fat Protein Red meat Fiber Poultry, Dairy Others 80 food items | ACM |
| Kroenke, 2005 [21] | USA | Breast | 1982–1998 | 2619 (84.2) | I–III | 9 years | PD WD | ACM CSM Death from non-breast cancer causes |
| Kwan, 2009 [22] | USA | Breast | 1997–2000 | 1901 (88.1) | I–III | 5.9 years | PD WD | ACM CSM Death from non-breast cancer causes Recurrence |
| Shu, 2009 [23] | China | Breast | 2002–2006 | 5042 (91.2) | I–IV | 3.9 years | Soy food | ACM Cancer recurrence CSM |
| Beasley, 2011 [24] | USA | Breast | 1987–1999 | 4441 (96.9) | I–III | 5.5 years | Monounsaturated fats Polyunsaturated fat Saturated fats Trans fats Carbohydrates Protein | ACM CSM |
| Kim, 2011 [25] | USA | Breast | 1978–1998 | 2729 (79.0) | I–III | NR | Diet quality scores | ACM CSM Death from non-breast cancer causes |
| Nechuta, 2012 [26] | USA China | Breast | 1991–2006 | 9514 (90.7) | I–III | 7.4 years | Soy food | ACM CSM Recurrence |
| Kroenke, 2013 [27] | USA | Breast | 1997–2000 | 1893 (80.3) | I–IIIa | 11.8 years | Total dairy High-fat dairy Low-fat dairy | ACM CSM Recurrence Death from non-breast cancer causes |
| Holmes, 2017 [11] | USA | Breast | 1976–2004 | 6348 (70.9) | I–III | NR | Total protein Vegetable protein Animal protein Red meat Poultry Fish High-fat dairy Low-fat dairy | CSM Recurrence |
| Andersen, 2019 [28] | Denmark | Breast | 1993–1997 | 1965 (76.6) | NR | 7 years | Total whole grain products Whole grain bread Rye bread Oatmeal/muesli Total dairy products Milk Yogurt Cheese | ACM CSM Recurrence |
| Karavasiloglou, 2019 [29] | USA | Breast and gynecological | 1988–1994 | 230 (110 breast/120 gynecological) | survivors | 16 years | Mediterranean diet Healthy American diet | ACM |
| Meyerhardt, 2007 [12] | USA | Colorectal | 1999–2001 | 1009 (75.1) | III | 5.3 years | PD WD | OS DFS RFS |
| Mc Cullough, 2013 [30] | USA | Colorectal | 1992–2003 | 2315 (58.3) | NR | 4.6 years | Red and processed meat | ACM CSM |
| Fung, 2014 [31] | USA | Colorectal | 1986–2008 | 1201 (63.8) | I–III | 11.2 years | PD WD AHEI-2010 components | ACM CSM |
| Yang, 2014 [32] | USA | Colorectal | 1992–2009 | 1.111 (14.5) | NR | 7.5 years | Milk | ACM CSM |
| Van Blarigan, 2018 [33] | USA | Colon | 1999–2001 | 1011 (69.8) | III | 7 years | Dark fish Marine ω-3 PUFA | OS DFS RFS |
| Ratjen, 2017 [15] | Germany | Colorectal | 2004–2007 | 1404 (85.5) | NR | 7 years | Modified Mediterranean diet Healthy Nordic diet | ACM |
| Tamakoshi, 2017 [34] | Japan | Colorectal | 2003–2008 | 5864 (91.1) | NR | 7.4 years | Green leafy vegetables Meat | ACM |
| Fadelu, 2018 [13] | USA | Colon | 1999–2001 | 826 | III | 6.5 years | Total nuts Tree nuts Peanuts | OS DFS RFS |
| Song, 2018 [35] | USA | Colorectal | 1980–2010 | 1575 (50.9) | I–III | 8 years | Total fiber Cereal fiber Vegetable fiber Fruit fiber Whole grain | ACM CSM |
| Chan, 2006 [36] | USA | Prostate | 1986–1996 | 1202 (NR) | I–III | 77 months ± 34 | Red meat Grains Vegetables, Fruit Milk, Tomatoes Tomato sauce Fish | Cancer progression |
| Richman, 2010 [14] | USA | Prostate | 2004–2005 | 1294 (90.2) | NR | 2 years | Red processed and unprocessed red meat Fish Poultry Eggs | Cancer recurrence or progression |
| Petterson, 2012 [37] | USA | Prostate | 1986–2006 | 3918 (94.2) | I–III | 7.6 years | Skim and low-fat milk Whole milk Total milk low-fat Dairy low-fat products Dairy full-fat products Total dairy products | ACM CSM |
| Richman, 2012 [38] | USA | Prostate | 2000–2003 | 1560 (NR) | I–III | 23 months | Total vegetables Cruciferous vegetables Tomato sauce Legumes Other vegetable sub-groups Total fruit Subgroups of fruit | Cancer progression |
| Richman, 2013 [39] | USA | Prostate | 1986–2010 | 4577 (76.8) | I–III | 8.4 years | Saturated, monounsaturated, polyunsaturated, trans, animal, and vegetable fat | ACM CSM |
| Song, 2013 [40] | USA | Prostate | 1982–2010 | 2806 (89.1) | NR | 28 years | Different milk types | Cancer progression |
| Kenfield, 2014 [41] | USA | Prostate | 1986–2010 | 4538 (74.0) | I–III | 8.9 years | Mediterranean diet | ACM CSM |
| Van Blarigan, 2015 [42] | USA | Prostate | 1982–1997 | 926 (64.0) | I–III | 10 years | Saturated fat Monounsaturated, Polyunsaturated, Trans fats Animal fat Vegetable fat Carbohydrates | ACM CSM |
| Joechems, 2018 [16] | UK | Bladder | 2005–2011 | 389 | I–III | 3.7 years | Fruit Vegetables | Cancer recurrence |
| Study ID | Method of Dietary Assessment | Time of Dietary Assessment | Dietary Factor or Dietary Patterns Evaluated | Outcomes | HR or RR (95% CI) | Adjustment Covariates | QUIPS Score |
|---|---|---|---|---|---|---|---|
| Holmes, 1999 [20] | FFQ | After diagnosis | Fat Protein Red meat Fiber Poultry, dairy Others 80 food items | ACM | Protein intake Q5 vs. Q1: RR 0.65 (0.47–0.88) | Age at diagnosis, year of diagnosis, tumor size, grade, hormone receptor status, and the presence of positive lymph nodes, menopausal status, family history of breast carcinoma, age at first pregnancy, parity, postmenopausal hormone use, oral contraceptive use, and BMI | Moderate |
| Kroenke, 2005 [21] | FFQ | More than 1 year after diagnosis | PD WD | ACM CSM Death from non-breast cancer causes | No significant results No significant results PD Q5 vs. Q1: RR 0.54 (0.31–0.95) WD Q5 vs. Q1: RR 2.31 (1.23–4.32) | Age, BMI, oral contraceptive use, menopausal status, age at menopause, use of postmenopausal hormone therapy, breast cancer stage using the standard American Joint Committee on Cancer staging criteria, chemotherapy, and hormonal therapy, energy intake and alcohol intake | Low |
| Kwan, 2009 [22] | FFQ | After diagnosis | PD WD | ACM Death from non-breast cancer causes CSM Recurrence | PD Q4 vs. Q1: HR 0.57 (0.36–0.90) PD Q4 vs. Q1: HR 0.35 (0.17–0.73) No significant results No significant results | Age at diagnosis and total energy intake, total physical activity at baseline, BMI at enrollment and smoking status | Moderate |
| Shu, 2009 [23] | Dietary questionnaire | 6 months after diagnosis | Soy food | ACM Cancer recurrence CSM | Soy food Q4 vs. Q1: HR 0.67 (0.51–0.88) Soy food Q4 vs. Q1: HR 0.66 (0.52–0.84) No significant results | Age at diagnosis, TNM stage, chemotherapy, radiotherapy, type of surgery received, BMI, ER and PR status, tamoxifen use, education level, crucifer intake, red meat intake, fish intake, any vitamin supplement use, tea consumption and physical activity | Moderate |
| Beasley, 2011 [24] | FFQ | After diagnosis | Monounsaturated fats PUFAs Saturated fats Trans fats Carbohydrates Protein | ACM CSM | Saturated fats Q5 vs. Q1: HR 1.41 (1.06–1.87) Trans fats Q5 vs. Q1: HR 1.78 (1.35–2.32) No significant results | Age, state of residence, menopausal status, smoking, breast cancer stage, alcohol, history of hormone replacement therapy), interval between diagnosis and diet assessment, and at follow-up (energy intake, breast cancer treatment, body mass index, and physical activity | Low |
| Kim, 2011 [25] | FFQ | After diagnosis | Diet quality | ACM CSM Death from non-breast cancer causes | No significant results No significant results MMDS Q3 vs. Q1: RR 0.39 (0.20–0.75) (with low physical activity ≤9 METs/week) | Age, energy intake, disease stage (I, II, III), treatment, smoking status, physical activity, menopausal status and hormone therapy use, oral contraceptive use, BMI, weight change, energy intake, multivitamin use, alcohol | Low |
| Nechuta, 2012 [26] | FFQ 24-h dietary recall | After diagnosis | Soy food | ACM CSM Recurrence | No significant results No significant results Consumption of ≥10 mg soy isoflavones/d: HR 0.75 (0.61–0.92) | Age, TNM stage, chemotherapy, radiotherapy, hormonal therapy, education, race, ethnicity, first-degree family history of breast cancer, menopausal status, parity, recreational physical activity in metabolic equivalent hours per week, smoking, cruciferous vegetable intake, and BMI | Low |
| Kroenke, 2013 [27] | FFQ | After diagnosis | Total dairy High-fat dairy Low-fat dairy | ACM Death from non-breast cancer causes CSM Recurrence | High-fat dairy: ≥1 serving/day vs. 0 to <0.5 serving/day: HR 1.64 (1.24–2.17) High-fat dairy: ≥1 serving/day vs. 0 to <0.5 serving/day: HR 1.67 (1.13–2.47) No significant results No significant results | Age, dairy intake and breast cancer outcomes, stage, tumor size, grade, nodal status, estrogen receptor status, human epidermal growth factor receptor 2 status, treatment, education, ethnicity, energy intake, red meat, fiber, and fruit intake, BMI, physical activity, alcohol intake, smoking status | Low |
| Holmes, 2017 [11] | FFQ | At least 12 months after diagnosis | Total protein Vegetable protein Animal protein Red meat Poultry Fish High-fat dairy Low-fat dairy | CSM Recurrence | Animal protein Q4 vs. Q1: RR 0.77 (0.62–0.94) Total protein Q4 vs. Q1: RR 0.75 (0.61–0.91) Animal protein Q5 vs. Q1: RR 0.78 (0.63–0.95) | Age, energy intake, BMI, weight change, menopausal status, hormone therapy use, age at first birth, parity, alcohol consumption, aspirin use, oral contraceptive use, year of diagnosis, disease stage, self-reported radiation therapy, chemotherapy, and hormonal treatment, smoking, physical activity | Low |
| Andersen, 2019 [28] | FFQ | After diagnosis | Total whole grain products Whole grain bread Rye bread Oatmeal/muesli Total dairy products Milk Yogurt Cheese | ACM CSM Recurrence | No significant results Rye bread: by serving size increment per day HR 1.29 (1.02–1.63) No significant results | Age at diagnosis, educational level, physical activity, BMI, smoking, alcohol intake, tumor stage, number of affected lymph nodes, ER status, year of diagnosis | Moderate |
| Karavasiloglou, 2019 [29] | 24-h dietary recall interview | After diagnosis | Diet quality (HEI) Mediterranean diet (MDS) | ACM | HEI score (≥70 vs. <70): HR 0.49 (0.25–0.97) | Age, ethnicity, time between cancer diagnosis and completion of the NHANES III questionnaire, socioeconomic status, marital status, BMI, physical activity, self-reported prevalent chronic diseases at baseline, daily energy intake and history of menopausal hormone therapy use | High |
| Study ID | Method of Dietary Assessment | Time of Dietary Assessment | Dietary Factor or Dietary Patterns Evaluated | Outcomes | HR or RR (95% CI) | Adjustment Covariates | QUIPS Score |
|---|---|---|---|---|---|---|---|
| Meyerhardt, 2007 [12] | SFFQ | In the middle of ChT course and approx. 6 months after ChT | WD PD | OS DFS RFS | WD Q5 vs. Q1: HR 2.32 (1.36–3.96) WD Q5 vs. Q1: HR 3.25 (2.04–5.19) WD Q5 vs. Q1: HR 2.85 (1.75–4.63) No significant results | Sex, age, nodal stage, body mass index, physical activity level, baseline, performance status, or treatment group | Low |
| Mc Cullough, 2013 [30] | FFQ | After diagnosis | Red and processed meat | ACM CSM | No significant results | Age, sex, tumor stage, pre-diagnostic diet, race/ethnicity, education, smoking, history of hypertension, physical activity; alcohol intake; nonsteroidal anti-inflammatory drug use; multivitamin use; postmenopausal hormone use; family history of CRC; type of treatment; history of high cholesterol, stroke, or lung disease; total folate; dietary folate; total calcium; dietary calcium; and fruit, vegetables, whole grains, and fish/poultry consumption | Moderate |
| Fung, 2014 [31] | FFQ | at least 6 months after diagnosis | AHEI-2010 components MMDS DASH WD PD | ACM CSM | Sugar-sweetened beverages + juices for each additional serving: HR 1.11 (1.01–1.23) AHEI Q5 vs. Q1: HR 0.71 (0.52–0.98) Nuts for each serving/day: HR 0.69 (0.49–0.97) | Age, physical activity, BMI, weight change, cancer grade, chemotherapy, smoking status, energy intake, colon or rectal cancer, stage of disease, date of colorectal cancer diagnosis | Low |
| Yang, 2014 [32] | FFQ | After diagnosis | Milk intake | ACM | Milk Q4 vs. Q1: RR 0.72 (0.55–0.94) | Age at diagnosis, sex, tumor stage at diagnosis | Moderate |
| Van Blarigan, 2018 [33] | FFQ | During and 6 months after ChT | Dark fish Marine ω-3 PUFA | OS DFS RFS | Dark fish ≥1/week vs. never: HR 0.68 (0.48–0.96) Dark fish ≥1/week vs. never: HR 0.65 (0.48–0.87) Marine ω-3 PUFA Q4 vs. Q1: HR 0.72 (0.54–0.90) Dark fish ≥1/week vs. never: HR 0.61 (0.46–0.86) | Sex, energy intake, age, stage, number of positive lymph nodes, treatment arm, BMI, physical activity, smoking, and aspirin use | Low |
| Ratjen, 2017 [15] | SFFQ | Median of 6 years after diagnosis. | MMD Healthy Nordic diet | ACM | MMDS Q4 vs. Q1: HR 0.48 (0.32–0.74) No significant results | Sex, age, BMI, physical activity, survival time from CRC diagnosis, tumor location, occurrence of metastases, occurrence of other cancers, chemotherapy, smoking status and total energy intake | Moderate |
| Tamakoshi, 2017 [34] | Interview | After diagnosis | Green leafy vegetables Meat | ACM | Green leafy vegetables never consumers vs. everyday consumers: HR 1.87 (1.22–2.88) No significant results | Sex, institutions and adjusted for age and entry year | Moderate |
| Fadelu, 2018 [13] | FFQ | After diagnosis | Total nuts Tree nuts Peanuts | OS DFS RFS | Total nuts 0 vs. ≥2 servings/week: HR 0.43 (0.25–0.74) Tree nuts 0 vs. ≥2 servings/week: HR 0.47 (0.27–0.82) Total nuts 0 vs. ≥2 servings/week: HR 0.58 (0.37–0.92) Tree nuts 0 vs. ≥2 servings/week: HR 0.54 (0.34–0.85) No significant results | Calorie intake, age, sex, depth of invasion through bowel wall, number of positive lymph nodes, baseline performance status, treatment group, body mass index, physical activity, aspirin use, and glycemic load | Moderate |
| Song, 2018 [35] | FFQ | Between 6 months and 4 years after diagnosis | Total fiber Cereal fiber Vegetable fiber Fruit fiber Whole grain | ACM CSM | Total fiber 5 g/day increment: HR 0.86 (0.65–0.93) Cereal fiber 5 g/day increment: HR 0.78 (0.68–0.90) Vegetables fiber 5 g/day increment: HR 0.83 (0.72–0.96) Total fiber 5 g/day increment: HR 0.78 (0.65–0.93) Cereal fiber 5 g/day increment: HR 0.67 (0.50–0.90) Whole grain 20 g/day increment: HR 0.72 (0.59–0.88) | Age at diagnosis, sex, year of diagnosis, tumor stage, anatomic subsite, and differentiation, BMI, physical activity, alcohol consumption, aspirin use, vitamin D, total fat, folate, calcium, and glycemic load, pre-diagnostic diet | Low |
| Study ID | Method of Dietary Assessment | Time of Dietary Assessment | Dietary Factor or Dietary Patterns Evaluated | Outcomes | HR or RR (95% CI) | Adjustment Covariates | QUIPS Score |
|---|---|---|---|---|---|---|---|
| Chan, 2006 [36] | SFFQ | After diagnosis | Red meat Grains Vegetables, Fruit Milk Tomatoes Tomato sauce Fish | Cancer progression | Tomato sauce Q4 vs. Q1: HR 0.56 (0.38–0.82) | Total energy, age, clinical factors, and pre-diagnostic diet | Moderate |
| Richman, 2010 [14] | FFQ | After diagnosis | Red processed and unprocessed meat Fish Poultry Eggs | Cancer progression or recurrence | Eggs Q4 vs. Q1: HR 2.02 (1.10, 3.72) Poultry with skin Q3 vs. Q1: HR 2.26 (1.36–3.76) | Age at diagnosis, energy intake (kcal/d), and time from diagnosis to questionnaire Other food groups, clinical T stage at diagnosis, smoking, race, education, income, marital status, vigorous activity, and frequency of fried food intake | Moderate |
| Petterson, 2012 [37] | FFQ | After diagnosis | Skim and low-fat milk Whole milk Total milk low-fat Dairy low-fat products Dairy full-fat products Total dairy products | CSM ACM | Whole milk Q5 vs. Q1: HR 2.15 (1.28–3.60) No significant results | Age at diagnosis, total caloric intake, smoking status, BMI, exercise, alpha-linolenic acid intake, TNM stage, Gleason score | Low |
| Richman, 2012 [38] | SFFQ | After diagnosis | Total vegetables Cruciferous vegetables Tomato sauce Legumes Other vegetable sub-groups Total fruit Subgroups of fruit | Cancer progression | Cruciferous vegetables Q4 vs. Q1: HR 0.41 (0.22–0.76) | Age, energy intake, prognostic risk at diagnosis, primary treatment, BMI, walking metabolic equivalent task, Gleason score, quartile ranks of eggs, poultry with skin, fruit, and vegetables other than the exposure of interest | Moderate |
| Richman, 2013 [39] | FFQ | After diagnosis | Saturated, monounsaturated, polyunsaturated, trans, animal, and vegetable fat | ACM CSM | Vegetable fats Q5 vs. Q1: HR 0.74 (0.61- 0.88) Saturated fats Q5 vs. Q1: HR 1.30 (1.05–1.60) Trans fats Q5 vs. Q1: HR 1.25 (1.05–1.49) Vegetable fats Q5 vs. Q1: HR 0.71 (0.51–0.98) | For CSM: age, energy intake, clinical-stage, BMI; vigorous activity, smoking, calcium, alcohol, protein, the other fats, pre-diagnostic intake of the exposure of interest For ACM: above covariates + parental history of myocardial infarction before age 60, high blood pressure at diagnosis, diabetes mellitus at diagnosis, elevated cholesterol at diagnosis, and presence of co-morbidities | Low |
| Song, 2013 [40] | FFQ | After diagnosis | Different types of dairy products | Cancer progression | Whole milk >2.5 servings/day vs. ≤0.5 servings/day: HR 2.17 (1.34–3.51) | Age, baseline, smoking, vigorous exercise, alcohol intake, race, diabetes status, red meat consumption, and assignment in the original trial | Moderate |
| Kenfield, 2014 [41] | FFQ MDS | After diagnosis | Mediterranean diet | ACM | MDS high vs. low: HR 0.78 (0.67–0.90) | Age, period time, energy, BMI, vigorous physical activity, smoking status, prostate-specific antigen screening history | Low |
| Van Blarigan, 2015 [42] | FFQ | 5 years after diagnosis | Saturated fat Monounsaturated, Polyunsaturated, Trans fats Animal fat Vegetable fat Carbohydrates | ACM CSM | 5% more of their daily calories from saturated fat and 5% less of their daily calories from carbohydrate: HR 1.81 (1.20–2.74) 10% more of their daily calories from vegetable fats and 10% less of their daily calories from carbohydrates: HR 0.67 (0.47–0.96) 5% more of their daily calories from saturated fat and 5% less of their daily calories from carbohydrate: HR 2.78 (1.01–7.64) | Age at diagnosis, caloric intake, modified D’Amico risk category, primary treatment, BMI, smoking, and intake of alcohol, protein, and other fats | Moderate |
© 2020 by the authors. Licensee MDPI, Basel, Switzerland. This article is an open access article distributed under the terms and conditions of the Creative Commons Attribution (CC BY) license (http://creativecommons.org/licenses/by/4.0/).
Share and Cite
Rinninella, E.; Mele, M.C.; Cintoni, M.; Raoul, P.; Ianiro, G.; Salerno, L.; Pozzo, C.; Bria, E.; Muscaritoli, M.; Molfino, A.; et al. The Facts about Food after Cancer Diagnosis: A Systematic Review of Prospective Cohort Studies. Nutrients 2020, 12, 2345. https://doi.org/10.3390/nu12082345
Rinninella E, Mele MC, Cintoni M, Raoul P, Ianiro G, Salerno L, Pozzo C, Bria E, Muscaritoli M, Molfino A, et al. The Facts about Food after Cancer Diagnosis: A Systematic Review of Prospective Cohort Studies. Nutrients. 2020; 12(8):2345. https://doi.org/10.3390/nu12082345
Chicago/Turabian StyleRinninella, Emanuele, Maria Cristina Mele, Marco Cintoni, Pauline Raoul, Gianluca Ianiro, Lucia Salerno, Carmelo Pozzo, Emilio Bria, Maurizio Muscaritoli, Alessio Molfino, and et al. 2020. "The Facts about Food after Cancer Diagnosis: A Systematic Review of Prospective Cohort Studies" Nutrients 12, no. 8: 2345. https://doi.org/10.3390/nu12082345
APA StyleRinninella, E., Mele, M. C., Cintoni, M., Raoul, P., Ianiro, G., Salerno, L., Pozzo, C., Bria, E., Muscaritoli, M., Molfino, A., & Gasbarrini, A. (2020). The Facts about Food after Cancer Diagnosis: A Systematic Review of Prospective Cohort Studies. Nutrients, 12(8), 2345. https://doi.org/10.3390/nu12082345