Is Caloric Restriction Associated with Better Healthy Aging Outcomes? A Systematic Review and Meta-Analysis of Randomized Controlled Trials

 ,
,  ,
,
Abstract
1. Introduction
2. Methods
2.1. Eligibility Criteria
- Population: studies on people aged ≥18 years;
- Intervention: CR with a reduction of daily energy caloric intake equivalent to 20–30% of energy requirements, expressed as kcal/day;
- Controls: any type of control population not exposed to CR;
- Study design: RCT;
- Setting: any type of setting;
- Period: papers published before 31 March 2019;
- Language: English.
2.2. Search Strategy
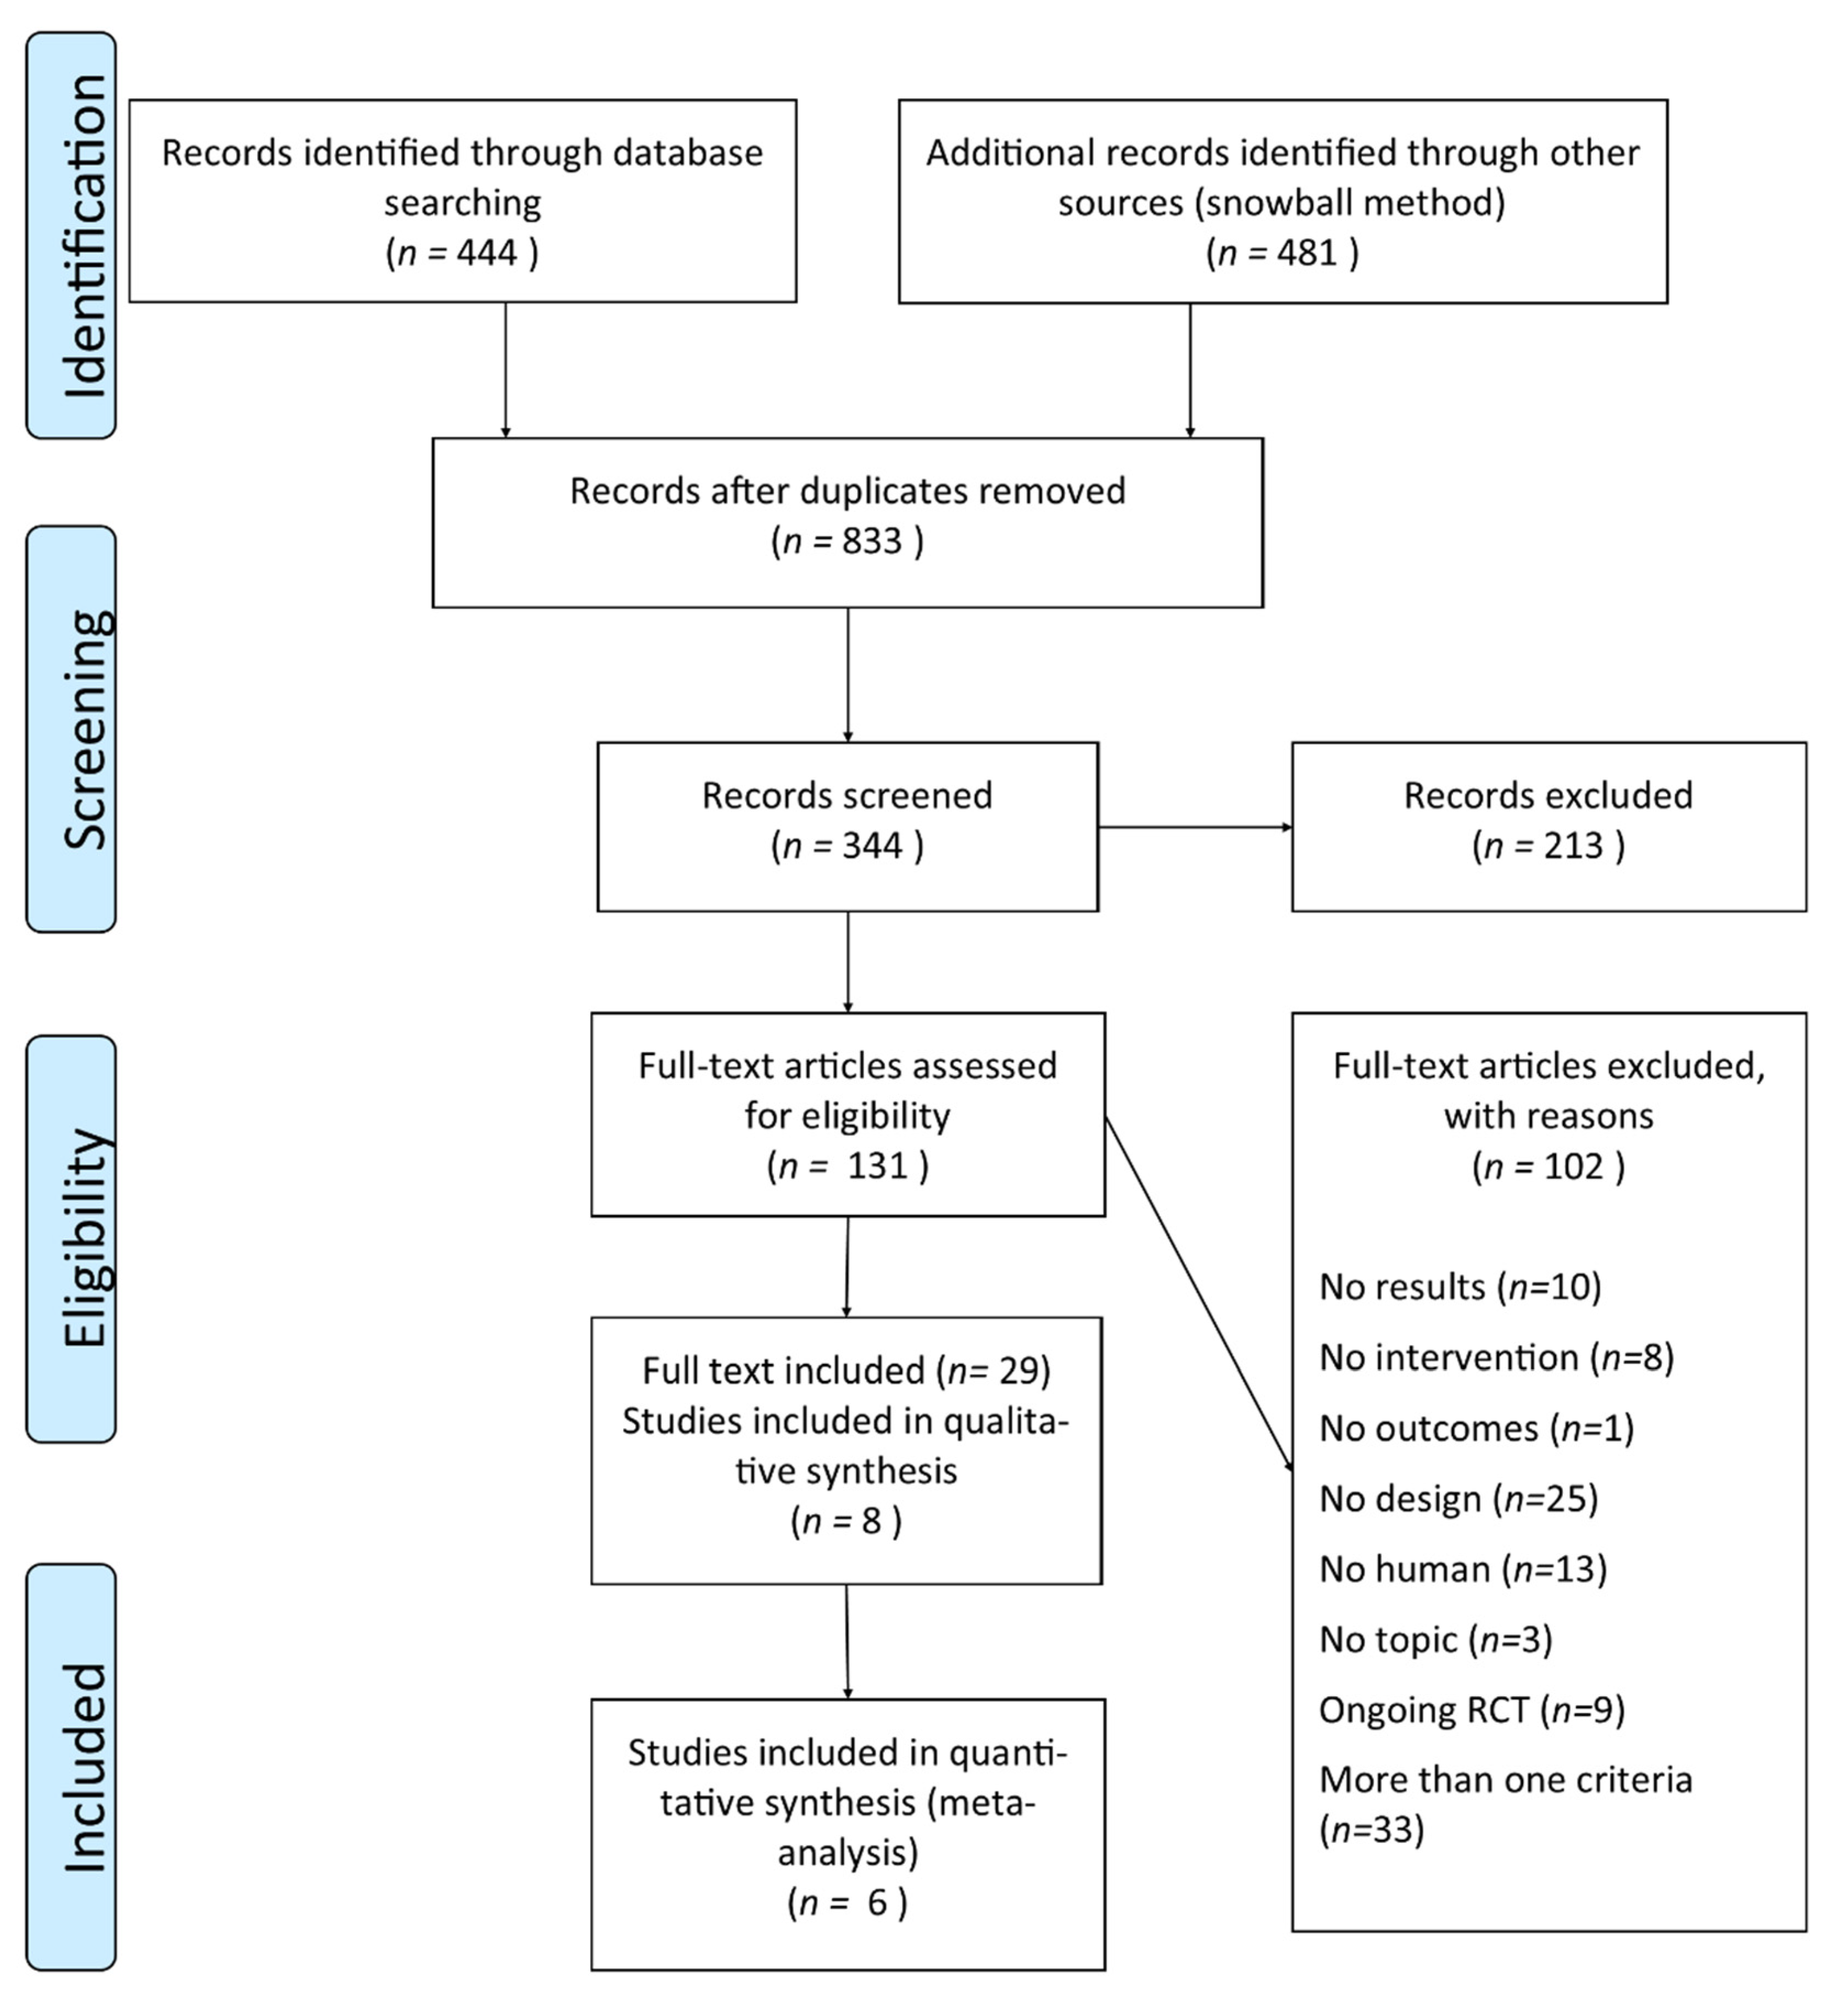
2.3. Study Selection and Data Extraction
2.4. Risk of Bias in Individual Studies
2.5. Outcomes
2.6. Summary Measures and Synthesis of Results
3. Results
3.1. Study Characteristics
3.2. Risk of Bias within Studies
3.3. Findings
3.3.1. Anthropometric Measures
3.3.2. Cardiovascular Risk Factors
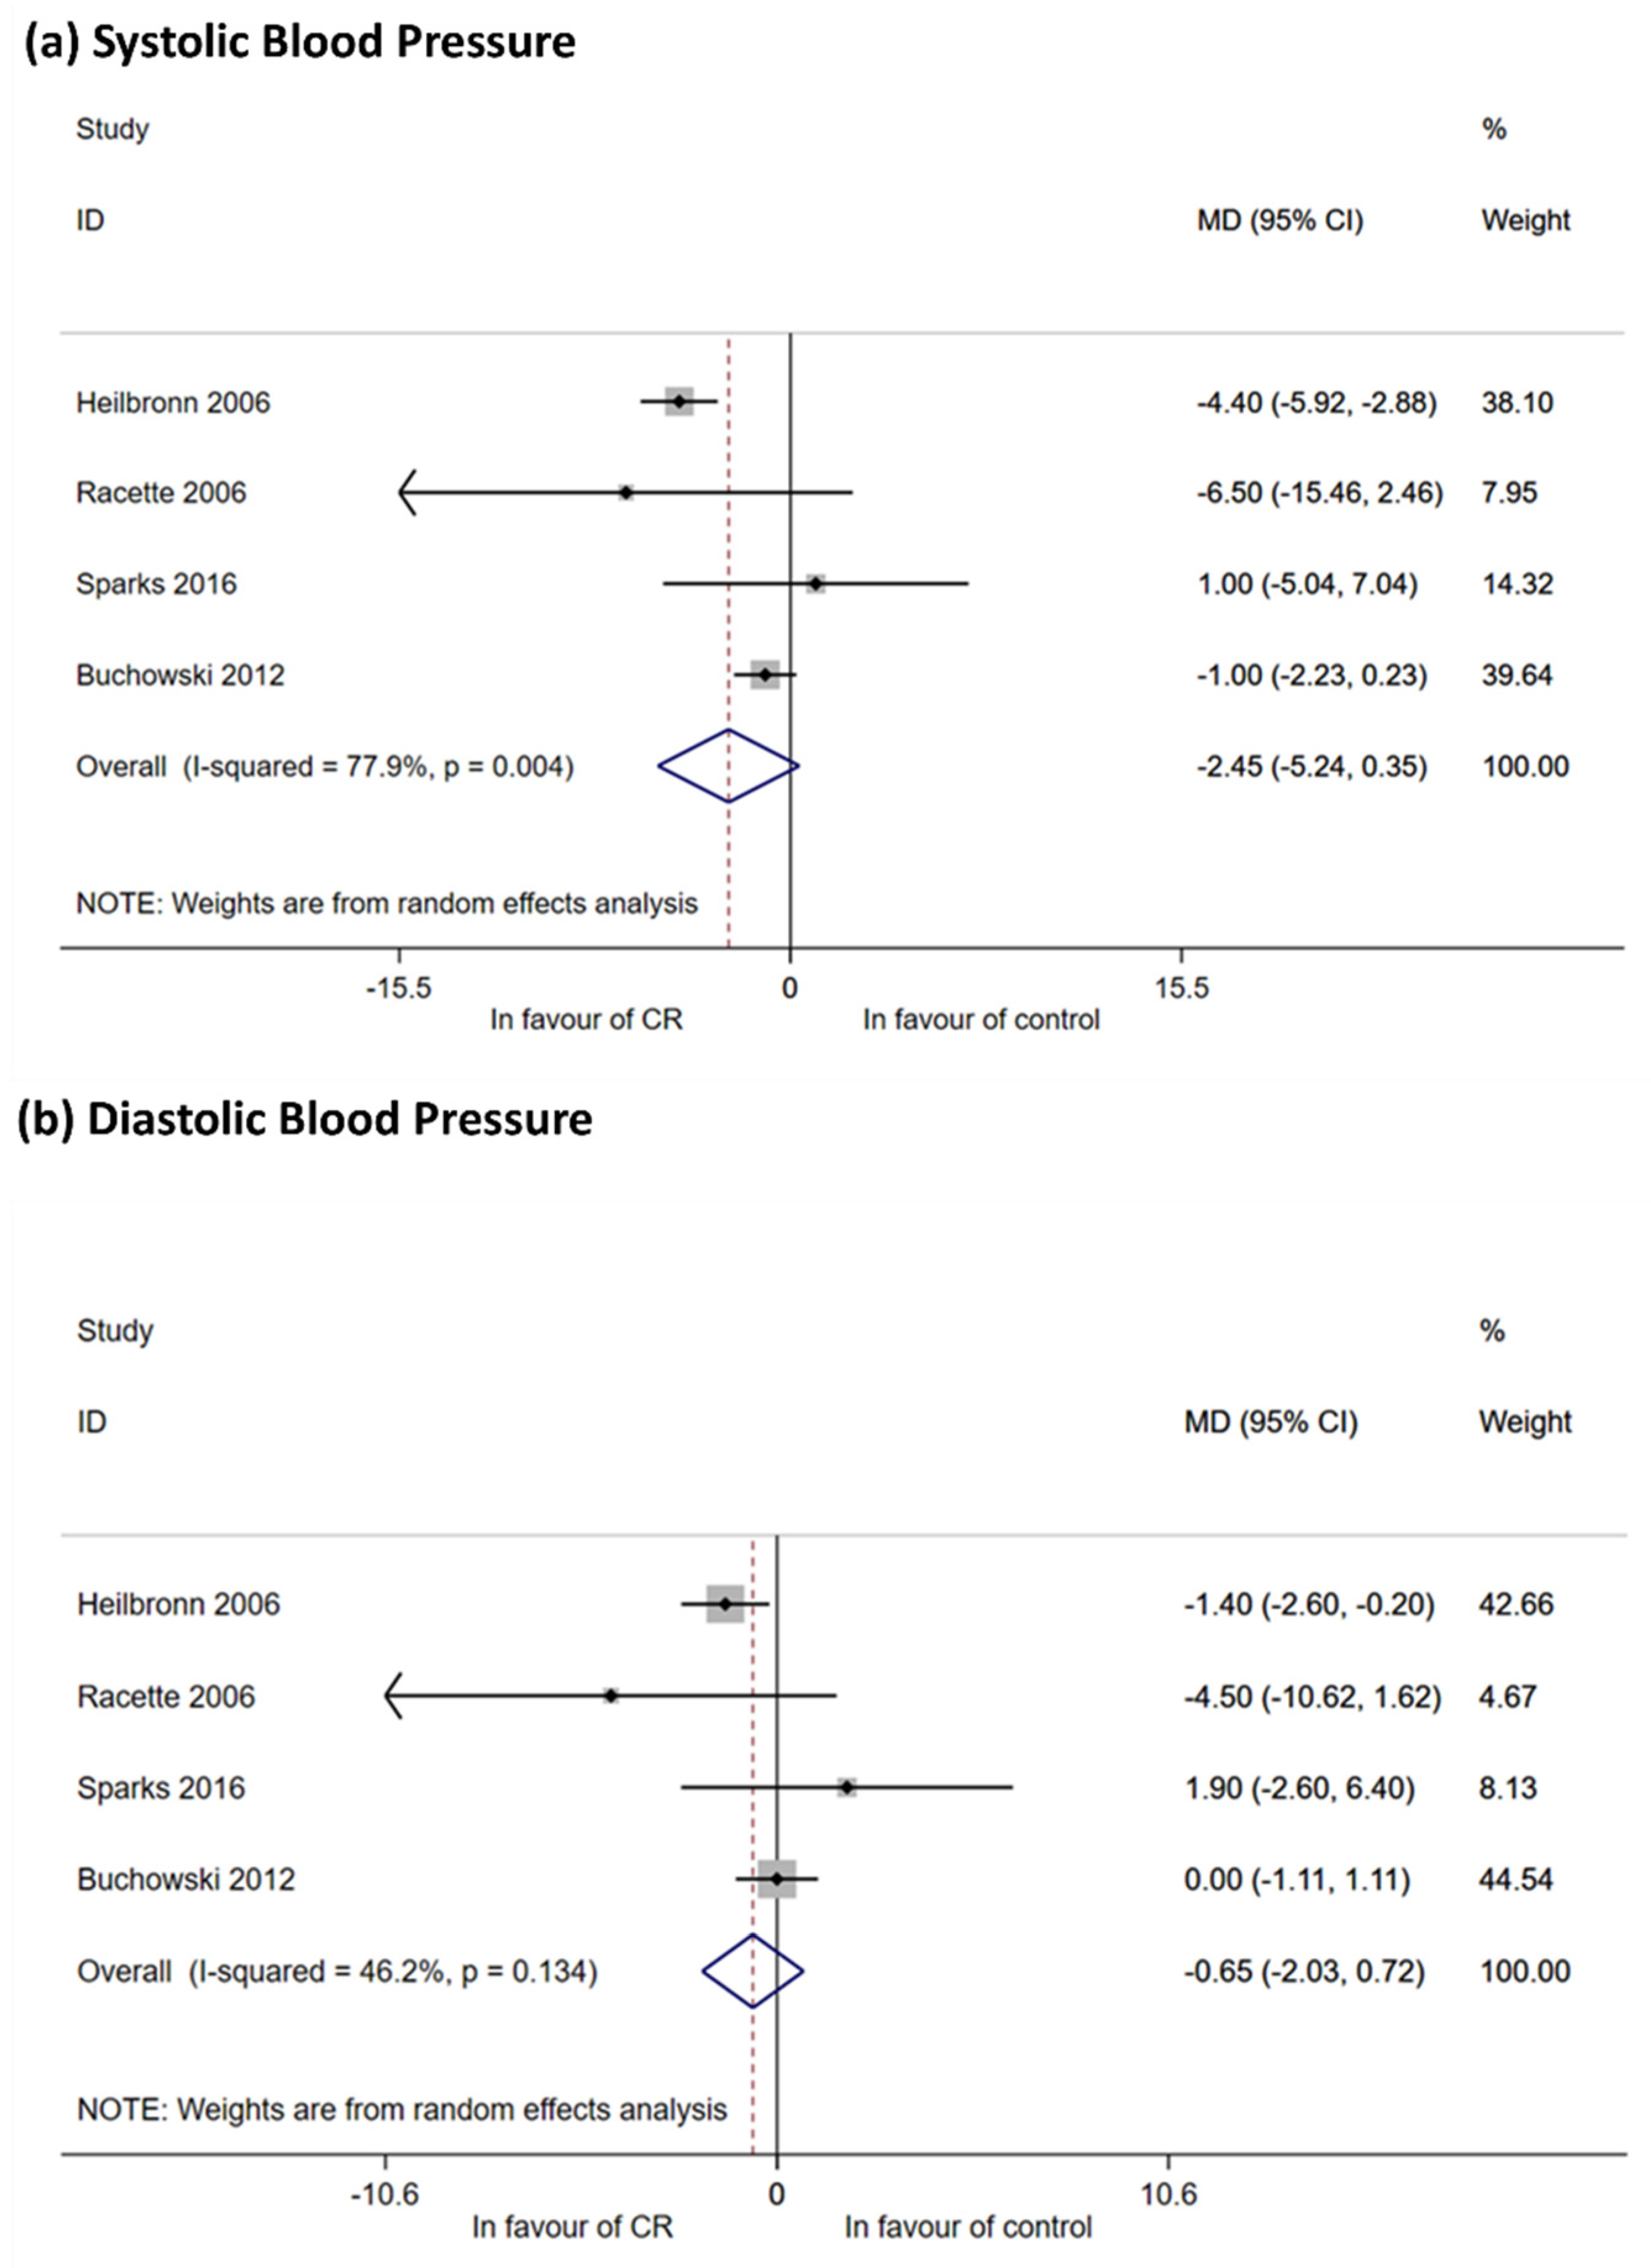
Arterial Blood Pressure
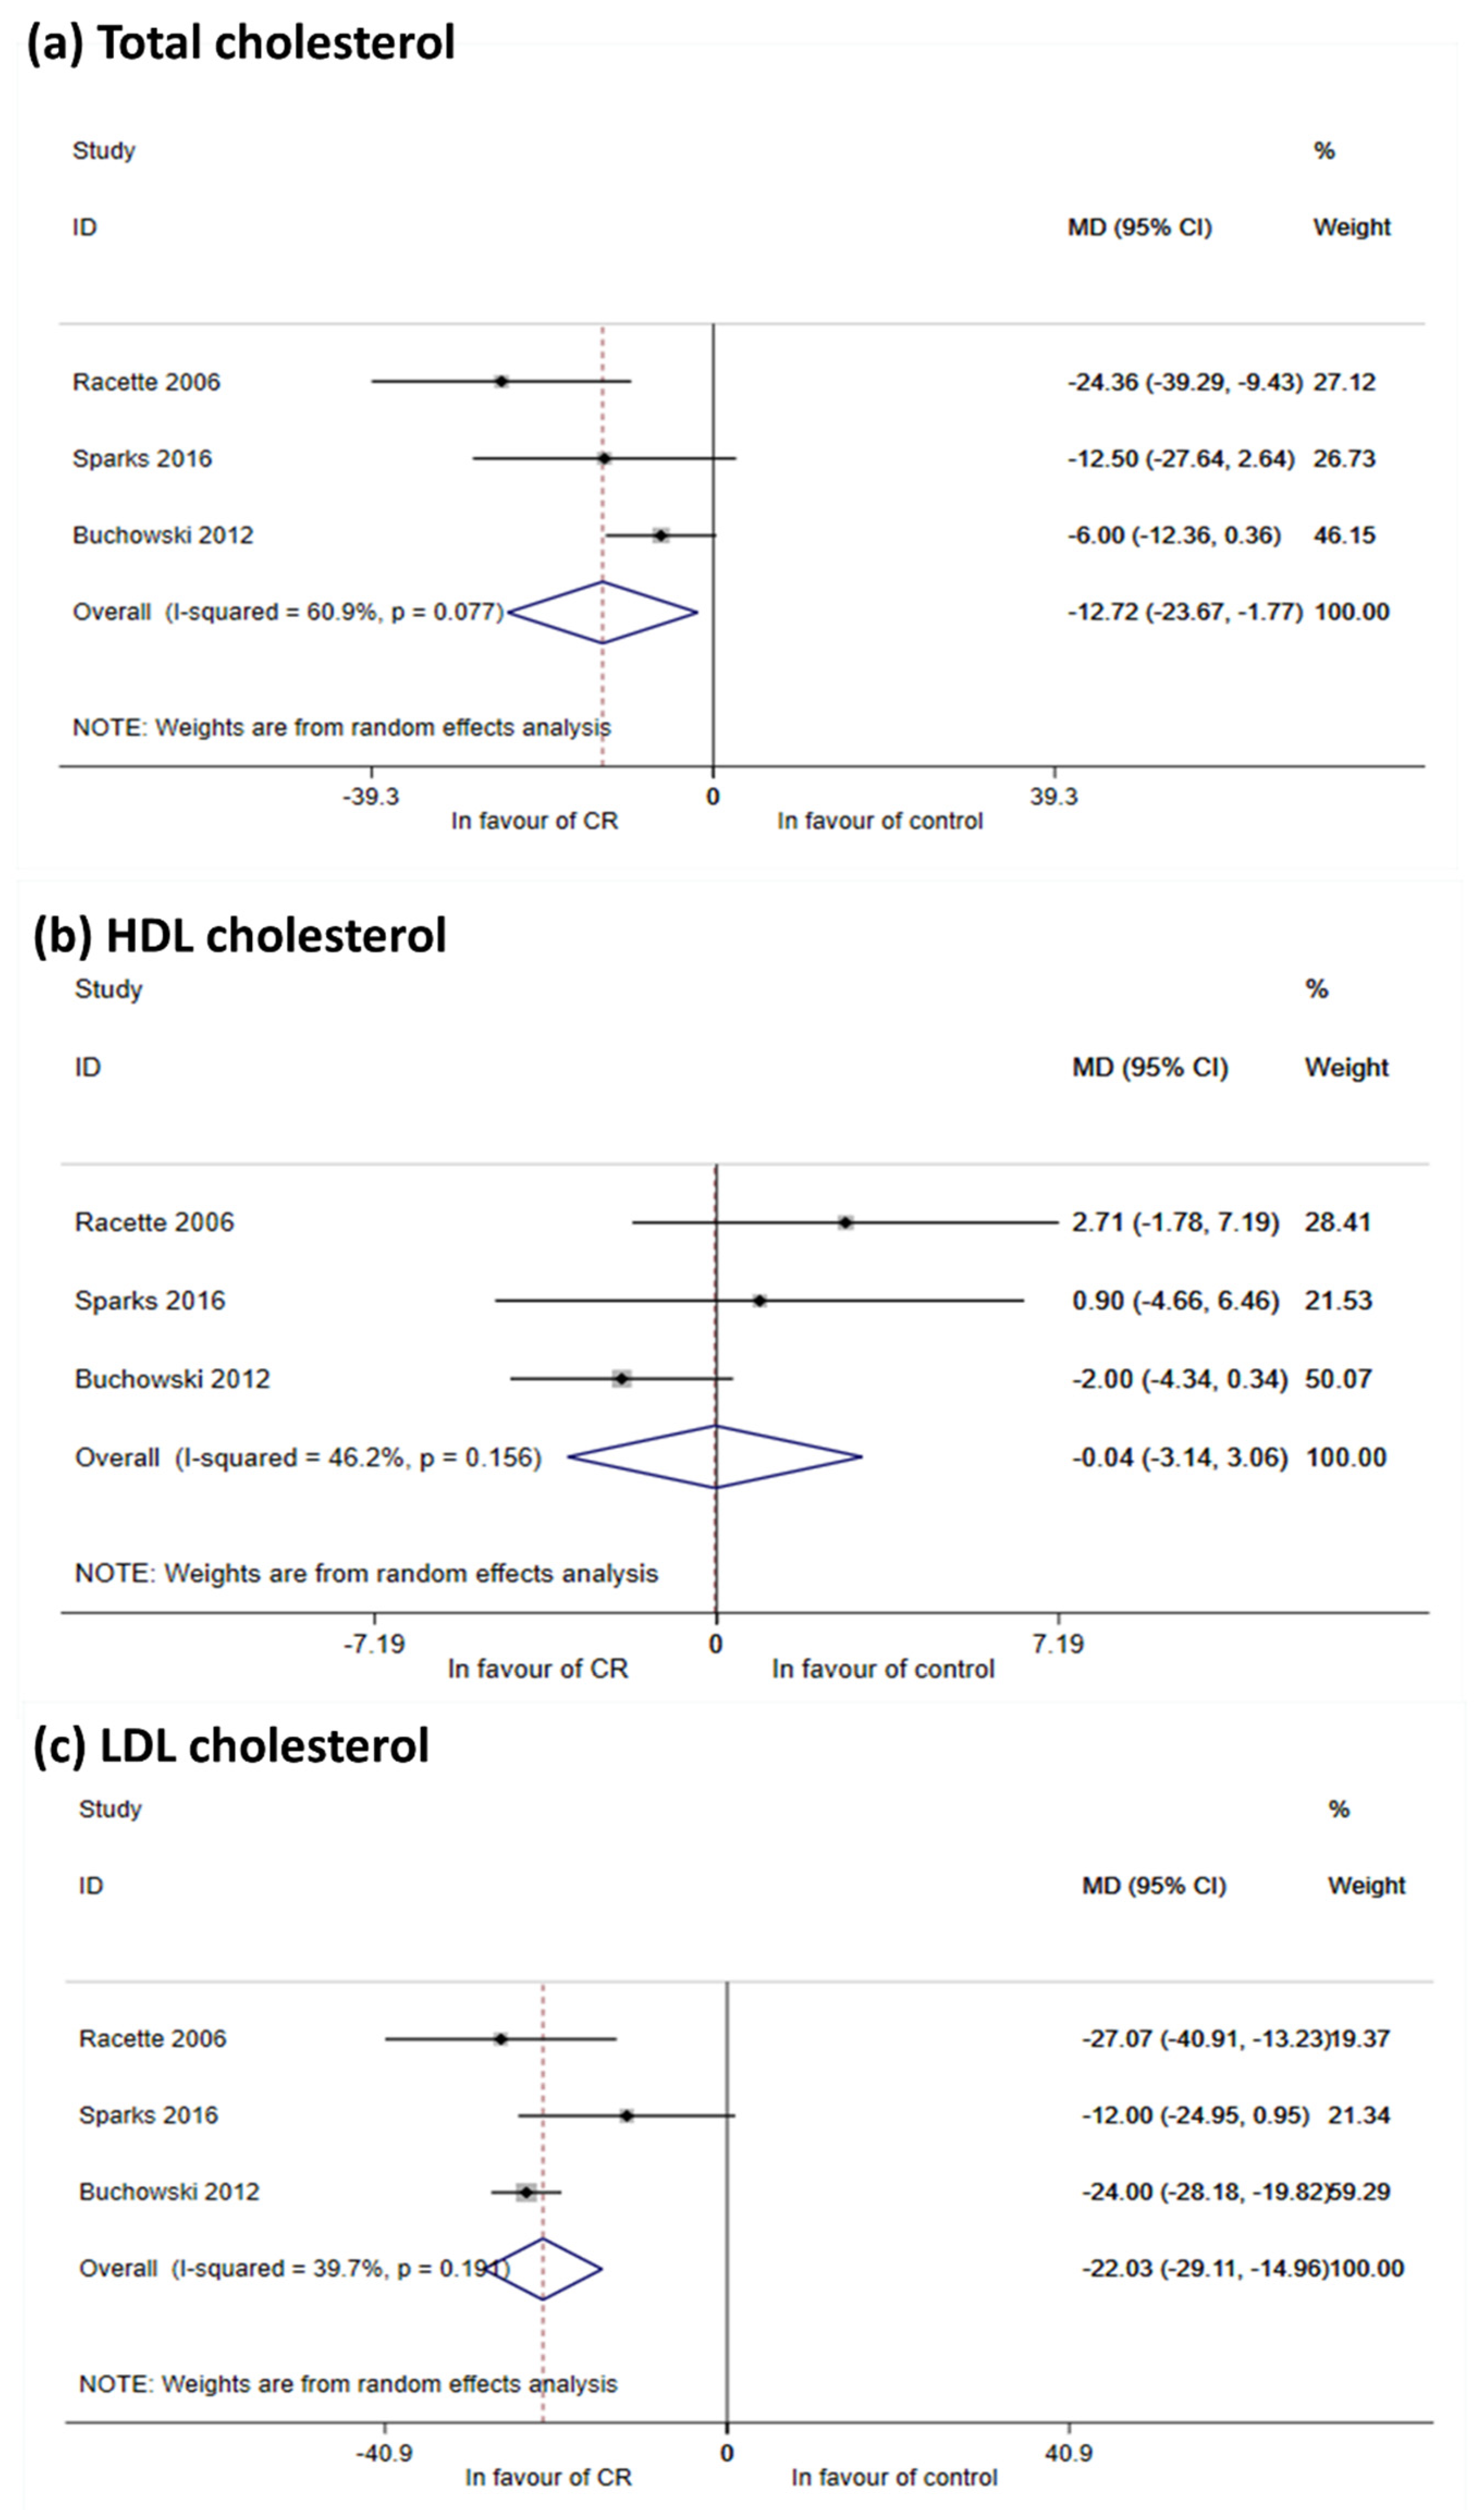
Lipids
3.3.3. Hormonal and Metabolic Homeostasis
Hormone Profiles
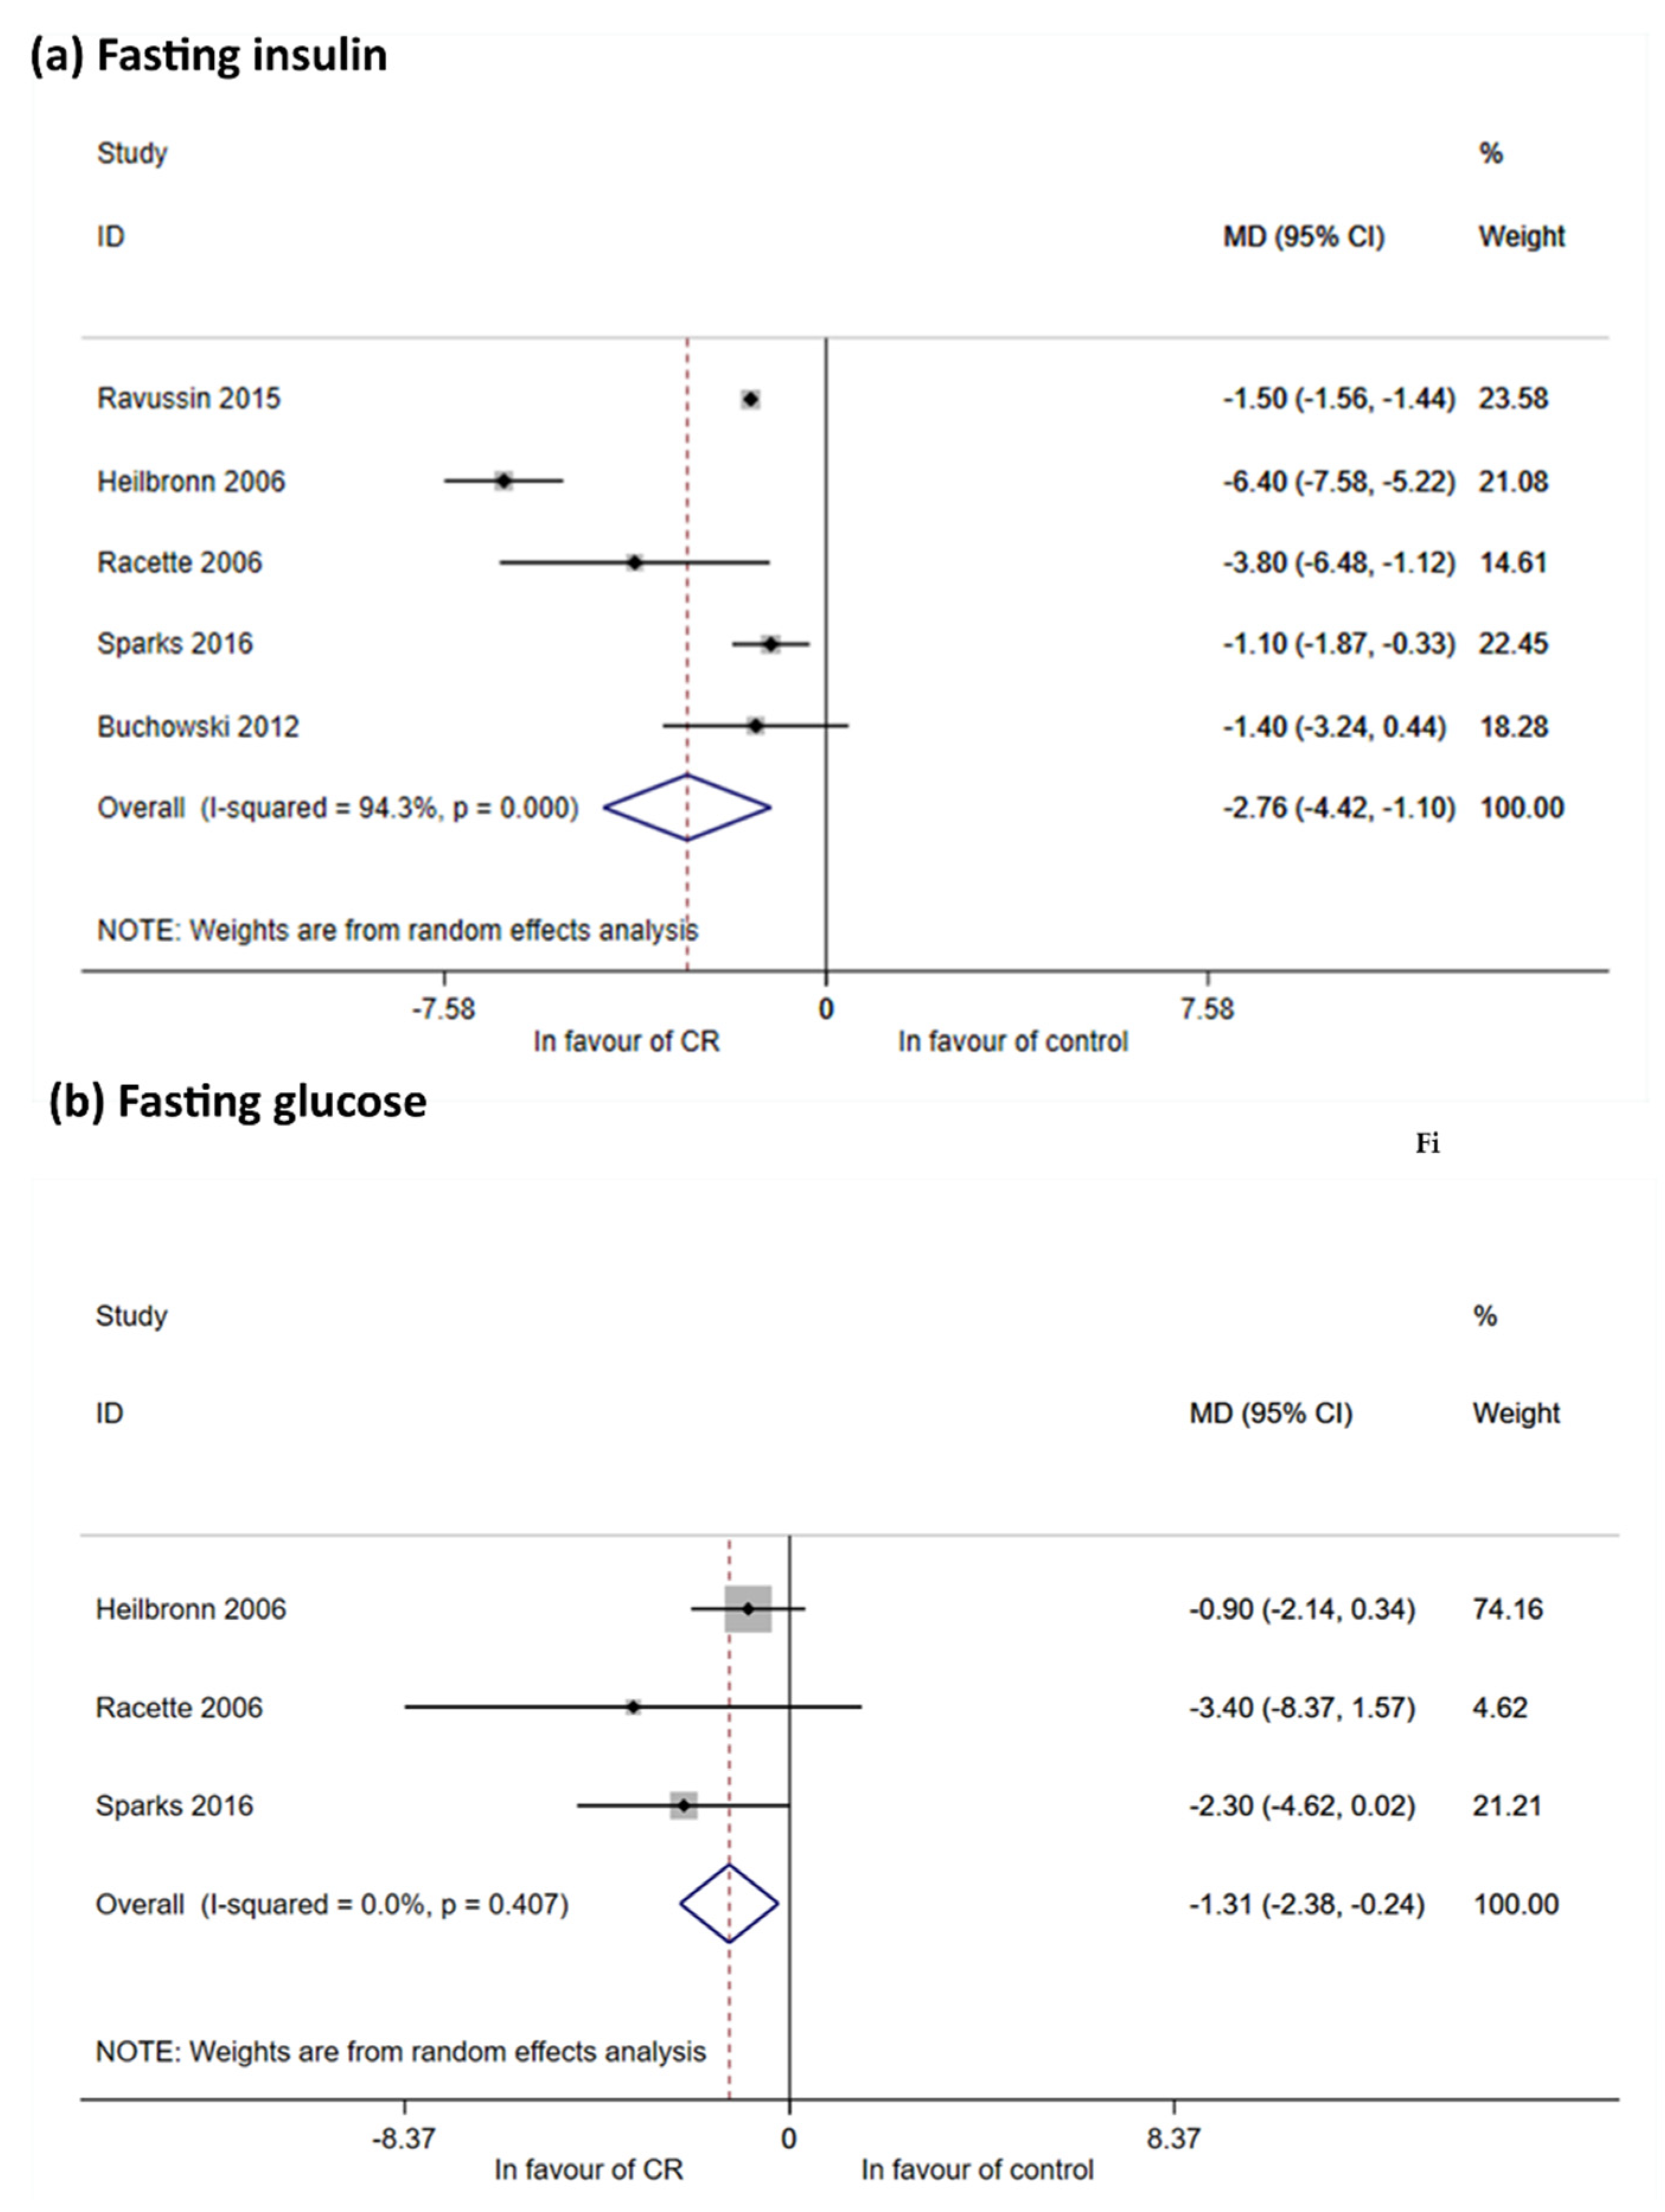
Glucose Metabolism
3.3.4. Bone Health and Osteoporosis
3.3.5. Inflammation and Oxidative Stress
3.3.6. Secondary Outcomes: Mood Disorders, Well-Being and Quality of Life
3.4. Bias Across Studies
4. Discussion
5. Conclusions
Supplementary Materials
Author Contributions
Funding
Conflicts of Interest
References
- Leong, I. Sustained caloric restriction in health. Nat. Rev. Endocrinol. 2018, 14, 322. [Google Scholar] [CrossRef] [PubMed]
- Masoro, E.J. Caloric restriction and aging: An update. Exp. Gerontol. 2000, 35, 299–305. [Google Scholar] [CrossRef]
- Roth, G.S.; Lane, M.A.; Ingram, D.K.; Mattison, J.A.; Elahi, D.; Tobin, J.D.; Muller, D.; Metter, E.J. Biomarkers of caloric restriction may predict longevity in humans. Science 2002, 297, 811. [Google Scholar] [CrossRef] [PubMed]
- Bales, C.W.; Kraus, W.E. Caloric restriction: Implications for human cardiometabolic health. J. Cardiopulm. Rehabil. Prev. 2013, 33, 201–208. [Google Scholar] [CrossRef]
- Golbidi, S.; Daiber, A.; Korac, B.; Li, H.; Essop, M.F.; Laher, I. Health Benefits of Fasting and Caloric Restriction. Curr. Diab. Rep. 2017, 17, 123. [Google Scholar] [CrossRef]
- Cava, E.; Fontana, L. Will calorie restriction work in humans? Aging (Albany N. Y.) 2013, 5, 507–514. [Google Scholar] [CrossRef]
- Weindruch, R.; Sohal, R.S. Caloric Intake and Aging. N. Engl. J. Med. 1997, 337, 986–994. [Google Scholar] [CrossRef]
- Mattison, J.A.; Colman, R.J.; Beasley, T.M.; Allison, D.B.; Kemnitz, J.W.; Roth, G.S.; Ingram, D.K.; Weindruch, R.; De Cabo, R.; Anderson, R.M. Caloric restriction improves health and survival of rhesus monkeys. Nat. Commun. 2017, 8, 1–12. [Google Scholar] [CrossRef]
- Li, N.; Guenancia, C.; Rigal, E.; Hachet, O.; Chollet, P.; Desmoulins, L.; Leloup, C.; Rochette, L.; Vergely, C. Short-term moderate diet restriction in adulthood can reverse oxidative, cardiovascular and metabolic alterations induced by postnatal overfeeding in mice. Sci. Rep. 2016, 6, 30817. [Google Scholar] [CrossRef]
- Yzydorczyk, C.; Li, N.; Rigal, E.; Chehade, H.; Mosig, D.; Armengaud, J.B.; Rolle, T.; Krishnasamy, A.; Orozco, E.; Siddeek, B.; et al. Calorie Restriction in Adulthood Reduces Hepatic Disorders Induced by Transient Postnatal Overfeeding in Mice. Nutrients 2019, 11, 2796. [Google Scholar] [CrossRef]
- Weiss, E.P.; Fontana, L. Caloric restriction: Powerful protection for the aging heart and vasculature. Am. J. Physiol. Heart Circ. Physiol. 2011, 301, H1205–H1219. [Google Scholar] [CrossRef]
- Al-Regaiey, K.A. The effects of calorie restriction on aging: A brief review. Eur. Rev. Med. Pharmacol. Sci. 2016, 20, 2468–2473. [Google Scholar] [PubMed]
- Yang, F.; Chu, X.; Yin, M.; Liu, X.; Yuan, H.; Niu, Y.; Fu, L. MTOR and autophagy in normal brain aging and caloric restriction ameliorating age-related cognition deficits. Behav. Brain Res. 2014, 264, 82–90. [Google Scholar] [CrossRef] [PubMed]
- Pani, G. Neuroprotective effects of dietary restriction: Evidence and mechanisms. Semin. Cell Dev. Biol. 2015, 40, 106–114. [Google Scholar] [CrossRef] [PubMed]
- Buchowski, M.S.; Hongu, N.; Acra, S.; Wang, L.; Warolin, J.; Roberts, L.J. Effect of Modest Caloric Restriction on Oxidative Stress in Women, a Randomized Trial. PLoS ONE 2012, 7, e047079. [Google Scholar] [CrossRef] [PubMed]
- Haas, M.C.; Bodner, E.V.; Brown, C.J.; Bryan, D.; Buys, D.R.; Keita, A.D.; Flagg, L.A.; Goss, A.; Gower, B.; Hovater, M.; et al. Calorie restriction in overweight seniors: Response of older adults to a dieting study: The CROSSROADS randomized controlled clinical trial. J. Nutr. Gerontol. Geriatr. 2014, 33, 376–400. [Google Scholar] [CrossRef]
- Larson-Meyer, D.E.; Heilbronn, L.K.; Redman, L.M.; Newcomer, B.R.; Frisard, M.I.; Anton, S.; Smith, S.R.; Alfonso, A.; Ravussin, E. Effect of calorie restriction with or without exercise on insulin sensitivity, beta-cell function, fat cell size, and ectopic lipid in overweight subjects. Diabetes Care 2006, 29, 1337–1344. [Google Scholar] [CrossRef]
- Heilbronn, L.K.; de Jonge, L.; Frisard, M.I.; DeLany, J.P.; Larson-Meyer, D.E.; Rood, J.; Nguyen, T.; Martin, C.K.; Volaufova, J.; Most, M.M.; et al. Effect of 6-Month Calorie Restriction on Biomarkers of Longevity, Metabolic Adaptation, and Oxidative Stress in Overweight Individuals. JAMA 2006, 295, 1539. [Google Scholar] [CrossRef]
- Cheng, J.; Pan, T. Calorie controlled diet for chronic asthma. Cochrane Database Syst. Rev. 2003, 2, CD004674. [Google Scholar] [CrossRef]
- Smart, N.A.; Marshall, B.J.; Daley, M.; Boulos, E.; Windus, J.; Baker, N.; Kwok, N. Low-fat diets for acquired hypercholesterolaemia. Cochrane Database Syst. Rev. 2011, 2, CD007957. [Google Scholar] [CrossRef]
- Veronese, N.; Reginster, J.-Y. The effects of calorie restriction, intermittent fasting and vegetarian diets on bone health. Aging Clin. Exp. Res. 2019, 31, 753–758. [Google Scholar] [CrossRef]
- Soltani, S.; Shirani, F.; Chitsazi, M.J.; Salehi-Abargouei, A. The effect of dietary approaches to stop hypertension (DASH) diet on weight and body composition in adults: A systematic review and meta-analysis of randomized controlled clinical trials. Obes. Rev. 2016, 17, 442–454. [Google Scholar] [CrossRef]
- Rynders, C.A.; Thomas, E.A.; Zaman, A.; Pan, Z.; Catenacci, V.A.; Melanson, E.L. Effectiveness of Intermittent Fasting and Time-Restricted Feeding Compared to Continuous Energy Restriction for Weight Loss. Nutrients 2019, 11, 2442. [Google Scholar] [CrossRef] [PubMed]
- Perman, M.I.; Ciapponi, A.; Franco, J.V.; Loudet, C.; Crivelli, A.; Garrote, V.; Perman, G. Prescribed hypocaloric nutrition support for critically-ill adults. Cochrane Database Syst. Rev. 2018, 6, CD007867. [Google Scholar] [CrossRef]
- Cherif, A.; Roelands, B.; Meeusen, R.; Chamari, K. Effects of Intermittent Fasting, Caloric Restriction, and Ramadan Intermittent Fasting on Cognitive Performance at Rest and During Exercise in Adults. Sport. Med. 2016, 46, 35–47. [Google Scholar] [CrossRef] [PubMed]
- Spindler, S.R. Rapid and reversible induction of the longevity, anticancer and genomic effects of caloric restriction. Mech. Ageing Dev. 2005, 126, 960–966. [Google Scholar] [CrossRef] [PubMed]
- Miller, C.T.; Fraser, S.F.; Levinger, I.; Straznicky, N.E.; Dixon, J.B.; Reynolds, J.; Selig, S.E. The Effects of Exercise Training in Addition to Energy Restriction on Functional Capacities and Body Composition in Obese Adults during Weight Loss: A Systematic Review. PLoS ONE 2013, 8, e81692. [Google Scholar] [CrossRef] [PubMed]
- Seyfried, B.N.; Kiebish, M.; Marsh, J.; Mukherjee, P. Targeting energy metabolism in brain cancer through calorie restriction and the ketogenic diet. J. Cancer Res. Ther. 2009, 5, 7. [Google Scholar] [CrossRef]
- Omodei, D.; Fontana, L. Calorie restriction and prevention of age-associated chronic disease. FEBS Lett. 2011, 585, 1537–1542. [Google Scholar] [CrossRef]
- Locher, J.L.; Goldsby, T.U.; Goss, A.M.; Kilgore, M.L.; Gower, B.; Ard, J.D. Calorie restriction in overweight older adults: Do benefits exceed potential risks? Exp. Gerontol. 2016, 86, 4–13. [Google Scholar] [CrossRef]
- Davies, H.S. Definition of Health. BMJ 1946, 2, 838. [Google Scholar] [CrossRef]
- Larson, J.S. The World Health Organization’s definition of health: Social versus spiritual health. Soc. Indic. Res. 1996, 38, 181–192. [Google Scholar] [CrossRef]
- Shamseer, L.; Moher, D.; Clarke, M.; Ghersi, D.; Liberati, A.; Petticrew, M.; Shekelle, P.; Stewart, L.A. Preferred reporting items for systematic review and meta-analysis protocols (PRISMA-P) 2015: Elaboration and explanation. BMJ 2015, 349, g7647. [Google Scholar] [CrossRef]
- Knobloch, K.; Yoon, U.; Vogt, P.M. Preferred reporting items for systematic reviews and meta-analyses (PRISMA) statement and publication bias. J. Cranio Maxillofac. Surg. 2011, 39, 91–92. [Google Scholar] [CrossRef]
- Moher, D.; Shamseer, L.; Clarke, M.; Ghersi, D.; Liberati, A.; Petticrew, M.; Shekelle, P.; Stewart, L.A.; Estarli, M.; Barrera, E.S.A.; et al. Preferred reporting items for systematic review and meta-analysis protocols (PRISMA-P) 2015 statement. Rev. Esp. Nutr. Hum. Diet. 2016, 20, 148–160. [Google Scholar] [CrossRef] [PubMed]
- Beard, J.R.; Officer, A.; de Carvalho, I.A.; Sadana, R.; Pot, A.M.; Michel, J.-P.; Lloyd-Sherlock, P.; Epping-Jordan, J.; Peeters, G.M.E.E.G.; Mahanani, W.R.; et al. The World report on ageing and health: A policy framework for healthy ageing. Lancet (Lond. Engl.) 2015, 6736, 1–10. [Google Scholar] [CrossRef]
- Depp, C.A.; Jeste, D.V. Definitions and predictors of successful aging: A comprehensive review of larger quantitative studies. Am. J. Geriatr. Psychiatry 2006, 14, 6–20. [Google Scholar] [CrossRef]
- Wohlin, C. Guidelines for Snowballing in Systematic Literature Studies and a Replication in Software Engineering. In Proceedings of the 18th International Conference on Evaluation and Assessment in Software Engineering―EASE ’14; ACM Press: New York, NY, USA, 2014; pp. 1–10. [Google Scholar]
- OECD. Guidelines on Measuring Subjective Well-being; OECD Publishing: Paris, France, 2013. [Google Scholar]
- Scollon, C.N.; Kim-prieto, C.; Diener, E. Assessing Well-Being; Springer: New York, NY, USA, 2009; Volume 39, pp. 157–180. [Google Scholar]
- Huppert, F.A.; Marks, N.; Clark, A.; Siegrist, J.; Stutzer, A.; Vittersø, J.; Wahrendorf, M. Measuring Well-being Across Europe: Description of the ESS Well-being Module and Preliminary Findings. Soc. Indic. Res. 2009, 91, 301–315. [Google Scholar] [CrossRef]
- Neugarten, B.L.; Havighurst, R.J.; Tobin, S.S. The measurement of life satisfaction. J. Gerontol. 1961, 16, 134–143. [Google Scholar] [CrossRef]
- Barrett, A.J.; Murk, P.J. Life Satisfaction Index for the Third Age (LSITA): A Measurement of Successful Aging. In Proceedings of the 2006 Midwest Research-to-Practice Conference in Adult, Continuing, and Community Education; Isaac, E.P., Ed.; University of Missouri-St. Louis: St. Louis, MO, USA, 2006; pp. 7–12. [Google Scholar]
- Radloff, L.S. The CES-D Scale A Self-Report Depression Scale for Research in the General Population. Appl. Psychol. Meas. 1977, 1, 385–401. [Google Scholar] [CrossRef]
- Huppert, F.A.; So, T.T.C. Flourishing Across Europe: Application of a New Conceptual Framework for Defining Well-Being. Soc. Indic. Res. 2013, 110, 837–861. [Google Scholar] [CrossRef] [PubMed]
- Conradsson, M.; Rosendahl, E.; Littbrand, H.; Gustafson, Y.; Olofsson, B.; Lövheim, H. Usefulness of the Geriatric Depression Scale 15-item version among very old people with and without cognitive impairment. Aging Ment. Health 2013, 17, 638–645. [Google Scholar] [CrossRef]
- DerSimonian, R.; Laird, N. Meta-analysis in clinical trials. Control. Clin. Trials 1986, 7, 177–188. [Google Scholar] [CrossRef]
- The Cochrane Collaboration Cochrane Handbook for Systematic Reviews of Interventions, Version 5.1.0.
- Higgins, J.P.T.; Thompson, S.G.; Deeks, J.J.; Altman, D.G. Measuring inconsistency in meta-analyses. BMJ 2003, 327, 557–560. [Google Scholar] [CrossRef] [PubMed]
- Lachin, J.M. Properties of simple randomization in clinical trials. Control. Clin. Trials 1988, 9, 312–326. [Google Scholar] [CrossRef]
- Egger, M.; Smith, G.D.; Schneider, M.; Minder, C. Bias in meta-analysis detected by a simple, graphical test. BMJ 1997, 315, 629–634. [Google Scholar] [CrossRef]
- Lin, L.; Chu, H. Quantifying publication bias in meta-analysis. Biometrics 2018, 74, 785–794. [Google Scholar] [CrossRef]
- Teng, N.I.M.F.; Shahar, S.; Manaf, Z.A.; Das, S.K.; Taha, C.S.C.; Ngah, W.Z.W. Efficacy of fasting calorie restriction on quality of life among aging men. Physiol. Behav. 2011, 104, 1059–1064. [Google Scholar] [CrossRef]
- Villareal, D.T.; Chode, S.; Parimi, N.; Sinacore, D.R.; Hilton, T.; Armamento-Villareal, R.; Napoli, N.; Qualls, C.; Shah, K. Weight loss, exercise, or both and physical function in obese older adults. N. Engl. J. Med. 2011, 364, 1218–1229. [Google Scholar] [CrossRef]
- Armamento-Villareal, R.; Sadler, C.; Napoli, N.; Shah, K.; Chode, S.; Sinacore, D.R.; Qualls, C.; Villareal, D.T. Weight loss in obese older adults increases serum sclerostin and impairs hip geometry but both are prevented by exercise training. J. Bone Miner. Res. 2012, 27, 1215–1221. [Google Scholar] [CrossRef]
- Redman, L.M.; Heilbronn, L.K.; Martin, C.K.; Alfonso, A.; Smith, S.R.; Ravussin, E. Pennington CALERIE Team Effect of calorie restriction with or without exercise on body composition and fat distribution. J. Clin. Endocrinol. Metab. 2007, 92, 865–872. [Google Scholar] [CrossRef]
- Sparks, L.M.; Redman, L.M.; Conley, K.E.; Harper, M.-E.; Yi, F.; Hodges, A.; Eroshkin, A.; Costford, S.R.; Gabriel, M.E.; Shook, C.; et al. Effects of 12 Months of Caloric Restriction on Muscle Mitochondrial Function in Healthy Individuals. J. Clin. Endocrinol. Metab. 2016, 102, 2016–3211. [Google Scholar] [CrossRef]
- Racette, S.B.; Weiss, E.P.; Villareal, D.T.; Arif, H.; Steger-May, K.; Schechtman, K.B.; Fontana, L.; Klein, S.; Holloszy, J.O. One year of caloric restriction in humans: Feasibility and effects on body composition and abdominal adipose tissue. J. Gerontol. Ser. A Biol. Sci. Med. Sci. 2006, 61, 943–950. [Google Scholar] [CrossRef]
- Ravussin, E.; Redman, L.M.; Rochon, J.; Das, S.K.; Fontana, L.; Kraus, W.E.; Romashkan, S.; Williamson, D.A.; Meydani, S.N.; Villareal, D.T.; et al. A 2-year randomized controlled trial of human caloric restriction: Feasibility and effects on predictors of health span and longevity. J. Gerontol. Ser. A Biol. Sci. Med. Sci. 2015, 70, 1097–1104. [Google Scholar] [CrossRef]
- Higgins, J.P.T.; Altman, D.G.; Gotzsche, P.C.; Juni, P.; Moher, D.; Oxman, A.D.; Savovic, J.; Schulz, K.F.; Weeks, L.; Sterne, J.A.C. The Cochrane Collaboration’s tool for assessing risk of bias in randomised trials. BMJ 2011, 343, d5928. [Google Scholar] [CrossRef] [PubMed]
- Higgins, J.P.; Altman, D.G. Assessing Risk of Bias in Included Studies. In Cochrane Handbook for Systematic Reviews of Interventions: Cochrane Book Series; John Wiley and Sons: Hoboken, NJ, USA, 2008; pp. 187–241. [Google Scholar]
- Redman, L.M.; Huffman, K.M.; Landerman, L.R.; Pieper, C.F.; Bain, J.R.; Muehlbauer, M.J.; Stevens, R.D.; Wenner, B.R.; Kraus, V.B.; Newgard, C.B.; et al. Effect of Caloric Restriction with and without Exercise on Metabolic Intermediates in Nonobese Men and Women. J. Clin. Endocrinol. Metab. 2011, 96, E312–E321. [Google Scholar] [CrossRef] [PubMed]
- Fontana, L.; Villareal, D.T.; Weiss, E.P.; Racette, S.B.; Steger-May, K.; Klein, S.; Holloszy, J.O. Washington University School of Medicine CALERIE Group Calorie restriction or exercise: Effects on coronary heart disease risk factors. A randomized, controlled trial. Am. J. Physiol. Endocrinol. Metab. 2007, 293, E197–E202. [Google Scholar] [CrossRef] [PubMed]
- Weiss, E.P.; Racette, S.B.; Villareal, D.T.; Fontana, L.; Steger-May, K.; Schechtman, K.B.; Klein, S.; Holloszy, J.O. Improvements in glucose tolerance and insulin action induced by increasing energy expenditure or decreasing energy intake: A randomized controlled trial. Am. J. Clin. Nutr. 2006, 84, 1033–1042. [Google Scholar] [PubMed]
- Redman, L.M.; Veldhuis, J.D.; Rood, J.; Smith, S.R.; Williamson, D.; Ravussin, E. Pennington CALERIE Team The effect of caloric restriction interventions on growth hormone secretion in nonobese men and women. Aging Cell 2010, 9, 32–39. [Google Scholar] [CrossRef] [PubMed]
- Fontana, L.; Weiss, E.P.; Villareal, D.T.; Klein, S.; Holloszy, J.O. Long-term effects of calorie or protein restriction on serum IGF-1 and IGFBP-3 concentration in humans. Aging Cell 2008, 7, 681–687. [Google Scholar] [CrossRef] [PubMed]
- Fontana, L.; Villareal, D.T.; Das, S.K.; Smith, S.R.; Meydani, S.N.; Pittas, A.G.; Klein, S.; Bhapkar, M.; Rochon, J.; Ravussin, E.; et al. Effects of 2-year calorie restriction on circulating levels of IGF-1, IGF-binding proteins and cortisol in nonobese men and women: A randomized clinical trial. Aging Cell 2016, 15, 22–27. [Google Scholar] [CrossRef]
- Tam, C.S.; Frost, E.A.; Xie, W.; Rood, J.; Ravussin, E.; Redman, L.M. Pennington CALERIE Team No effect of caloric restriction on salivary cortisol levels in overweight men and women. Metabolism 2014, 63, 194–198. [Google Scholar] [CrossRef] [PubMed]
- Villareal, D.T.; Fontana, L.; Das, S.K.; Redman, L.; Smith, S.R.; Saltzman, E.; Bales, C.; Rochon, J.; Pieper, C.; Huang, M.; et al. Effect of Two-Year Caloric Restriction on Bone Metabolism and Bone Mineral Density in Non-Obese Younger Adults: A Randomized Clinical Trial. J. Bone Miner. Res. 2016, 31, 40–51. [Google Scholar] [CrossRef] [PubMed]
- Meydani, S.N.; Das, S.K.; Pieper, C.F.; Lewis, M.R.; Klein, S.; Dixit, V.D.; Gupta, A.K.; Villareal, D.T.; Bhapkar, M.; Huang, M.; et al. Long-term moderate calorie restriction inhibits inflammation without impairing cell-mediated immunity: A randomized controlled trial in non-obese humans. Aging (Albany N. Y.) 2016, 8, 1416–1431. [Google Scholar] [CrossRef] [PubMed]
- Weiss, E.P.; Villareal, D.T.; Racette, S.B.; Steger-May, K.; Premachandra, B.N.; Klein, S.; Fontana, L. Caloric Restriction But Not Exercise-Induced Reductions in Fat Mass Decrease Plasma Triiodothyronine Concentrations: A Randomized Controlled Trial. Rejuvenation Res. 2008, 11, 605–609. [Google Scholar] [CrossRef]
- Piacenza, F.; Malavolta, M.; Basso, A.; Costarelli, L.; Giacconi, R.; Ravussin, E.; Redman, L.M.; Mocchegiani, E. Effect of 6-month caloric restriction on Cu bound to ceruloplasmin in adult overweight subjects. J. Nutr. Biochem. 2015, 26, 876–882. [Google Scholar] [CrossRef]
- Redman, L.M.; Rood, J.; Anton, S.D.; Champagne, C.; Smith, S.R.; Ravussin, E. Calorie Restriction and Bone Health in Young, Overweight Individuals. Arch. Intern. Med. 2008, 168, 1859. [Google Scholar] [CrossRef]
- Civitarese, A.E.; Carling, S.; Heilbronn, L.K.; Hulver, M.H.; Ukropcova, B.; Deutsch, W.A.; Smith, S.R.; Ravussin, E. Calorie restriction increases muscle mitochondrial biogenesis in healthy humans. PLoS Med. 2007, 4, 485–494. [Google Scholar] [CrossRef]
- Martin, C.K.; Bhapkar, M.; Pittas, A.G.; Pieper, C.F.; Das, S.K.; Williamson, D.A.; Scott, T.; Redman, L.M.; Stein, R.; Gilhooly, C.H.; et al. Effect of Calorie Restriction on Mood, Quality of Life, Sleep, and Sexual Function in Healthy Nonobese Adults. JAMA Intern. Med. 2016, 176, 743. [Google Scholar] [CrossRef]
- Fontana, L.; Partridge, L. Promoting Health and Longevity through Diet: From Model Organisms to Humans. Cell 2015, 161, 106–118. [Google Scholar] [CrossRef]
- Merry, B. Molecular mechanisms linking calorie restriction and longevity. Int. J. Biochem. Cell Biol. 2002, 34, 1340–1354. [Google Scholar] [CrossRef]
- Wolf, G. Calorie Restriction Increases Life Span: A Molecular Mechanism. Nutr. Rev. 2006, 64, 89–92. [Google Scholar] [CrossRef]
- Anderson, R.M.; Weindruch, R. The caloric restriction paradigm: Implications for healthy human aging. Am. J. Hum. Biol. 2012, 24, 101–106. [Google Scholar] [CrossRef] [PubMed]
- Ingram, D.K.; de Cabo, R. Calorie restriction in rodents: Caveats to consider. Ageing Res. Rev. 2017, 39, 15–28. [Google Scholar] [CrossRef]
- Xu, X.; Cai, G.; Bu, R.; Wang, W.; Bai, X.; Sun, X.; Chen, X. Beneficial Effects of Caloric Restriction on Chronic Kidney Disease in Rodent Models: A Meta-Analysis and Systematic Review. PLoS ONE 2015, 10, e0144442. [Google Scholar] [CrossRef] [PubMed]
- Chen, Y.; Ling, L.; Su, G.; Han, M.; Fan, X.; Xun, P.; Xu, G. Effect of Intermittent versus Chronic Calorie Restriction on Tumor Incidence: A Systematic Review and Meta-Analysis of Animal Studies. Sci. Rep. 2016, 6, 33739. [Google Scholar] [CrossRef] [PubMed]
- Spindler, S.R. Review of the literature and suggestions for the design of rodent survival studies for the identification of compounds that increase health and life span. Age (Omaha) 2012, 34, 111–120. [Google Scholar] [CrossRef]
- Horne, B.D.; Muhlestein, J.B.; Anderson, J.L. Health effects of intermittent fasting: Hormesis or harm? A systematic review. Am. J. Clin. Nutr. 2015, 102, 464–470. [Google Scholar] [CrossRef]
- Harris, L.; Hamilton, S.; Azevedo, L.B.; Olajide, J.; De Brún, C.; Waller, G.; Whittaker, V.; Sharp, T.; Lean, M.; Hankey, C.; et al. Intermittent fasting interventions for treatment of overweight and obesity in adults: A systematic review and meta-analysis. JBI Database Syst. Rev. Implement. Rep. 2018, 16, 507–547. [Google Scholar] [CrossRef]
- Heilbronn, L.K.; Ravussin, E. Calorie restriction and aging: Review of the literature and implications for studies in humans. Am. J. Clin. Nutr. 2003, 78, 361–369. [Google Scholar] [CrossRef]
- Ye, J.; Keller, J.N. Regulation of energy metabolism by inflammation: A feedback response in obesity and calorie restriction. Aging (Albany N. Y.) 2010, 2, 361–368. [Google Scholar] [CrossRef] [PubMed]
- Bowers, J.; Terrien, J.; Clerget-Froidevaux, M.S.; Gothié, J.D.; Rozing, M.P.; Westendorp, R.G.J.; van Heemst, D.; Demeneix, B.A. Thyroid Hormone Signaling and Homeostasis During Aging. Endocr. Rev. 2013, 34, 556–589. [Google Scholar] [CrossRef] [PubMed]


| First Author, Year of Publication | Country | Duration (Months) | Per protocol Caloric Restriction (% kcal) | Participants (int/ctrl) | Females (int/ctrl) | Mean Age (yr) | BMI (int/ctrl) | Extrapolated Outcomes | Inclusion of Healthy Participants |
|---|---|---|---|---|---|---|---|---|---|
| Armamento-Villareal 2012 | USA | 12 | Females: 31–47% * Males: 25–38% * | 26/27 | 18/17 | 75 | 37.2/37.3 | BMI, BC, BM, QoL | no |
| Buchowski 2012 | USA | 1 | 25% | 32/8 | 32/8 | 31.5 | 32.2/30.1 | BMI, BC, ABP, HP, lipids, IM | yes |
| Haas 2014 | USA | 12 | Females: 31% * Males: 25% * | 55/54 | 32/37 | 70.3 | 30–40 ** | BMI, BC, ABP, HP, lipids, IM | yes |
| Heilbronn 2006 | USA | 6 | 25% | 12/11 | 6/5 | 38.5 | 27.8 *** | BMI, BC, ABP, HP, GM, lipids, BM, IM, OM | yes |
| Racette 2006 | USA | 12 | 16–20% | 18/10 | 12/6 | 55.6 | 27.1/27.9 | BMI, ABP, HP, GM, lipids, IM | yes |
| Ravussin 2015 | USA | 24 | 25% | 143/75 | 99/53 | 35 | 25.2/25.1 | BMI, BC, HP, GM, lipids, IM, QoL, MI, SQ, SxF | yes |
| Sparks 2016 | USA | 24 | 25% | 33/18 | 23/11 | 39 | 25.3/25.1 | BMI, ABP, GM, lipids, OM | yes |
| Teng 2011 | Malaysia | 3 | 15–25% | 14/14 | 0/0 | 58.8 | 27.0/26.5 | BMI, BC, QoL, MI, SQ | yes |
| Author | Selection Bias (Randomization) | Selection Bias (Allocation Concealment) | Performance Bias Objective Outcomes | Performance Bias Subjective Outcomes | Detection Bias Objective Outcomes | Detection Bias Subjective Outcomes | Attrition Bias | Reporting Bias | Other Bias |  |
|---|---|---|---|---|---|---|---|---|---|---|
| Armamento-Villareal 2012 | + | + | + | + | + | + | + | |||
| Buchowski 2012 | + | − | + | + | + | + | + | |||
| Haas 2014 | + | + | + | + | ? | + | − | |||
| Heilbronn 2006 | + | + | + | + | − | − | − | |||
| Racette 2006 | + | + | + | + | − | − | − | |||
| Ravussin 2015 | + | − | + | − | + | − | + | + | + | |
| Sparks 2016 | + | + | + | + | + | + | ? | |||
| Teng 2011 | ? | ? | + | − | + | − | + | − | − |
| Outcome | By Subgroup Meta-Analysis | No. of Studies | MD (95% CI) | I2 (%) | |
|---|---|---|---|---|---|
| Weight * | Overall | 6 | −7.90 (−7.99, −7.81) | 0.0 | |
| Normal weight | 2 | −7.90 (−7.99, −7.81) | 0.0 | ||
| By BMI | Overweight | 3 | −6.50 (−10.61, −2.40) | 0.0 | |
| Obese | 1 | −3.30 (−17.72, 11.12) | – | ||
| By follow-up | ≤5 months from baseline | 2 | −4.26 (−9.33, −0.80) | 0.0 | |
| ≥6–≤11 months from the baseline | 1 | −8.70 (−17.36, −0.04) | – | ||
| ≥12 months from the baseline | 3 | −7.90 (−7.99, −7.81) | 0.0 | ||
| Fat mass * | Overall | 5 | −4.40 (−6.69, −0.45) | 85.7 | |
| By follow-up | ≤6 months from baseline | 2 | −1.91 (−3.37, −0.45) | 0.0 | |
| >6 months from baseline | 3 | −5.80 (−5.87, −5.72) | 0,0 | ||
| By BMI | Normal weight | 2 | −5.80 (−5.87, −5.72) | 0.0 | |
| Overweight | 2 | −3.64 (−7.70, −0.41) | 76.5 | ||
| Obese | 1 | −2.40 (−12.72, 7.92) | – | ||
| BMI ** | Overall | 5 | −2.68 (−3.51, −1.86) | 69.6 | |
| By follow-up | Follow-up ≤5 months from baseline | 1 | −0.50 (−1.91, 0.91) | – | |
| Follow-up ≥6–≤11 months from the baseline | 1 | −4.30 (−6.18, −2.42) | – | ||
| Follow-up ≥12 months from the baseline | 3 | −2.70 (−2.73, −2.67) | 0.0 | ||
© 2020 by the authors. Licensee MDPI, Basel, Switzerland. This article is an open access article distributed under the terms and conditions of the Creative Commons Attribution (CC BY) license (http://creativecommons.org/licenses/by/4.0/).
Share and Cite
Caristia, S.; De Vito, M.; Sarro, A.; Leone, A.; Pecere, A.; Zibetti, A.; Filigheddu, N.; Zeppegno, P.; Prodam, F.; Faggiano, F.; et al. Is Caloric Restriction Associated with Better Healthy Aging Outcomes? A Systematic Review and Meta-Analysis of Randomized Controlled Trials. Nutrients 2020, 12, 2290. https://doi.org/10.3390/nu12082290
Caristia S, De Vito M, Sarro A, Leone A, Pecere A, Zibetti A, Filigheddu N, Zeppegno P, Prodam F, Faggiano F, et al. Is Caloric Restriction Associated with Better Healthy Aging Outcomes? A Systematic Review and Meta-Analysis of Randomized Controlled Trials. Nutrients. 2020; 12(8):2290. https://doi.org/10.3390/nu12082290
Chicago/Turabian StyleCaristia, Silvia, Marta De Vito, Andrea Sarro, Alessio Leone, Alessandro Pecere, Angelica Zibetti, Nicoletta Filigheddu, Patrizia Zeppegno, Flavia Prodam, Fabrizio Faggiano, and et al. 2020. "Is Caloric Restriction Associated with Better Healthy Aging Outcomes? A Systematic Review and Meta-Analysis of Randomized Controlled Trials" Nutrients 12, no. 8: 2290. https://doi.org/10.3390/nu12082290
APA StyleCaristia, S., De Vito, M., Sarro, A., Leone, A., Pecere, A., Zibetti, A., Filigheddu, N., Zeppegno, P., Prodam, F., Faggiano, F., & Marzullo, P. (2020). Is Caloric Restriction Associated with Better Healthy Aging Outcomes? A Systematic Review and Meta-Analysis of Randomized Controlled Trials. Nutrients, 12(8), 2290. https://doi.org/10.3390/nu12082290