1. Introduction
While their ability to stimulate gut bacteria and prebiotic activity has been known for some time, it is becoming increasingly evident that oligosaccharides (OS) act through unknown mechanisms to stimulate brain development. Oligofructose (OF), also known as fructooligosaccharide (FOS), is an OS of vegetable origin, commonly found in foods such as asparagus, artichoke, onion, and wheat [
1]. Oligofructose is non-digestible and readily fermentable by
Bifidobacterium spp. and
Bacteroides spp., but not by potentially pathogenic bacteria such as
Escherichia coli and
Clostridium perfringens [
2]. Infants consuming formula containing OF display increased fecal bifidobacteria and bacteroides, decreased fecal
Escherichia coli and enterococci, and increased stool frequency [
3,
4]. Consumption of OF has also been shown to alter the expression of brain-derived neurotrophic factor (BDNF) and
N-methyl-D-aspartate (NMDA) receptor subunits in the rodent brain [
5] and improve cognitive function in a rodent model of Alzheimer’s disease [
6,
7].
Human milk contains a heterogenous group of OS that have demonstrated benefits for immune and intestinal function and are hypothesized to promote brain development [
8,
9]. The concentration and diversity of these human milk oligosaccharides (HMO) is unmatched by other mammals [
10], and these OS are specific to milk as opposed to non-milk OS such as OF. This has significant implications for infants consuming bovine milk-based infant formulas, as bovine milk contains up to a hundred times fewer and less diverse OS [
9]. Infants consuming formula containing HMO such as 2′-fucosyllactose (2′-FL) and Lacto-
N-neotetraose report fewer incidences of respiratory illness [
11]. Evidence from rodent studies suggests that HMO such as sialyllactose and 2′-FL may improve response to stress [
12] and learning and memory [
13,
14], respectively. Both sialyllactose and 2′-FL contain monosaccharides (i.e., sialic acid and fucose, respectively) that are known glycoconjugates in the brain [
15,
16]. Whether sialyllactose and 2′-FL impact the brain in large part due to their sialic acid or fucose content is unclear. Sialic acid, alone or as part of a ganglioside, is known to promote cognition [
17,
18,
19]. Similarly, fucose has been shown to accrete in glycoproteins after a passive avoidance task in chicks [
16], and impairing fucosylation in the rat hippocampus impairs retention during discrimination tasks [
20]. Yet, Vazquez et al. demonstrated that intact 2′-FL, and not fucose, promotes hippocampal long-term potentiation [
14].
Alluding to the probability that intact OS and not their active monosaccharide components are required for promoting cognition is the evidence that OS such as OF, galactooligosaccharide (GOS), and chitosan oligosaccharide have been shown to benefit cognition in various animal models and species [
7,
21,
22,
23]. This is significant as some formulas contain OF or GOS [
24], yet these OS are not found in human milk. Whether HMO provide a cognitive benefit greater than that of non-human milk OS is an important question as infants relying on formula as their sole source of nutrition are typically not provided the level and diversity of HMO that are present in human milk.
We chose to use the neonatal pig as an animal model due to fact that similarities with the human regarding gastrointestinal physiology [
25], brain development [
26], and strengths and limitations of comparisons to the human microbiome are well described [
27,
28,
29]. As the majority of studies assessing the efficacy of OS to promote brain development have been conducted in rodent models, this study evaluated whether such effects can be replicated in an animal model closer to humans. As previously mentioned, it is unclear whether HMO provide a cognitive benefit in addition to formula already containing non-HMO OS. Thus, the objective of this study was to assess the impact of dietary OF alone or combined with 2′-FL on recognition memory, hippocampal gene expression, and structural development of the brain using the pig as an animal model.
2. Materials and Methods
2.1. Animals and Housing
All animal care and experimental procedures were in accordance with the National Research Council Guide for Care and Use of Laboratory Animals and approved by the University of Illinois at Urbana-Champaign Institutional Animal Care and Use Committee (IACUC 15034). In general, rearing and housing methods were conducted similarly to previous studies from our lab [
21], and are described as follows. Thirty-six intact male pigs (1050 Cambro genetics) were naturally farrowed and allowed colostrum consumption for up to 48 h before transport to the Piglet Nutrition and Cognition Laboratory at the University of Illinois at Urbana-Champaign. Pigs were artificially reared from postnatal day (PND) 2 until PND 33. This study was conducted using six independent cohorts (
n = 2 pigs per dietary treatment in each cohort), with litter and initial bodyweight counterbalanced between dietary groups and within each cohort. All pigs were housed in master caging units that contained six individual stainless-steel cages (L × W × H of 87.6 × 88.9 × 50.8 cm), with clear, polycarbonate facades on three sides of the cage and vinyl-coated, expanded-metal flooring (Tenderfoot
®, Minneapolis, MN, USA). The master unit was designed such that there were three separate levels each with two individual pig cages on each level. Thus, pigs on each level shared a common wall containing holes to permit pigs to see, smell, hear, and minimally touch one another. A towel and toy were included in each cage to provide enrichment, all pigs were removed from cages and allowed to socialize for approximately 30 min each day, and all pigs were allowed
ad libitum access to water at all times.
All pigs were reared in the same room with ambient temperature maintained between 27 and 29 °C and a 12 h light/dark cycle maintained from 600 to 1800 h. Prior to placement in the artificial rearing system, pigs were administered 5.0 mL of
Clostridium perfingens antitoxin C + D per the manufacturer’s recommendations (Colorado Serum Company, Denver, CO, USA) to prevent enterotoxemia [
30]. At study conclusion (PND 33), pigs were anesthetized using a telazol: ketamine: xylazine solution (50.0 mg tiletamine plus 50.0 mg of zolazepam reconstituted with 2.50 mL ketamine [100 g/L] and 2.50 mL xylazine [100 g/L]; Fort Dodge Animal Health) by intramuscular injection at 0.03 mL/kg bodyweight. After anesthetic induction, pigs were euthanized via intracardiac administration of sodium pentobarbital (86.0 mg/kg of body weight; Euthasol, Virbac Animal Health, Fort Worth, TX, USA). Pigs were observed twice daily at approximately 800 and 1600 h and given health scores to track any weight loss, vomiting, diarrhea, or lethargic behavior.
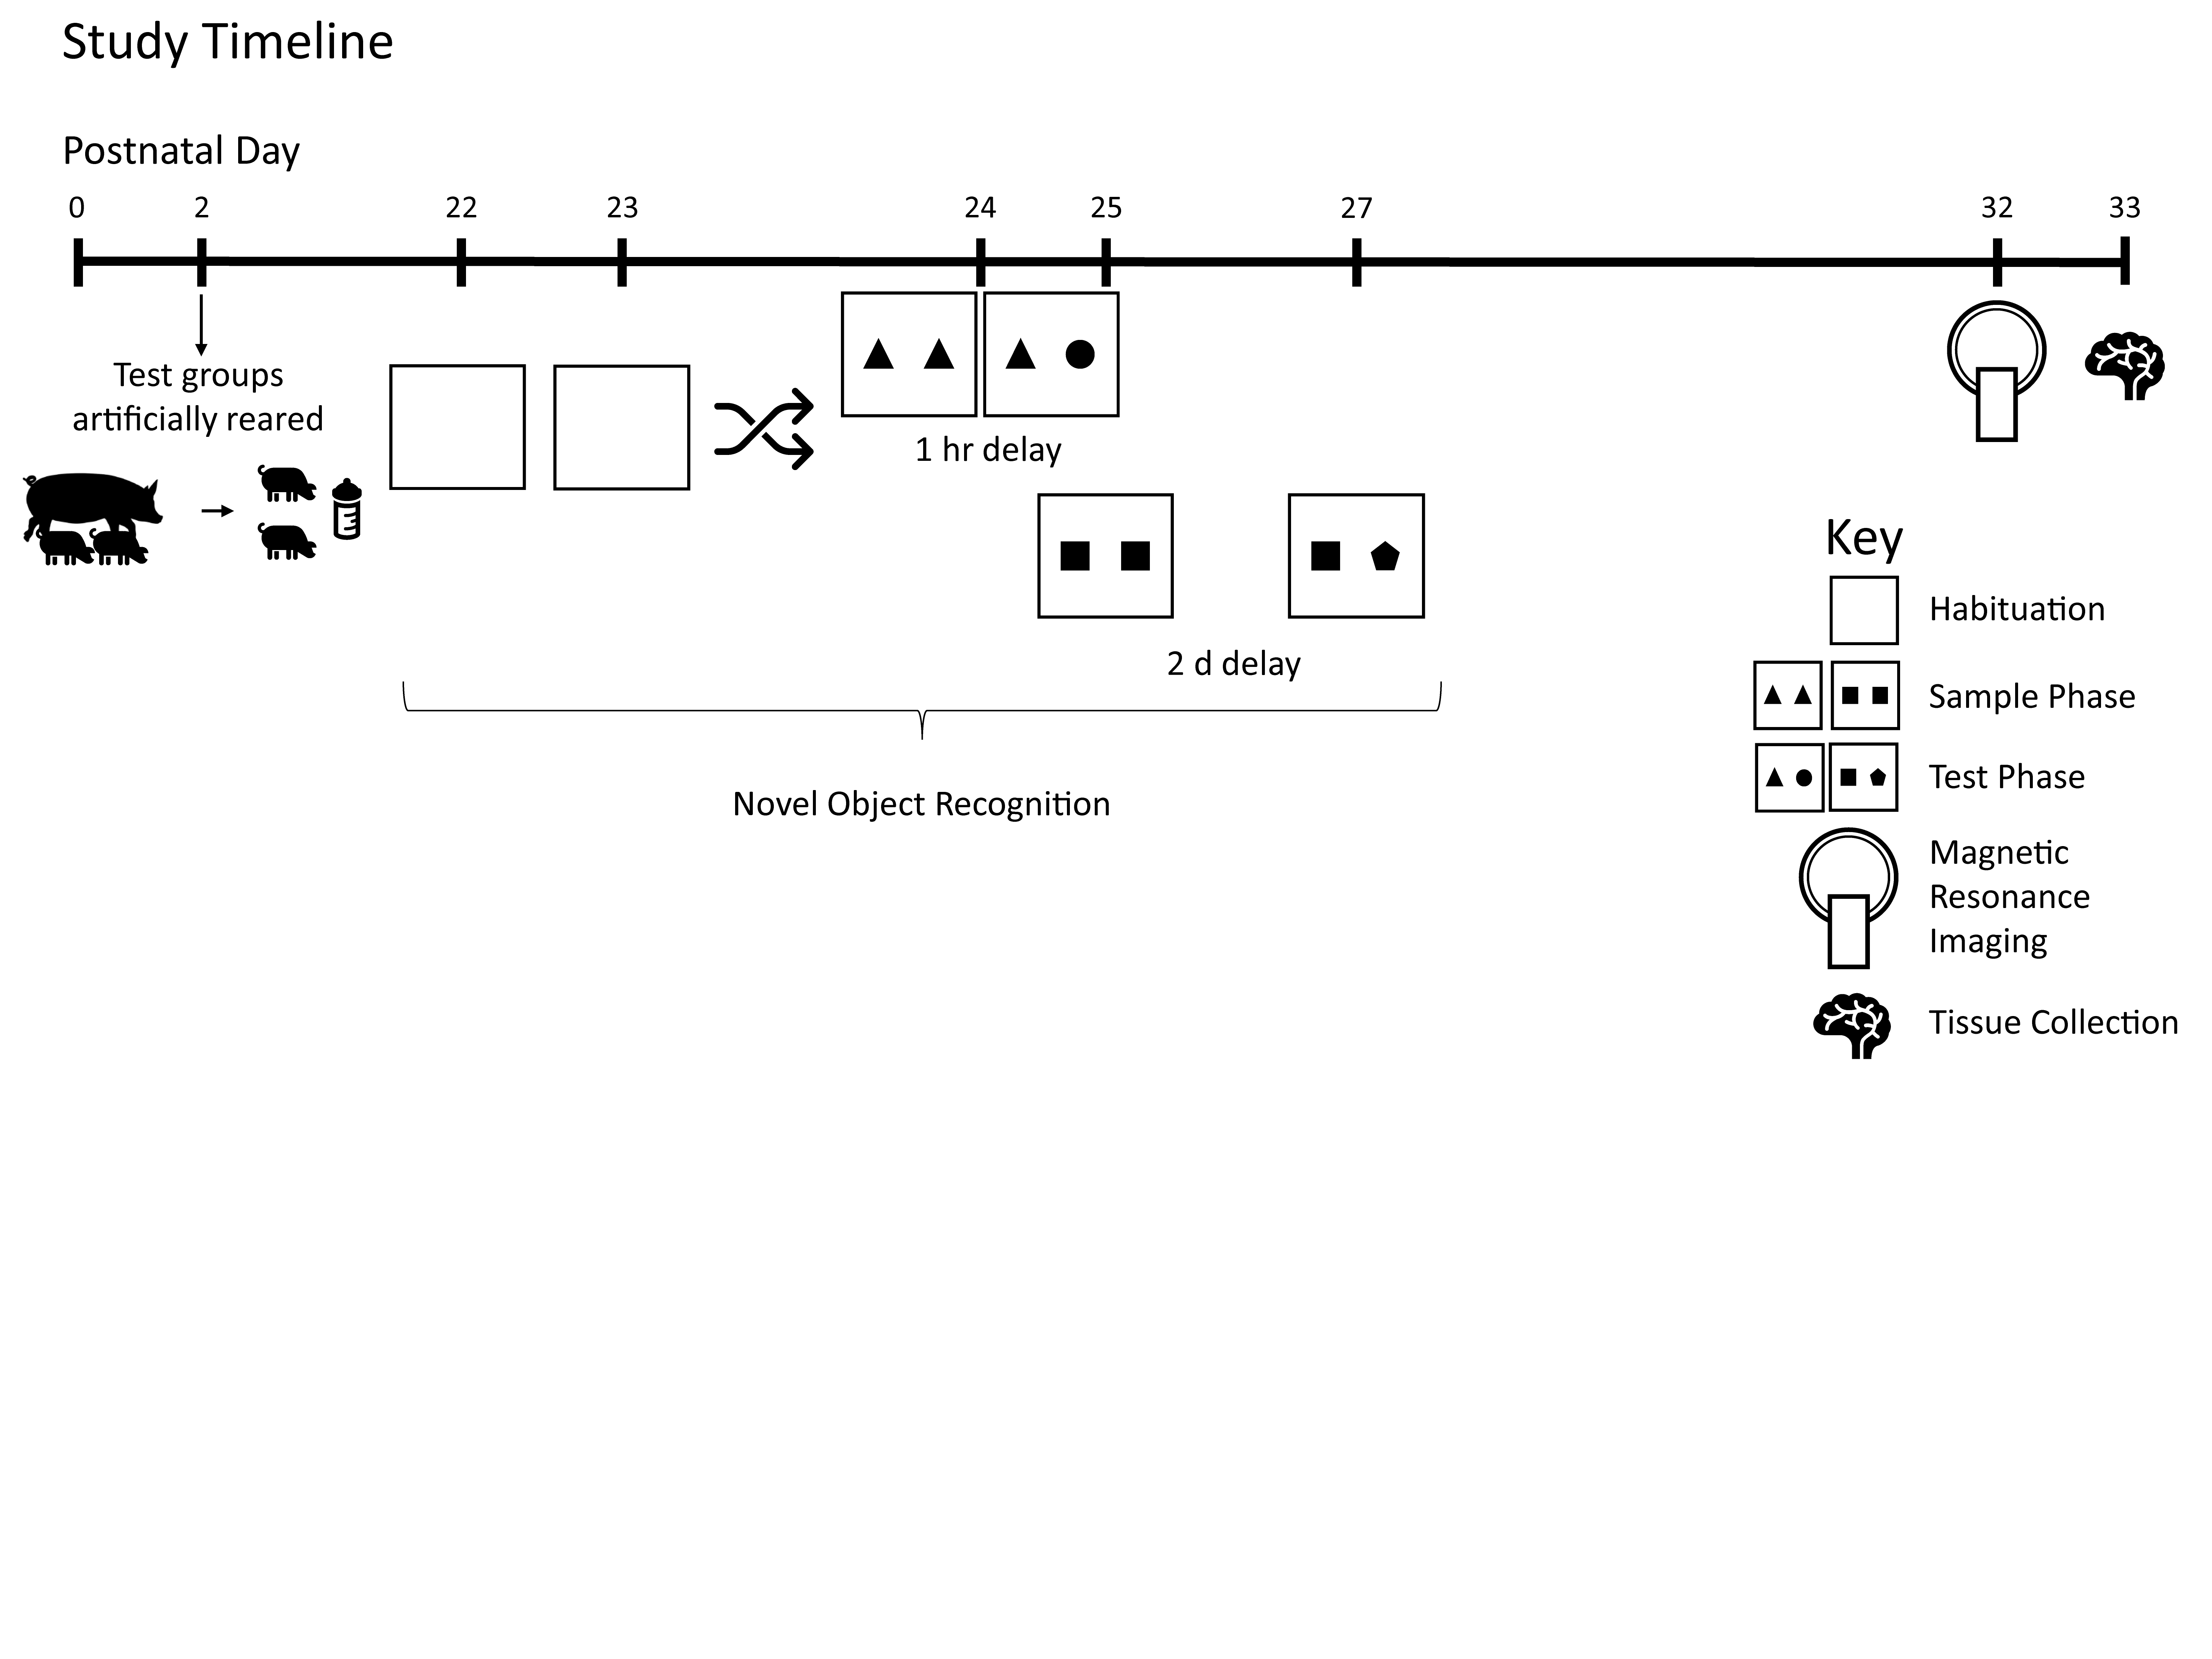
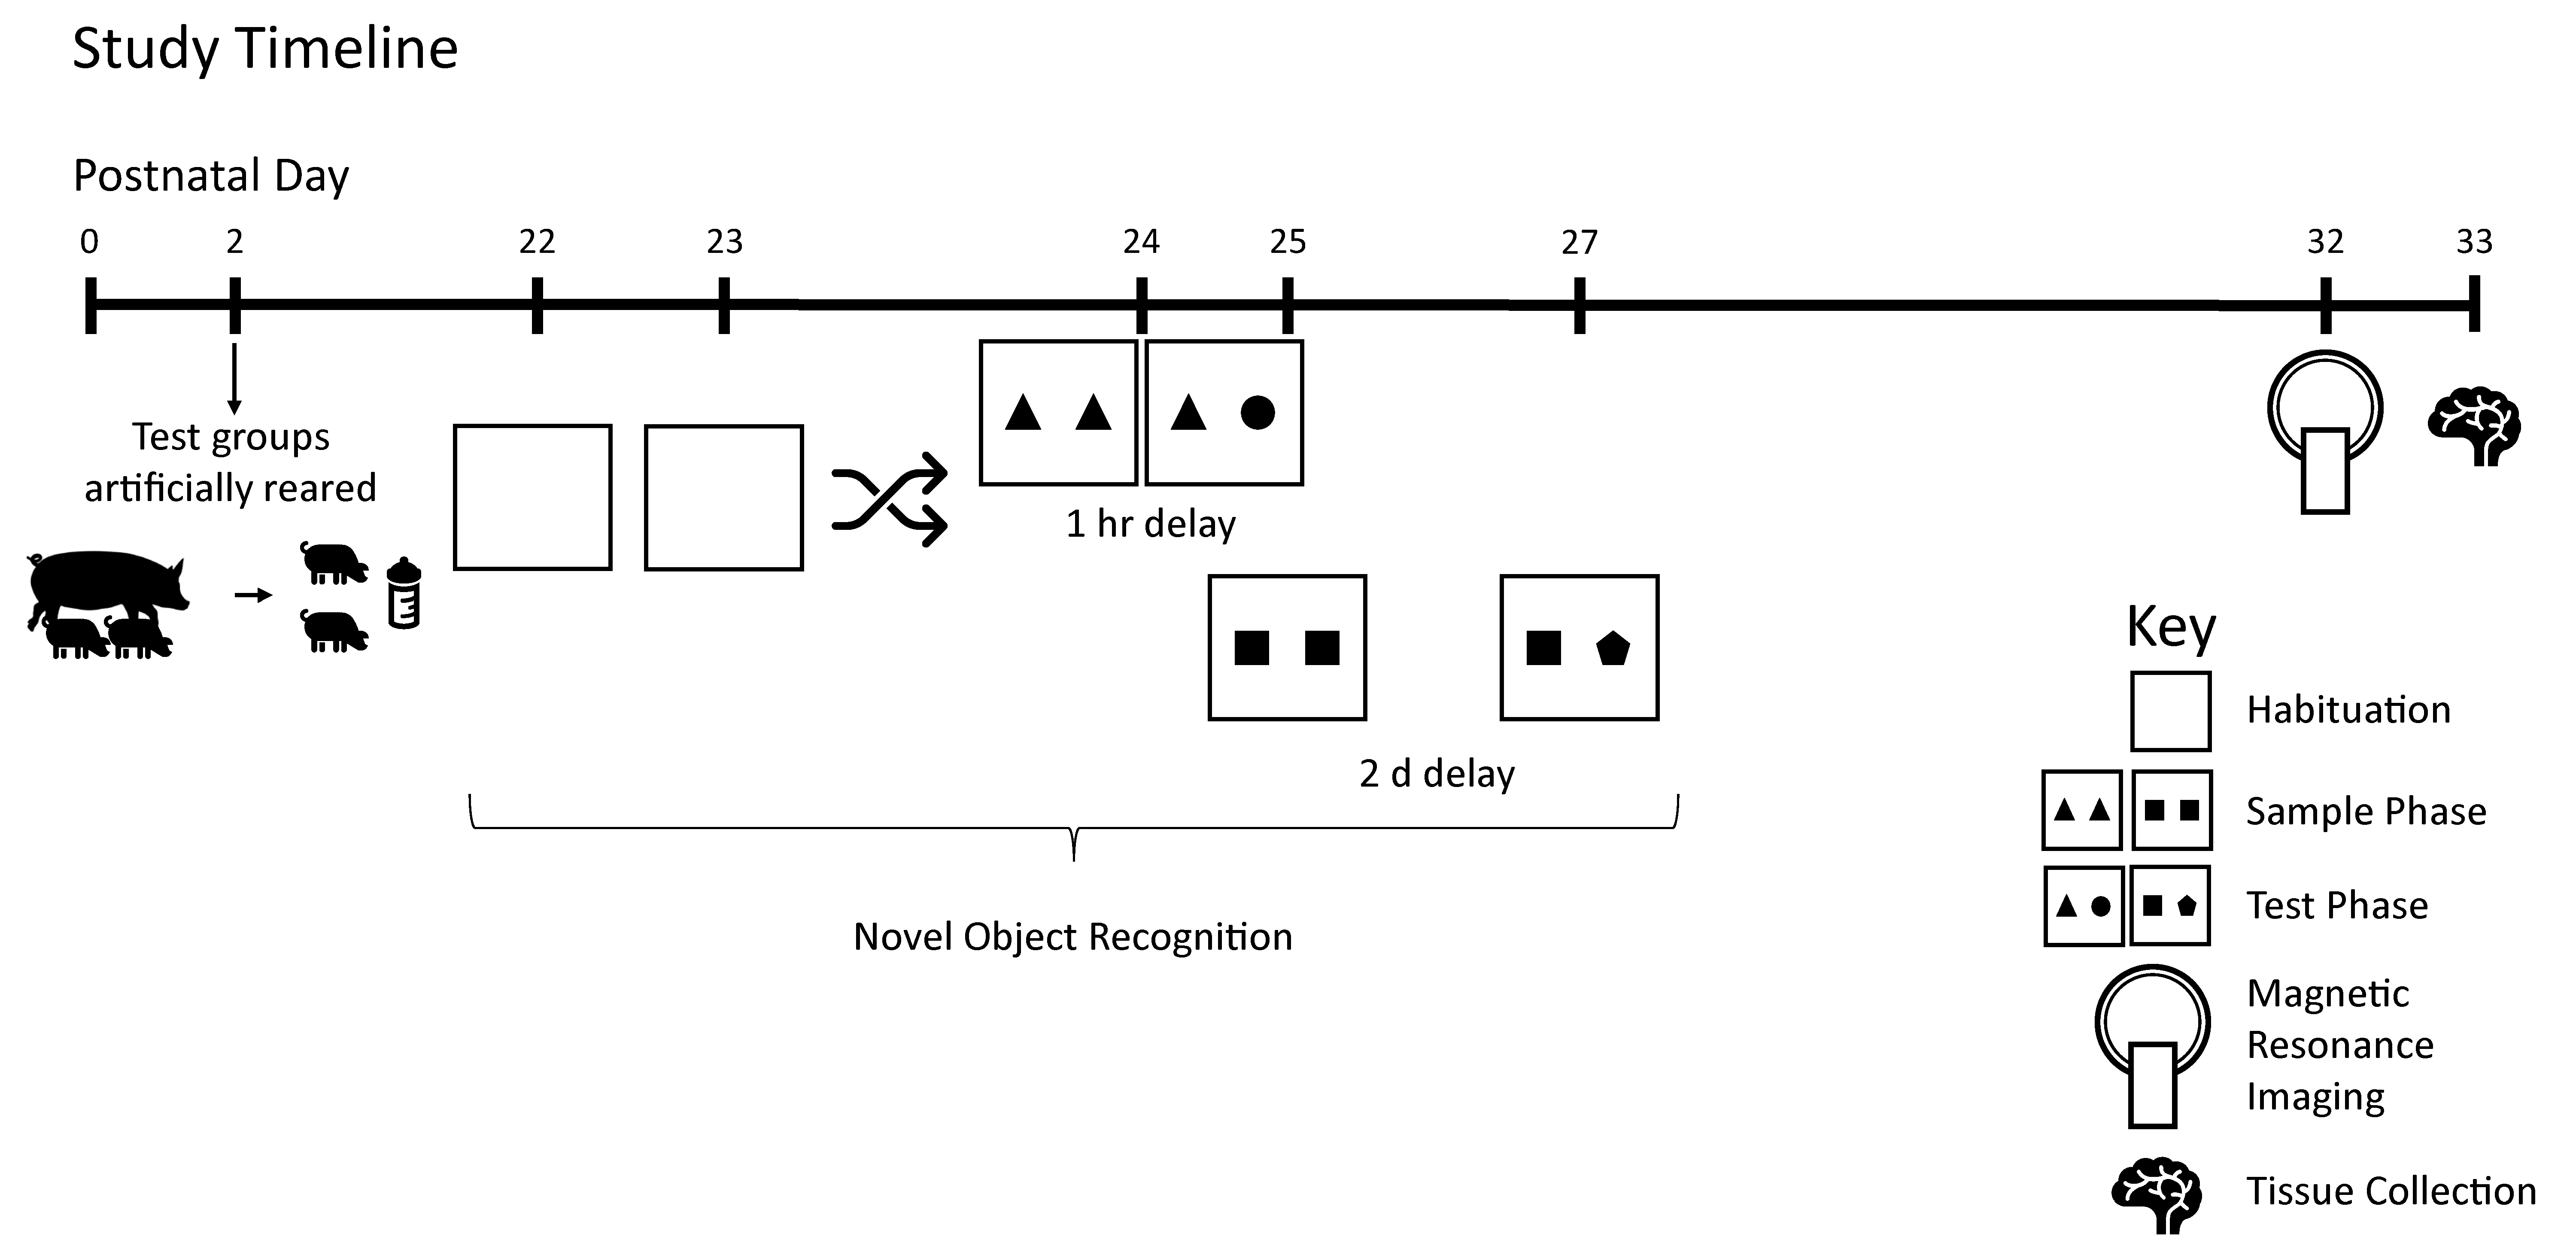
Figure 1 demonstrates the study design.
2.2. Dietary Treatments
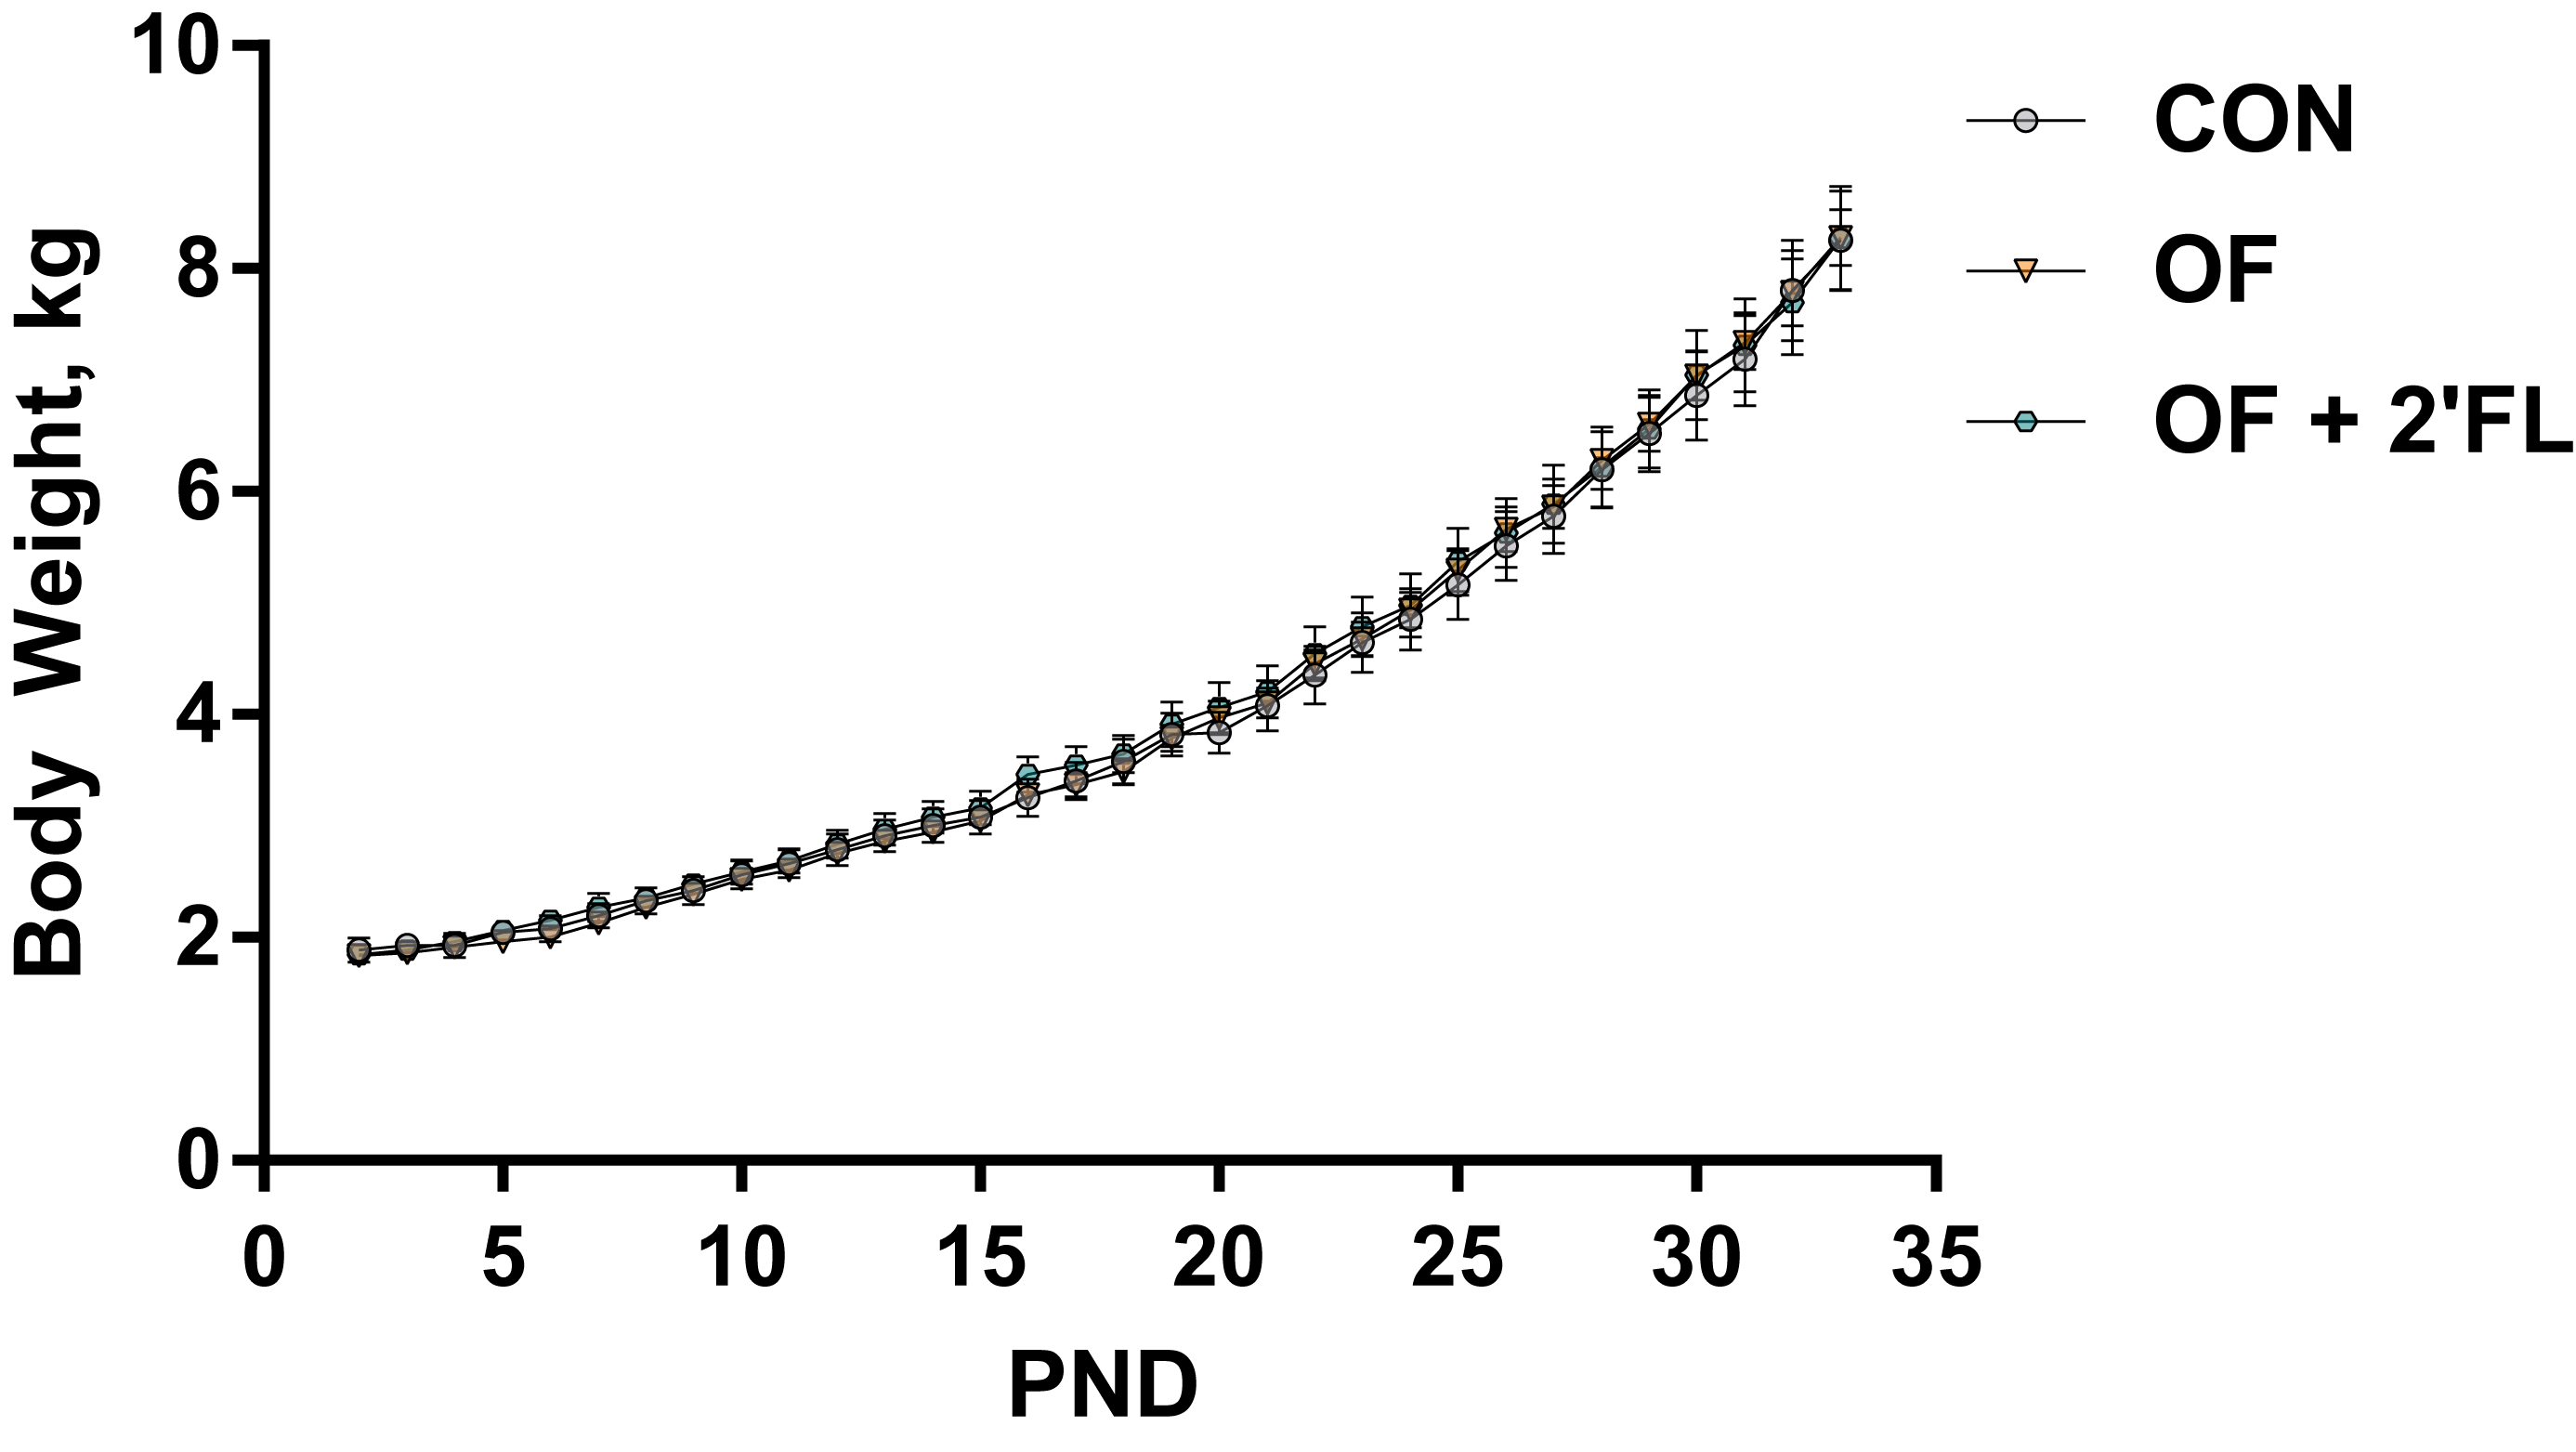
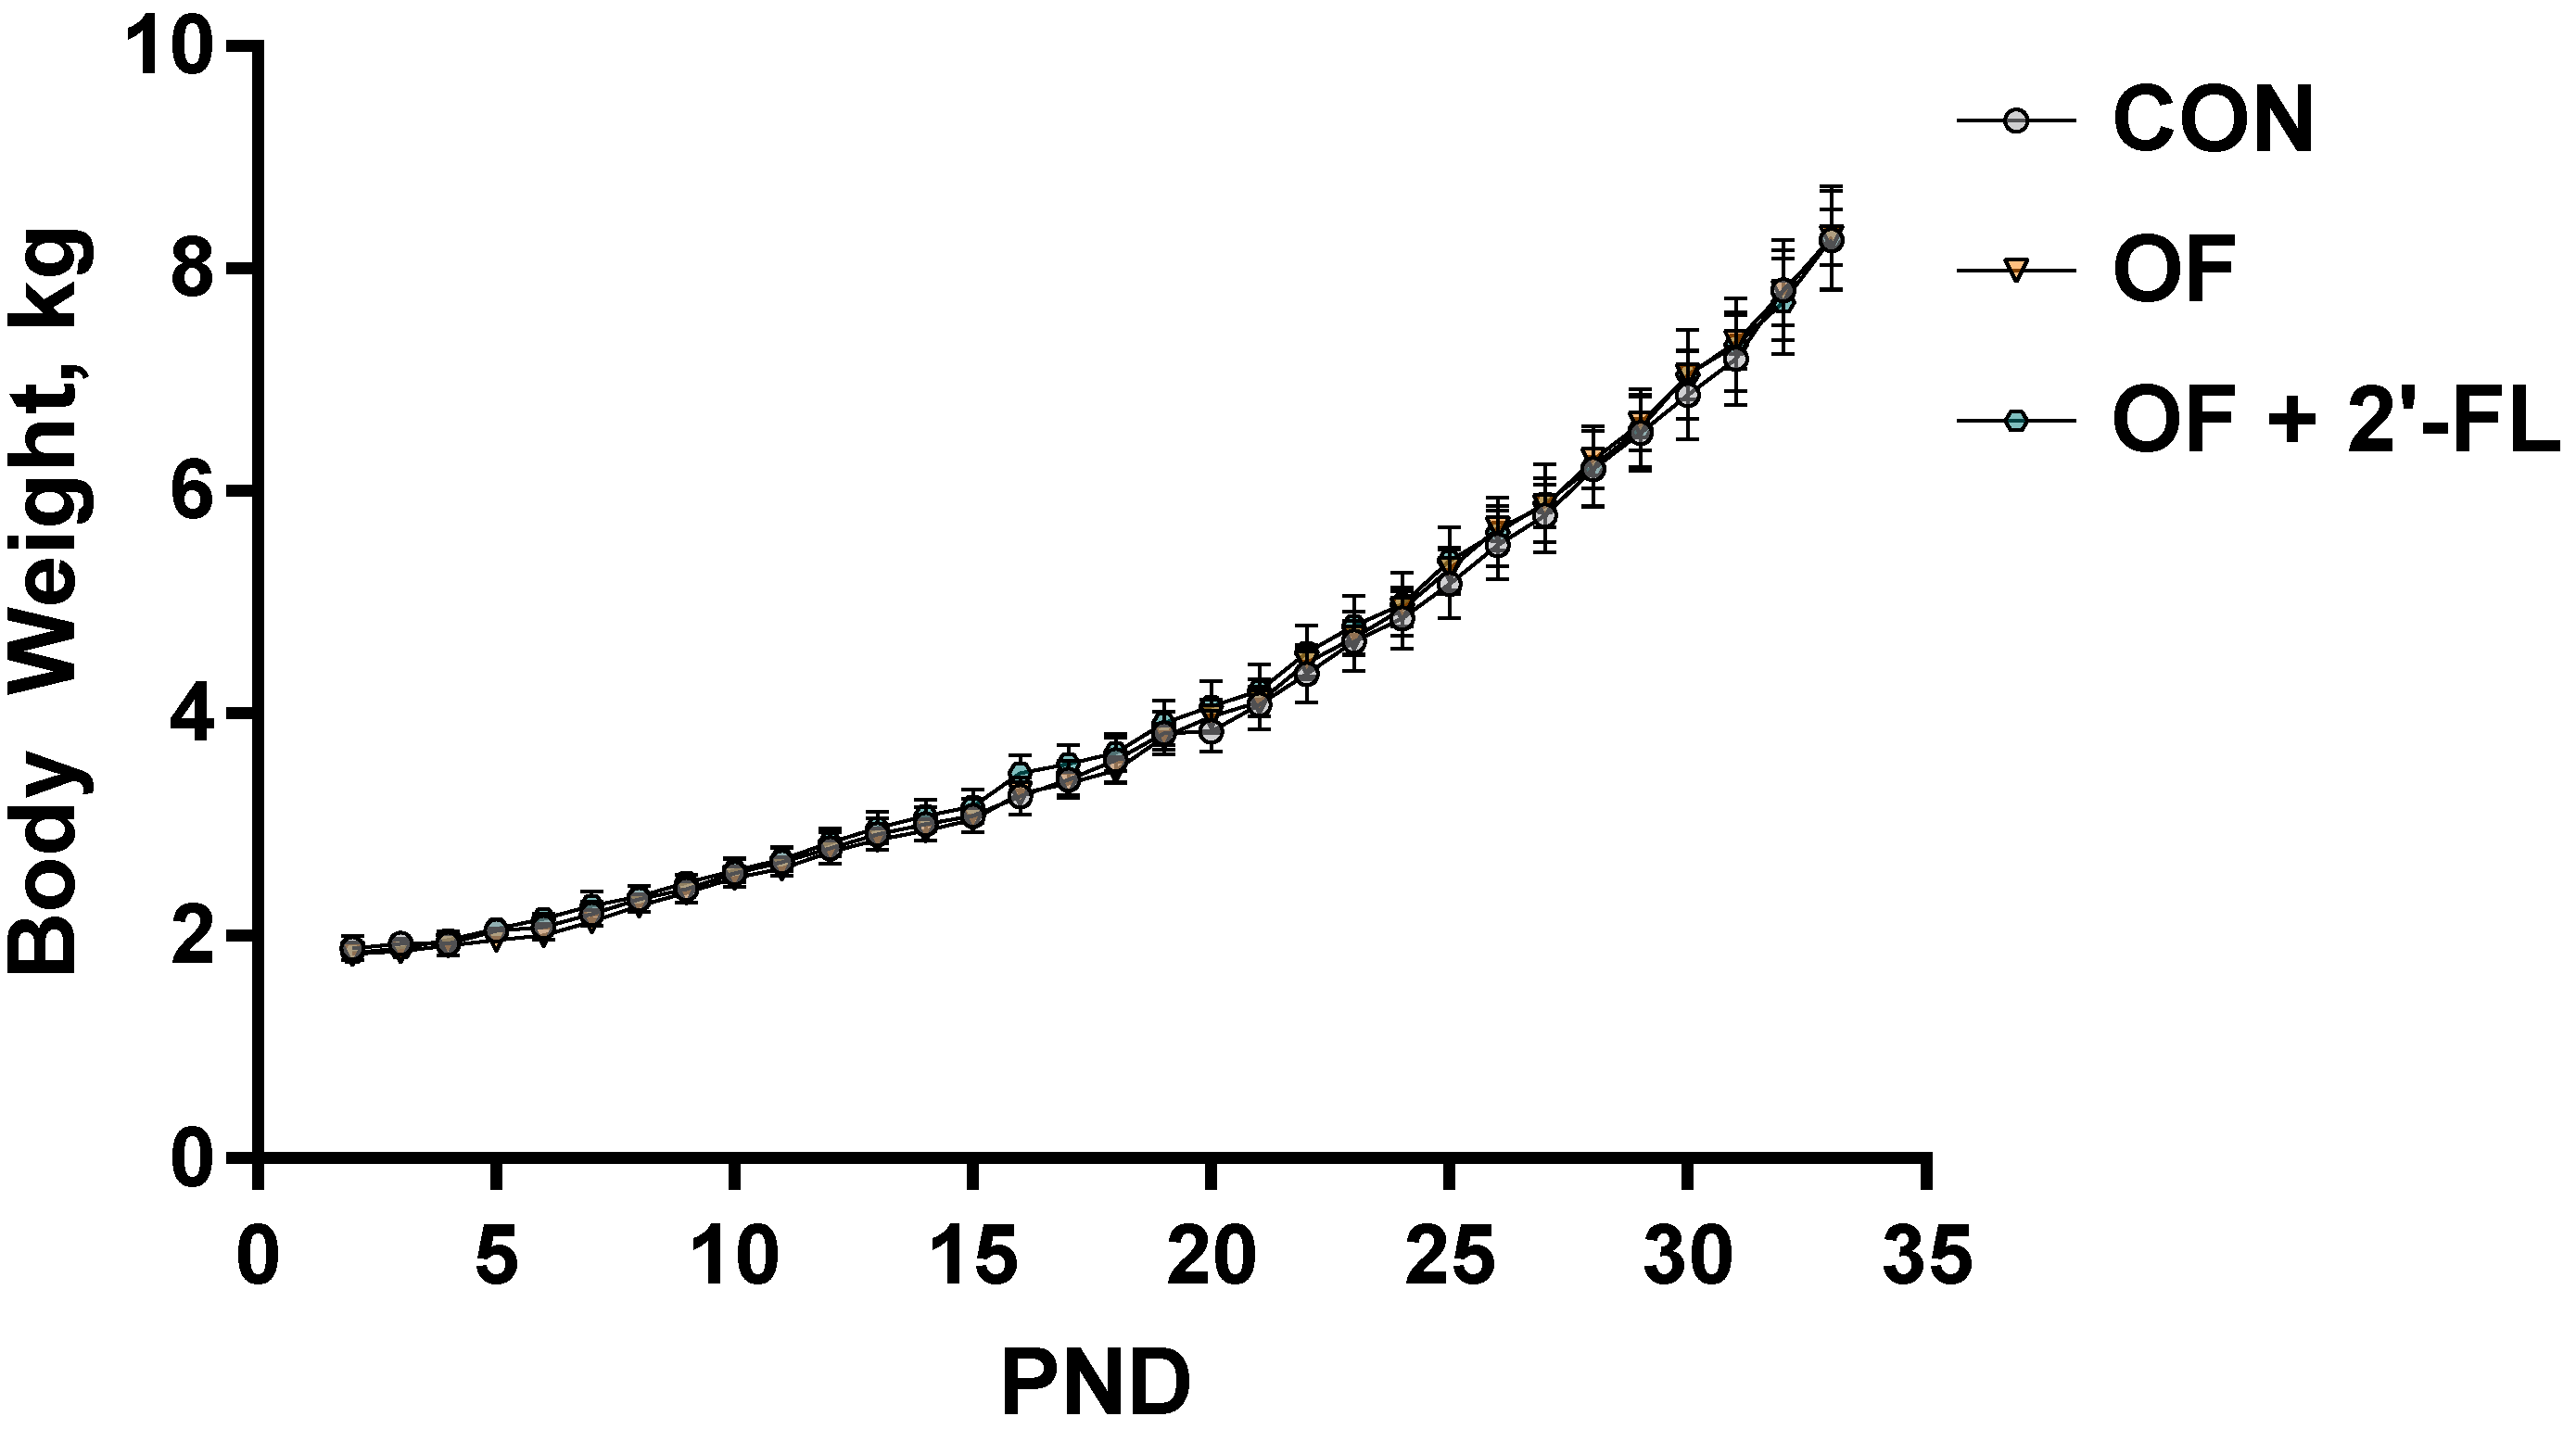
All researchers involved with conducting the study and acquiring and analyzing study results remained blind to dietary treatment identity until final data analyses were complete. Pigs (
n = 12 per diet) were provided milk replacers reconstituted at 200 g of dry powder per 800 g of water. Reconstituted diets were formulated to contain approximately 0 g/L OF + 0 g/L 2′-FL (control [CON], ProNurse
® Specialty Milk Replacer, Purina Animal Nutrition, Gray Summit, MO, USA), 5 g/L OF + 0 g/L 2′-FL (OF), or 5 g/L OF + 1 g/L 2′-FL (OF + 2′-FL). The concentration of oligosaccharides was chosen to remain consistent with previous clinical studies investigating stool characteristics infants of fed formula containing 3–5 g/L oligofructose [
31,
32] or impact on growth of infants fed formulas containing 1 g/L 2′-fucosyllactose [
11,
33]. As the aim of the research was to assess the addition of 2′-FL to a diet already containing an oligosaccharide source, a group fed 2′-FL alone was not included. The base diet was diluted to allow the addition of oligosaccharides and all diets were formulated to contain supplemental lactose to balance the amount of total carbohydrate. Thus, diets contained equivalent fat and protein content with as minimal as possible adjustments to the lactose content. Nutrient composition of the base diet and both formulated and analyzed concentrations of oligosaccharides and lactose in the diet are shown in
Table 1 and
Table 2.
Pigs received small volumes (approximately 500 mL) of experimental diets on the day of arrival to the rearing facility to allow for adjustment to the milk replacer prior to the standard feeding regimen. Pigs were fed at a rate of 285 and 325 mL of reconstituted diet per kg bodyweight from PND 3–6 and PND 7–33, respectively. Individual pig bodyweight was recorded daily to determine the volume of milk to be dispensed to individual animals throughout the day. Meals were administered 10 times a day, approximately every 100 min, between 400 and 1000 h using an automated feeding system. Feed refusals were not quantified.
2.3. Behavior
Pigs were tested on the novel object recognition (NOR) task using two different delays to assess intermediate and long-term recognition memory. This task has previously been validated for use in pigs by independent labs [
34,
35,
36,
37] and the methods used for execution and analysis of this test by our lab have been previously described [
21,
38,
39]. Testing consisted of a habituation phase, a sample phase, and a test phase. During the habituation phase, each pig was placed in an empty testing arena for 10 min each day for two days leading up to the sample phase. In the sample phase, the pig was placed in the arena containing two identical objects and given 5 min for exploration. After a delay of 1 or 48 h the pig was returned to the arena for the test phase of the NOR task. During the test phase, the pig was placed in the arena containing one object from the sample phase and a novel object and allowed to explore for 5 min. Between trials, objects were removed, immersed in hot water with detergent, and rubbed with a towel to mitigate odor and the arena was sprayed with water to remove urine and feces. Objects chosen had a range of characteristics (i.e., color, texture, shape, and size). However, the novel and sample objects only differed in shape and size. Only objects previously shown to elicit a null preference were used for testing [
35]. Task order was counterbalanced between replicates. Habituation trials began at PND 22 and testing on the sample phase began on PND 24. The recognition index, or the proportion of time spent with the novel object compared to total exploration of both objects, was used to measure recognition memory. A recognition index significantly above 0.50 demonstrates a novelty preference and thus recognition memory. Videos from all experiments were analyzed using a commercially available software package (Ethovision XT 11
®, Noldus Information Technology, Wageningen, The Netherlands). Time spent investigating objects was recorded manually by mapping start and stop conditions to specific keys on a computer keyboard. Experimenters were blind to all treatment conditions during analysis. Investigations were classified as nose-directed behavior such as rooting, mouthing, or sniffing of the objects. Rubbing up against, standing over, standing near, looking at, or sniffing the floor/air near the objects were not counted as investigations.
2.4. Magnetic Resonance Imaging (MRI)
All pigs underwent MRI procedures at PND 32 or 33 at the Beckman Institute for Advanced Science and Technology Biomedical Imaging Center using Siemens MAGNETOM Trio 3T (Siemens, Munich, Germany) equipment with a Siemens 32-channel head coil. Methods used were adapted from previous studies using MRI in pig [
40,
41,
42]. Each pig underwent imaging protocols only once, and scans for each cohort of pigs were completed all on the same day. The pig neuroimaging protocol included three magnetization prepared rapid gradient-echo (MPRAGE) sequences and diffusion tensor imaging (DTI) to assess brain macrostructure and microstructure, respectively, as well as magnetic resonance spectroscopy (MRS) to obtain brain metabolite concentrations. In preparation for MRI procedures, anesthesia was induced using an intramuscular injection of telazol (50.0 mg of tiletamine plus 50.0 mg of zolazepam reconstituted with 5.0 DI water; Zoetis, Florham Park, NJ) administered at 0.07 mL/kg bodyweight, and maintained with inhalation of isoflurane (98% O
2, 2% isoflurane). Pigs were immobilized during all MRI procedures. Visual observation of each pig’s well-being, as well as observations of heart rate, PO
2 and percent of isoflurane were recorded every 5 min during the procedure and every 10 min post-procedure until animals recovered. Total scan time for each pig was approximately 60 min. Imaging techniques are briefly described below.
2.4.1. Structural MRI
A T
1-weighted magnetization-prepared rapid gradient echo (MPRAGE) sequence was used to obtain anatomic images of the pig brain with a 0.7 mm isotropic voxel size. Three repetitions were acquired and averaged using SPM8 in Matlab 8.3, and brains were manually extracted using FMRIB Software Library (FSL) (FMRIB Centre, Oxford, UK). Manual extraction was initially performed by a single trained observer and reviewed by a second trained observer blind to experimental treatment. The following sequence specific parameters were used to acquire T
1-weighted MPRAGE data: repetition time (TR) = 1900 ms; echo time (TE) = 2.49 ms; 224 slices; field of view (FOV) = 180 mm; flip angle = 9°. Methods for MPRAGE averaging and manual brain extraction were previously described [
42]. All data generated used a publicly-available population-averaged pig brain atlas (
http://pigmri.illinois.edu) [
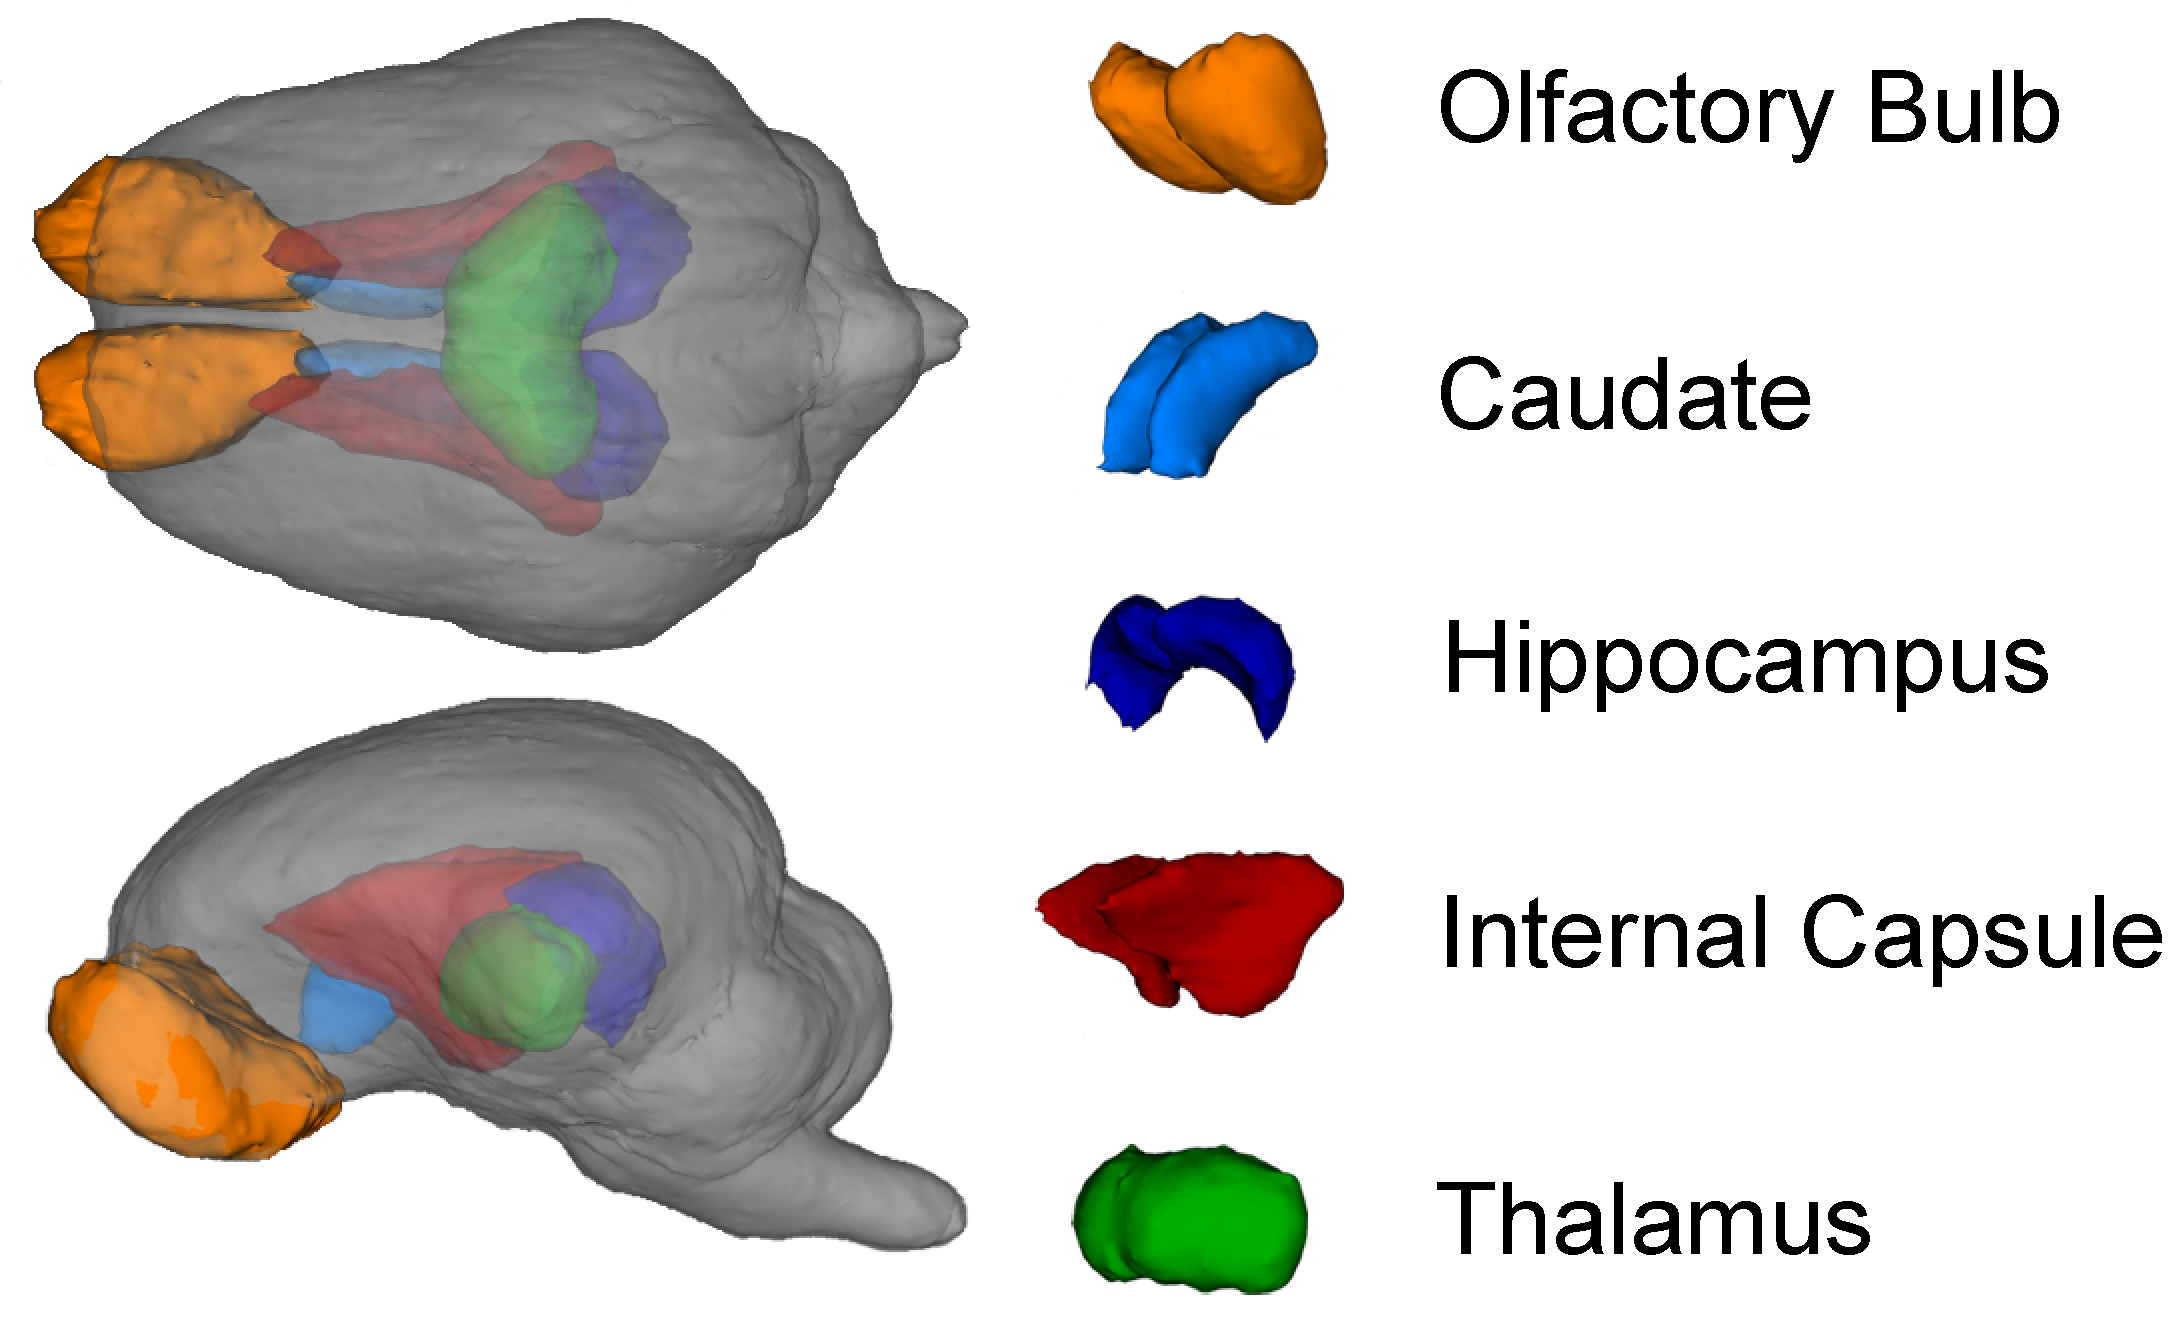
43]. For volumetric assessments, individual brains were segmented into 22 different regions of interest (ROI) using the pig brain atlas. Total brain and individual region volume analysis was performed with SPM8 in which an inverse warp file for each ROI was generated from the DARTEL-generated warp files for each region. As described previously [
42], the SPM ‘Segment’ tool, along with pig-specific tissue prior probabilities, was used to obtain gray matter, white matter, and CSF tissue segmentations for each pig, and DARTEL was used to align the native space segmentations. The fslstats toolbox was used to determine the voxel volume of the subject-space segmentation for each of the three tissue types. Using fslmaths, the mean overall partial volume map was obtained for each subject-space segmentation. Overall absolute volume for gray matter, white matter, and CSF was determined by multiplying the voxel volume measure by the mean intensity of the partial volume segmentation. In order to account for absolute whole-brain volume, all regions of interest were also expressed as a percent of total brain volume (%TBV).
2.4.2. Diffusion Tensor Imaging
Diffusion tensor imaging was used to assess white matter maturation and axonal tract integrity using a
b-value = 1000 s/mm
2 across 30 directions and a 2 mm isotropic voxel. Diffusion-weighted echoplanar images (EPIs) were assessed in FSL 5.0 for fractional anisotropy (FA), mean diffusivity (MD), axial diffusivity (AD), and radial diffusivity (RD) using methods previously described [
42]. The pig brain atlas was used for assessment of the following regions of interest: caudate, corpus callosum, cerebellum, both hippocampi, internal capsule, left and right cortex, thalamus, DTI-generated white matter, and atlas-generated white matter using a customized pig analysis pipeline and the FSL software package. The diffusion toolbox in FSL was used to generate values of AD, RD, MD, and FA. In the corresponding results, atlas-generated white matter indicates the use of white matter prior to using probability maps from the pig brain atlas that were used as a region of interest mask. Likewise, DTI-generated white matter indicates a threshold of 0.2 was applied to FA values, thus restricting analysis to white matter tracts. Masks for each ROI from the atlas were non-linearly transformed into the MPRAGE space of each individual pig and a linear transform was then applied to transfer each ROI into DTI space. A threshold of 0.5 was applied to each ROI, and the data were dilated twice. For each individual ROI, an FA threshold of 0.15 was applied to ensure that we included only white matter in that region of interest despite the mask expansion.
2.4.3. Magnetic Resonance Spectroscopy
Magnetic resonance spectroscopy was used to non-invasively quantify metabolites in the whole brain. The MRS spin-echo chemical shift sequence was used with a voxel size of 20 mm × 23 mm × 13 mm and centered over the left and right dorsal hippocampi. The following sequence parameters were used in acquisition of spectroscopy data for the water-suppressed scan: TR = 1800 ms; TE = 68 ms; signal averages = 256; vector size = 1024. The following sequence parameters were used in acquisition of spectroscopy data for the non-water-suppressed scan: TR = 20,000 ms; TE = 68 ms; signal averages = 1; vector size = 1024 point. Both water-suppressed and non-water-suppressed data were collected in institutional units, and all MRS data were analyzed with LC Model (version 6.3) using methods previously described [
41]. Limits were placed on MRS data for inclusion in the statistical analysis. Cramer–Rao lower bounds (i.e., % standard deviation) were calculated using LC Model and only metabolites with a standard deviation less than 20% were considered to have reliable quantitative results of absolute levels.
2.5. Hippocampal Gene Expression
Approximately 20 mg of hippocampal tissue was introduced in a Lysing Matrix D tube (MP Biomedicals, Santa Ana, CA, USA), placed on ice, and 650 µL of lysis buffer (Agencourt RNAdvance Tissue Kit, Beckman Coulter, Indianapolis, Indiana, USA) was added. Tubes were agitated for 2 × 1 min at speed 6 on FastPrep®-24 (MP Biomedicals, Santa Ana, CA, USA), and 400 µL of lysate was then extracted using the Agencourt RNAdvance Tissue Kit (Beckman Coulter, Indianapolis, IN, USA) following the manufacturer’s recommendations. RNA were quantified using the Quant-iT™ RiboGreen™ RNA Assay Kit (Invitrogen, Carlsbad, CA, USA) on a Spectramax M2 (Molecular Devices, Sunnyvale, CA, USA). RNA quality assessment was completed using a Fragment Analyzer 96 with Standard Sensitivity RNA Analysis Kit (15 nt) (Advanced Analytical Technologies, Inc., Ankeny, IA, USA). Relative mRNA copy number on 93 genes was quantified using the NanoString nCounter™ system (NanoString Technologies Inc., Seattle, WA, USA) according to the manufacturer’s instructions using 100 ng of RNA as the starting amount. Using nSolver software (Version 4.0, NanoString Technologies Inc., Seattle, WA, USA), background subtraction using the median of all eight negative controls was followed by positive control normalization using the geometric mean of six positive controls and housekeeping normalization using the geometric mean of six housekeeping genes.
2.6. Statistical Analysis
Data analysis was conducted using the GLIMMIX procedure of SAS Enterprise Guide 7.1 (SAS Institute, Cary, NC, USA). All data were subjected to a one-way analysis of variance to assess the effect of dietary treatment. The cohort of pigs was included in the model as a random variable. For all variables, observations with a studentized residual greater than |3| were considered outliers and removed from that variable only. Distribution of data was assessed visually using diagnostic plots (e.g., QQ plots). However, formal tests for normality were not conducted, given that ANOVA is robust towards non-normality. For behavioral data, pigs that exhibited little exploration of either object (i.e., less than 2 s of exploration of the sample or novel objects) were considered non-compliant and their recognition index was not measured in the test phase (final sample size: 1 h delay; CON, n = 9; OF, n = 12; OF + 2′-FL, n = 10; 2-d delay; CON, n = 10; OF, n = 11, OF + 2′-FL, n = 10), but all other exploration measures were included for those subjects. Inclusion of non-compliant animals tends to misrepresent the true effect of the task, as only animals that explore an object should be tested for memory of a previously explored object. Variables from the sample phases from the 1 and 48 h delay paradigms were averaged to create sample phase exploration measures (e.g., total time visiting objects during the sample phase in the 1 and 48 h delay were average to create a single measure). To test for recognition memory, a one-sample t-test was conducted comparing the recognition index to a null mean of 0.5. Groups with a mean recognition index significantly above 0.5 were considered to demonstrate recognition memory.
For individual brain region volume assessment, volume was expressed in both absolute (i.e., mm
3) and relative units (i.e., regional volume as a proportion of total brain volume, within subject). Gene expression data were standardized (mean of zero and standard deviation of one) and centered by the control group, thus all scores for the control group are zero. Statistical significance was defined at
p < 0.05 (insignificant results provided in
Supplemental Tables). Post-hoc comparisons for mean separation were conducted with a Tukey adjustment, and data are represented as least square means. Correlations between significant outcomes (MRI or gene expression) gene expression and the recognition index were conducted using the Pearson correlation coefficient for each diet and linear regression was used to assess the diet independent relationship between outcomes. Sample sizes for all variables assessed can be found in the
Supplemental Tables.
4. Discussion
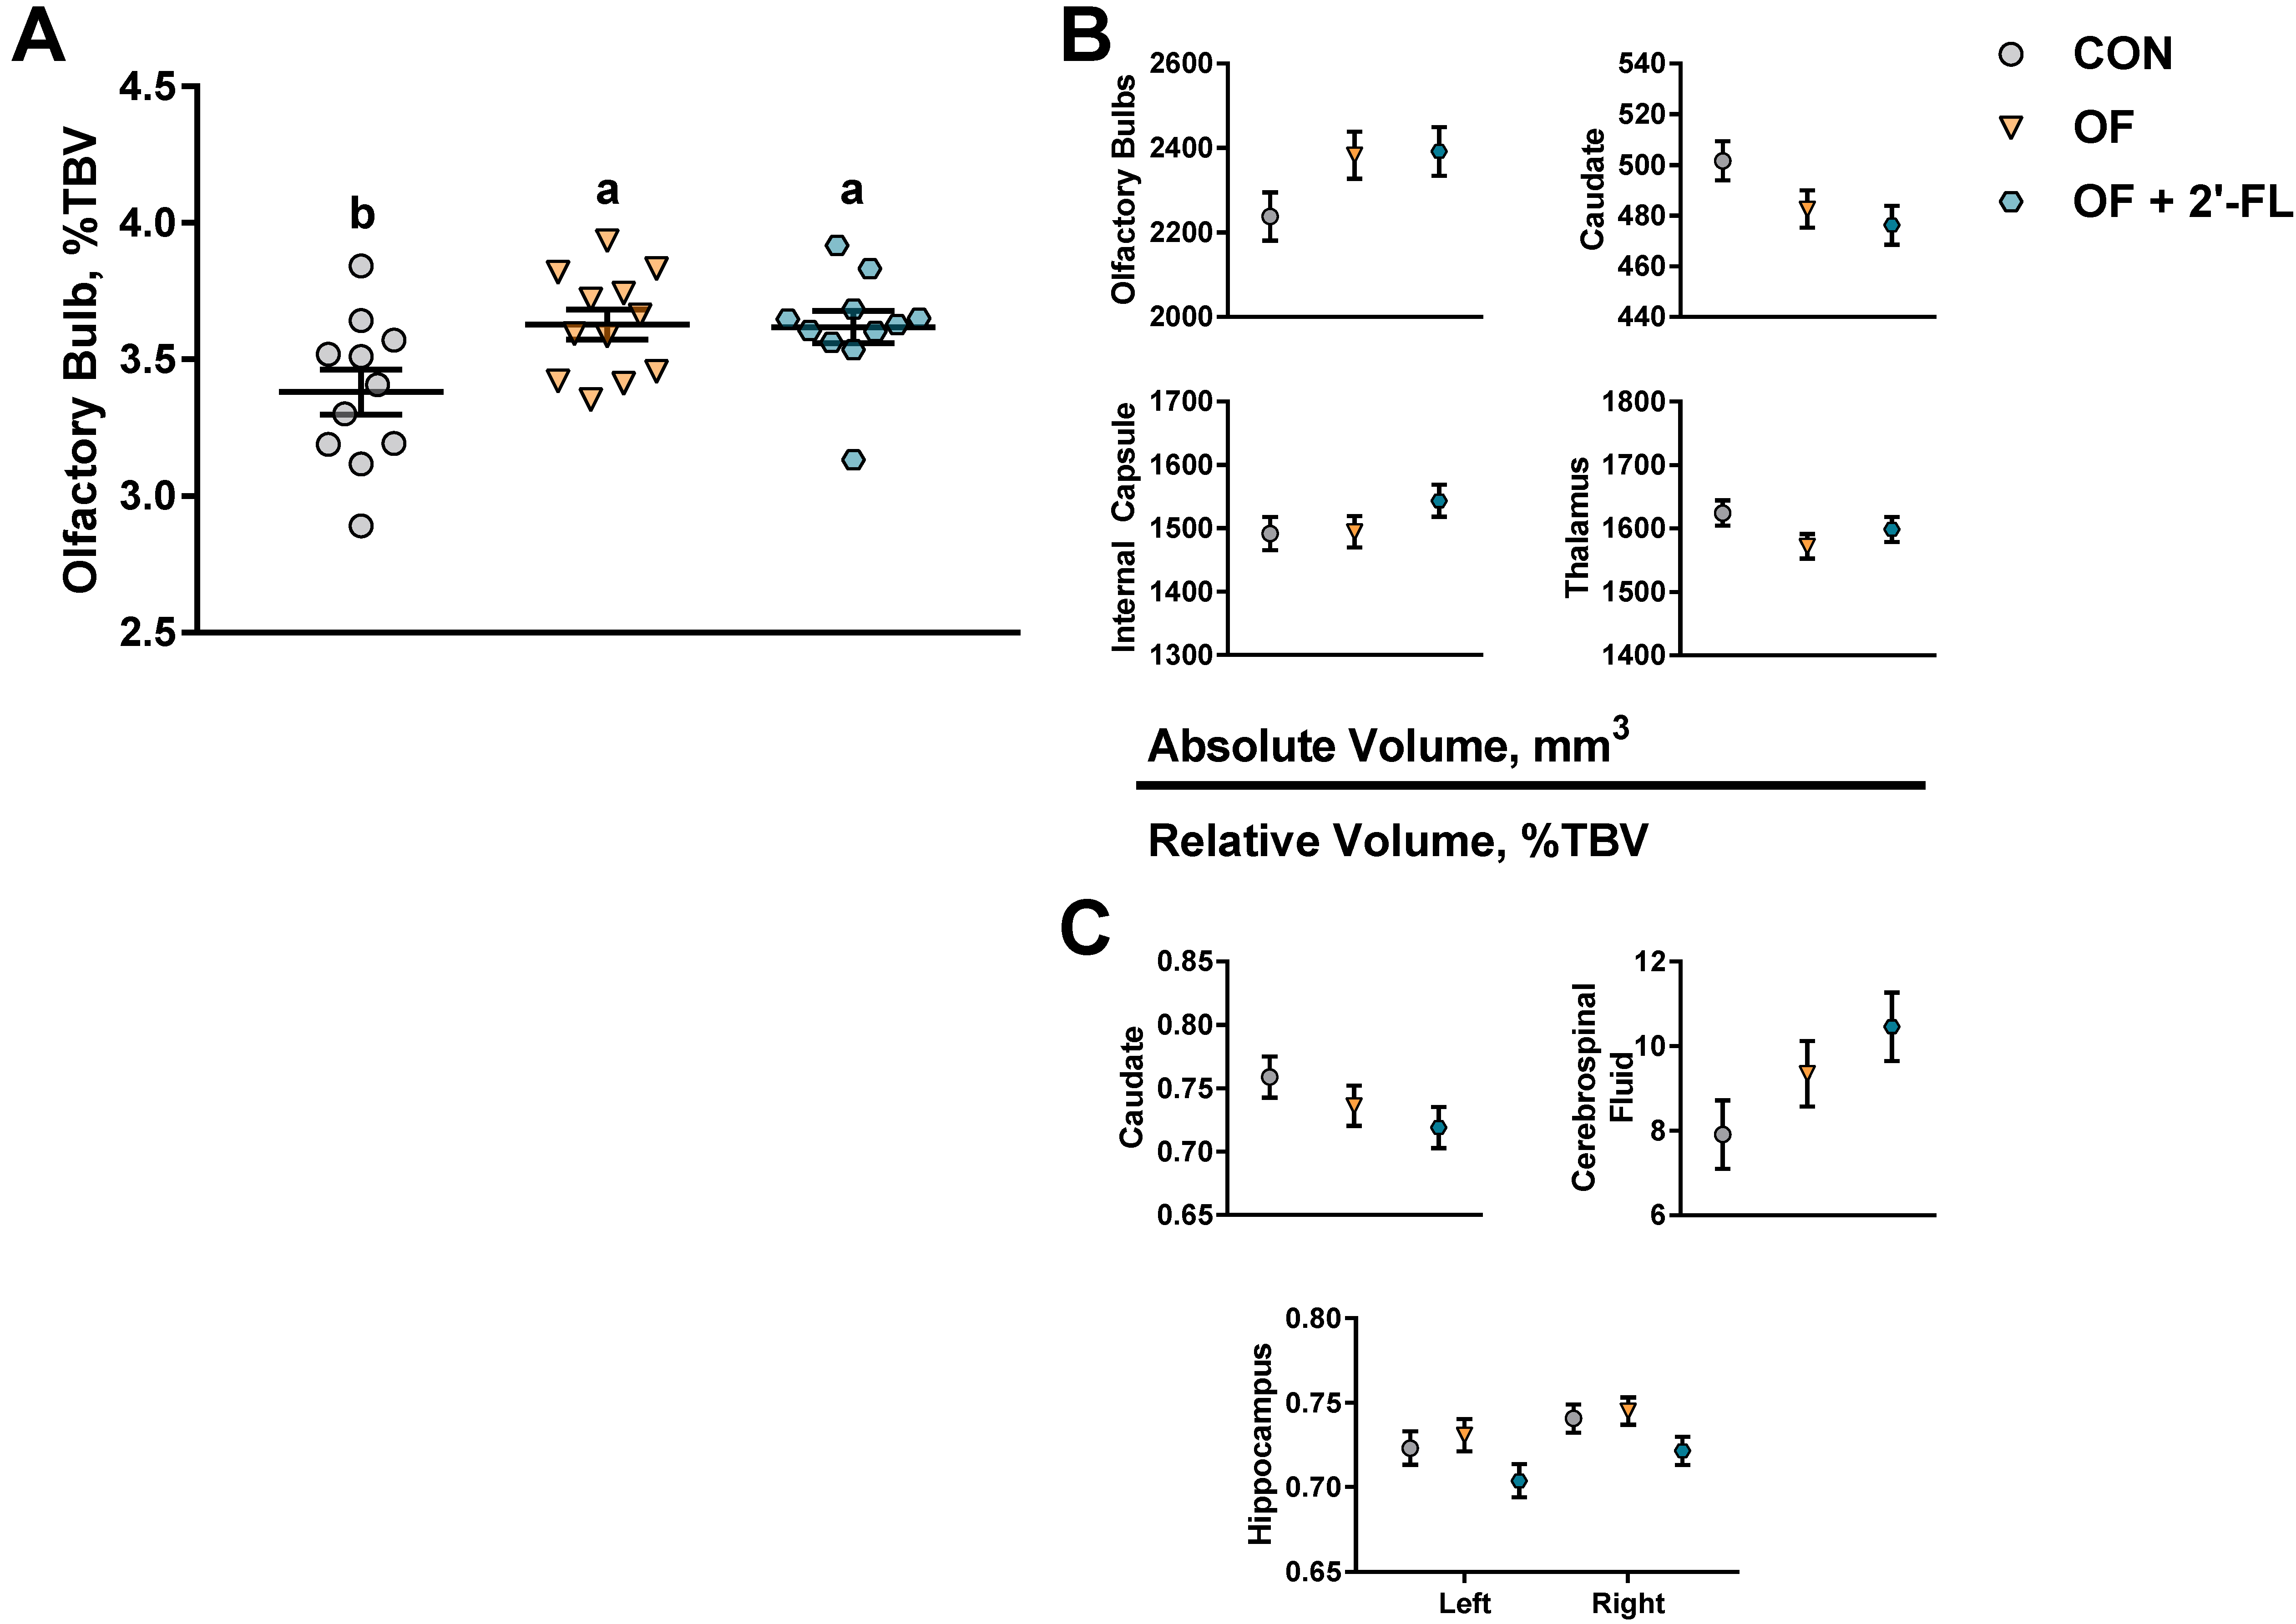
The objective of this study was to assess the effectiveness of OF alone or in combination with 2′-FL at altering recognition memory, brain structure, and hippocampal gene expression. Dietary intake of OF alone produced effects differential to that of OF + 2′-FL concerning recognition memory and hippocampal gene expression, yet both increased the relative volume of the olfactory bulbs compared to controls. An important limitation of the experimental design is the use of different doses for each source of oligosaccharide and lack of a full two-way ANOVA design, thus confounding the ability to delineate between dose and source effects. This choice was made to replicate the doses used from previous clinical trials, however [
11,
31,
32,
33]. Here, the analyzed concentration of OF in each group was 3.41–3.62 g/L, and 2′ FL was included in the combination at 1.12 g/L. This is in comparison to previous clinical trials investigating OF in infant formula at ranges from 3 to 5 g/L [
31,
32] and 2′ FL at ranges from 0.2 to 1.0 g/L [
11,
33]. Thus, the aim was to assess if there is additional benefit to the addition of 2′ FL in a formula already containing OF, using historically relevant doses for each OS. Still, this study adds to a growing body of literature suggesting that OS can alter behavior and neurobiology. However, the mechanisms of action remain unclear. While many OS have been cited as having such effects [
44], it is becoming clear that not all OS act similarly or with the same efficacy.
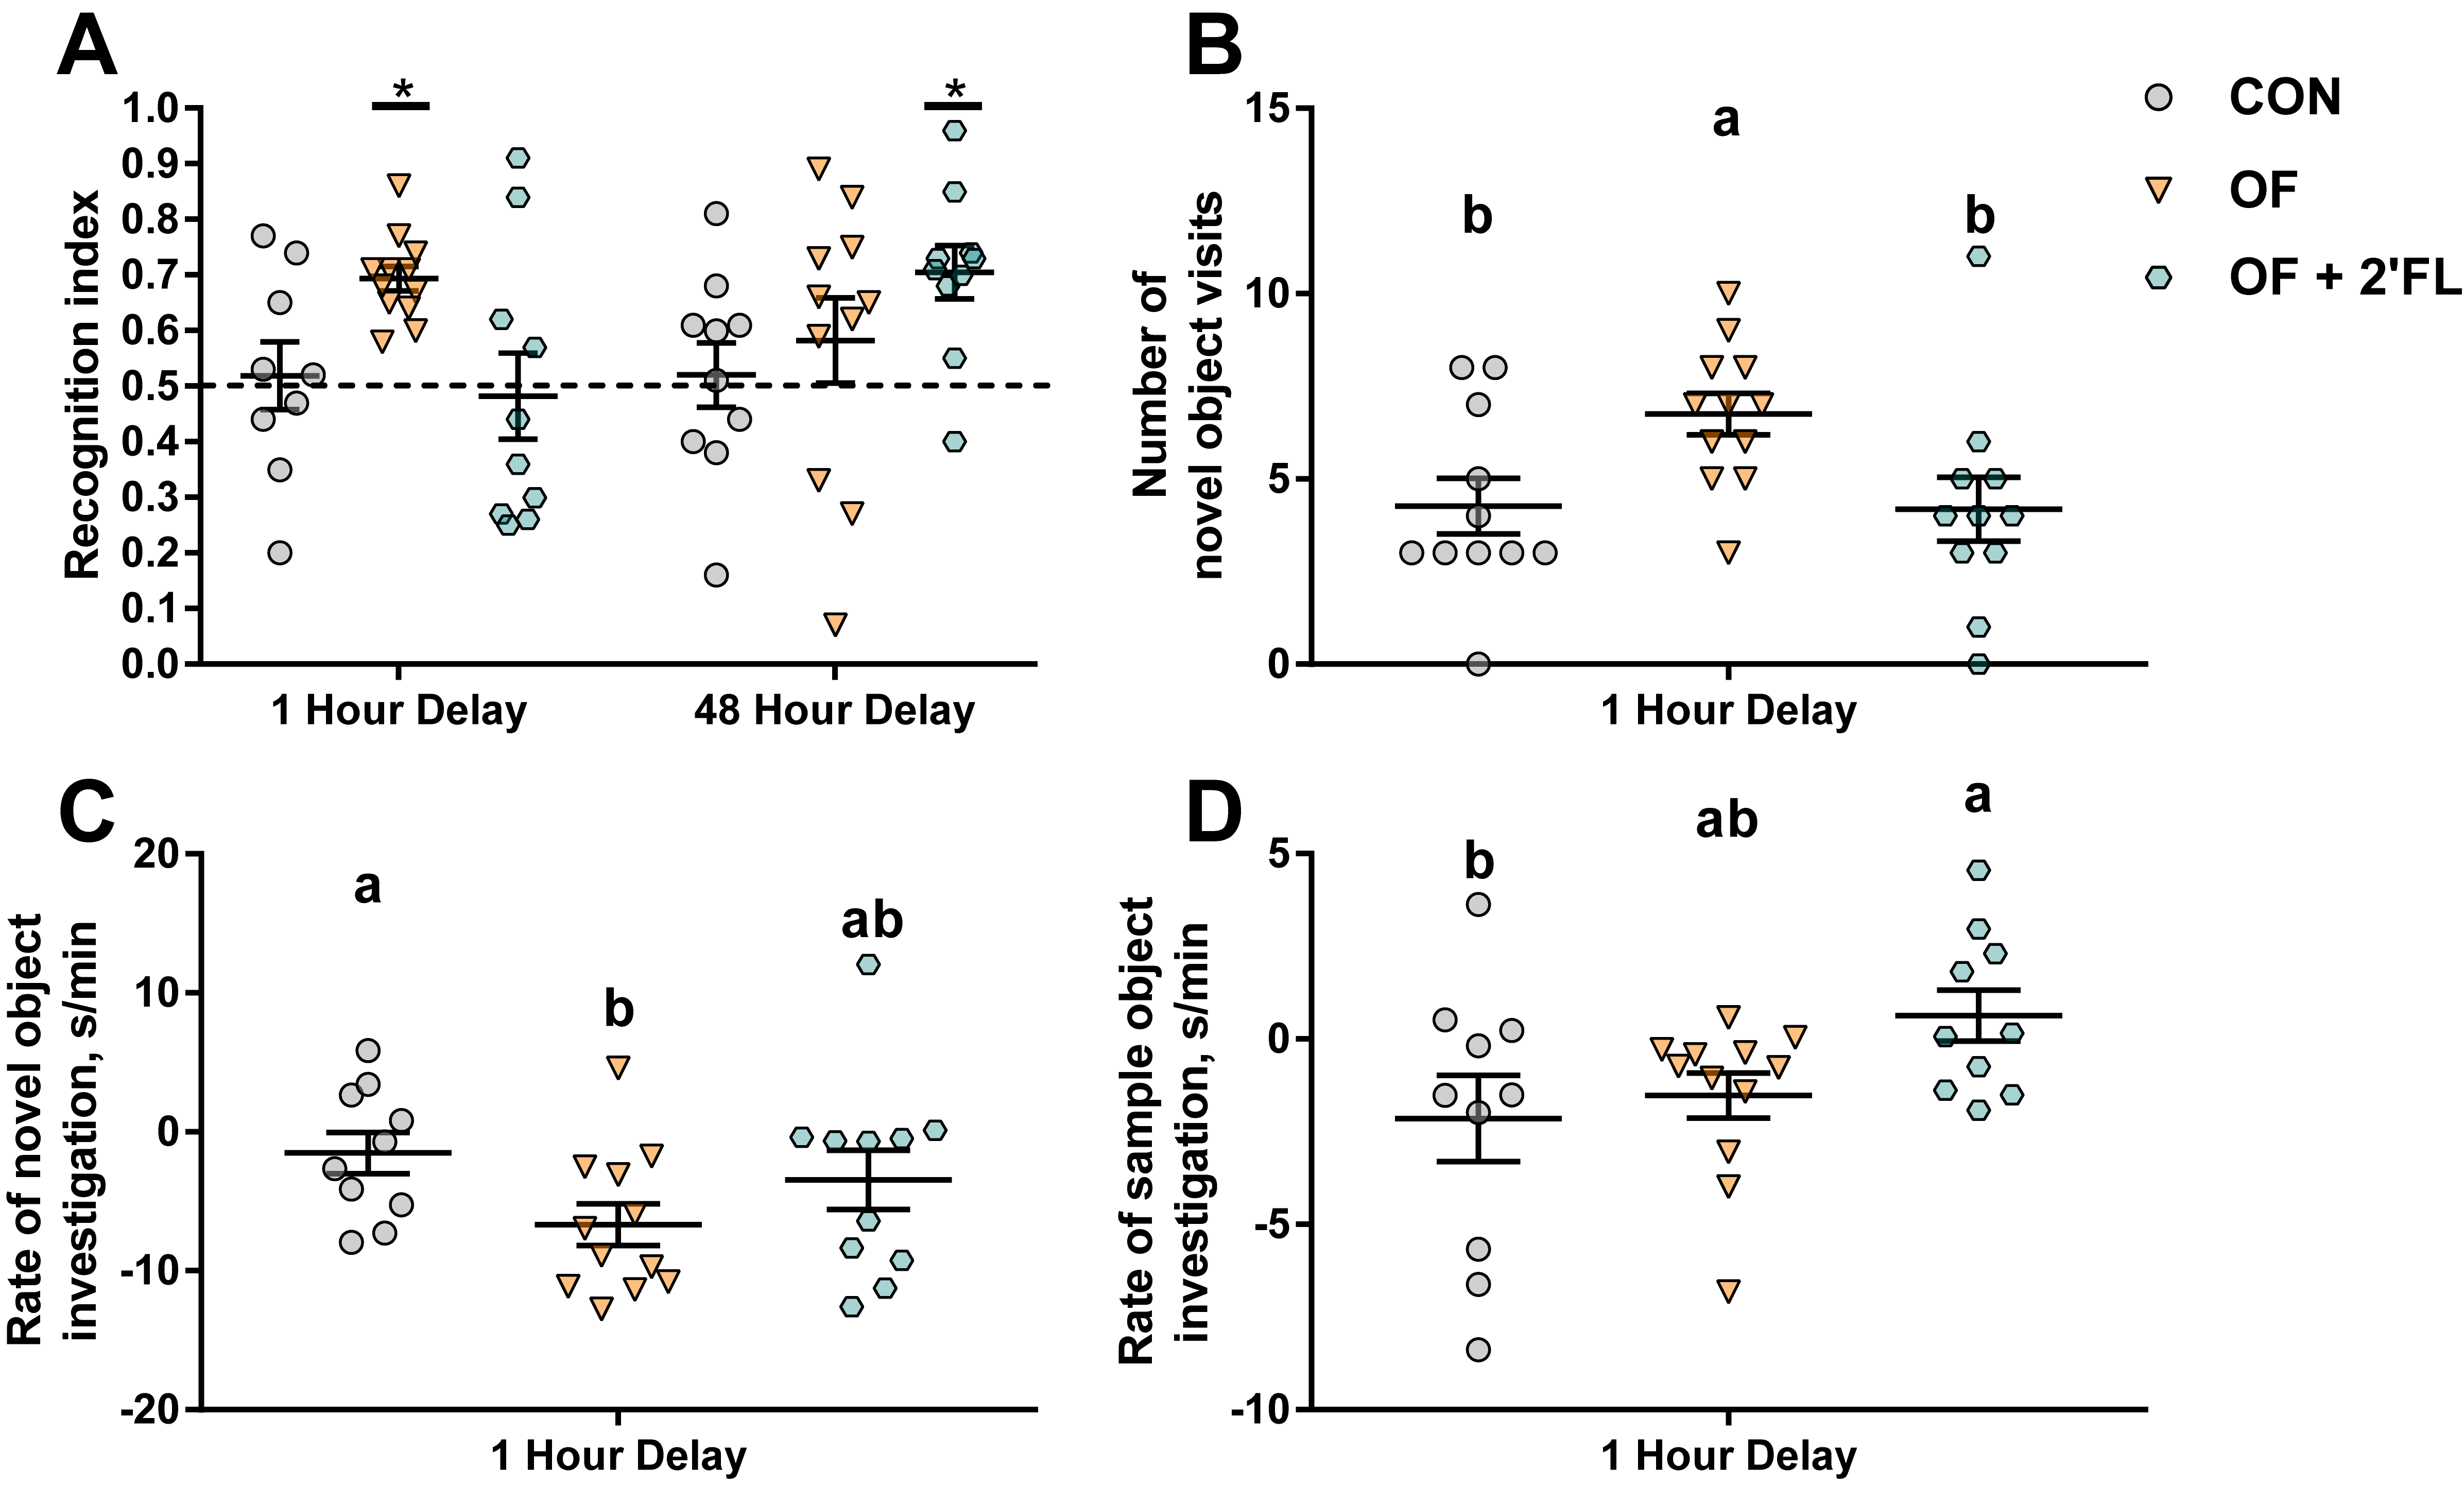
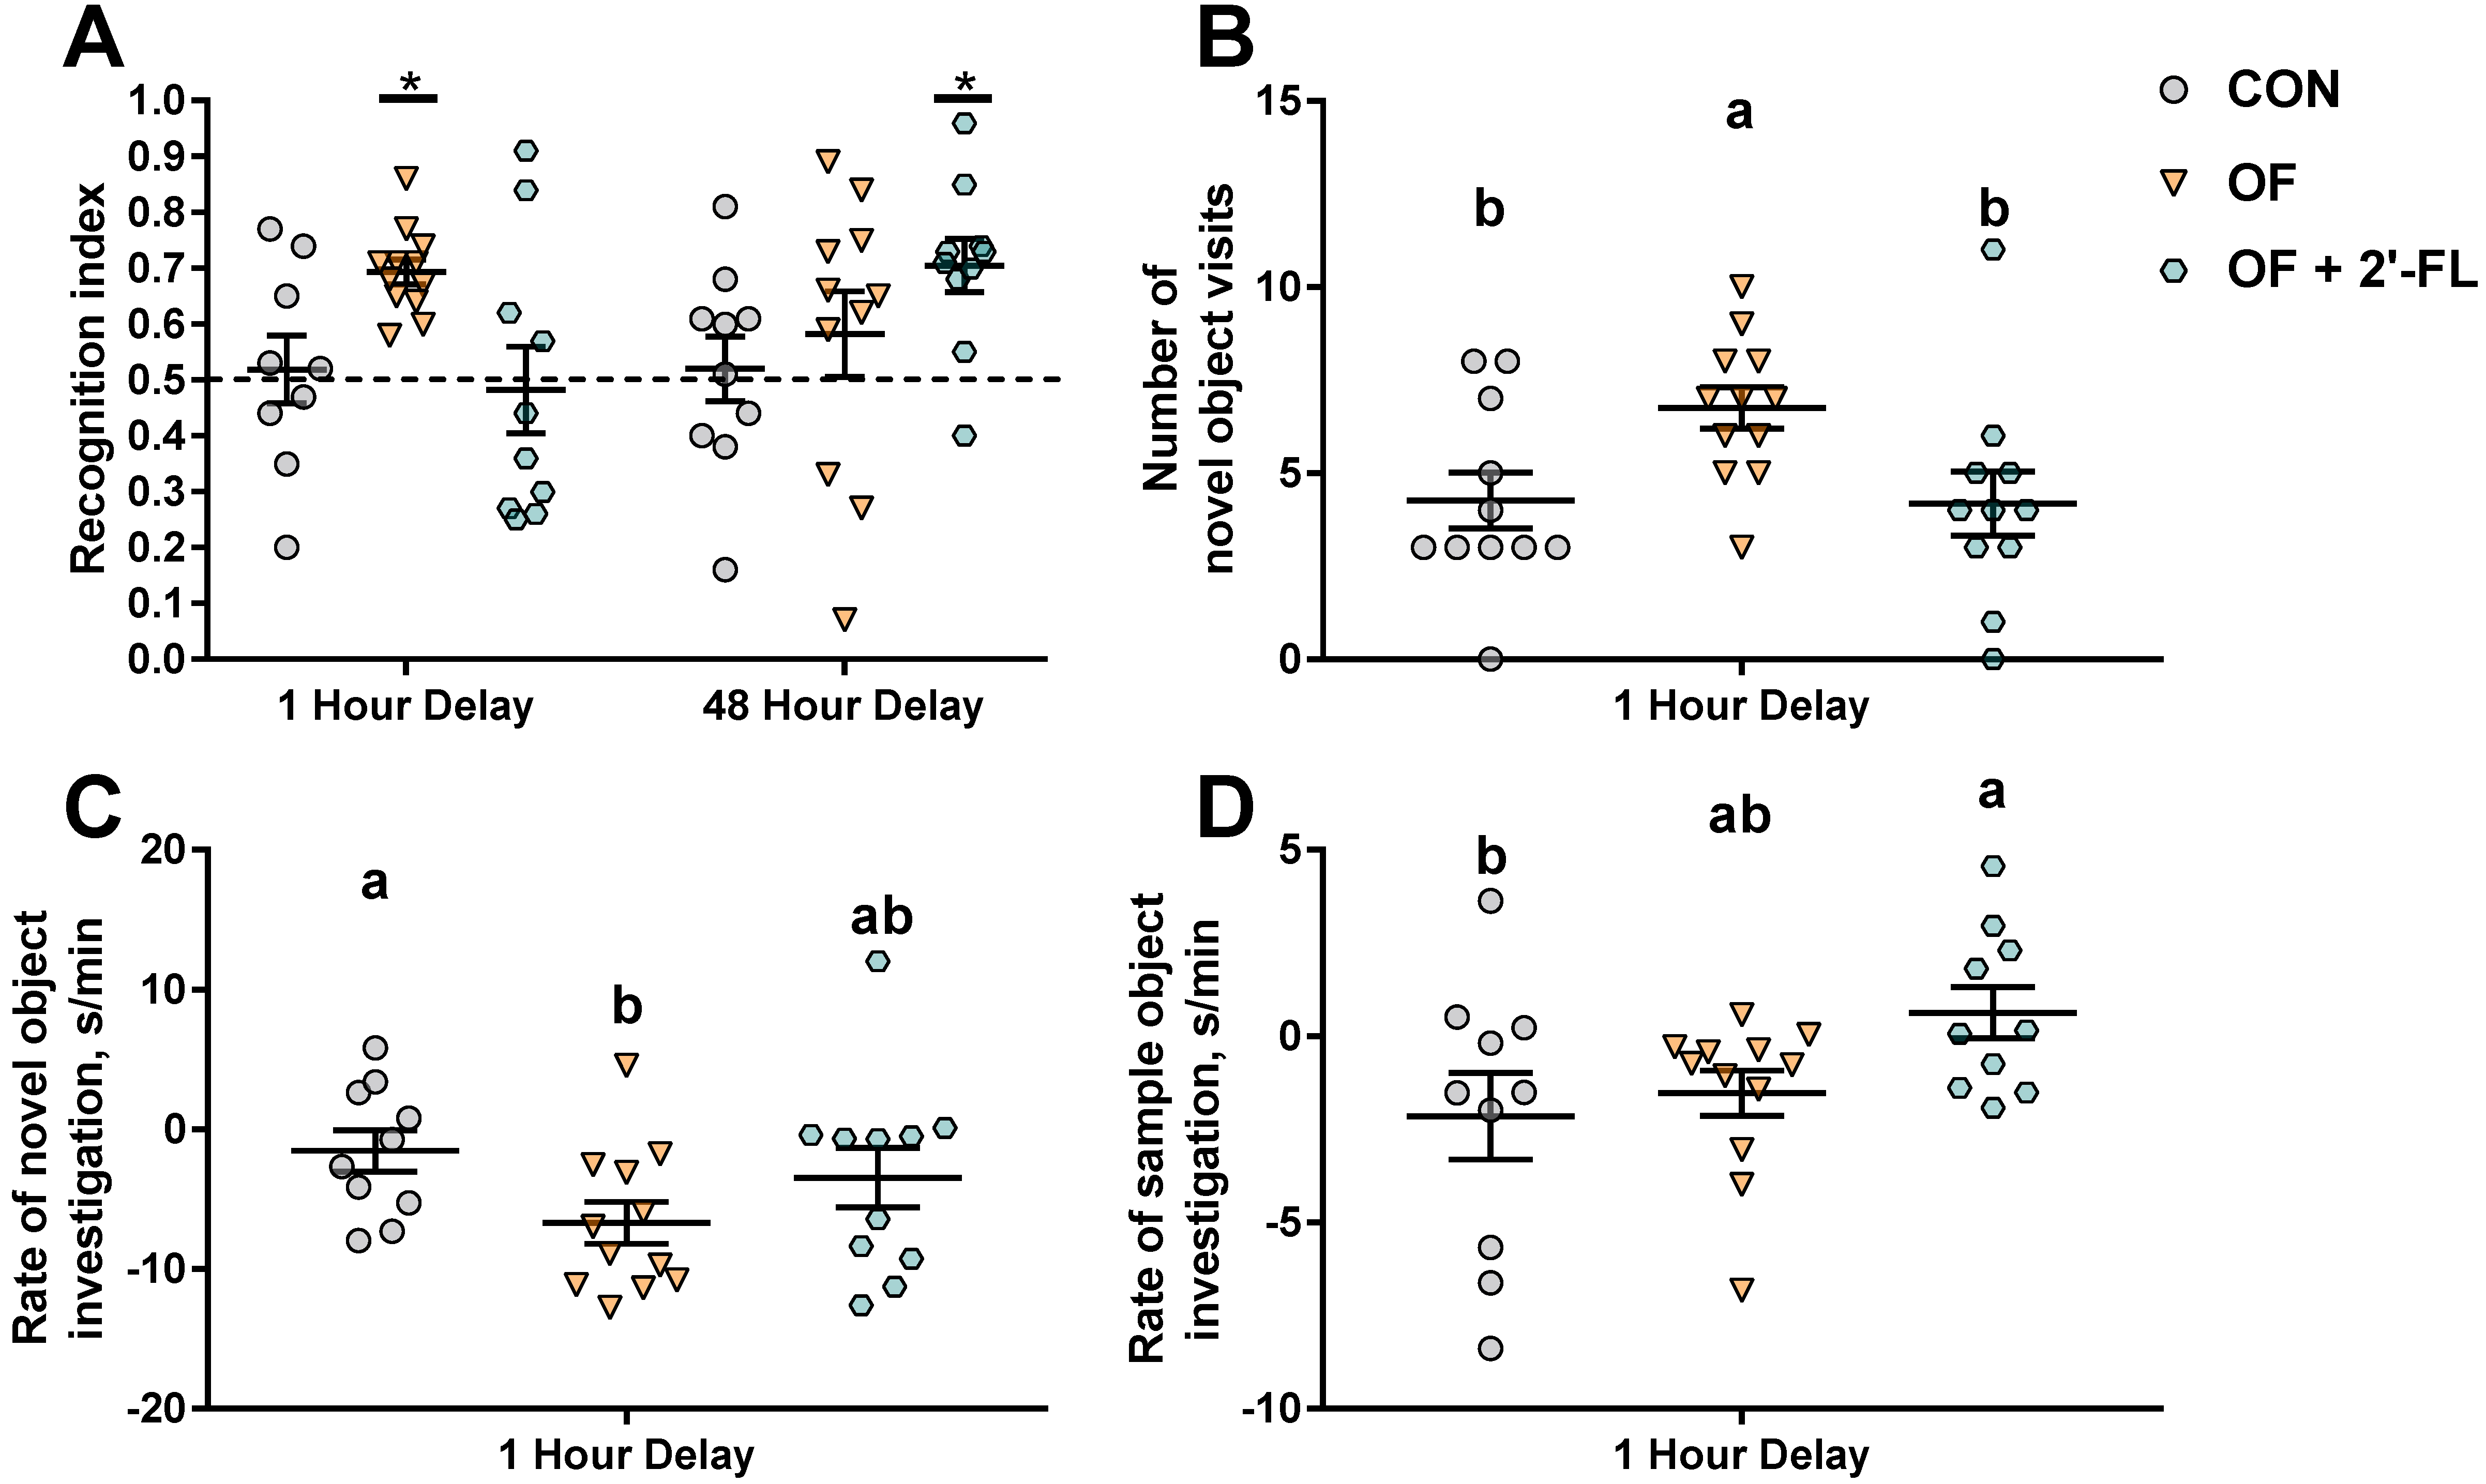
We chose to use the NOR task using two different delays to assess short-to-intermediate (1 h delay) and long-term (48 h delay) object recognition memory. While CON pigs failed to exhibit recognition memory after both the 1 and 48 h delays, pigs fed OF exhibited recognition memory after a 1 h delay, whereas pigs fed OF + 2′-FL exhibited recognition memory after a 48 h delay. Curiously, pigs fed the combination did not show an improvement in recognition memory after a 1 h delay, demonstrating specificity of the combination to improve type-specific recognition memory. This is potentially due to the requirement of the perirhinal cortex for short- but not long-term memory, and the role of the hippocampus in only long-term recognition memory [
45]. As speculated further below, this may also be related to the differences in molecular pathways used for short- and long-term memory.
Pigs fed OF displayed greater number of visits and quicker habituation to the novel object after a 1 h delay, whereas those fed OF + 2′-FL did not habituate to the sample object, but rather maintained a high rate of exploration throughout the trial. Aside from recognition memory, all groups behaved similarly (e.g., total distance moved, frequency, total duration, and mean length of object visits) after a 48 h delay. Though it may appear concerning that the control group was unable to complete the task, we have previously reported a similar phenomenon wherein pigs fed a diet without prebiotics (polydextrose and galactooligosaccharide) could not demonstrate recognition memory [
21]. In a follow-up study where the control diet was then supplemented with those same prebiotics and the test diet supplemented further with sialyllactose, no differences in behavioral performance were observed [
39]. Given that recognition memory is measured behaviorally in a binary manner (presence or absence thereof), if the goal is to demonstrate a cognitive promoting effect of a nutrient, the use of a control group that is unable to complete the task is necessary to detect subtle improvements in recognition memory.
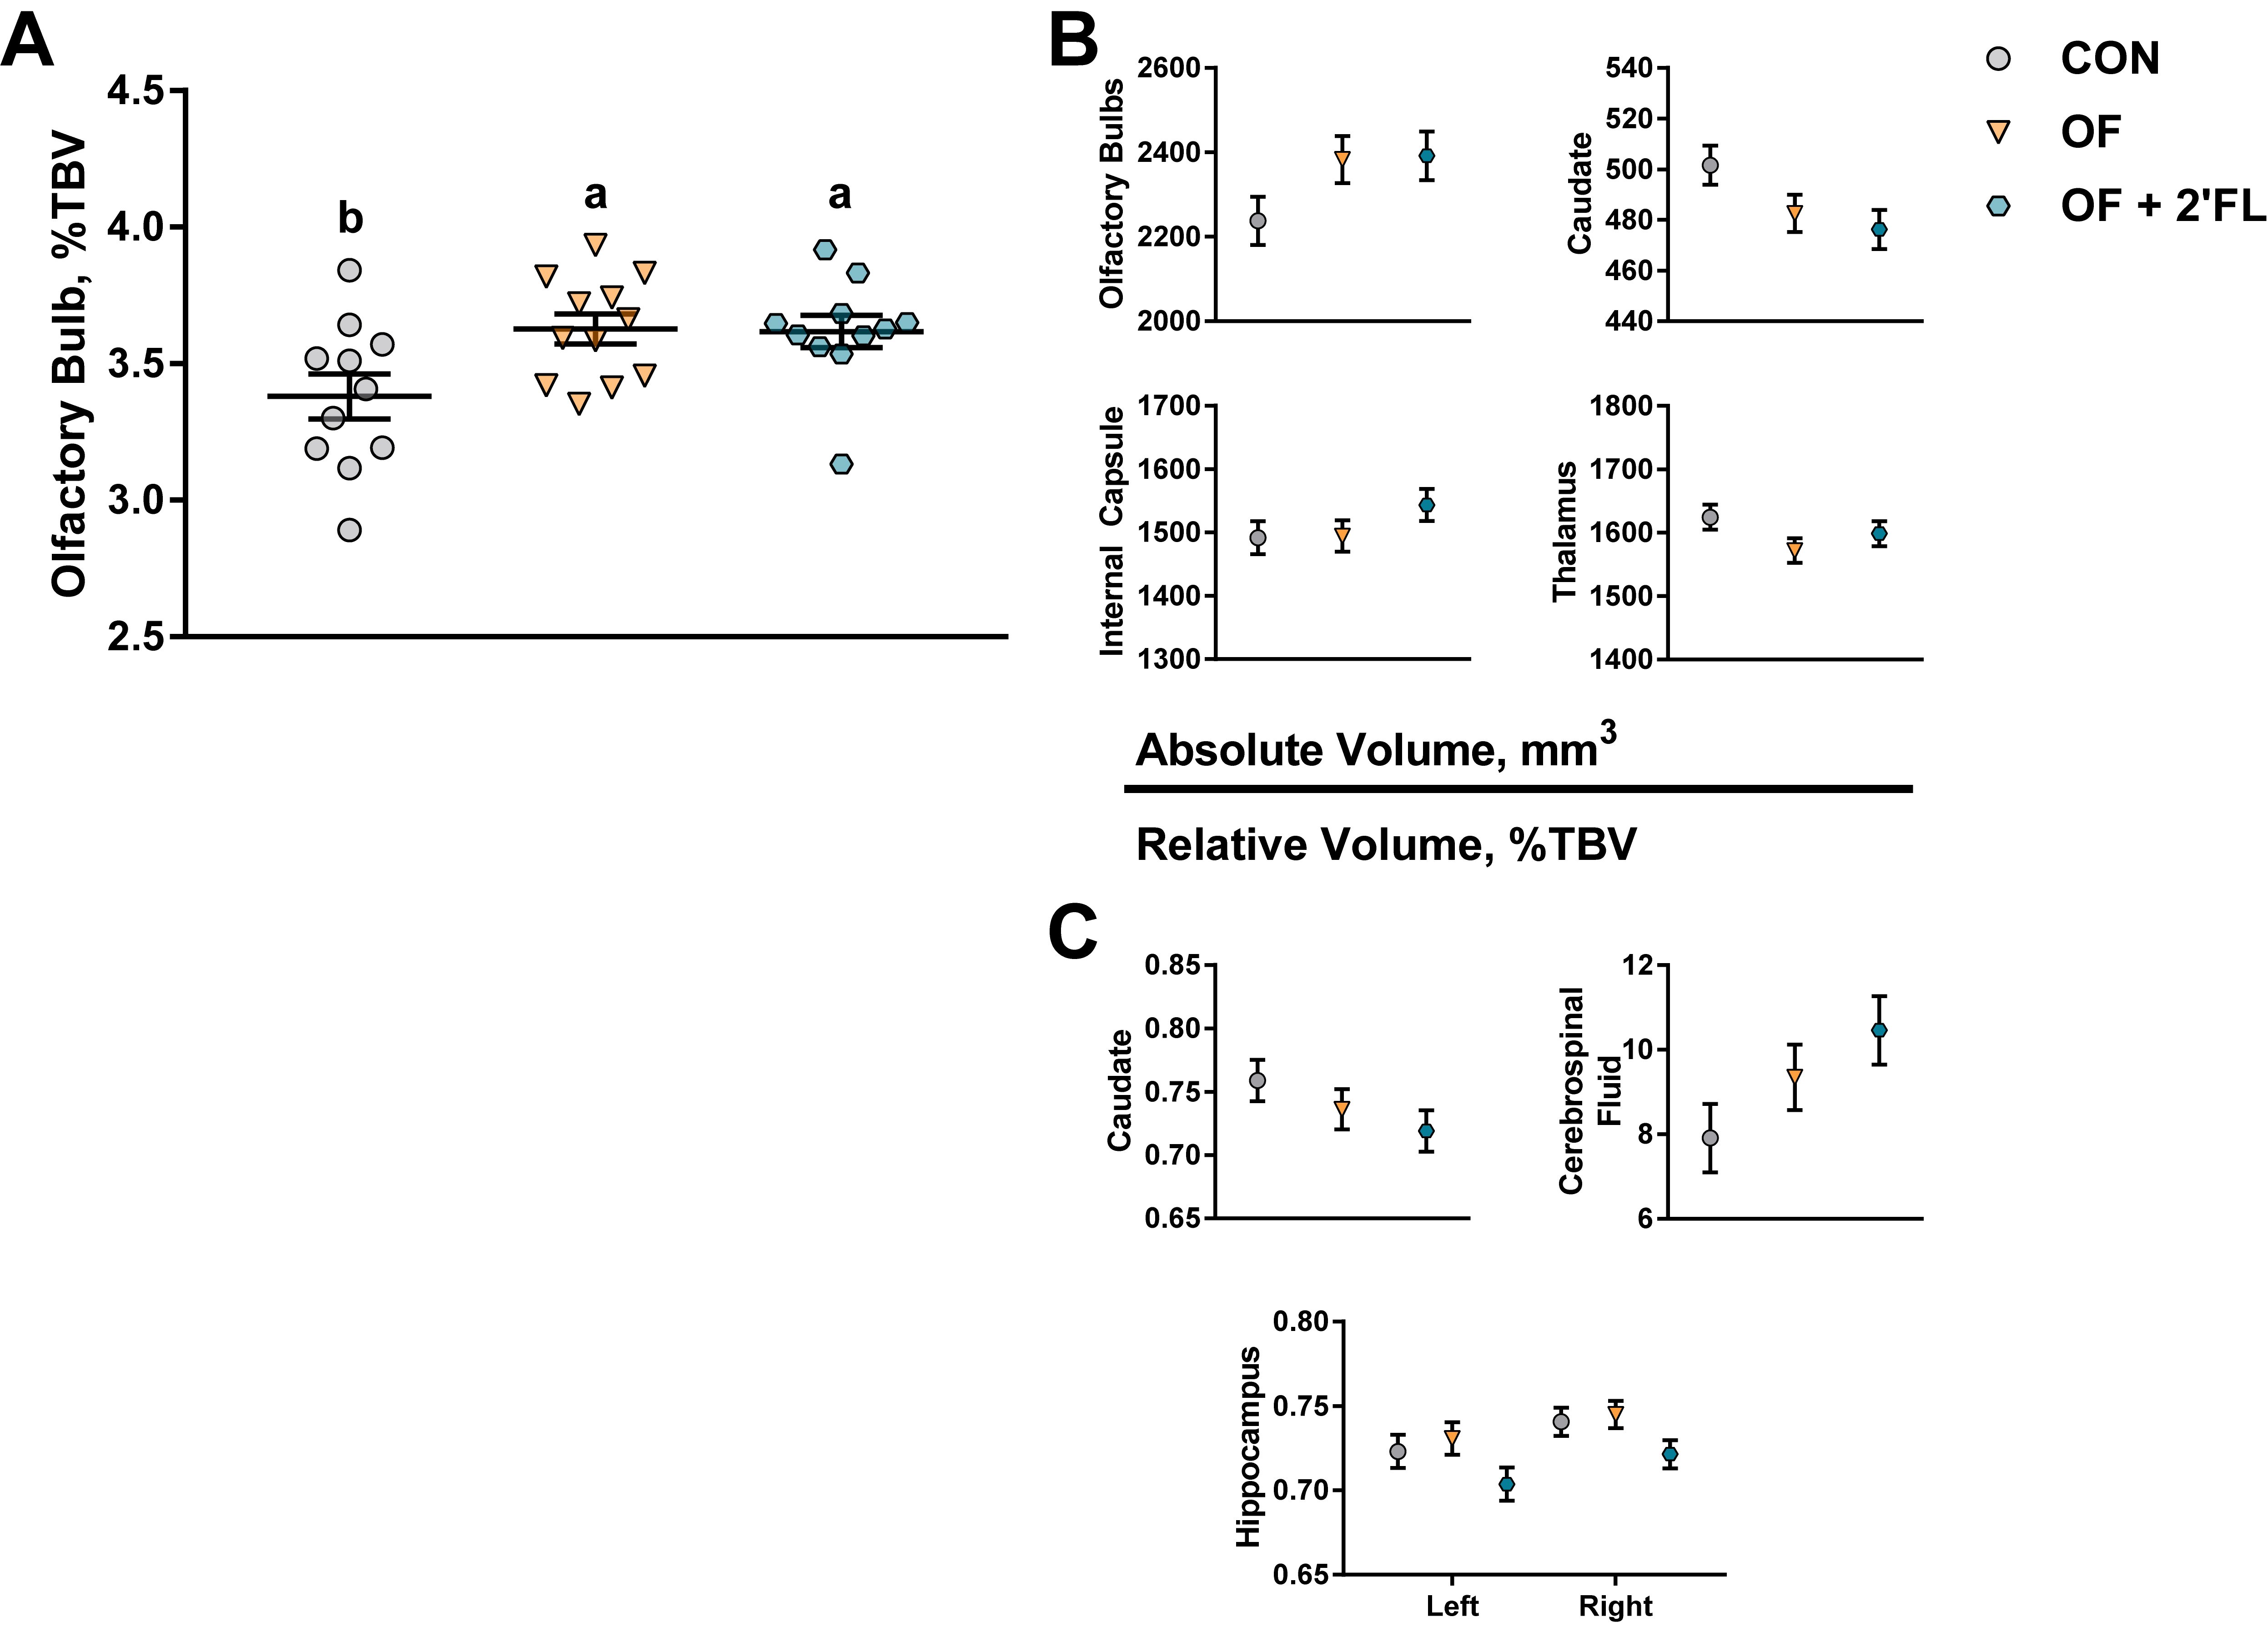
Where diet had a significant impact on behavioral outcomes, it had no impact on MRS or DTI outcomes, and of the 22 brain regions investigated, only the relative size of the olfactory bulbs was affected. In humans aged 1–17 years of age, absolute volume of the olfactory bulb increases with age, whereas the relative volume decreases continuously starting the first year of age [
46]. During this time, olfactory bulb function was correlated with olfactory bulb volume, with increasing volume correlated with increasing function [
46,
47]. Animals studies have also found that olfactory deprivation results in reduction in olfactory bulb size in opposums [
48] and vascular density in rats [
49], demonstrating a strong link between size and function. However, we found no relationship between recognition memory and relative olfactory bulb volume (
Supplemental Table S8), but a true test of olfactory function would be required to relate olfactory size and function in the pig.
Although the change in relative volume of the olfactory bulb was the only statistically significant outcome, a statistical trend for a change in volume of several brain regions warrants investigation. It is notable that all brain regions affected by the diet were subcortical. The absolute volumes of the caudate, internal capsule, and thalamus and the relative volumes of the caudate, cerebrospinal fluid, and both hippocampi were sensitive to diet. Although the volumes (absolute or relative) of the olfactory bulbs, caudate, and internal capsule are similar between OF and OF + 2′-FL groups, in the latter group, there was a trend for the relative volumes of the left and right hippocampi to be smaller compared to CON and OF groups. This further supports the emerging and consistent pattern where several measures (behavior, structural, or genetic) were divergently affected between OF and OF + 2′-FL groups. Hippocampal function has been traditionally associated with behavioral tasks requiring integration of spatial cues or retention of information over a long period of time. In regard to the novel object recognition task, a study in mice has shown that hippocampal lesion only impaired novel object recognition with a delay of 24 h but not with a delay of 5 min [
50]. It is only when recognition memory contains a spatial component (such as the context or location of a stimulus) or long delay that the hippocampus is required, otherwise recognition of “what” was seen requires the perirhinal cortex [
45]. It is therefore surprising to observe in the OF + 2′-FL group a trend toward a reduction in relative hippocampi volume (0.05 ≤
p < 0.1) concurrent with increased performance in the novel object recognition with a long delay (48 h). Here, the absolute volumes of the hippocampi were similar between groups. However, the relative decrease in volume in the OF + 2′-FL group may suggest a shift in the process of synaptogenesis and/or myelination. Conversely, given the stability between groups in absolute volume, it is possible that the reduction in relative volume of the hippocampi is an artifact of more significant growth in other brain regions.
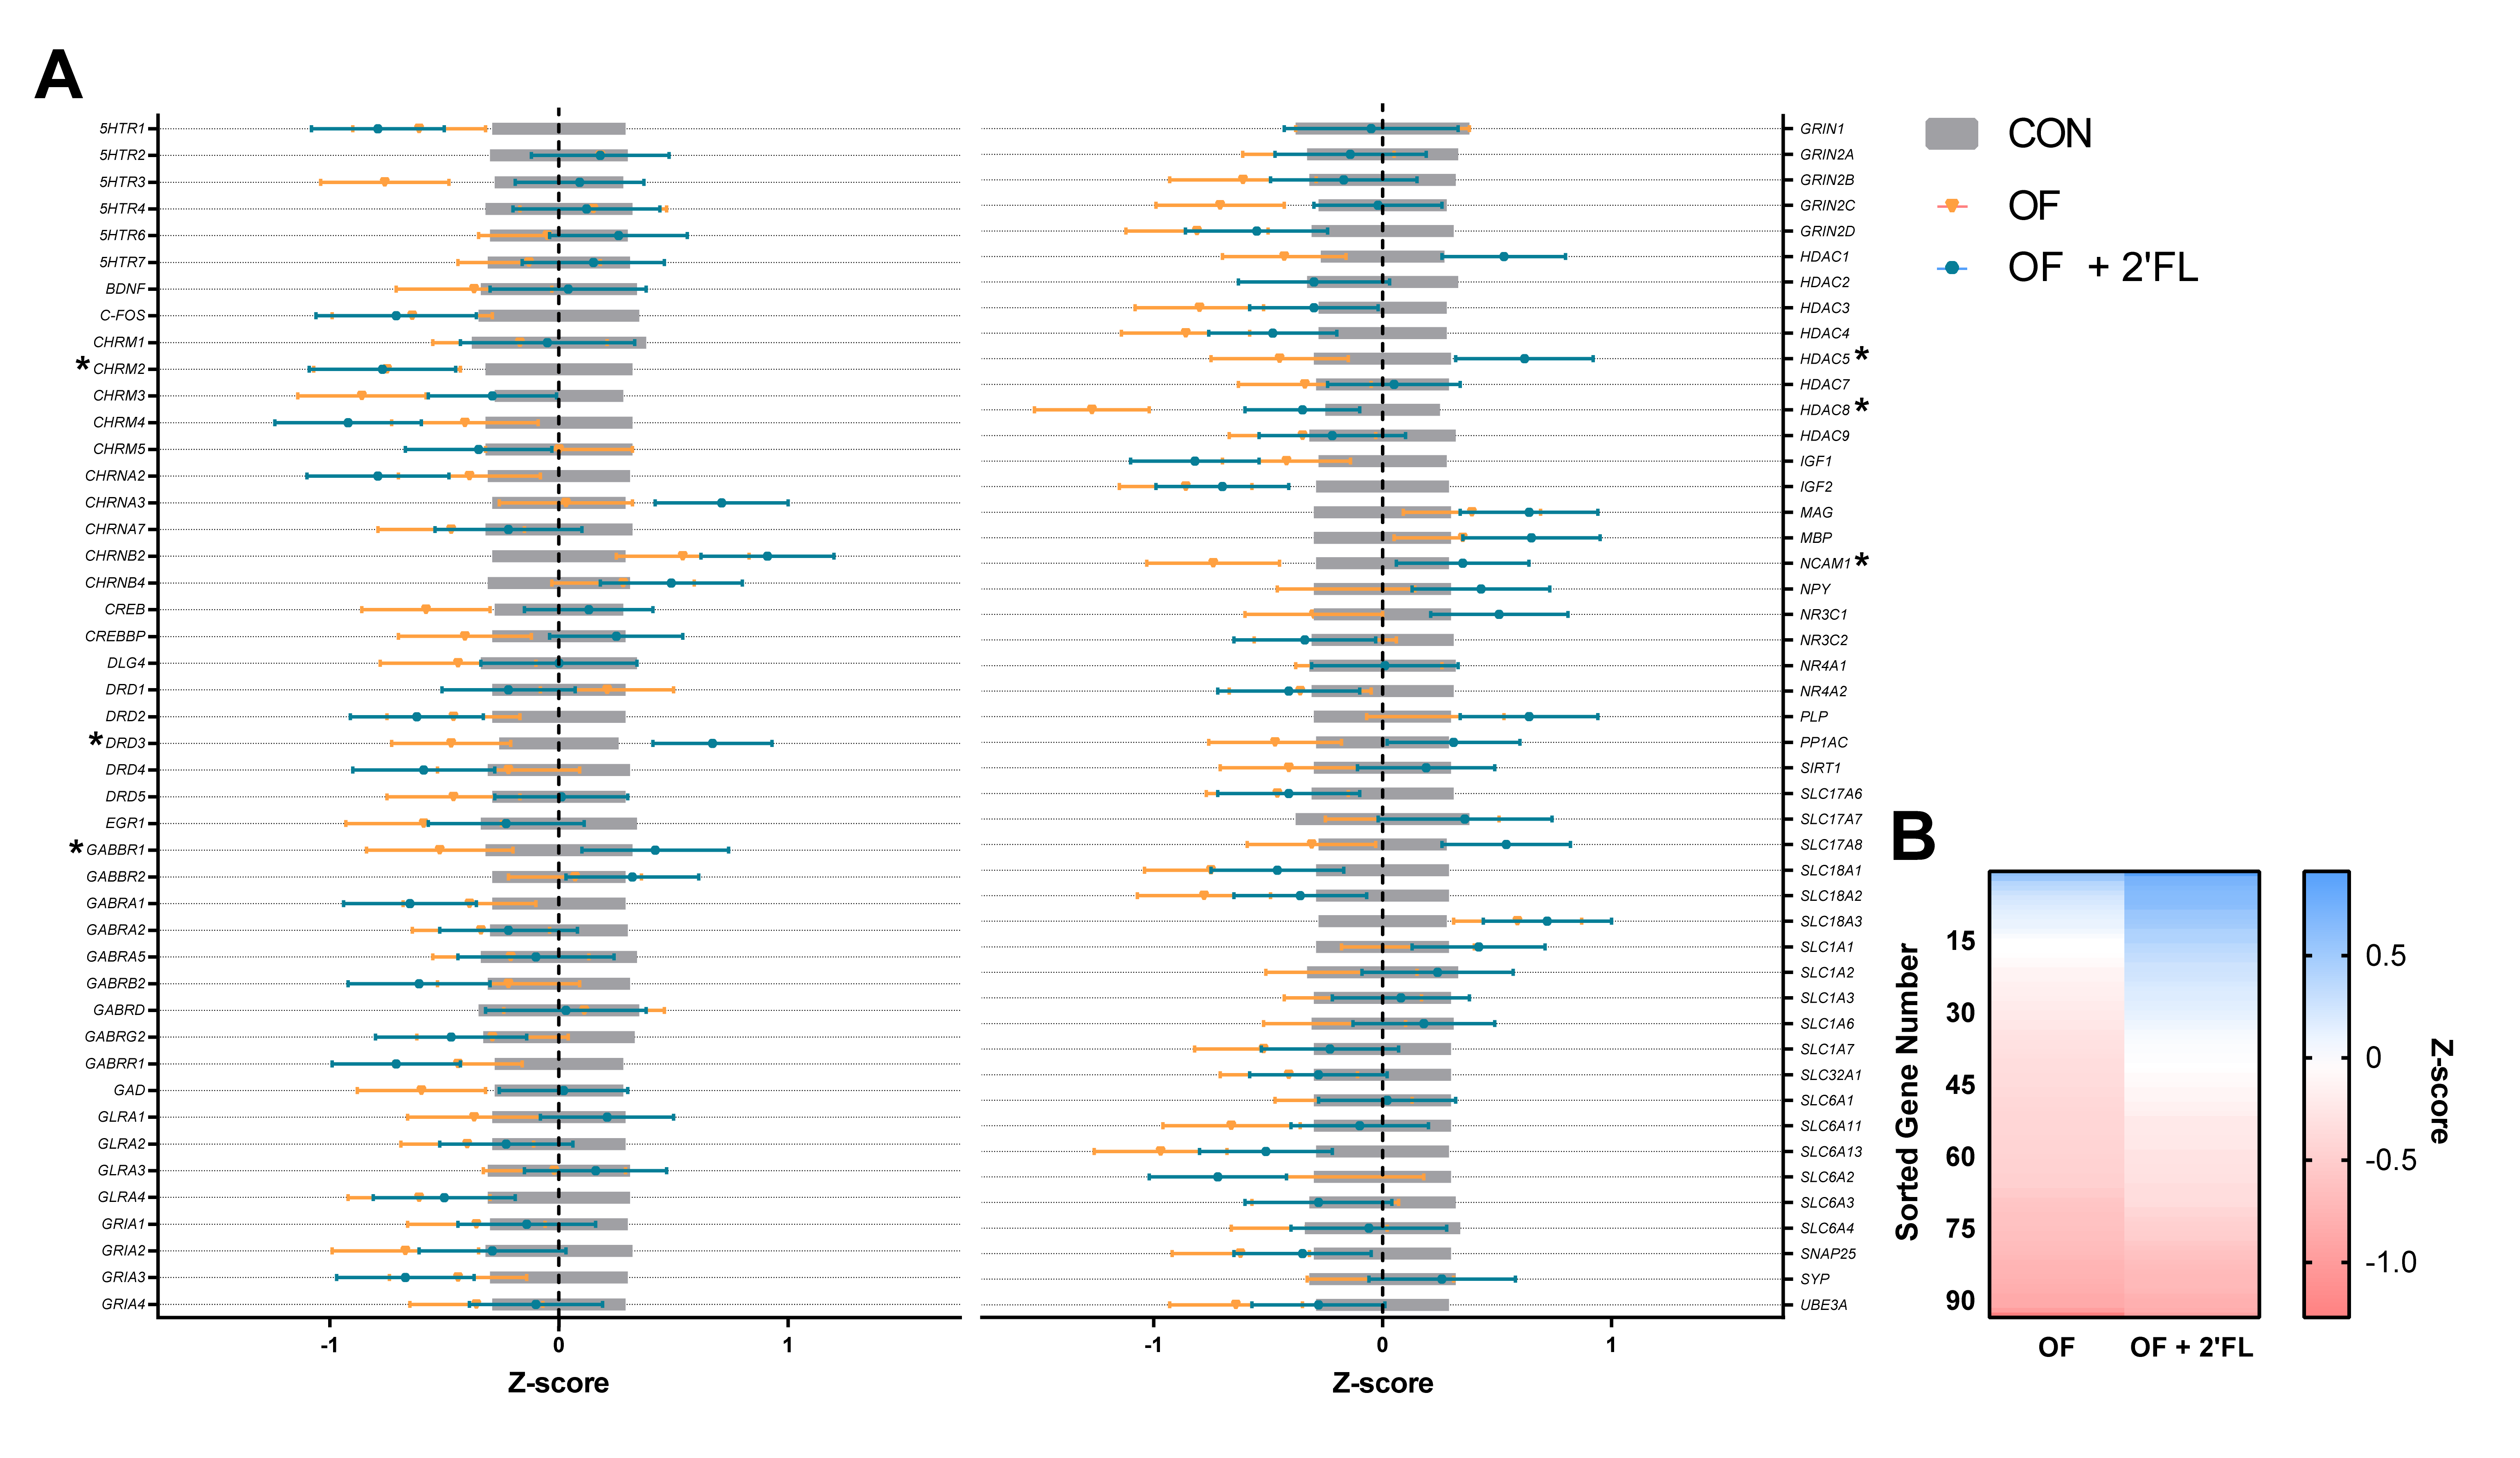
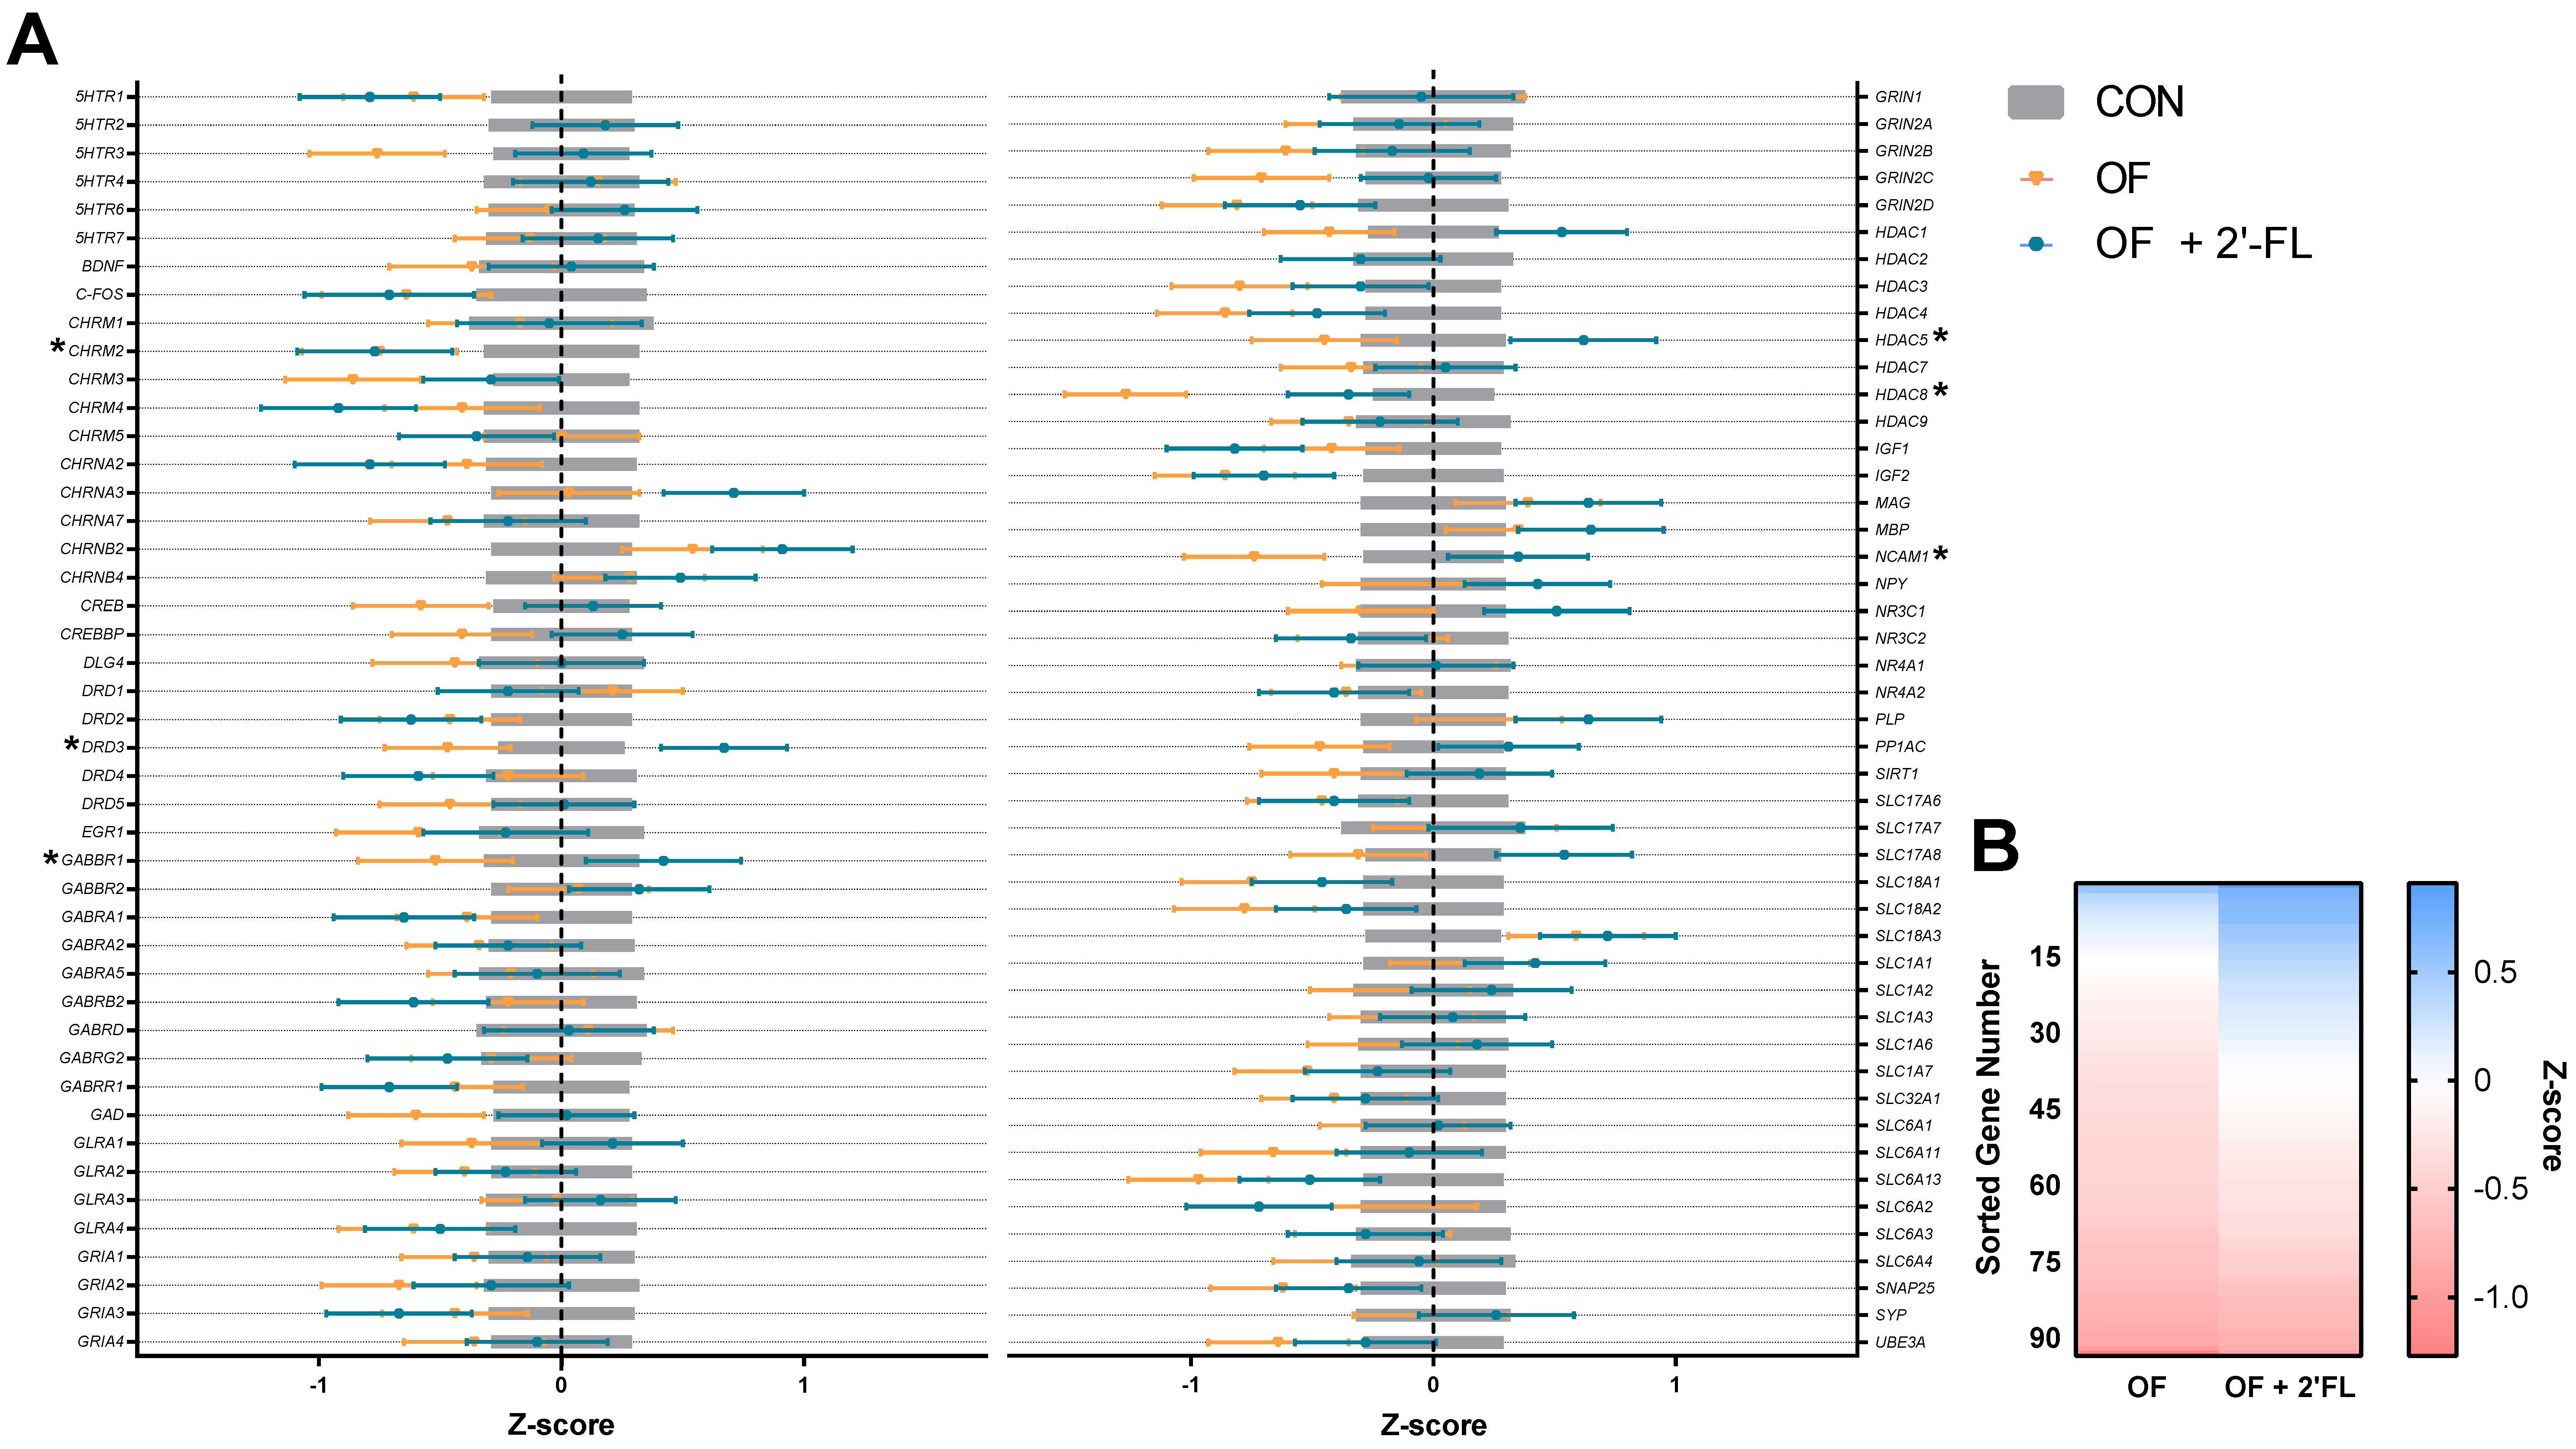
Of the genes affected by diet in the present study, it appeared that pigs fed OF displayed opposite effects of those fed OF + 2′-FL, and this is evident in the pattern shown in
Figure 6B. Overall, pigs fed OF demonstrated greater hippocampal downregulation as compared to controls than pigs fed OF + 2′-FL. Specifically, pigs fed OF displayed reduced gene expression of
DRD3,
GABBR1,
HDAC5/8,
NCAM1, and
CHRM2 relative to controls. Pigs fed OF + 2′-FL displayed increases in all of the previous genes except for
HDAC8 and
CHRM2. Although the magnitude of expression was similar for
CHRM2, a gene known to be related to cognition in humans [
51], the downregulation of
HDAC5 was greater for pigs fed OF than those fed OF + 2′-FL. Such a pattern may be related to the apparent difference in behavior observed in the NOR task, but it remains difficult to reconcile the differential effects of OF and OF + 2′-FL on gene expression given their apparent benefit to recognition memory.
Our results share some overlap with previous work examining GOS and FOS on cognition and gene expression. Oral gavage with 3 g/kg FOS or 4 g/kg GOS for 5 weeks has been shown to differentially alter BDNF, NMDAR, and plasma D-serine in adult male rats [
5]. BDNF and the glutamatergic NMDA receptor NR1 were greater in the hippocampus of those fed FOS, whereas NR1 was greater in the frontal cortex and NR2 greater in the hippocampus of those fed GOS. Interestingly, we did not see an increase in mRNA expression of
BDNF, any of the glutamate ionotropic receptor NMDA type subunits (
GRIN1,
GRIN2A/B/C/D), or α-amino-3-hydroxy-5-methyl-4-isoxazolepropionic acid (AMPA) type subunits (
GRIA1–4). We noted similar departures from rodent work in a previous study [
21], and these differences may be accounted for by a myriad of differences such as outcome (protein or mRNA expression), animal model (pig or rodent), and the relative difference in development over the course of a four week period between pigs and rodents.
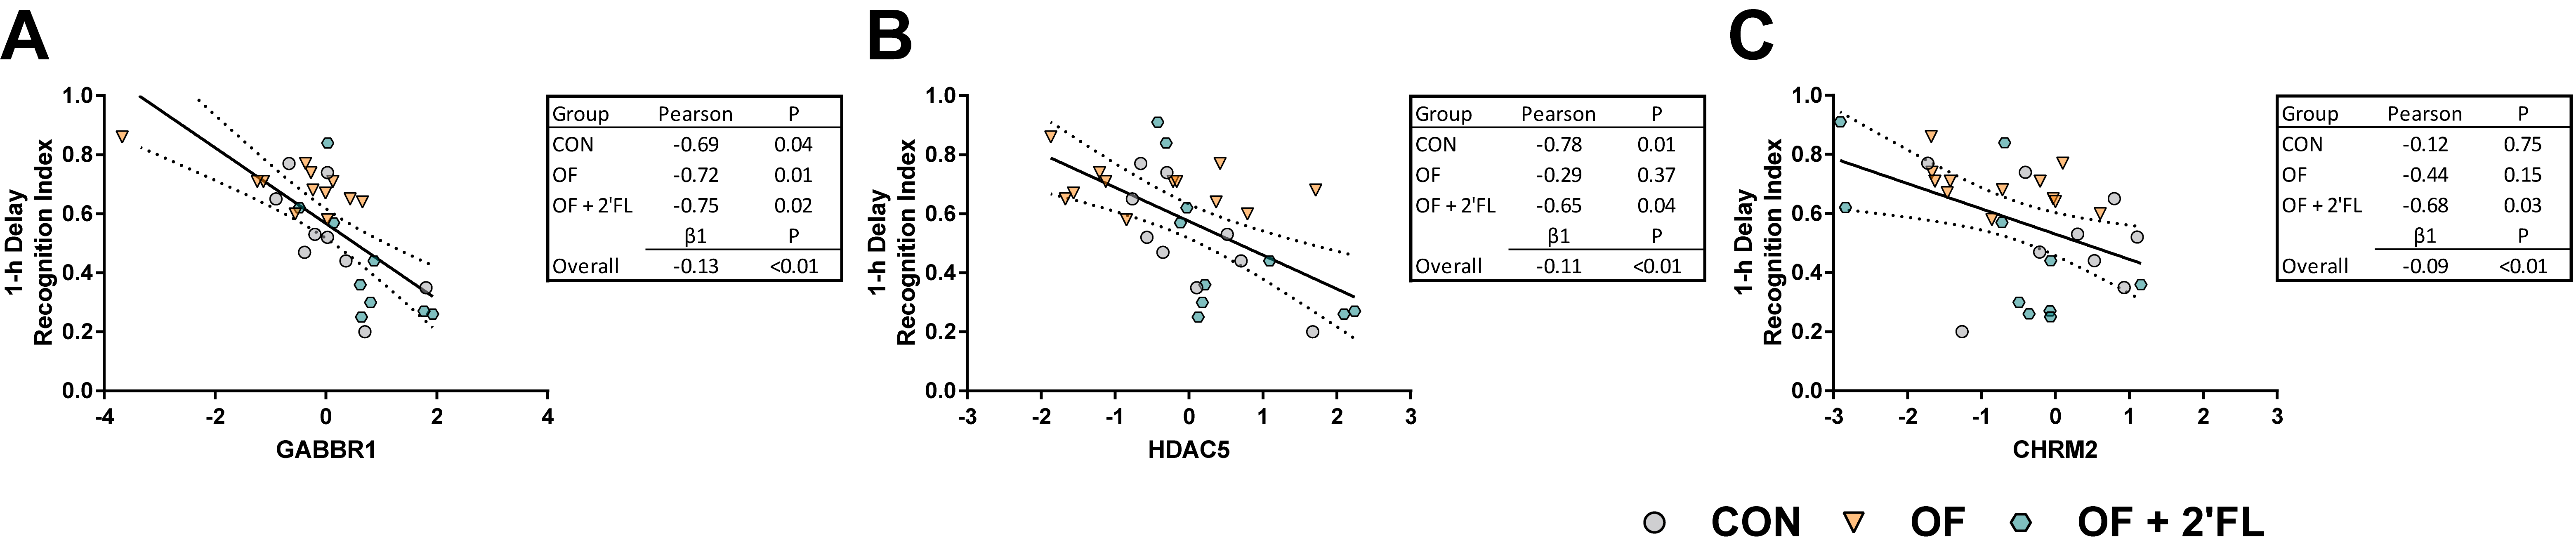
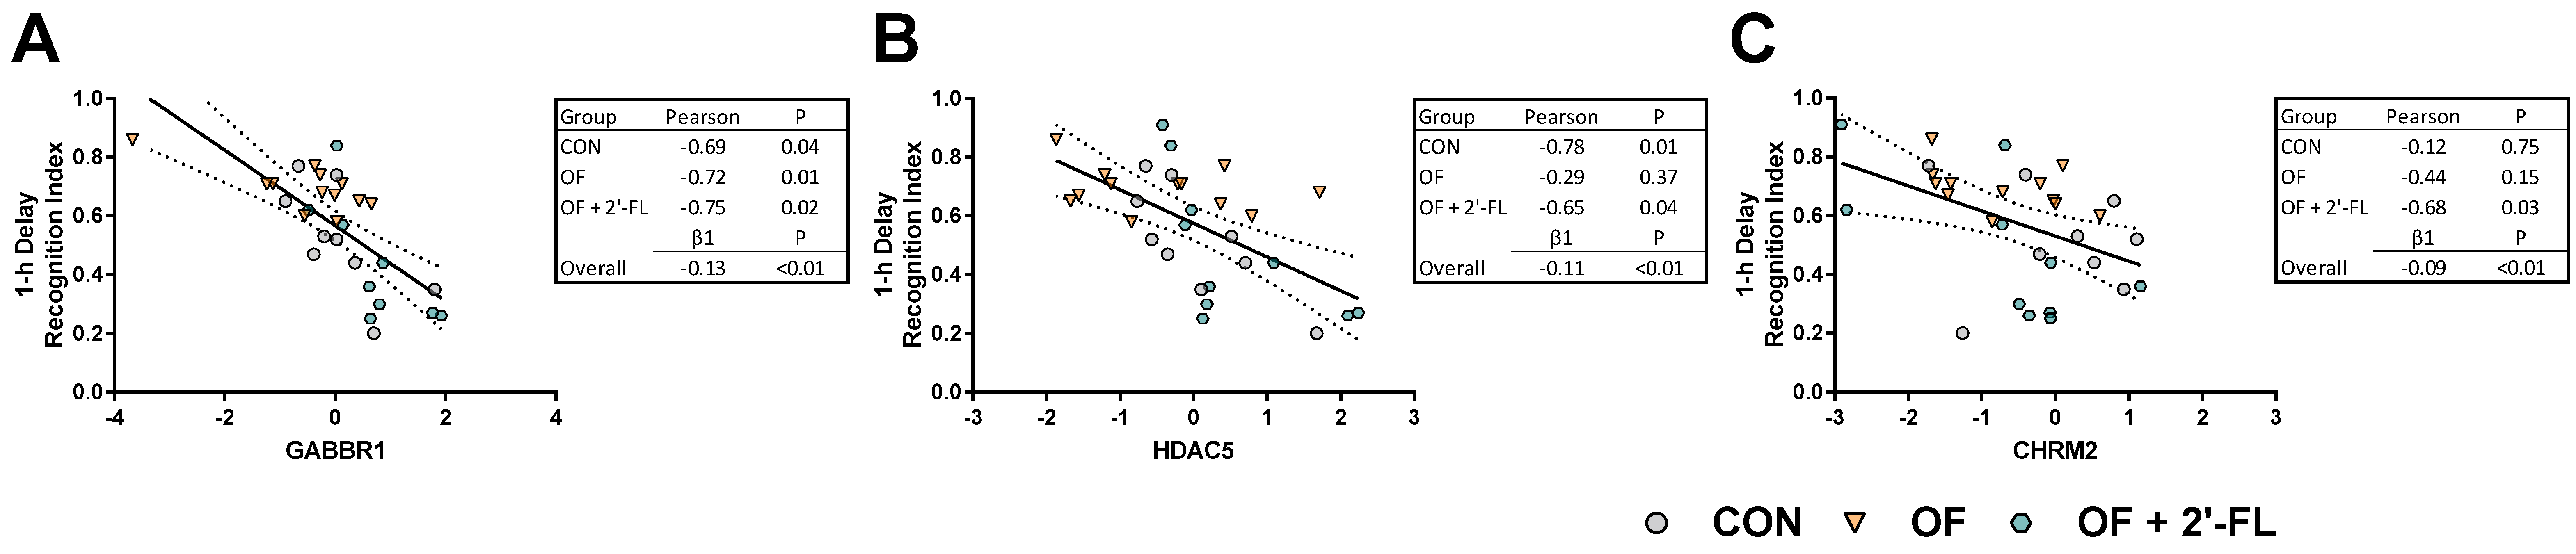
We assessed the relationship between the genes affected by diet and behavioral outcomes. Of the affected genes, CHRM2, GABBR1, and HDAC5 were inversely correlated with the recognition index after a 1 h delay. While significant relationships were observed overall, these appeared to be driven by specific dietary groups. The relationship between the recognition index and CHRM2 was strongest in the OF + 2′-FL group, whereas the relationship between HDAC5 and the recognition index was driven by the CON and OF + 2′-FL group. All dietary groups showed an inverse relationship between GABBR1 and the recognition index, and linear regression revealed the strongest and most significant relationship between these two outcomes. None of the affected genes were related to the recognition index after a 48 h delay, suggesting a different mechanism for the behavioral demonstration of recognition memory after intermediate and long delays, and that these mechanisms are sensitive and differentially altered by oligosaccharide supplementation.
The idea that some genes are differentially expressed in context of time or familiarity/novelty of a stimuli is not new [
52,
53]. However, the possibility that dietary oligosaccharides may differentially alter such processes is novel. The divergence in performance on the NOR task and
GABBR1 expression (and many other genes) by the OF and OF + 2′-FL groups together with the relationship between the recognition index and
GABBR1 expression highlight a potential mechanistic link connecting the two phenomena. To our knowledge, there has been little investigation into the connection between prebiotic intake and GABAergic processes. In context of probiotics, BALB/c mice orally gavaged with broth containing
L. rhamnosus (JB-1) for 28 d displayed greater movement in an open field test, less time immobile during a forced swim test, greater entries to the open arm in an elevated plus maze, and increased memory on a fear conditioning task; indices demonstrating reduced response to stress and improved memory [
54]. These changes were simultaneous with reduced mRNA expression of the
GABAB1b receptor in the amygdala, locus coeruleus, and hippocampus, and increased expression in the cingulate 1 and prelimbic cortices. A follow-up study using magnetic resonance spectroscopy in mice provided JB-1 demonstrated increased brain GABA after 4 weeks of consumption [
55]. For object recognition, it appears that hippocampal reductions in GABA
B receptor expression may be beneficial. Cavallaro et al. [
52] proposed that downregulation of hippocampal GABA
B receptor signaling may improve short term memory. In support of this hypothesis, Baclofen, a GABA
B receptor agonist, has been shown to dose-dependently impair acquisition and storage of object recognition memory, whereas GABA
B receptor antagonism can prevent baclofen-induced impairments [
56]. Although the effects of GABA
B agonism and antagonism vary by dose, route, and behavioral task used (for review see Heaney and Kinney [
57]), it appears that both oligosaccharides and probiotics [
54,
55] are linked to beneficial alteration of GABA receptor expression in the brain.
While this study confirms several reports showing that various OS improve behavioral performance in both human and animal models [
6,
13,
14,
21,
22,
23,
58], it is one of the first to examine the potential of human and non-human milk OS together. Adult mice and rats fed chow containing 0.312% or 0.625% 2′-FL for 12 or 5 weeks, respectively, showed increased and longer-lasting potentiation of Schaffer collateral neurons in the CA1 region of the hippocampus [
13]. Supplemented mice displayed increased performance on place learning, working memory, and fixed-ratio lever-pressing tasks in an operant box, suggesting that 2′-FL supplementation enhanced multiple cognitive domains. In a follow-up study by the same group, subdiaphragmatic bilateral vagotomy was used to assess the requirement of the vagus nerve for 2′-FL-mediated increases in cognition in rodents [
14]. Vagotomy abolished 2′-FL-mediated increases in hippocampal long-term potentiation. However, all groups (sham/vagotomy and control/2′-FL) were still able to perform above criterion in a fixed-ratio lever pressing task. By the end of training, 2′-FL/sham animals displayed greater lever presses than 2′-FL/vagotomy or control/vagotomy animals, indicating that while not required for behavioral performance, vagal communication is necessary for 2′-FL-induced increases. Together, these data suggest that the vagus nerve has a crucial role in mediating gut–brain-related increases in cognitive ability.
Given the significant evidence described above demonstrating preliminary but growing data suggesting that prebiotics of many sources can improve cognition, there are few compelling arguments without speculation upon why. This extends to the present research, wherein alterations in brain volume and gene expression are not sufficient to describe the behavioral effects shown. Ultimately, the field of study is too young to make reasonable inferences on why prebiotics can improve cognition. These limitations add to the field’s novelty and provide compelling evidence for why future research is highly warranted.

 ,
, 


