The Importance of Sweet Beverage Definitions When Targeting Health Policies—The Case of Switzerland


Abstract
1. Introduction
2. Data and Methods
2.1. Data
2.2. Data Preparation and Analysis
3. Results
Socio-Demographic, Anthropometric, and Lifestyle Correlates with Sweet Beverage Consumption
4. Discussion
4.1. Low-Calorie Sweet Beverages and Plant-Based Milk Substitutes
4.2. Sociodemographic Characteristics Associated with Sweet Beeverage Consumption
4.3. Strengths and Limitations
4.4. Policy Implications
5. Conclusions
Author Contributions
Funding
Acknowledgments
Conflicts of Interest
Appendix A

| Country | Taxed Beverages | Untaxed Beverages | Reference |
|---|---|---|---|
| France (2012) | non-alcoholic beverages with added sugar or with sweeteners | 100% juices, soda beverages with a min of 2.9% proteins | Service-Public France 2019 |
| United Kingdom (2018) “Soft Drinks Industry Levy” | beverages with added sugar 1 during production; contains at least 5 g of sugar per 100 mL in its ready to drink or diluted form, has a content of 1.2% alcohol by volume or less | 100% juices, milk replacements (e.g., almond), zero-calorie beverages with sweeteners such as aspartame and stevia | UK-Gov 2019 |
| Philippines (2017) | beverages made with caloric and non-caloric sweeteners | 100% natural juices and 3 in 1 instant coffee | Saxena A. 2019 |
| Chile (2014) | beverages that contain at least 6,25 g of added sugar per 100 mL | reduced the tax of beverages with low added sugar less than 6.5 g per 100 mL such as soda drinks with sweeteners | Cuadrado C. 2018 |
| Mexico (2013) | non-dairy and non-alcoholic beverages with added sugar beverages (sodas, flavored and sweetened juices) or with more than 275 kcal per 100 g | diet sodas and sparkling water, flavored water without caloric sugar, 100% fruit juices and beer | Colchero MA et al. 2016 |
| Sweet Beverage Categories | Total Amount (g/day) | Sex | Age Group | ||||||||||
|---|---|---|---|---|---|---|---|---|---|---|---|---|---|
| F | M | 18–29 | 30–44 | 45–59 | 60–75 | ||||||||
| Mean | Mean | % | Mean | % | Mean | % | Mean | % | Mean | % | Mean | % | |
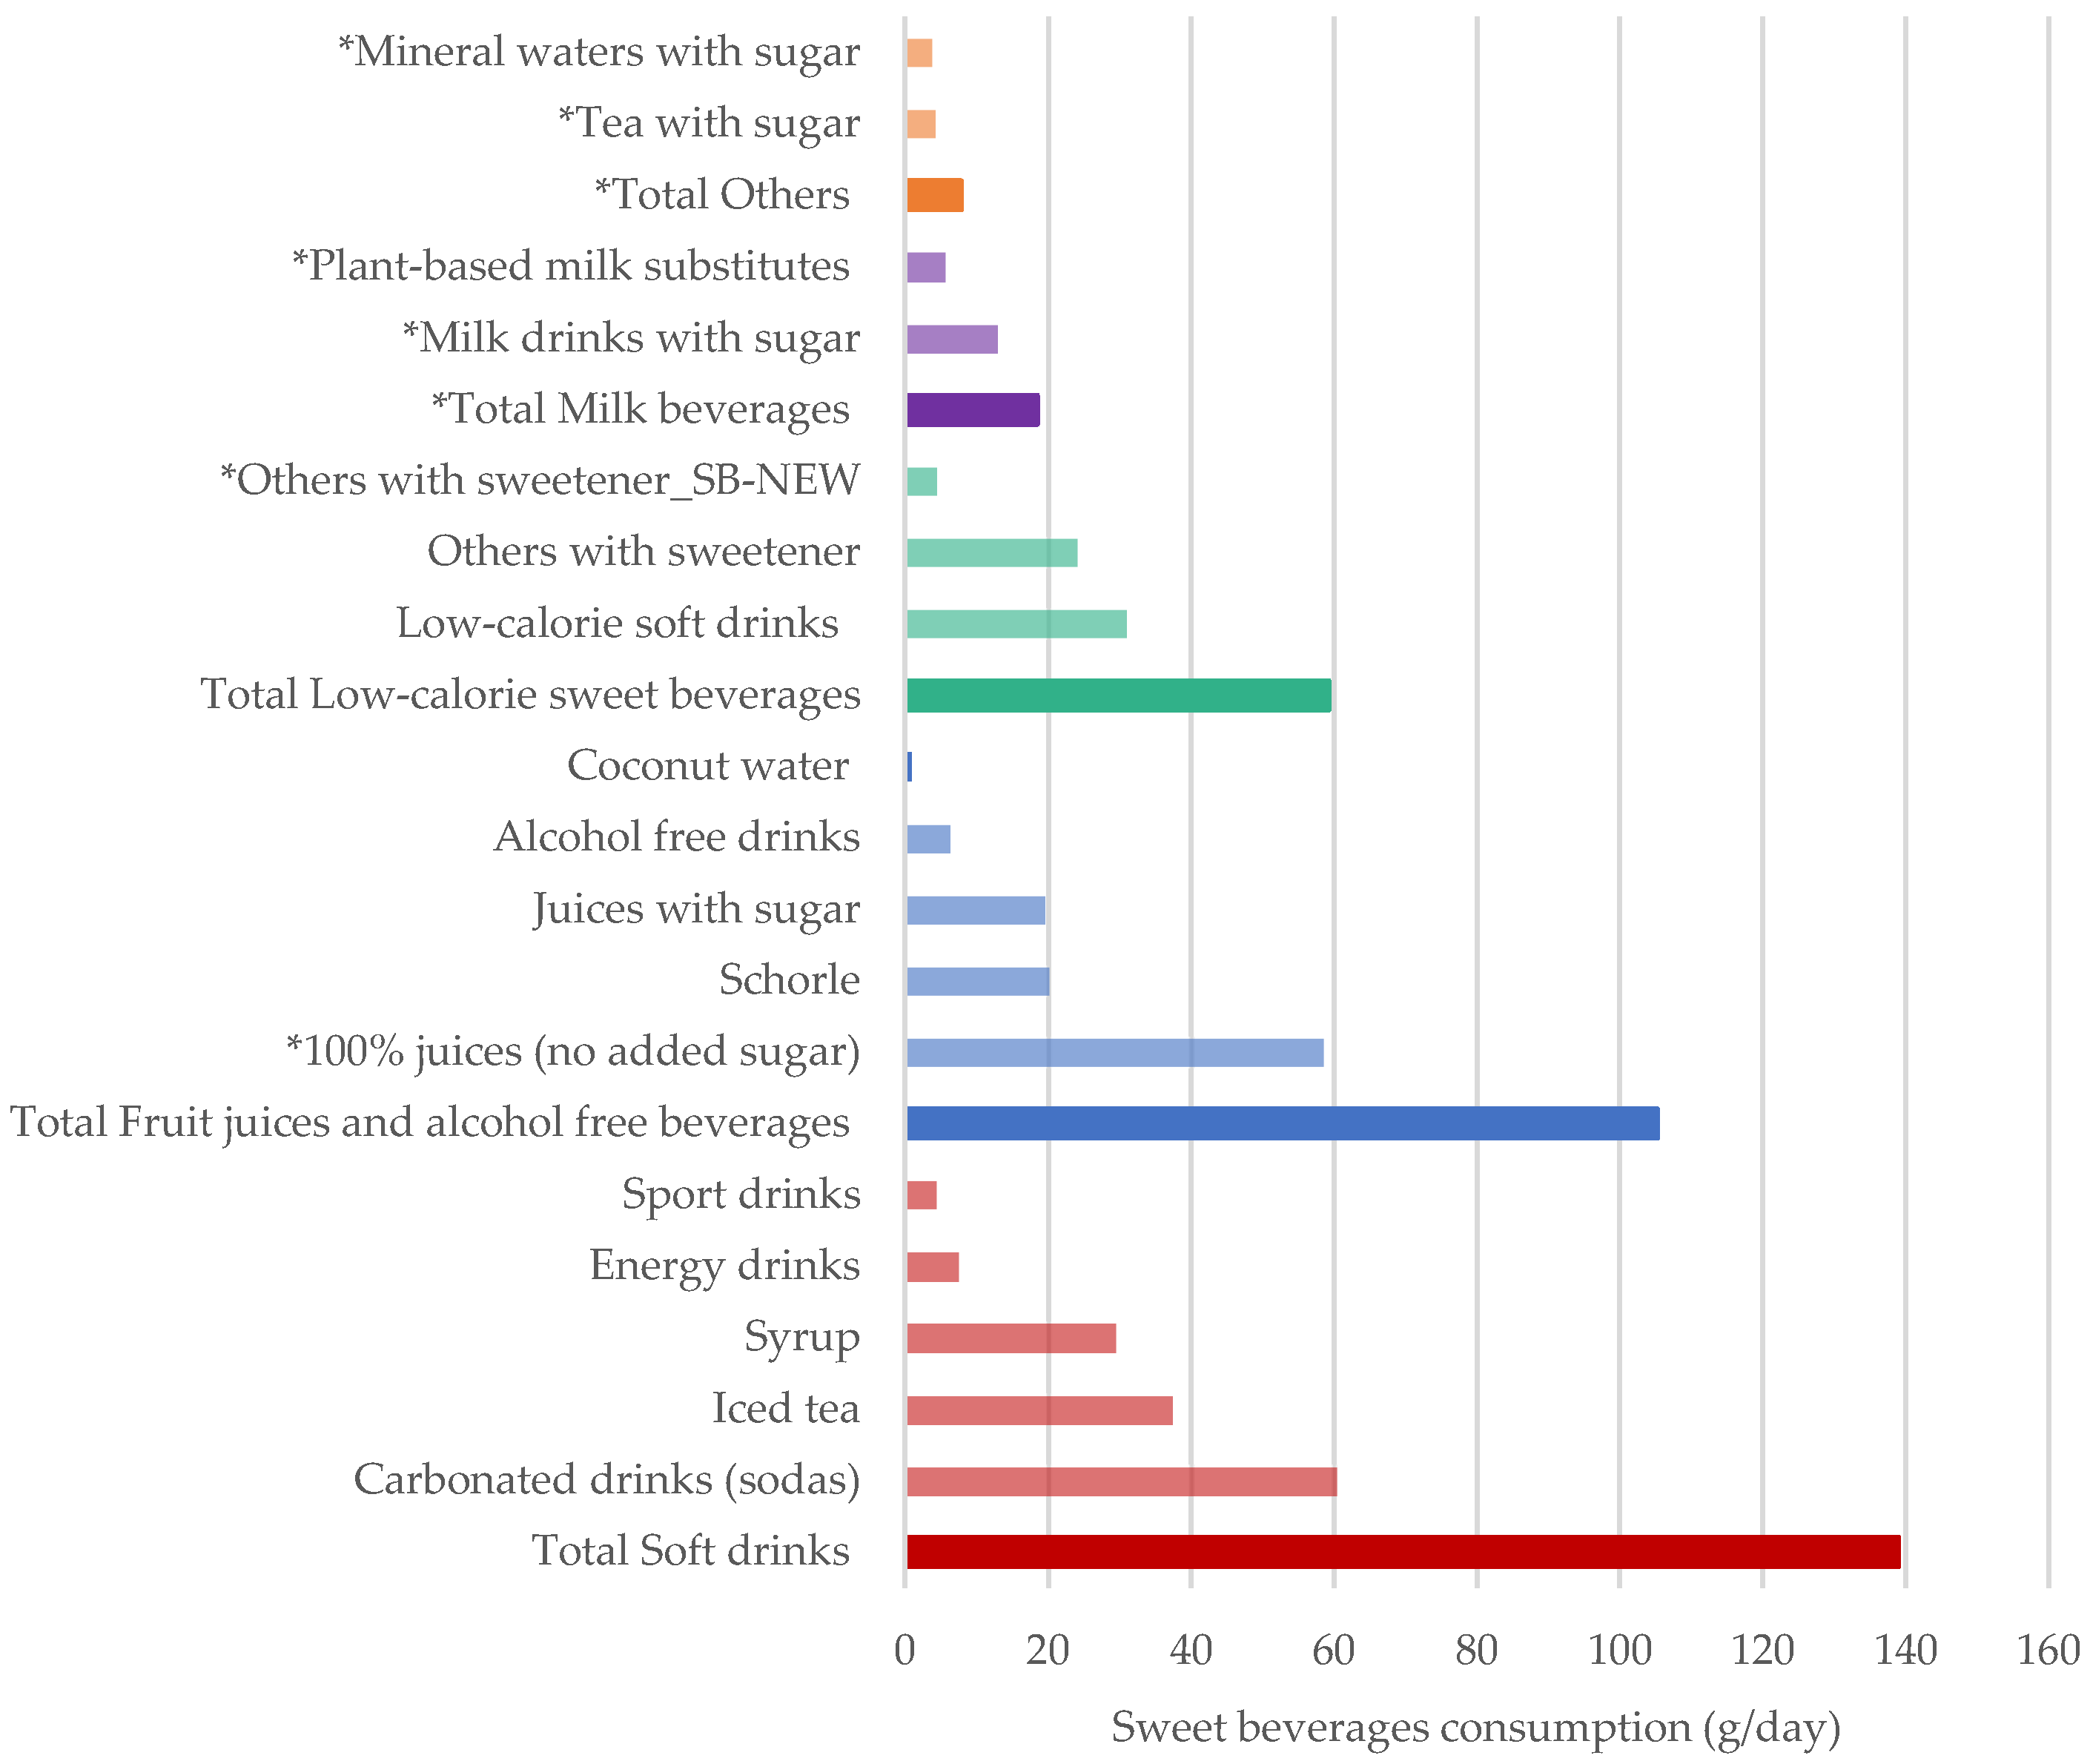
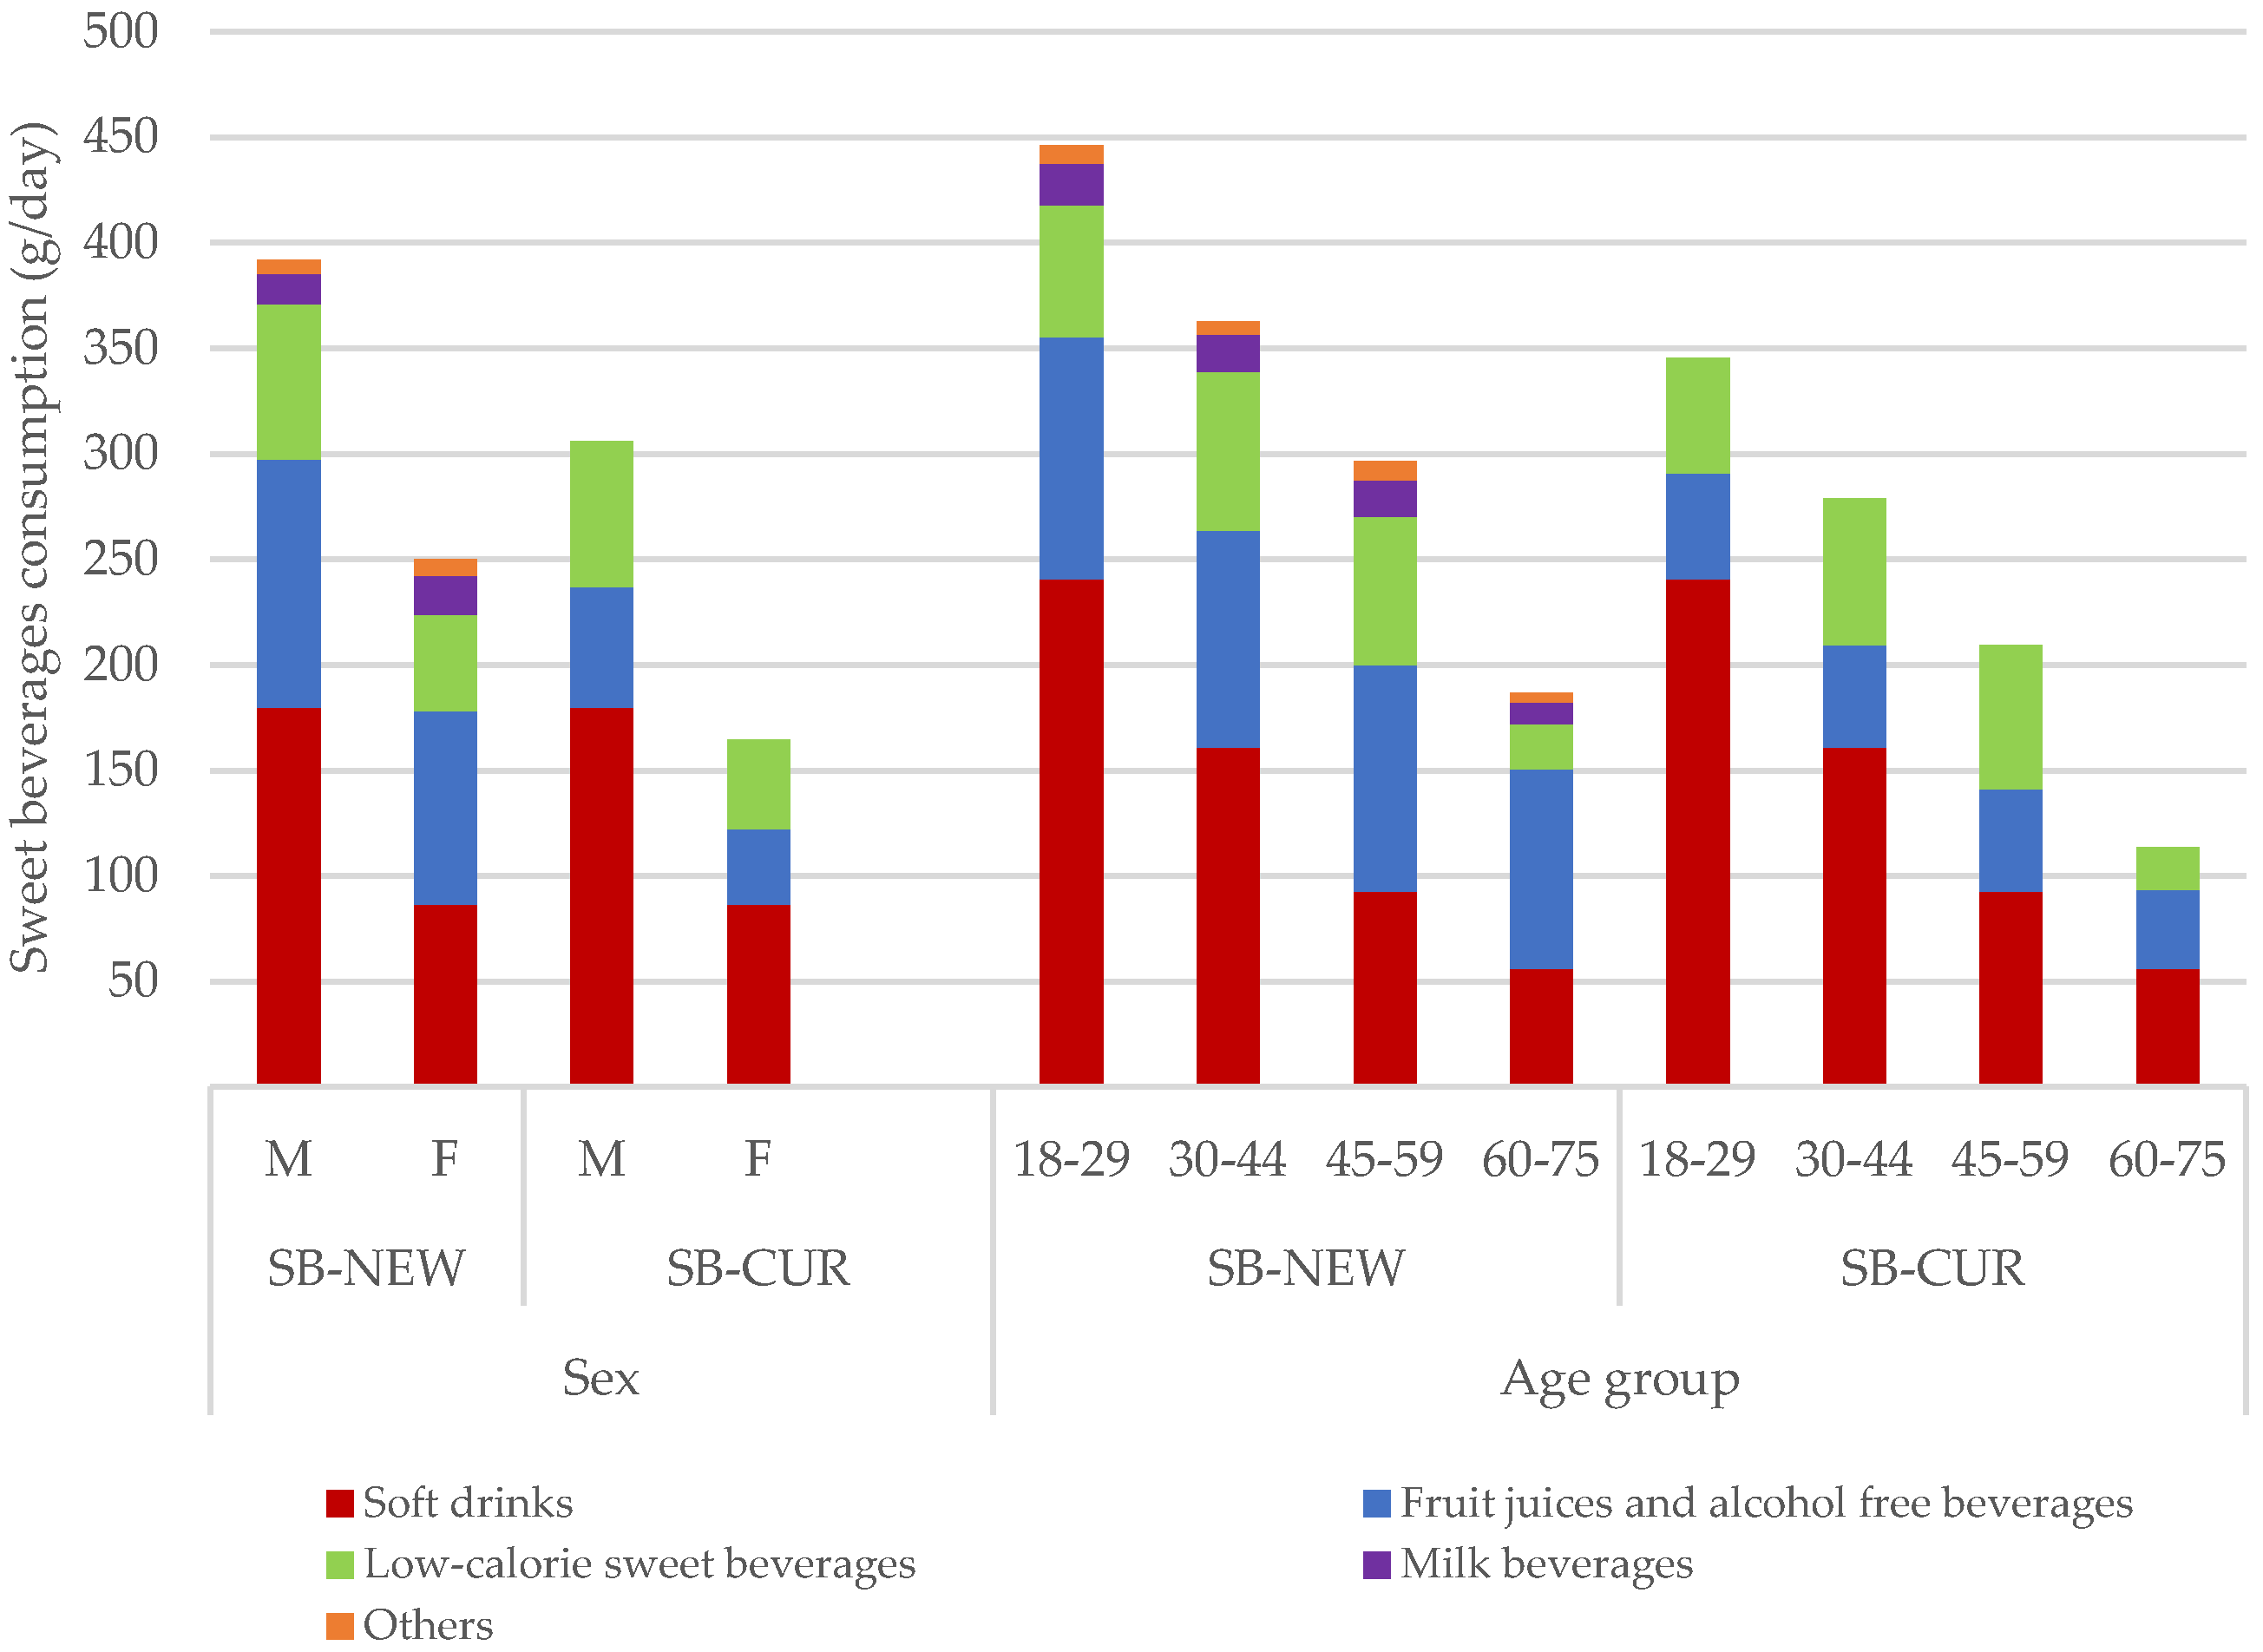
| Soft drinks | 139.0 | 86.5 | 35 | 179.8 | 46 | 240.6 | 54 | 160.9 | 44 | 92.7 | 31 | 56.2 | 30 |
| Carbonated drinks (sodas) | 60.4 | 33.7 | 13 | 83.3 | 21 | 92.5 | 21 | 64.6 | 18 | 52.7 | 18 | 27.8 | 15 |
| Iced tea | 37.3 | 24.5 | 10 | 43.6 | 11 | 74.4 | 17 | 42.0 | 12 | 18.7 | 6 | 8.8 | 5 |
| Syrup | 29.4 | 22.7 | 9 | 38.0 | 10 | 48.7 | 11 | 38.4 | 11 | 18.4 | 6 | 19.6 | 10 |
| Energy drinks | 4.3 | 3.1 | 1 | 3.5 | 1 | 7.6 | 2 | 5.8 | 2 | 0.5 | 0 | 0.0 | 0 |
| Sport drinks | 7.5 | 2.6 | 1 | 11.4 | 3 | 17.3 | 4 | 10.1 | 3 | 2.4 | 1 | 0.0 | 0 |
| Fruit juices and alcohol-free beverages | 105.2 | 91.5 | 37 | 117.8 | 30 | 114.9 | 26 | 102.7 | 28 | 107.4 | 36 | 94.6 | 51 |
| 100% juices (no added sugar) 2 | 58.6 | 55.8 | 22 | 60.5 | 15 | 64.6 | 14 | 54.0 | 15 | 58.7 | 20 | 57.4 | 31 |
| Schorle | 20.2 | 13.0 | 5 | 28.5 | 7 | 12.4 | 3 | 22.5 | 6 | 26.1 | 9 | 17.8 | 10 |
| Juices with sugar | 19.4 | 18.3 | 7 | 20.5 | 5 | 34.9 | 8 | 21.7 | 6 | 12.9 | 4 | 11.7 | 6 |
| Alcohol free drinks | 6.1 | 3.7 | 1 | 7.2 | 2 | 2.6 | 1 | 1.7 | 0 | 9.6 | 3 | 7.4 | 4 |
| Coconut water | 0.9 | 0.7 | 0 | 1.1 | 0 | 0.3 | 0 | 2.7 | 1 | 0.0 | 0 | 0.3 | 0 |
| Low-calorie sweet beverages | 59.2 | 45.9 | 18 | 73.4 | 19 | 62.5 | 14 | 75.3 | 21 | 70.1 | 24 | 21.1 | 11 |
| Low-calorie soft drinks | 30.9 | 22.2 | 9 | 40.9 | 10 | 37.6 | 8 | 37.0 | 10 | 37.1 | 13 | 10.8 | 6 |
| Others with sweetener | 24.1 | 20.2 | 8 | 27.9 | 7 | 16.9 | 4 | 32.3 | 9 | 30.9 | 10 | 9.4 | 5 |
| Others with sweetener-SB-NEW 2 | 4.3 | 3.5 | 1 | 4.6 | 1 | 8.0 | 2 | 5.9 | 2 | 2.0 | 1 | 0.9 | 0 |
| Milk beverages 2 | 18.5 | 18.4 | 7 | 14.3 | 4 | 19.7 | 4 | 17.7 | 5 | 17.3 | 6 | 10.3 | 5 |
| Milk drinks with sugar | 12.8 | 10.8 | 4 | 10.9 | 3 | 15.3 | 3 | 12.3 | 3 | 9.1 | 3 | 7.7 | 4 |
| Plant-based Milk substitutes | 5.6 | 7.6 | 3 | 3.3 | 1 | 4.4 | 1 | 5.5 | 2 | 8.2 | 3 | 2.6 | 1 |
| Others 2 | 7.8 | 7.9 | 3 | 6.5 | 2 | 8.5 | 2 | 6.2 | 2 | 9.1 | 3 | 4.8 | 3 |
| Tea with sugar | 4.1 | 4.2 | 2 | 3.5 | 1 | 5.3 | 1 | 3.9 | 1 | 4.6 | 2 | 1.5 | 1 |
| Mineral waters with sugar | 3.7 | 3.7 | 1 | 3.0 | 1 | 3.2 | 1 | 2.3 | 1 | 4.5 | 2 | 3.3 | 2 |
| SB-CUR 2 | 240.6 | 164.7 | 305.9 | 345.3 | 278.9 | 209.4 | 113.7 | ||||||
| SB-NEW 1 | 329.7 | 250.3 | 391.8 | 446.1 | 362.8 | 296.5 | 187.0 | ||||||
| Sweet Beverage Categories | Contribution to Sugar Intake (g/day) | Contribution to Energy Intake (kcal/day) | Sample | ||||||||||
|---|---|---|---|---|---|---|---|---|---|---|---|---|---|
| Female | Male | Overall | Female | Male | Overall | ||||||||
| Mean | (%) | Mean | (%) | Mean | (%) | Mean | (%) | Mean | (%) | Mean | (%) | ||
| All foods and drinks -mean (SD)- | 95.8 (44.3) | 113.3 (60.7) | 106 (54.3) | 1904.7 (538.3) | 2518.2 (788) | 2225.7 (752.8) | 2057 | ||||||
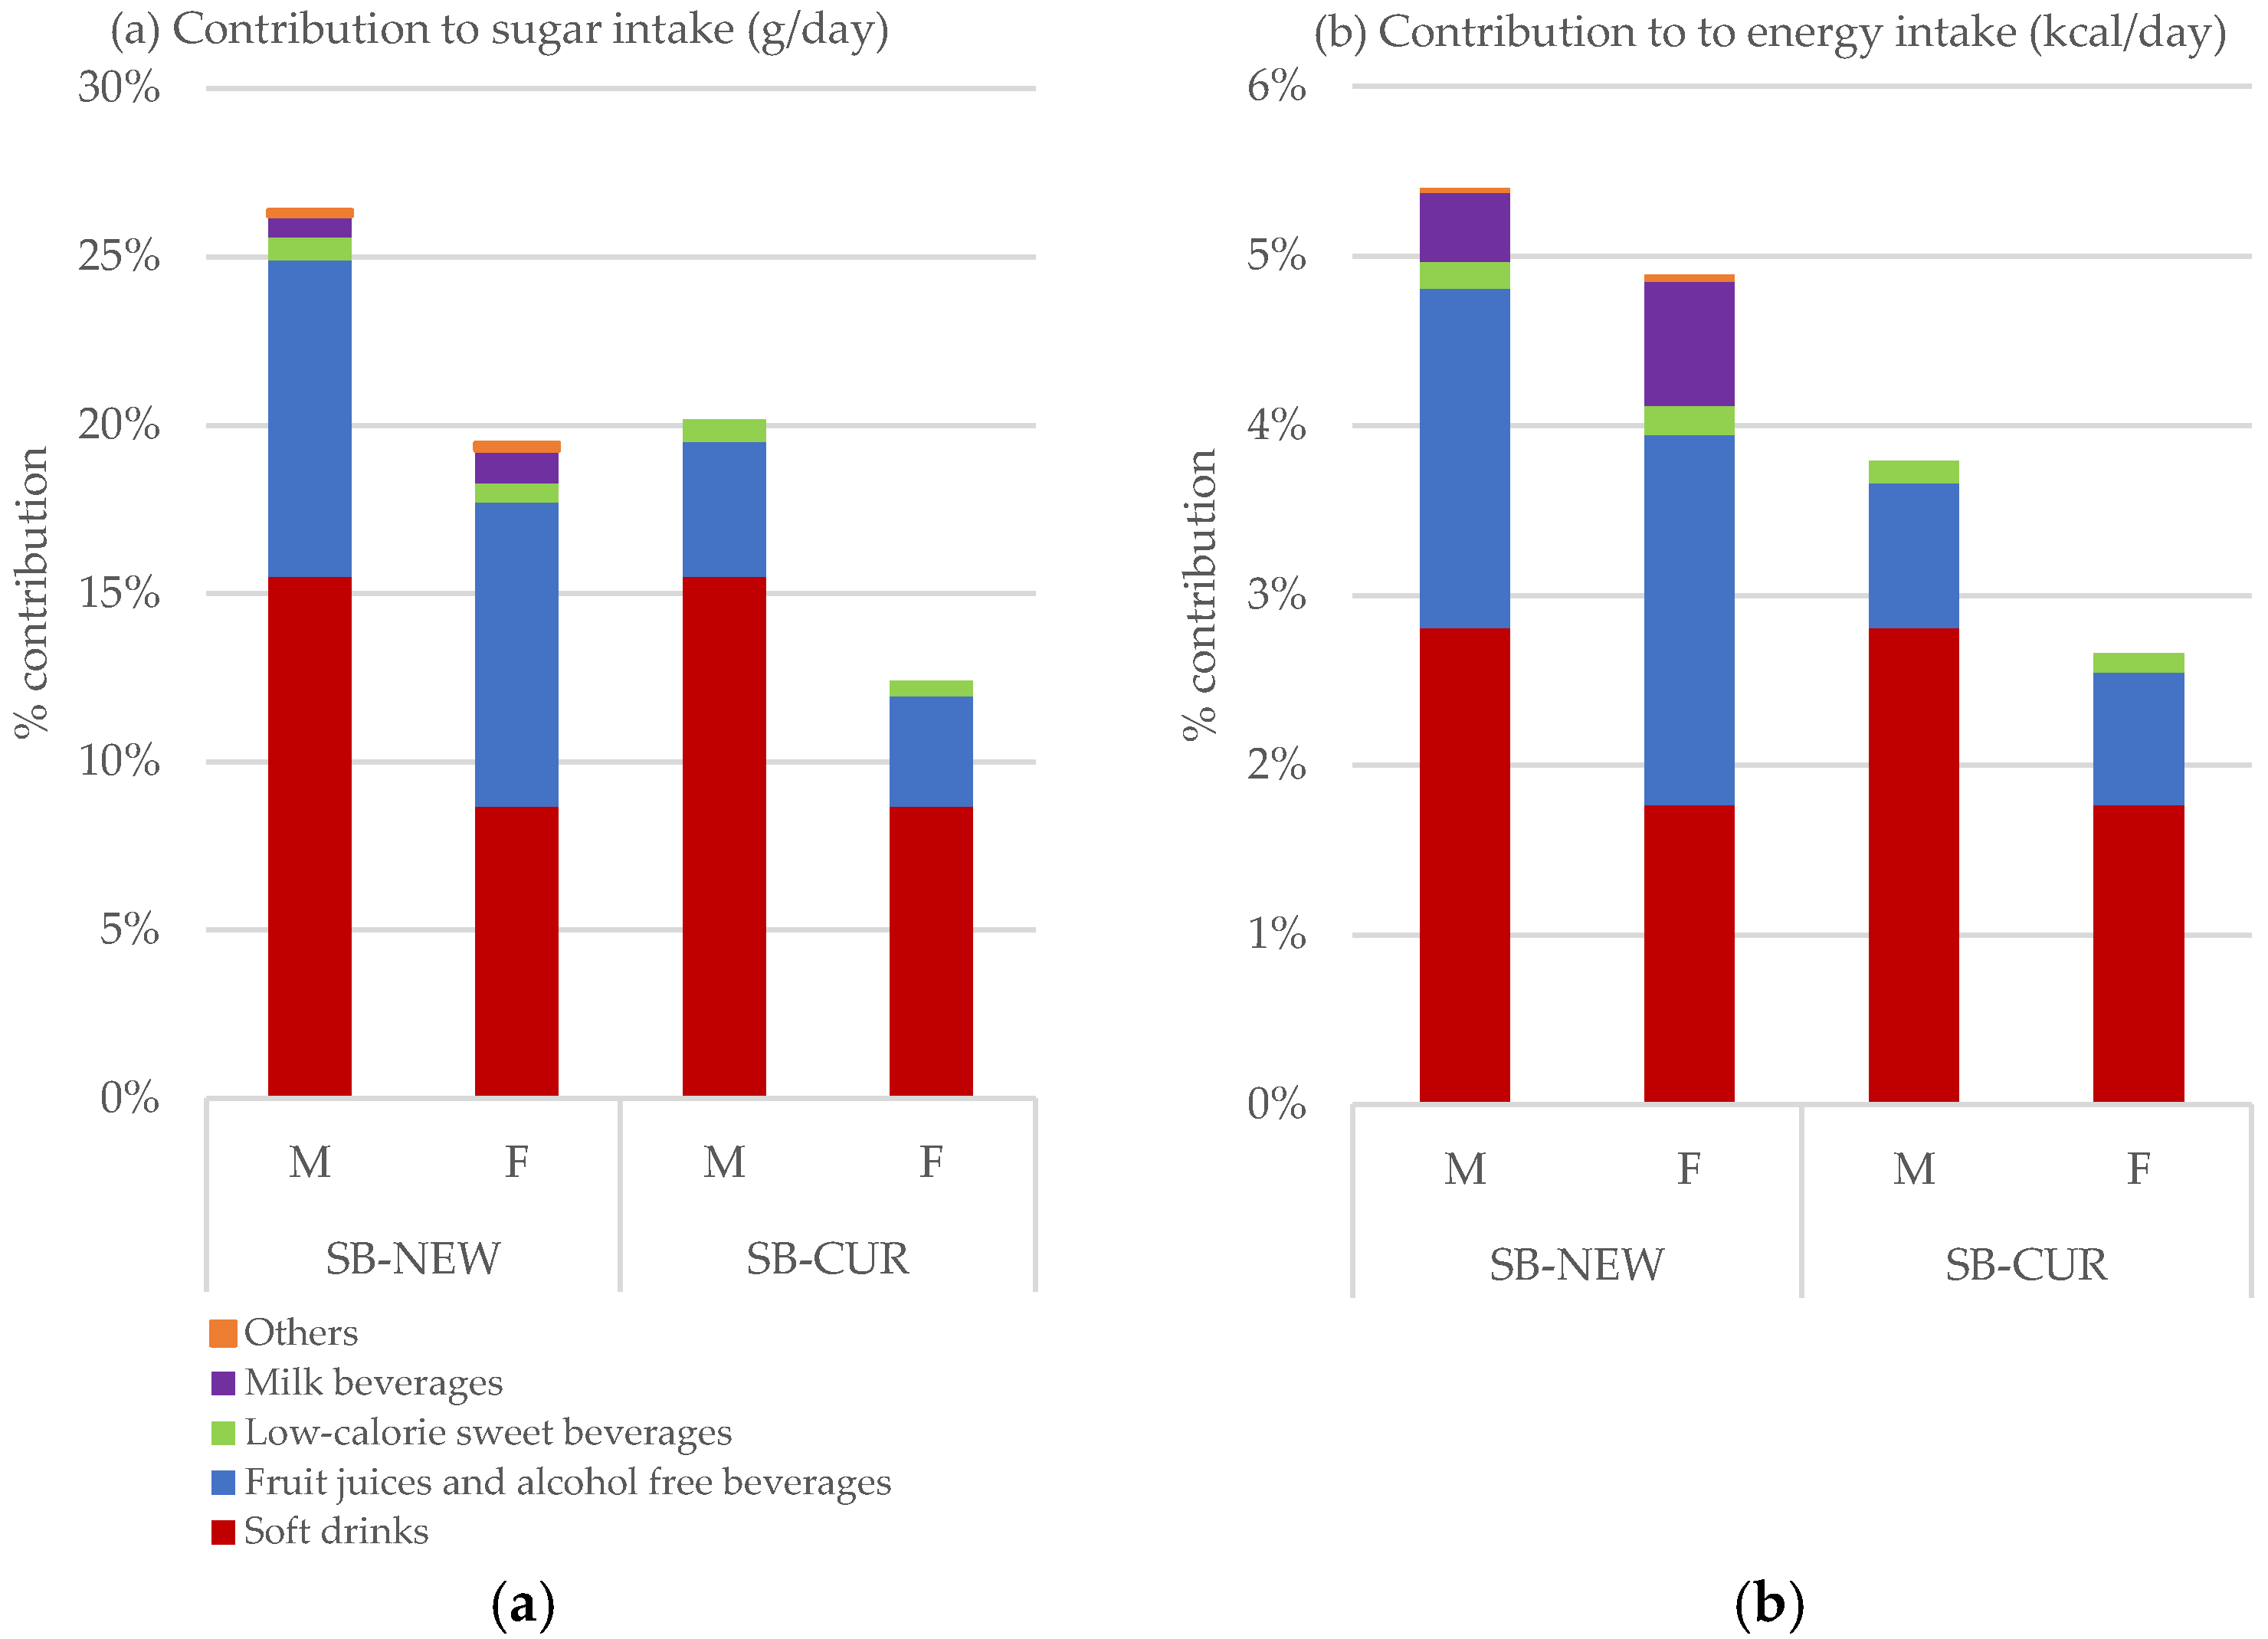
| Soft drinks | 8.3 | 8.7 | 17.6 | 15.5 | 13.4 | 12.7 | 33.6 | 1.8 | 70.8 | 2.8 | 54.0 | 2.4 | 682 |
| Carbonated drinks (sodas) | 3.2 | 3.3 | 7.9 | 6.9 | 5.7 | 5.4 | 12.8 | 0.7 | 31.6 | 1.3 | 23.1 | 1.0 | 427 |
| Iced tea | 1.8 | 1.9 | 3.1 | 2.8 | 2.7 | 2.6 | 7.2 | 0.4 | 12.7 | 0.5 | 10.9 | 0.5 | 205 |
| Syrup | 3.0 | 3.2 | 5.0 | 4.4 | 3.9 | 3.7 | 12.3 | 0.6 | 20.2 | 0.8 | 15.7 | 0.7 | 176 |
| Energy drinks | 0.3 | 0.3 | 1.3 | 1.1 | 0.8 | 0.8 | 1.2 | 0.1 | 5.1 | 0.2 | 3.4 | 0.2 | 42 |
| Sport drinks | 0.0 | 0.0 | 0.3 | 0.3 | 0.3 | 0.2 | 0.2 | 0.0 | 1.2 | 0.0 | 1.1 | 0.0 | 14 |
| Fruit juices and alcohol-free beverages | 8.6 | 9.0 | 10.6 | 9.4 | 9.7 | 9.2 | 41.6 | 2.2 | 50.4 | 2.0 | 46.3 | 2.1 | 1094 |
| 100% juices (no added sugar) 2 | 5.5 | 5.8 | 6.1 | 5.4 | 5.9 | 5.6 | 26.7 | 1.4 | 28.9 | 1.1 | 28.1 | 1.3 | 874 |
| Schorle | 0.9 | 1.0 | 2.0 | 1.8 | 1.4 | 1.4 | 4.0 | 0.2 | 8.8 | 0.4 | 6.3 | 0.3 | 117 |
| Juices with sugar | 1.9 | 2.0 | 2.3 | 2.0 | 2.1 | 2.0 | 9.4 | 0.5 | 10.6 | 0.4 | 9.9 | 0.4 | 264 |
| Alcohol free drinks | 0.2 | 0.3 | 0.2 | 0.2 | 0.3 | 0.3 | 1.3 | 0.1 | 1.7 | 0.1 | 1.8 | 0.1 | 88 |
| Coconut water | 0.0 | 0.0 | 0.1 | 0.1 | 0.1 | 0.1 | 0.2 | 0.0 | 0.3 | 0.0 | 0.3 | 0.0 | 5 |
| Low-calorie sweet beverages | 0.6 | 0.6 | 0.8 | 0.7 | 0.7 | 0.7 | 3.3 | 0.2 | 4.0 | 0.2 | 3.9 | 0.2 | 305 |
| Low-calorie soft drinks | 0.0 | 0.0 | 0.0 | 0.0 | 0.0 | 0.0 | 0.0 | 0.0 | 0.0 | 0.0 | 0.0 | 0.0 | 165 |
| Others with sweetener | 0.4 | 0.5 | 0.7 | 0.6 | 0.6 | 0.6 | 2.1 | 0.1 | 3.3 | 0.1 | 2.8 | 0.1 | 139 |
| Others with sweetener SB-NEW 2 | 0.1 | 0.1 | 0.1 | 0.0 | 0.1 | 0.1 | 1.1 | 0.1 | 0.7 | 0.0 | 1.0 | 0.0 | 41 |
| Milk beverages 2 | 0.9 | 1.0 | 0.7 | 0.6 | 0.9 | 0.9 | 13.9 | 0.7 | 10.2 | 0.4 | 13.6 | 0.6 | 260 |
| Milk drinks with sugar | 0.5 | 0.5 | 0.6 | 0.5 | 0.6 | 0.6 | 8.0 | 0.4 | 7.8 | 0.3 | 9.3 | 0.4 | 153 |
| Plant-based Milk substitutes | 0.4 | 0.4 | 0.2 | 0.1 | 0.3 | 0.3 | 5.9 | 0.3 | 2.3 | 0.1 | 4.2 | 0.2 | 112 |
| Others 2 | 0.2 | 0.2 | 0.2 | 0.2 | 0.2 | 0.2 | 0.8 | 0.0 | 0.7 | 0.0 | 0.8 | 0.0 | 77 |
| Tea with sugar | 0.1 | 0.1 | 0.1 | 0.1 | 0.1 | 0.1 | 0.5 | 0.0 | 0.5 | 0.0 | 0.5 | 0.0 | 48 |
| Mineral waters with sugar | 0.1 | 0.1 | 0.1 | 0.0 | 0.1 | 0.1 | 0.3 | 0.0 | 0.2 | 0.0 | 0.3 | 0.0 | 29 |
| SB-CUR 2 | 11.9 | 12.4 | 22.8 | 20.2 | 17.9 | 16.9 | 50.6 | 2.7 | 95.6 | 3.8 | 75.1 | 3.4 | 1081 |
| SB-NEW 1 | 18.6 | 19.5 | 29.9 | 26.4 | 25.0 | 23.7 | 93.2 | 4.9 | 136.0 | 5.4 | 118.6 | 5.3 | 1557 |
References
- World Health Organization. Guideline: Sugars Intake for Adults and Children; World Health Organization: Geneva, Switzerland, 2015; ISBN 978-92-4-069422-4. [Google Scholar]
- Scientific Advisory Committee on Nutrition; Stationery Office (Great Britain). Carbohydrates and Health; Scientific Advisory Committee on Nutrition; Stationery Office: London, UK, 2015; ISBN 978-0-11-708284-7. [Google Scholar]
- Te Morenga, L.; Mallard, S.; Mann, J. Dietary sugars and body weight: Systematic review and meta-analyses of randomised controlled trials and cohort studies. BMJ 2012, 346, e7492. [Google Scholar] [CrossRef] [PubMed]
- Luger, M.; Lafontan, M.; Bes-Rastrollo, M.; Winzer, E.; Yumuk, V.; Farpour-Lambert, N. Sugar-sweetened beverages and weight gain in children and adults: A systematic review from 2013 to 2015 and a comparison with previous studies. Obes. Facts 2017, 10, 674–693. [Google Scholar] [CrossRef] [PubMed]
- Bleich, S.N.; Vercammen, K.A. The negative impact of sugar-sweetened beverages on children’s health: An update of the literature. BMC Obes. 2018, 5. [Google Scholar] [CrossRef] [PubMed]
- Imamura, F.; O’Connor, L.; Ye, Z.; Mursu, J.; Hayashino, Y.; Bhupathiraju, S.N.; Forouhi, N.G. Consumption of sugar sweetened beverages, artificially sweetened beverages, and fruit juice and incidence of type 2 diabetes: Systematic review, meta-analysis, and estimation of population attributable fraction. BMJ 2015, h3576. [Google Scholar] [CrossRef]
- Malik, V.S.; Hu, F.B. Sugar-sweetened beverages and cardiometabolic health: An update of the evidence. Nutrients 2019, 11, 1840. [Google Scholar] [CrossRef] [PubMed]
- Huang, C.; Huang, J.; Tian, Y.; Yang, X.; Gu, D. Sugar sweetened beverages consumption and risk of coronary heart disease: A meta-analysis of prospective studies. Atherosclerosis 2014, 234, 11–16. [Google Scholar] [CrossRef]
- Vos, M.B.; Kaar, J.L.; Welsh, J.A.; Van Horn, L.V.; Feig, D.I.; Anderson, C.A.M.; Patel, M.J.; Cruz Munos, J.; Krebs, N.F.; Xanthakos, S.A.; et al. Added sugars and cardiovascular disease risk in children: A scientific statement from the american heart association. Circulation 2017, 135. [Google Scholar] [CrossRef]
- Chazelas, E.; Srour, B.; Desmetz, E.; Kesse-Guyot, E.; Julia, C.; Deschamps, V.; Druesne-Pecollo, N.; Galan, P.; Hercberg, S.; Latino-Martel, P.; et al. Sugary drink consumption and risk of cancer: Results from NutriNet-Santé prospective cohort. BMJ 2019, l2408. [Google Scholar] [CrossRef]
- World Health Organization. Taxes on Sugary Drinks: Why Do It? World Health Organization. 2017. Available online: https://apps.who.int/iris/handle/10665/260253 (accessed on 6 November 2019).
- Swan, G.E.; Powell, N.A.; Knowles, B.L.; Bush, M.T.; Levy, L.B. A definition of free sugars for the UK. Public Health Nutr. 2018, 21, 1636–1638. [Google Scholar] [CrossRef]
- Afshin, A.; Sur, P.J.; Fay, K.A.; Cornaby, L.; Ferrara, G.; Salama, J.S.; Mullany, E.C.; Abate, K.H.; Abbafati, C.; Abebe, Z.; et al. Health effects of dietary risks in 195 countries, 1990–2017: A systematic analysis for the Global Burden of Disease Study 2017. Lancet 2019, 393, 1958–1972. [Google Scholar] [CrossRef]
- Malik, V.S.; Li, Y.; Pan, A.; De Koning, L.; Schernhammer, E.; Willett, W.C.; Hu, F.B. Long-Term consumption of sugar-sweetened and artificially sweetened beverages and risk of mortality in us adults. Circulation 2019, 139, 2113–2125. [Google Scholar] [CrossRef] [PubMed]
- Toews, I.; Lohner, S.; Küllenberg de Gaudry, D.; Sommer, H.; Meerpohl, J.J. Association between intake of non-sugar sweeteners and health outcomes: Systematic review and meta-analyses of randomised and non-randomised controlled trials and observational studies. BMJ 2019, k4718. [Google Scholar] [CrossRef] [PubMed]
- Rogers, P.J.; Hogenkamp, P.S.; de Graaf, C.; Higgs, S.; Lluch, A.; Ness, A.R.; Penfold, C.; Perry, R.; Putz, P.; Yeomans, M.R.; et al. Does low-energy sweetener consumption affect energy intake and body weight? A systematic review, including meta-analyses, of the evidence from human and animal studies. Int. J. Obes. 2016, 40, 381–394. [Google Scholar] [CrossRef]
- Mullee, A.; Romaguera, D.; Pearson-Stuttard, J.; Viallon, V.; Stepien, M.; Freisling, H.; Fagherazzi, G.; Mancini, F.R.; Boutron-Ruault, M.-C.; Kühn, T.; et al. Association between soft drink consumption and mortality in 10 European countries. JAMA Intern. Med. 2019, 179, 1479. [Google Scholar] [CrossRef] [PubMed]
- Suez, J.; Korem, T.; Zeevi, D.; Zilberman-Schapira, G.; Thaiss, C.A.; Maza, O.; Israeli, D.; Zmora, N.; Gilad, S.; Weinberger, A.; et al. Artificial sweeteners induce glucose intolerance by altering the gut microbiota. Nature 2014, 514, 181–186. [Google Scholar] [CrossRef] [PubMed]
- von Philipsborn, P.; Stratil, J.M.; Burns, J.; Busert, L.K.; Pfadenhauer, L.M.; Polus, S.; Holzapfel, C.; Hauner, H.; Rehfuess, E. Environmental interventions to reduce the consumption of sugar-sweetened beverages and their effects on health. Cochrane Database Syst. Rev. 2019. [Google Scholar] [CrossRef] [PubMed]
- Service-Public France. Taxation des Boissons Sucrée ou Édulcorée. Available online: https://www.service-public.fr/professionnels-entreprises/vosdroits/F32101 (accessed on 11 June 2019).
- UK-Gov. Soft Drinks Industry Levy, UK. Available online: https://www.gov.uk/guidance/check-if-your-drink-is-liable-for-the-soft-drinks-industry-levy (accessed on 10 June 2019).
- Saxena, A.; Koon, A.D.; Lagrada-Rombaua, L.; Angeles-Agdeppa, I.; Johns, B.; Capanzana, M. Modelling the impact of a tax on sweetened beverages in the Philippines: An extended cost–effectiveness analysis. Bull. World Health Organ. 2019, 97, 97–107. [Google Scholar] [CrossRef]
- Cuadrado, C. Consumo de bebidas azucaradas disminuyó 21% tras impuesto 2018. Available online: http://www.saludpublica.uchile.cl/noticias/144788/consumo-de-bebidas-azucaradas-disminuyo-21-tras-impuesto (accessed on 20 October 2019).
- Colchero, M.A.; Popkin, B.M.; Rivera, J.A.; Ng, S.W. Beverage purchases from stores in Mexico under the excise tax on sugar sweetened beverages: Observational study. BMJ 2016, h6704. [Google Scholar] [CrossRef]
- Chatelan, A.; Beer-Borst, S.; Randriamiharisoa, A.; Pasquier, J.; Blanco, J.; Siegenthaler, S.; Paccaud, F.; Slimani, N.; Nicolas, G.; Camenzind-Frey, E.; et al. Major differences in diet across three linguistic regions of switzerland: Results from the first national nutrition survey menuCH. Nutrients 2017, 9, 1163. [Google Scholar] [CrossRef]
- Chatelan, A.; Marques-Vidal, P.; Bucher, S.; Siegenthaler, S.; Metzger, N.; Zuberbühler, C.A.; Camenzind-Frey, E.; Reggli, A.; Bochud, M.; Beer-Borst, S. Lessons learnt about conducting a multilingual nutrition survey in switzerland: Results from menuCH pilot survey. Int. J. Vit. Nutr. Res. 2017, 87, 25–36. [Google Scholar] [CrossRef]
- Bochud, M.; Beer-Borst, S.; Blanco, J.-M.; Chatelan, A. Anthropometric Characteristics and Indicators of Eating and Physical Activity Behaviors in the Swiss Adult Population; Federal Office of Public Health and the Food Safety and Veterinary Office: Bern, Switzerland, 2017. [Google Scholar]
- Federal Food Safety and Veterinary Office FSVO. Reduction des Sucres. Food Safety and Veterinary Office- FSVO. Available online: https://www.blv.admin.ch/blv/fr/home/lebensmittel-und-ernaehrung/ernaehrung/produktzusammensetzung/zuckerreduktion.html (accessed on 10 October 2019).
- Federal Food Safety and Veterinary Office (FSVO). Swiss Food Composition Database. Available online: https://www.naehrwertdaten.ch/en/nutrients/ (accessed on 11 October 2019).
- Krieger, J.-P.; Pestoni, G.; Cabaset, S.; Brombach, C.; Sych, J.; Schader, C.; Faeh, D.; Rohrmann, S. Dietary patterns and their sociodemographic and lifestyle determinants in Switzerland: Results from the national nutrition survey menuCH. Nutrients 2018, 11, 62. [Google Scholar] [CrossRef] [PubMed]
- MONICA Manual, Part III, Section 1: Population Survey Data Component. 4.6 Height, Weight, Waist and Hip Measurement; WHO Press: Geneva, Switzerland, 1997.
- Wooldridge, J.M. Econometric Analysis of Cross Section and Panel Data, 2nd ed.; MIT Press: Cambridge, MA, USA, 2010; ISBN 978-0-262-23258-6. [Google Scholar]
- Pasquier, J.; Chatelan, A.; Bochud, M. Weighting Strategy; Institute of Social and Preventive Medicine: Lausanne, Switzerland, 2017. [Google Scholar]
- StataCorp Stata Statistical Software; StataCorp LP: College Station, TX, USA, 2009.
- Miller, C.; Ettridge, K.; Wakefield, M.; Pettigrew, S.; Coveney, J.; Roder, D.; Durkin, S.; Wittert, G.; Martin, J.; Dono, J. Consumption of sugar-sweetened beverages, juice, artificially-sweetened soda and bottled water: An Australian population study. Nutrients 2020, 12, 817. [Google Scholar] [CrossRef]
- Singh, G.M.; Micha, R.; Khatibzadeh, S.; Shi, P.; Lim, S.; Andrews, K.G.; Engell, R.E.; Ezzati, M.; Mozaffarian, D. Global burden of diseases nutrition and chronic diseases expert group (nutricode) global, regional, and national consumption of sugar-sweetened beverages, fruit juices, and milk: A systematic assessment of beverage intake in 187 countries. PLoS ONE 2015, 10, e0124845. [Google Scholar] [CrossRef]
- Azaïs-Braesco, V.; Sluik, D.; Maillot, M.; Kok, F.; Moreno, L.A. A review of total & added sugar intakes and dietary sources in Europe. Nutr. J. 2017, 16. [Google Scholar] [CrossRef]
- SSN. Swiss Food Pyramid. Available online: http://www.sge-ssn.ch/media/sge_pyramid_E_basic_20161.pdf (accessed on 2 May 2020).
- USDA. Dietary Guidelines for Americans 2015–2020. Available online: https://health.gov/sites/default/files/2019-09/2015-2020_Dietary_Guidelines.pdf (accessed on 11 May 2020).
- Collin, L.J.; Judd, S.; Safford, M.; Vaccarino, V.; Welsh, J.A. Association of sugary beverage consumption with mortality risk in US adults: A secondary analysis of data from the regards study. JAMA Netw.Open 2019, 2, e193121. [Google Scholar] [CrossRef] [PubMed]
- Choo, V.L.; Viguiliouk, E.; Blanco Mejia, S.; Cozma, A.I.; Khan, T.A.; Ha, V.; Wolever, T.M.S.; Leiter, L.A.; Vuksan, V.; Kendall, C.W.C.; et al. Food sources of fructose-containing sugars and glycaemic control: Systematic review and meta-analysis of controlled intervention studies. BMJ 2018, k4644. [Google Scholar] [CrossRef] [PubMed]
- Yuan, C.; Fondell, E.; Bhushan, A.; Ascherio, A.; Okereke, O.I.; Grodstein, F.; Willett, W.C. Long-term intake of vegetables and fruits and subjective cognitive function in US men. Neurology 2019, 92, e63–e75. [Google Scholar] [CrossRef]
- Scheffers, F.R.; Boer, J.M.A.; Verschuren, W.M.M.; Verheus, M.; van der Schouw, Y.T.; Sluijs, I.; Smit, H.A.; Wijga, A.H. Pure fruit juice and fruit consumption and the risk of CVD: The European Prospective Investigation into Cancer and Nutrition–Netherlands (EPIC-NL) study. Br. J. Nutr. 2019, 121, 351–359. [Google Scholar] [CrossRef]
- Laviada-Molina, H.; Molina-Segui, F.; Pérez-Gaxiola, G.; Cuello-García, C.; Arjona-Villicaña, R.; Espinosa-Marrón, A.; Martinez-Portilla, R.J. Effects of nonnutritive sweeteners on body weight and BMI in diverse clinical contexts: Systematic review and meta-analysis. Obes. Rev. 2020, 21. [Google Scholar] [CrossRef]
- Rogers, P.J.; Ferriday, D.; Irani, B.; Hei Hoi, J.K.; England, C.Y.; Bajwa, K.K.; Gough, T. Sweet satiation: Acute effects of consumption of sweet drinks on appetite for and intake of sweet and non-sweet foods. Appetite 2020, 149, 104631. [Google Scholar] [CrossRef]
- Stamataki, N.S.; Scott, C.; Elliott, R.; McKie, S.; Bosscher, D.; McLaughlin, J.T. Stevia beverage consumption prior to lunch reduces appetite and total energy intake without affecting glycemia or attentional bias to food cues: A double-blind randomized controlled trial in healthy adults. J. Nutr. 2020, 150, 1126–1134. [Google Scholar] [CrossRef] [PubMed]
- Sousa, A.; Bolanz, K.A.K. Nutritional implications of an increasing consumption of non-dairy plant-based beverages instead of cow’s milk in Switzerland. Adv. Dairy Res. 2017, 5. [Google Scholar] [CrossRef]
- Heuer, T.; Krems, C.; Moon, K.; Brombach, C.; Hoffmann, I. Food consumption of adults in Germany: Results of the German National Nutrition Survey II based on diet history interviews. Br. J. Nutr. 2015, 113, 1603–1614. [Google Scholar] [CrossRef] [PubMed]
- Paulsen, M.; Myhre, J.; Andersen, L. Beverage consumption patterns among Norwegian adults. Nutrients 2016, 8, 561. [Google Scholar] [CrossRef]
- Pestoni, G.; Krieger, J.-P.; Sych, J.M.; Faeh, D.; Rohrmann, S. Cultural differences in diet and determinants of diet quality in Switzerland: Results from the national nutrition survey menuCH. Nutrients 2019, 11, 126. [Google Scholar] [CrossRef] [PubMed]
- Mullie, P.; Aerenhouts, D.; Clarys, P. Demographic, socioeconomic and nutritional determinants of daily versus non-daily sugar-sweetened and artificially sweetened beverage consumption. Eur. J. Clin. Nutr. 2012, 66, 150–155. [Google Scholar] [CrossRef] [PubMed]
- Thompson, F.E.; Subar, A.F. Chapter 1, Dietary Assessment Methodology. In Nutrition in the Prevention and Treatment of Disease, 4th ed.; Coulston, A.M., Boushey, C., Ferruzzi, M.G., Delahanty, L.M., Eds.; Academic Press: London, UK; San Diego, CA, USA, 2017; ISBN 978-0-12-802928-2. [Google Scholar]
- Krebs-Smith, S.; Graubard, B.; Kahle, L.; Subar, A.; Cleveland, L.; Ballard-Barbash, R. Low energy reporters vs. others: A comparison of reported food intakes. Eur. J. Clin. Nutr. 2000, 54, 281–287. [Google Scholar] [CrossRef]
- Vinci, L.; Floris, J.; Koepke, N.; Matthes, K.L.; Bochud, M.; Bender, N.; Rohrmann, S.; Faeh, D.; Staub, K. Have Swiss adult males and females stopped growing taller? Evidence from the population-based nutrition survey menuCH, 2014/2015. Econ. Hum. Biol. 2019, 33, 201–210. [Google Scholar] [CrossRef]
- Drewnowski, A.; Rehm, C.D. The use of low-calorie sweeteners is associated with self-reported prior intent to lose weight in a representative sample of US adults. Nutr. Diabetes 2016, 6, e202. [Google Scholar] [CrossRef]
- Office Fédéral de la Santé Publique (OFSP). Surpoids et Obésité 2018. Available online: https://www.bag.admin.ch/bag/fr/home/gesund-leben/gesundheitsfoerderung-und-praevention/koerpergewicht/uebergewicht-und-adipositas.html (accessed on 10 May 2020).
- Lal, A.; Mantilla-Herrera, A.M.; Veerman, L.; Backholer, K.; Sacks, G.; Moodie, M.; Siahpush, M.; Carter, R.; Peeters, A. Modelled health benefits of a sugar-sweetened beverage tax across different socioeconomic groups in Australia: A cost-effectiveness and equity analysis. PLoS Med. 2017, 14, e1002326. [Google Scholar] [CrossRef]


| Sweet Beverage Category | SB–NEW Definition 3 | SB–CUR Definition |
|---|---|---|
| Soft drinks | Carbonated drinks (sodas) | Carbonated drinks (sodas) |
| Iced tea | Iced tea | |
| Syrup | Syrup | |
| Energy drinks | Energy drinks | |
| Sport drinks | Sport drinks | |
| Fruit juices and alcohol-free beverages | 100% juices -no added sugar- 2 (fruit and vegetable juices and smoothies) | |
| “Schorle” (a carbonated mixture of apple juice and water) | “Schorle” (a carbonate mixture of apple juice and water) | |
| Juices with sugar | Juices with sugar | |
| Alcohol free drinks | Alcohol free drinks | |
| Coconut water | Coconut water | |
| Low-calorie sweet beverages 1 | Low-calorie soft drinks | Low-calorie soft drinks |
| Other beverages with sweetener (fruit and vegetable juices, alcohol-free beverages, milk beverages 2, tea 2 and mineral water 2 with sweeteners) | Other beverages with sweetener (fruit and vegetable juices and alcohol-free beverages with sweeteners) | |
| Milk beverages 2 | Milk drinks with sugar | |
| Plant-based milk substitutes 1 | ||
| Others 2 | Tea with sugar | |
| Mineral waters with sugar |
| Total | People Who Consumed, SB–NEW 1 | People Who Consumed, SB–CUR 2 | |
|---|---|---|---|
| Sex (%) | |||
| Female | 50.2 | 49.3 | 45.1 |
| Male | 49.8 | 50.7 | 54.9 |
| Age group (%) | |||
| 18–29 | 18.8 | 21.3 | 23.8 |
| 30–44 | 29.9 | 30.4 | 33.0 |
| 45–59 | 29.6 | 28.7 | 27.6 |
| 60–75 | 21.6 | 19.6 | 15.6 |
| Language region (%) 3 | |||
| German | 68.8 | 70.6 | 73.4 |
| French | 25.7 | 24.7 | 22.4 |
| Italian | 5.6 | 4.7 | 4.2 |
| Education level (%) | |||
| Low education (primary & secondary) | 47.4 | 47.4 | 47.8 |
| High education (tertiary & above) | 52.6 | 52.6 | 52.2 |
| Smoking (%) | |||
| Non-smoker | 77.6 | 76.3 | 74.0 |
| Current smoker | 22.4 | 23.6 | 26.0 |
| BMI group (%) 4 | |||
| Normal | 54.4 | 54.8 | 53.3 |
| Overweight | 30.7 | 30.0 | 31.4 |
| Obese | 12.5 | 12.6 | 12.8 |
| Underweight | 2.3 | 2.6 | 2.5 |
| Sample | 2057 | 1557 | 1081 |
| Prevalence consumption (%) | 75.7 | 52.5 | |
| Weighted sample | 4,627,878 | 3,549,786 | 2,506,418 |
| Variables | SB–NEW (%) 3,5 | Soft Drinks (%) | Low-Calorie Sweet Beverages (%) 4 | |||||||||
|---|---|---|---|---|---|---|---|---|---|---|---|---|
| Coef. | [95% Conf. Interval] | Coef. | [95% Conf. Interval] | Coef. | [95% Conf. Interval] | |||||||
| Sex (M vs. F) | 53.2 | [33.5; | 75.8] | *** | 103.0 | [59.4; | 158.6] | *** | 36.3 | [−4.4; | 94.2] | |
| Age group | ||||||||||||
| 18–29 (ref) | 1.0 | 1.0 | 1.0 | |||||||||
| 30–44 | −18.0 | [−31.3; | −2.3] | * | −29.5 | [−46.8; | −6.6] | * | 11.3 | [−30.4; | 77.8] | |
| 45–59 | −35.3 | [−46.1; | −22.3] | *** | −60.9 | [−71.1; | −47.1] | *** | −7.2 | [−42.4; | 49.3] | |
| 60–75 | −60.3 | [−67.2; | −52.1] | *** | −77.8 | [−84.4; | −68.5] | *** | −72.1 | [−84.7; | −49.1] | *** |
| Language region 1 | ||||||||||||
| German (ref) | 1.0 | 1.0 | 1.0 | |||||||||
| French | −25.7 | [−36.6; | −13.1] | *** | −25.8 | [−44.4; | −1.3] | * | −44.7 | [−64.7; | −13.7] | ** |
| Italian | −38.7 | [−54.0; | −18.4] | *** | −33.4 | [−60.1; | 10.9] | −43.2 | [−72.8; | 18.8] | ||
| Low education (primary/secondary vs. tertiary) | 16.0 | [1.4; | 32.6] | * | 55.0 | [22.8; | 95.5] | *** | 8.9 | [−22.2; | 52.5] | |
| Smoking (current smoker vs. non-smoker) | 16.2 | [−0.3; | 35.4] | 23.5 | [−3.1; | 57.5] | 55.5 | [7.9; | 124.1] | * | ||
| BMI group 2 | ||||||||||||
| Normal (ref) | 1.0 | 1.0 | 1.0 | |||||||||
| Overweight | 2.7 | [−11.4; | 19.1] | 11.5 | [−12.7; | 42.4] | 3.0 | [−30.6; | 53.0] | |||
| Obese | 32.6 | [5.5; | 66.7] | * | 27.6 | [−17.1; | 96.5] | 148.9 | [56.9; | 294.8] | *** | |
| Underweight | 25.1 | [−12.9; | 79.8] | 21.2 | [−22.5; | 89.5] | −41.4 | [−74.0; | 32.1] | |||
| N | 2053 | 2053 | 2053 | |||||||||
© 2020 by the authors. Licensee MDPI, Basel, Switzerland. This article is an open access article distributed under the terms and conditions of the Creative Commons Attribution (CC BY) license (http://creativecommons.org/licenses/by/4.0/).
Share and Cite
Sousa, A.; Sych, J.; Rohrmann, S.; Faeh, D. The Importance of Sweet Beverage Definitions When Targeting Health Policies—The Case of Switzerland. Nutrients 2020, 12, 1976. https://doi.org/10.3390/nu12071976
Sousa A, Sych J, Rohrmann S, Faeh D. The Importance of Sweet Beverage Definitions When Targeting Health Policies—The Case of Switzerland. Nutrients. 2020; 12(7):1976. https://doi.org/10.3390/nu12071976
Chicago/Turabian StyleSousa, Angelica, Janice Sych, Sabine Rohrmann, and David Faeh. 2020. "The Importance of Sweet Beverage Definitions When Targeting Health Policies—The Case of Switzerland" Nutrients 12, no. 7: 1976. https://doi.org/10.3390/nu12071976
APA StyleSousa, A., Sych, J., Rohrmann, S., & Faeh, D. (2020). The Importance of Sweet Beverage Definitions When Targeting Health Policies—The Case of Switzerland. Nutrients, 12(7), 1976. https://doi.org/10.3390/nu12071976