Factors Affecting Vitamin C Status and Prevalence of Deficiency: A Global Health Perspective


Abstract
1. Introduction
2. Dietary Factors Determining Vitamin C Status
2.1. Dietary Intake
2.2. Cultural Aspects: Staple Foods and Traditional Cooking Practices
2.3. Supplement Use
3. Environmental Factors Affecting Vitamin C Status
3.1. Geographic Region
3.2. Season and Climate
3.3. Pollution
4. Effect of Demographic Factors on Vitamin C Status
4.1. Sex
4.2. Age
4.3. Race
5. Effect of Socioeconomic Factors on Vitamin C Status
5.1. Socioeconomic Status/Deprivation
5.2. Education and Social Class
5.3. Institutionalization
6. Health Aspects that Affect Vitamin C Status
6.1. Body Weight and Body Mass Index (BMI)
6.2. Pregnancy and Lactation
6.3. Genetic Variants
6.4. Smoking
6.5. Disease States
7. Has Vitamin C Status Changed Over Time?
8. Conclusions and Future Directions
Author Contributions
Funding
Acknowledgments
Conflicts of Interest
References
- Nishikimi, M.; Yagi, K. Molecular basis for the deficiency in humans of gulonolactone oxidase, a key enzyme for ascorbic acid biosynthesis. Am. J. Clin. Nutr. 1991, 54, 1203S–1208S. [Google Scholar] [CrossRef]
- Stone, I. Homo sapiens ascorbicus, a biochemically corrected robust human mutant. Med. Hypotheses 1979, 5, 711–721. [Google Scholar] [CrossRef]
- Rowe, S.; Carr, A.C. Global Vitamin C Status and Prevalence of Deficiency: A Cause for Concern? Preprints, 2020; 202005.0394.v1. [Google Scholar]
- Savini, I.; Rossi, A.; Pierro, C.; Avigliano, L.; Catani, M.V. SVCT1 and SVCT2: Key proteins for vitamin C uptake. Amino Acids 2008, 34, 347–355. [Google Scholar] [CrossRef]
- Hornig, D. Distribution of ascorbic acid, metabolites and analogues in man and animals. Ann. N. Y. Acad. Sci. 1975, 258, 103–118. [Google Scholar] [CrossRef] [PubMed]
- Corpe, C.P.; Tu, H.; Eck, P.; Wang, J.; Faulhaber-Walter, R.; Schnermann, J.; Margolis, S.; Padayatty, S.; Sun, H.; Wang, Y.; et al. Vitamin C transporter Slc23a1 links renal reabsorption, vitamin C tissue accumulation, and perinatal survival in mice. J. Clin. Investig. 2010, 120, 1069–1083. [Google Scholar] [CrossRef]
- Washko, P.W.; Wang, Y.; Levine, M. Ascorbic acid recycling in human neutrophils. J. Biol. Chem. 1993, 268, 15531–15535. [Google Scholar] [PubMed]
- Carr, A.; Frei, B. Does vitamin C act as a pro-oxidant under physiological conditions? FASEB J. 1999, 13, 1007–1024. [Google Scholar] [CrossRef]
- Carr, A.C.; Frei, B. Toward a new recommended dietary allowance for vitamin C based on antioxidant and health effects in humans. Am. J. Clin. Nutr. 1999, 69, 1086–1107. [Google Scholar] [CrossRef]
- Levine, M.; Conry-Cantilena, C.; Wang, Y.; Welch, R.W.; Washko, P.W.; Dhariwal, K.R.; Park, J.B.; Lazarev, A.; Graumlich, J.F.; King, J.; et al. Vitamin C pharmacokinetics in healthy volunteers: Evidence for a recommended dietary allowance. Proc. Natl. Acad. Sci. USA 1996, 93, 3704–3709. [Google Scholar] [CrossRef] [PubMed]
- Deirawan, H.; Bs, J.W.F.; Zarka, M.; Bluth, M.H.; Moossavi, M. Revisiting the pathobiology of scurvy: A review of the literature in the context of a challenging case. Int. J. Dermatol. 2020. [Google Scholar] [CrossRef]
- Ceglie, G.; Macchiarulo, G.; Marchili, M.R.; Marchesi, A.; Lelia, R.A.; Di Camillo, C.; Villani, A. Scurvy: Still a threat in the well-fed first world? Arch. Dis. Child. 2019, 104, 381–383. [Google Scholar] [CrossRef] [PubMed]
- Carr, A.C.; Lykkesfeldt, J. Discrepancies in global vitamin C recommendations: A review of RDA criteria and underlying health perspectives. Crit. Rev. Food Sci. Nutr. 2020, 2020, 1–14. [Google Scholar] [CrossRef] [PubMed]
- Langlois, K.; Cooper, M.; Colapinto, C.K. Vitamin C status of Canadian adults: Findings from the 2012/2013 Canadian Health Measures Survey. Health Rep. 2016, 27, 3–10. [Google Scholar]
- Schleicher, R.L.; Carroll, M.D.; Ford, E.S.; Lacher, D.A. Serum vitamin C and the prevalence of vitamin C deficiency in the United States: 2003–2004 National Health and Nutrition Examination Survey (NHANES). Am. J. Clin. Nutr. 2009, 90, 1252–1263. [Google Scholar] [CrossRef]
- Drewnowski, A.; Rock, C.L.; Henderson, S.A.; Shore, A.B.; Fischler, C.; Galan, P.; Preziosi, P.; Hercberg, S. Serum beta-carotene and vitamin C as biomarkers of vegetable and fruit intakes in a community-based sample of French adults. Am. J. Clin. Nutr. 1997, 65, 1796–1802. [Google Scholar] [CrossRef] [PubMed]
- Paalanen, L.; Prättälä, R.; Alfthan, G.; Salminen, I.; Laatikainen, T. Vegetable and fruit consumption, education and plasma vitamin C concentration in Russian and Finnish Karelia, 1992–2002. Public Health Nutr. 2013, 17, 2278–2286. [Google Scholar] [CrossRef] [PubMed]
- Joint FAO/WHO Expert Group. Human Vitamin and Mineral. Requirements; Food and Agriculture Organization: Rome, Italy, 2001. [Google Scholar]
- Mosdol, A.; Erens, B.; Brunner, E.J. Estimated prevalence and predictors of vitamin C deficiency within UK’s low-income population. J. Public Health 2008, 30, 456–460. [Google Scholar] [CrossRef] [PubMed]
- Wrieden, W.L.; Hannah, M.K.; Bolton-Smith, C.; Tavendale, R.; Morrison, C.; Tunstall-Pedoe, H. Plasma vitamin C and food choice in the third Glasgow MONICA population survey. J. Epidemiol. Community Health 2000, 54, 355–360. [Google Scholar] [CrossRef] [PubMed]
- De Oliveira, A.M.; Rondo, P.R.D.C.; Mastroeni, M.F.; Oliveira, J.M. Plasma concentrations of ascorbic acid in parturients from a hospital in Southeast Brazil. Clin. Nutr. 2008, 27, 228–232. [Google Scholar] [CrossRef]
- Charlton, K.E.; Kolbe-Alexander, T.L.; Nel, J.H. Micronutrient dilution associated with added sugar intake in elderly black South African women. Eur. J. Clin. Nutr. 2005, 59, 1030–1042. [Google Scholar] [CrossRef]
- Carter, B.E.; Monsivais, P.; Drewnowski, A. Absorption of folic acid and ascorbic acid from nutrient comparable beverages. J. Food Sci. 2010, 75, H289–H293. [Google Scholar] [CrossRef] [PubMed]
- Ravindran, R.D.; Vashist, P.; Gupta, S.K.; Young, I.S.; Maraini, G.; Camparini, M.; Jayanthi, R.; John, N.; Fitzpatrick, K.E.; Chakravarthy, U.; et al. Prevalence and risk factors for vitamin C deficiency in north and south India: A two centre population based study in people aged 60 years and over. PLoS ONE 2011, 6, e28588. [Google Scholar] [CrossRef] [PubMed]
- Joint FAO-WHO Expert Group. Requirements of Ascorbic Acid, Vitamin D, Vitamin B12, Folate, and Iron; Report No.: 0512-3054 (Print) 0512-3054 Contract No.: 452; World Health Organization: Geneva, Switzerland, 1970. [Google Scholar]
- Hughes, K.; Ong, C.N. Vitamins, selenium, iron, and coronary heart disease risk in Indians, Malays, and Chinese in Singapore. J. Epidemiol. Community Health 1998, 52, 181–185. [Google Scholar] [CrossRef] [PubMed][Green Version]
- Gittelsohn, J.; Thapa, M.; Landman, L.T. Cultural factors, caloric intake and micronutrient sufficiency in rural Nepali households. Soc. Sci. Med. 1997, 44, 1739–1749. [Google Scholar] [CrossRef]
- McCall, S.J.; Clark, A.B.; Luben, R.N.; Wareham, N.J.; Khaw, K.T.; Myint, P.K. Plasma vitamin C levels: Risk factors for deficiency and association with self-reported functional health in the European Prospective Investigation into Cancer-Norfolk. Nutrients 2019, 11, 1552. [Google Scholar] [CrossRef] [PubMed]
- Jungert, A.; Neuhäuser-Berthold, M. The lower vitamin C plasma concentrations in elderly men compared with elderly women can partly be attributed to a volumetric dilution effect due to differences in fat-free mass. Br. J. Nutr. 2015, 113, 859–864. [Google Scholar] [CrossRef] [PubMed]
- Ness, A.R.; Cappuccio, F.P.; Atkinson, R.W.; Khaw, K.T.; Cook, D.G. Plasma vitamin C levels in men and women from different ethnic backgrounds living in England. Int. J. Epidemiol. 1999, 28, 450–455. [Google Scholar] [CrossRef]
- GBD 2017 Diet Collaborators. Health effects of dietary risks in 195 countries, 1990–2017: A systematic analysis for the Global Burden of Disease Study 2017. Lancet 2019, 393, 1958–1972. [Google Scholar] [CrossRef]
- World Health Organization. Diet, Nutrition and the Prevention of Chronic Diseases: Report of a Joint WHO/FAO Expert Consultation; Contract No.: No. 916; WHO: Geneva, Switzerland, 2003. [Google Scholar]
- Desenclos, J.C.; Berry, A.M.; Padt, R.; Farah, B.; Segala, C.; Nabil, A.M. Epidemiological patterns of scurvy among Ethiopian refugees. Bull. World Health Organ. 1989, 67, 309–316. [Google Scholar]
- Kiondo, P.; Tumwesigye, N.M.; Wandabwa, J.; Wamuyu-Maina, G.; Bimenya, G.S.; Okong, P. Plasma vitamin C assay in women of reproductive age in Kampala, Uganda, using a colorimetric method. Trop. Med. Int. Health 2012, 17, 191–196. [Google Scholar] [CrossRef]
- Halestrap, P.; Scheenstra, S. Outbreak of scurvy in Tana River County, Kenya: A case report. Afr. J. Prim. Health Care Fam. Med. 2018, 10, e1–e3. [Google Scholar] [CrossRef] [PubMed]
- Cheung, E.; Mutahar, R.; Assefa, F.; Ververs, M.-T.; Nasiri, S.M.; Borrel, A.; Salama, P.; Hartini, T.N.S.; Winkvist, A.; Lindholm, L.; et al. An epidemic of scurvy in Afghanistan: Assessment and response. Food Nutr. Bull. 2003, 24, 247–255. [Google Scholar] [CrossRef]
- Khalife, R.; Grieco, A.; Khamisa, K.; Tinmouh, A.; McCudden, C.; Saidenberg, E. Scurvy, an old story in a new time: The hematologist’s experience. Blood Cells Mol. Dis. 2019, 76, 40–44. [Google Scholar] [CrossRef]
- Montagnac, J.A.; Davis, C.R.; Tanumihardjo, S.A. Nutritional value of cassava for use as a staple food and recent advances for improvement. Compr. Rev. Food Sci. Food Saf. 2009, 8, 181–194. [Google Scholar] [CrossRef]
- Carr, A.C.; Vissers, M.C. Synthetic or food-derived vitamin C—Are they equally bioavailable? Nutrients 2013, 5, 4284–4304. [Google Scholar] [CrossRef] [PubMed]
- Villalpando, S.; Montalvo-Velarde, I.; Zambrano, N.; García-Guerra, A.; Ramírez-Silva, C.I.; Shamah-Levy, T.; Rivera-Dommarco, J. Vitamins A, and C and folate status in Mexican children under 12 years and women 12–49 years: A probabilistic national survey. Salud Pública México 2003, 45, 508–519. [Google Scholar] [CrossRef]
- Bates, C.J.; Prentice, A.; Cole, T.J.; Van Der Pols, J.C.; Doyle, W.; Finch, S.; Smithers, G.; Clarke, P.C. Micronutrients: Highlights and research challenges from the 1994–5 National Diet and Nutrition Survey of people aged 65 years and over. Br. J. Nutr. 1999, 82, 7–15. [Google Scholar] [CrossRef]
- Chiplonkar, S.A.; Agte, V.V.; Mengale, S.S.; Tarwadi, K.V. Are lifestyle factors good predictors of retinol and vitamin C deficiency in apparently healthy adults? Eur. J. Clin. Nutr. 2002, 56, 96–104. [Google Scholar] [CrossRef]
- Pearson, J.F.; Pullar, J.M.; Wilson, R.; Spittlehouse, J.K.; Vissers, M.C.M.; Skidmore, P.M.L.; Willis, J.; Cameron, V.A.; Carr, A.C. Vitamin C status correlates with markers of metabolic and cognitive health in 50-year-olds: Findings of the CHALICE cohort study. Nutrients 2017, 9, E831. [Google Scholar] [CrossRef]
- Bates, B.; Collins, D.; Cox, L.; Nicholson, S.; Page, P.; Roberts, C.; Steer, T.; Swan, G. National Diet and Nutrition Survey Years 1 to 9 of the Rolling Programme (2008/2009–2016/2017): Time Trend and Income Analyses; Public Health England: London, UK, 2019; p. 56. [Google Scholar]
- Timpson, N.J.; Forouhi, N.G.; Brion, M.-J.; Harbord, R.; Cook, D.G.; Johnson, P.C.D.; McConnachie, A.; Morris, R.; Rodriguez, S.; Luan, J.; et al. Genetic variation at the SLC23A1 locus is associated with circulating concentrations of L-ascorbic acid (vitamin C): Evidence from 5 independent studies with >15,000 participants. Am. J. Clin. Nutr. 2010, 92, 375–382. [Google Scholar] [CrossRef]
- Viroonudomphol, D.; Mahaisiriyodom, A.; Mingkhawn, R.; Sadomthian, P.; Korchasri, N.; Jittngamkhum, S.; Sangcakul, A. Relationship between serum antioxidant vitamins A, E, and C and lipid profiles in priest subjects at the Priest Hospital. Southeast Asian J. Trop. Med. Public Health 2005, 36, 246–253. [Google Scholar]
- Gould, C.; Tousignant, B.; Brian, G.; McKay, R.; Gibson, R.; Bailey, K.; Venn, B.J. Cross-sectional dietary deficiencies among a prison population in Papua New Guinea. BMC Int. Health Hum. Rights 2013, 13, 21. [Google Scholar] [CrossRef]
- Ene-Obong, H.N.; Odoh, I.F.; Ikwuagwu, O.E. Plasma vitamin A and C status of in-school adolescents and associated factors in Enugu State, Nigeria. J. Health Popul. Nutr. 2003, 21, 18–25. [Google Scholar]
- Olmedilla, B.; Granado, F.; Southon, S.; Wright, A.J.A.; Blanco, I.; Gil-Martinez, E.; Berg, H.V.D.; Corridan, B.; Roussel, A.-M.; Chopra, M.; et al. Serum concentrations of carotenoids and vitamins A, E, and C in control subjects from five European countries. Br. J. Nutr. 2001, 85, 227–238. [Google Scholar] [CrossRef]
- Faure, H.; Preziosi, P.; Roussel, A.M.; Bertrais, S.; Galan, P.; Hercberg, S.; Favier, A. Factors influencing blood concentration of retinol, alpha-tocopherol, vitamin C, and beta-carotene in the French participants of the SU.VI.MAX trial. Eur. J. Clin. Nutr. 2006, 60, 706–717. [Google Scholar] [CrossRef]
- Matilainen, T.; Vartiainen, E.; Puska, P.; Alfthan, G.; Pokusajeva, S.; Moisejeva, N.; Uhanov, M. Plasma ascorbic acid concentrations in the Republic of Karelia, Russia and in North Karelia, Finland. Eur. J. Clin. Nutr. 1996, 50, 115–120. [Google Scholar]
- Frankenfeld, C.L.; Lampe, J.W.; Shannon, J.; Gao, D.L.; Li, W.; Ray, R.M.; Chen, C.; King, I.B.; Thomas, D.B. Fruit and vegetable intakes in relation to plasma nutrient concentrations in women in Shanghai, China. Public Health Nutr. 2012, 15, 167–175. [Google Scholar] [CrossRef]
- Lam, T.K.; Freedman, N.D.; Fan, J.H.; Qiao, Y.L.; Dawsey, S.M.; Taylor, P.R.; Abnet, C.C. Prediagnostic plasma vitamin C and risk of gastric adenocarcinoma and esophageal squamous cell carcinoma in a Chinese population. Am. J. Clin. Nutr. 2013, 98, 1289–1297. [Google Scholar] [CrossRef]
- Tribble, D.L.; Giuliano, L.J.; Fortmann, S.P. Reduced plasma ascorbic acid concentrations in nonsmokers regularly exposed to environmental tobacco smoke. Am. J. Clin. Nutr. 1993, 58, 886–890. [Google Scholar] [CrossRef]
- Strauss, R.S. Environmental tobacco smoke and serum vitamin C levels in children. Pediatrics 2001, 107, 540–542. [Google Scholar] [CrossRef]
- Wilson, K.M.; Finkelstein, J.N.; Blumkin, A.K.; Best, D.; Klein, J.D. Micronutrient levels in children exposed to secondhand tobacco smoke. Nicotine Tob. Res. Off. J. Soc. Res. Nicotine Tob. 2011, 13, 800–808. [Google Scholar] [CrossRef]
- Preston, A.M.; Rodriguez, C.; Rivera, C.E. Plasma ascorbate in a population of children: Influence of age, gender, vitamin C intake, BMI and smoke exposure. Puerto Rico Health Sci. J. 2006, 25, 137–142. [Google Scholar]
- Preston, A.M.; Rodriguez, C.; Rivera, C.E.; Sahai, H. Influence of environmental tobacco smoke on vitamin C status in children. Am. J. Clin. Nutr. 2003, 77, 167–172. [Google Scholar] [CrossRef]
- Bates, C.J.; Rutishauser, I.H.; Black, A.E.; Paul, A.A.; Mandal, A.R.; Patnaik, B.K. Long-term vitamin status and dietary intake of healthy elderly subjects. 2. Vitamin, C. Br. J. Nutr. 1979, 42, 43–56. [Google Scholar] [CrossRef] [PubMed]
- United Nations. 68% of the World Population Projected to Live in Urban Areas by 2050, Says UN 2018. Available online: https://www.un.org/development/desa/en/news/population/2018-revision-of-world-urbanization-prospects.html (accessed on 12 January 2020).
- World Health Organization. Air Pollution. Available online: https://www.who.int/health-topics/air-pollution#tab=tab_1 (accessed on 12 January 2020).
- Dietrich, M.; Block, G.; Benowitz, N.L.; Morrow, J.D.; Hudes, M.; Jacob, P., 3rd; Norkus, E.P.; Packer, L. Vitamin C supplementation decreases oxidative stress biomarker f2-isoprostanes in plasma of nonsmokers exposed to environmental tobacco smoke. Nutr. Cancer 2003, 45, 176–184. [Google Scholar] [CrossRef]
- Farchi, S.; Forastiere, F.; Pistelli, R.; Baldacci, S.; Simoni, M.; Perucci, C.A.; Viegi, G. Exposure to environmental tobacco smoke is associated with lower plasma beta-carotene levels among nonsmoking women married to a smoker. Cancer Epidemiol. Biomark. Prev. 2001, 10, 907–909. [Google Scholar]
- Forastiere, F.; Mallone, S.; Lo Presti, E.; Baldacci, S.; Pistelli, F.; Simoni, M.; Scalera, A.; Pedreschi, M.; Pistelli, R.; Corbo, G.; et al. Characteristics of nonsmoking women exposed to spouses who smoke: Epidemiologic study on environment and health in women from four Italian areas. Environ. Health Perspect. 2000, 108, 1171–1177. [Google Scholar] [CrossRef] [PubMed]
- Ayaori, M.; Hisada, T.; Suzukawa, M.; Yoshida, H.; Nishiwaki, M.; Ito, T.; Nakajima, K.; Higashi, K.; Yonemura, A.; Ohsuzu, F.; et al. Plasma levels and redox status of ascorbic acid and levels of lipid peroxidation products in active and passive smokers. Environ. Health Perspect. 2000, 108, 105–108. [Google Scholar] [CrossRef]
- Howard, D.J.; Ota, R.B.; Briggs, L.A.; Hampton, M.; Pritsos, C.A. Oxidative stress induced by environmental tobacco smoke in the workplace is mitigated by antioxidant supplementation. Cancer Epidemiol. Biomark. Prev. 1998, 7, 981–988. [Google Scholar]
- Galan, P.; Viteri, F.E.; Bertrais, S.; Czernichow, S.; Faure, H.; Arnaud, J.; Ruffieux, D.; Chenal, S.; Arnault, N.; Favier, A.; et al. Serum concentrations of beta-carotene, vitamins C and E, zinc and selenium are influenced by sex, age, diet, smoking status, alcohol consumption and corpulence in a general French adult population. Eur. J. Clin. Nutr. 2005, 59, 1181–1190. [Google Scholar] [CrossRef]
- Itoh, R.; Yamada, K.; Oka, J.; Echizen, H.; Murakami, K. Sex as a factor in levels of serum ascorbic acid in a healthy elderly population. Int. J. Vitam. Nutr. Res. 1989, 59, 365–372. [Google Scholar] [PubMed]
- Hughes, K.; New, A.L.; Lee, B.L.; Ong, C.N. Plasma vitamins A, C and E in the general population of Singapore, 1993 to 1995. Ann. Acad. Med. Singap. 1998, 27, 149–153. [Google Scholar] [PubMed]
- Dherani, M.; Murthy, G.V.S.; Gupta, S.K.; Young, I.S.; Maraini, G.; Camparini, M.; Price, G.M.; John, N.; Chakravarthy, U.; Fletcher, A. Blood levels of vitamin C, carotenoids and retinol are inversely associated with cataract in a North Indian population. Investig. Ophthalmol. Vis. Sci. 2008, 49, 3328–3335. [Google Scholar] [CrossRef]
- Birlouez-Aragon, I.; Delcourt, C.; Tessier, F.J.; Papoz, L. Associations of age, smoking habits and diabetes with plasma vitamin C of elderly of the POLA study. Int. J. Vitam. Nutr. Res. 2001, 71, 53–59. [Google Scholar] [CrossRef]
- Nyyssönen, K.; Parviainen, M.T.; Salonen, R.; Tuomilehto, J.; Salonen, J. Vitamin C deficiency and risk of myocardial infarction: Prospective population study of men from eastern Finland. BMJ 1997, 314, 634–648. [Google Scholar] [CrossRef]
- Koh, E.T.; Chi, M.S.; Lowenstein, F.W. Comparison of selected blood components by race, sex, and age. Am. J. Clin. Nutr. 1980, 33, 1828–1835. [Google Scholar] [CrossRef]
- Khan, R.M.; Iqbal, M.P. Deficiency of Vitamin C in South Asia. Pak. J. Med Sci. 2006, 22, 347–355. [Google Scholar]
- Darmon, N.; Drewnowski, A. Contribution of food prices and diet cost to socioeconomic disparities in diet quality and health: A systematic review and analysis. Nutr. Rev. 2015, 73, 643–660. [Google Scholar] [CrossRef]
- Canoy, D.; Wareham, N.; Welch, A.; Bingham, S.; Luben, R.; Day, N.; Khaw, K.T. Plasma ascorbic acid concentrations and fat distribution in 19,068 British men and women in the European Prospective Investigation into Cancer and Nutrition Norfolk cohort study. Am. J. Clin. Nutr. 2005, 82, 1203–1209. [Google Scholar] [CrossRef]
- Garcia, O.P.; Ronquillo, D.; Caamano Mdel, C.; Camacho, M.; Long, K.Z.; Rosado, J.L. Zinc, vitamin A, and vitamin C status are associated with leptin concentrations and obesity in Mexican women: Results from a cross-sectional study. Nutr. Metab. 2012, 9, 59. [Google Scholar] [CrossRef]
- Block, G.; Mangels, A.R.; Patterson, B.H.; Levander, O.A.; Norkus, E.P.; Taylor, P.R. Body weight and prior depletion affect plasma ascorbate levels attained on identical vitamin C intake: A controlled-diet study. J. Am. Coll Nutr. 1999, 18, 628–637. [Google Scholar] [CrossRef] [PubMed]
- Carr, A.C.; Pullar, J.M.; Bozonet, S.M.; Vissers, M.C. Marginal ascorbate status (hypovitaminosis C) results in an attenuated response to vitamin C supplementation. Nutrients 2016, 8, E341. [Google Scholar] [CrossRef] [PubMed]
- Ng, M.; Fleming, T.; Robinson, M.; Thomson, B.; Graetz, N.; Margono, C.; Mullany, E.C.; Biryukov, S.; Abbafati, C.; Abera, S.F.; et al. Global, regional, and national prevalence of overweight and obesity in children and adults during 1980–2013: A systematic analysis for the Global Burden of Disease Study 2013. Lancet 2014, 384, 766–781. [Google Scholar] [CrossRef]
- Yatsuya, H.; Li, Y.; Hilawe, E.H.; Ota, A.; Wang, C.; Chiang, C.; Zhang, Y.; Uemura, M.; Osako, A.; Ozaki, Y.; et al. Global trend in overweight and obesity and its association with cardiovascular disease incidence. Circ. J. 2014, 78, 2807–2818. [Google Scholar] [CrossRef] [PubMed]
- Saito, K.; Yokoyama, T.; Yoshida, H.; Kim, H.; Shimada, H.; Yoshida, Y.; Iwasa, H.; Shimizu, Y.; Kondo, Y.; Handa, S.; et al. A significant relationship between plasma vitamin C concentration and physical performance among Japanese elderly women. J. Gerontol. Ser. Boil. Sci. Med. Sci. 2011, 67, 295–301. [Google Scholar] [CrossRef]
- Cahill, L.; Corey, P.N.; El-Sohemy, A. Vitamin C deficiency in a population of young Canadian adults. Am. J. Epidemiol. 2009, 170, 464–471. [Google Scholar] [CrossRef]
- Cahill, L.E.; El-Sohemy, A. Vitamin C transporter gene polymorphisms, dietary vitamin C and serum ascorbic acid. J. Nutrigenet. Nutrigenom. 2009, 2, 292–301. [Google Scholar] [CrossRef]
- Langlois, M.R.; Delanghe, J.R.; De Buyzere, M.L.; Bernard, D.R.; Ouyang, J. Effect of haptoglobin on the metabolism of vitamin, C. Am. J. Clin. Nutr. 1997, 66, 606–610. [Google Scholar] [CrossRef]
- Na, N.; Delanghe, J.R.; Taes, Y.E.; Torck, M.; Baeyens, W.R.; Ouyang, J. Serum vitamin C concentration is influenced by haptoglobin polymorphism and iron status in Chinese. Clin. Chim. Acta 2006, 365, 319–324. [Google Scholar] [CrossRef]
- Cahill, L.E.; El-Sohemy, A. Haptoglobin genotype modifies the association between dietary vitamin C and serum ascorbic acid deficiency. Am. J. Clin. Nutr. 2010, 92, 1494–1500. [Google Scholar] [CrossRef]
- Marangon, K.; Herbeth, B.; Lecomte, E.; Paul-Dauphin, A.; Grolier, P.; Chancerelle, Y.; Artur, Y.; Siest, G. Diet, antioxidant status, and smoking habits in French men. Am. J. Clin. Nutr. 1998, 67, 231–239. [Google Scholar] [CrossRef] [PubMed]
- Schectman, G.; Byrd, J.C.; Gruchow, H.W. The influence of smoking on vitamin C status in adults. Am. J. Public Health 1989, 79, 158–162. [Google Scholar] [CrossRef] [PubMed]
- Schectman, G.; Byrd, J.C.; Hoffmann, R. Ascorbic acid requirements for smokers: Analysis of a population survey. Am. J. Clin. Nutr. 1991, 53, 1466–1470. [Google Scholar] [CrossRef] [PubMed]
- Boonpangrak, S.; Tantimongcolwat, T.; Treeratanapiboon, L.; Leelahakul, P.; Prachayasittikul, V. Lifestyle behaviors and serum vitamin C in the Thai population in Bangkok Metropolitan. EXCLI J. 2018, 17, 452–466. [Google Scholar]
- McGregor, G.P.; Biesalski, H.K. Rationale and impact of vitamin C in clinical nutrition. Curr. Opin. Clin. Nutr. Metab. Care 2006, 9, 697–703. [Google Scholar] [CrossRef]
- Carr, A.C.; Cook, J. Intravenous vitamin C for cancer therapy—Identifying the current gaps in our knowledge. Front. Physiol. 2018, 9, 1182. [Google Scholar] [CrossRef]
- Carr, A.C. Vitamin C in pneumonia and sepsis. In Vitamin C: New Biochemical and Functional Insights: Oxidative Stress and Disease; Chen, Q., Vissers, M., Eds.; CRC Press/Taylor & Francis: Boca Raton, FL, USA, 2020; pp. 115–135. [Google Scholar]
- Juhl, B.; Lauszus, F.F.; Lykkesfeldt, J. Is Diabetes Associated with Lower Vitamin C Status in Pregnant Women? A Prospective Study. Int. J. Vitam. Nutr. Res. 2016, 86, 184–189. [Google Scholar] [CrossRef]
- Juhl, B.; Lauszus, F.F.; Lykkesfeldt, J. Poor Vitamin C Status Late in Pregnancy Is Associated with Increased Risk of Complications in Type 1 Diabetic Women: A Cross-Sectional Study. Nutrients 2017, 9, 186. [Google Scholar] [CrossRef]
- Rumbold, A.; Ota, E.; Nagata, C.; Shahrook, S.; Crowther, C.A. Vitamin C Supplementation in Pregnancy. Cochrane Database Syst. Rev. 2015. [Google Scholar] [CrossRef]
- Lykkesfeldt, J.; Poulsen, H.E. Is vitamin C supplementation beneficial? Lessons learned from randomised controlled trials. Br. J. Nutr. 2010, 103, 1251–1259. [Google Scholar] [CrossRef]
- Ugwa, E. Vitamin C supplementation in pregnancy: A review of current literature. Niger. J. Basic Clin. Sci. 2015, 12, 1–5. [Google Scholar] [CrossRef]
- Camarena, V.; Wang, G. The epigenetic role of vitamin C in health and disease. Cell Mol. Life Sci. 2016, 73, 1645–1658. [Google Scholar] [CrossRef] [PubMed]
- DiTroia, S.P.; Percharde, M.; Guerquin, M.-J.; Wall, E.; Collignon, E.; Ebata, K.T.; Mesh, K.; Mahesula, S.; Agathocleous, M.; Laird, D.J.; et al. Maternal vitamin C regulates reprogramming of DNA methylation and germline development. Nature 2019, 573, 271–275. [Google Scholar] [CrossRef] [PubMed]
- Michels, A.J.; Hagen, T.M.; Frei, B. Human genetic variation influences vitamin C homeostasis by altering vitamin C transport and antioxidant enzyme function. Annu. Rev. Nutr. 2013, 33, 45–70. [Google Scholar] [CrossRef] [PubMed]
- Delanghe, J.R.; Langlois, M.R.; De Buyzere, M.L.; Torck, M.A. Vitamin C deficiency and scurvy are not only a dietary problem but are codetermined by the haptoglobin polymorphism. Clin. Chem. 2007, 53, 1397–1400. [Google Scholar] [CrossRef] [PubMed]
- Langlois, M.R.; Delanghe, J.R. Biological and clinical significance of haptoglobin polymorphism in humans. Clin. Chem. 1996, 42, 1589–1600. [Google Scholar] [CrossRef]
- Cahill, L.E.; Fontaine-Bisson, B.; El-Sohemy, A. Functional genetic variants of glutathione S-transferase protect against serum ascorbic acid deficiency. Am. J. Clin. Nutr. 2009, 90, 1411–1417. [Google Scholar] [CrossRef]
- Ames, B.N.; Elson-Schwab, I.; Silver, E.A. High-dose vitamin therapy stimulates variant enzymes with decreased coenzyme binding affinity (increased K(m)). Am. J. Clin. Nutr. 2002, 75, 616–658. [Google Scholar] [CrossRef]
- Levine, M.; Eck, P. Vitamin C: Working on the x-axis. Am. J. Clin. Nutr. 2009, 90, 1121–1123. [Google Scholar] [CrossRef]
- Lykkesfeldt, J.; Viscovich, M.; Poulsen, H.E. Plasma malondialdehyde is induced by smoking: A study with balanced antioxidant profiles. Br. J. Nutr. 2004, 92, 203–206. [Google Scholar] [CrossRef]
- Zondervan, K.T.; Ocke, M.C.; Smit, H.A.; Seidell, J.C. Do dietary and supplementary intakes of antioxidants differ with smoking status? Int. J. Epidemiol. 1996, 25, 70–79. [Google Scholar] [CrossRef] [PubMed]
- Larkin, F.A.; Basiotis, P.P.; Riddick, H.A.; Sykes, K.E.; Pao, E.M. Dietary patterns of women smokers and non-smokers. J. Am. Diet Assoc. 1990, 90, 230–237. [Google Scholar] [PubMed]
- Dietrich, M.; Block, G.; Norkus, E.P.; Hudes, M.; Traber, M.G.; Cross, C.E.; Packer, L. Smoking and exposure to environmental tobacco smoke decrease some plasma antioxidants and increase gamma-tocopherol in vivo after adjustment for dietary antioxidant intakes. Am. J. Clin. Nutr. 2003, 77, 160–166. [Google Scholar] [CrossRef] [PubMed]
- Lykkesfeldt, J.; Christen, S.; Wallock, L.M.; Chang, H.H.; Jacob, R.A.; Ames, B.N. Ascorbate is depleted by smoking and repleted by moderate supplementation: A study in male smokers and nonsmokers with matched dietary antioxidant intakes. Am. J. Clin. Nutr. 2000, 71, 530–536. [Google Scholar] [CrossRef]
- Kallner, A.B.; Hartmann, D.; Hornig, D.H. On the requirements of ascorbic acid in man: Steady-state turnover and body pool in smokers. Am. J. Clin. Nutr. 1981, 34, 1347–1355. [Google Scholar] [CrossRef]
- GBD 2015 Tobacco Collaborators. Smoking prevalence and attributable disease burden in 195 countries and territories, 1990–2015: A systematic analysis from the Global Burden of Disease Study 2015. Lancet 2017, 389, 1885–1906. [Google Scholar] [CrossRef]
- Lykkesfeldt, J.; Prieme, H.; Loft, S.; Poulsen, H.E. Effect of smoking cessation on plasma ascorbic acid concentration. BMJ 1996, 313, 91. [Google Scholar] [CrossRef]
- Sharma, Y.; Miller, M.; Shahi, R.; Doyle, A.; Horwood, C.; Hakendorf, P.; Thompson, C. Vitamin C deficiency in Australian hospitalized patients: An observational study. Intern. Med. J. 2019, 49, 189–196. [Google Scholar] [CrossRef]
- Gan, R.; Eintracht, S.; Hoffer, L.J. Vitamin C deficiency in a university teaching hospital. J. Am. Coll. Nutr. 2008, 27, 428–433. [Google Scholar] [CrossRef]
- Gariballa, S.; Forster, S. Effects of acute-phase response on nutritional status and clinical outcome of hospitalized patients. Nutrition 2006, 22, 750–757. [Google Scholar] [CrossRef]
- Fain, O.; Pariès, J.; Jacquart, B.; Le Moël, G.; Kettaneh, A.; Stirnemann, J.; Héron, C.; Sitbon, M.; Taleb, C.; Letellier, E.; et al. Hypovitaminosis C in hospitalized patients. Eur. J. Intern. Med. 2003, 14, 419–425. [Google Scholar] [PubMed]
- Hemilä, H. Vitamin C and infections. Nutrients 2017, 9, E339. [Google Scholar] [CrossRef] [PubMed]
- Carr, A.C.; Spencer, E.; Dixon, L.; Chambers, S.T. Patients with community acquired pneumonia exhibit depleted vitamin C status and elevated oxidative stress. Nutrients 2020, 12, 1318. [Google Scholar] [CrossRef] [PubMed]
- Carr, A.C.; Rosengrave, P.C.; Bayer, S.; Chambers, S.; Mehrtens, J.; Shaw, G.M. Hypovitaminosis C and vitamin C deficiency in critically ill patients despite recommended enteral and parenteral intakes. Crit. Care 2017, 21, 300. [Google Scholar] [CrossRef] [PubMed]
- Johnston, C.S.; Corte, C. People with marginal vitamin C status are at high risk of developing vitamin C deficiency. J. Am. Diet. Assoc. 1999, 99, 854–856. [Google Scholar] [PubMed]
- Hampl, J.S.; Taylor, C.A.; Johnston, C.S. Vitamin C deficiency and depletion in the United States: The Third National Health and Nutrition Examination Survey, 1988 to 1994. Am. J. Public Health 2004, 94, 870–875. [Google Scholar] [CrossRef]
- Institute of Medicine Panel on Dietary Antioxidants and Related Compounds. Dietary Reference Intakes for Vitamin, C.; Vitamin, E.; Selenium, and Carotenoids; National Academies Press: Washington, DC, USA, 2000; p. 529.
- Loria, C.M.; Whelton, P.K.; Caulfield, L.E.; Szklo, M.; Klag, M.J. Agreement among indicators of vitamin C status. Am. J. Epidemiol. 1998, 147, 587–596. [Google Scholar] [CrossRef]
- Washko, P.W.; Welch, R.W.; Dhariwal, K.R.; Wang, Y.; Levine, M. Ascorbic acid and dehydroascorbic acid analyses in biological samples. Anal. Biochem. 1992, 204, 1–14. [Google Scholar] [CrossRef]
- Amaliya; Timmerman, M.F.; Abbas, F.; Loos, B.G.; Van der Weijden, G.A.; Van Winkelhoff, A.J.; Winkel, E.G.; Van der Velden, U. Java project on periodontal diseases: The relationship between vitamin C and the severity of periodontitis. J. Clin. Periodontol. 2007, 34, 299–304. [Google Scholar]
- Amaliya, A.; Laine, M.L.; Delanghe, J.R.; Loos, B.G.; Van Wijk, A.J.; Van der Velden, U. Java project on periodontal diseases: Periodontal bone loss in relation to environmental and systemic conditions. J. Clin. Periodontol. 2015, 42, 325–332. [Google Scholar] [CrossRef]
- Pullar, J.M.; Bayer, S.; Carr, A.C. Appropriate handling, processing and analysis of blood samples is essential to avoid oxidation of vitamin C to dehydroascorbic acid. Antioxidants 2018, 7, E29. [Google Scholar] [CrossRef] [PubMed]


| Factor | Summary and Comments | References |
|---|---|---|
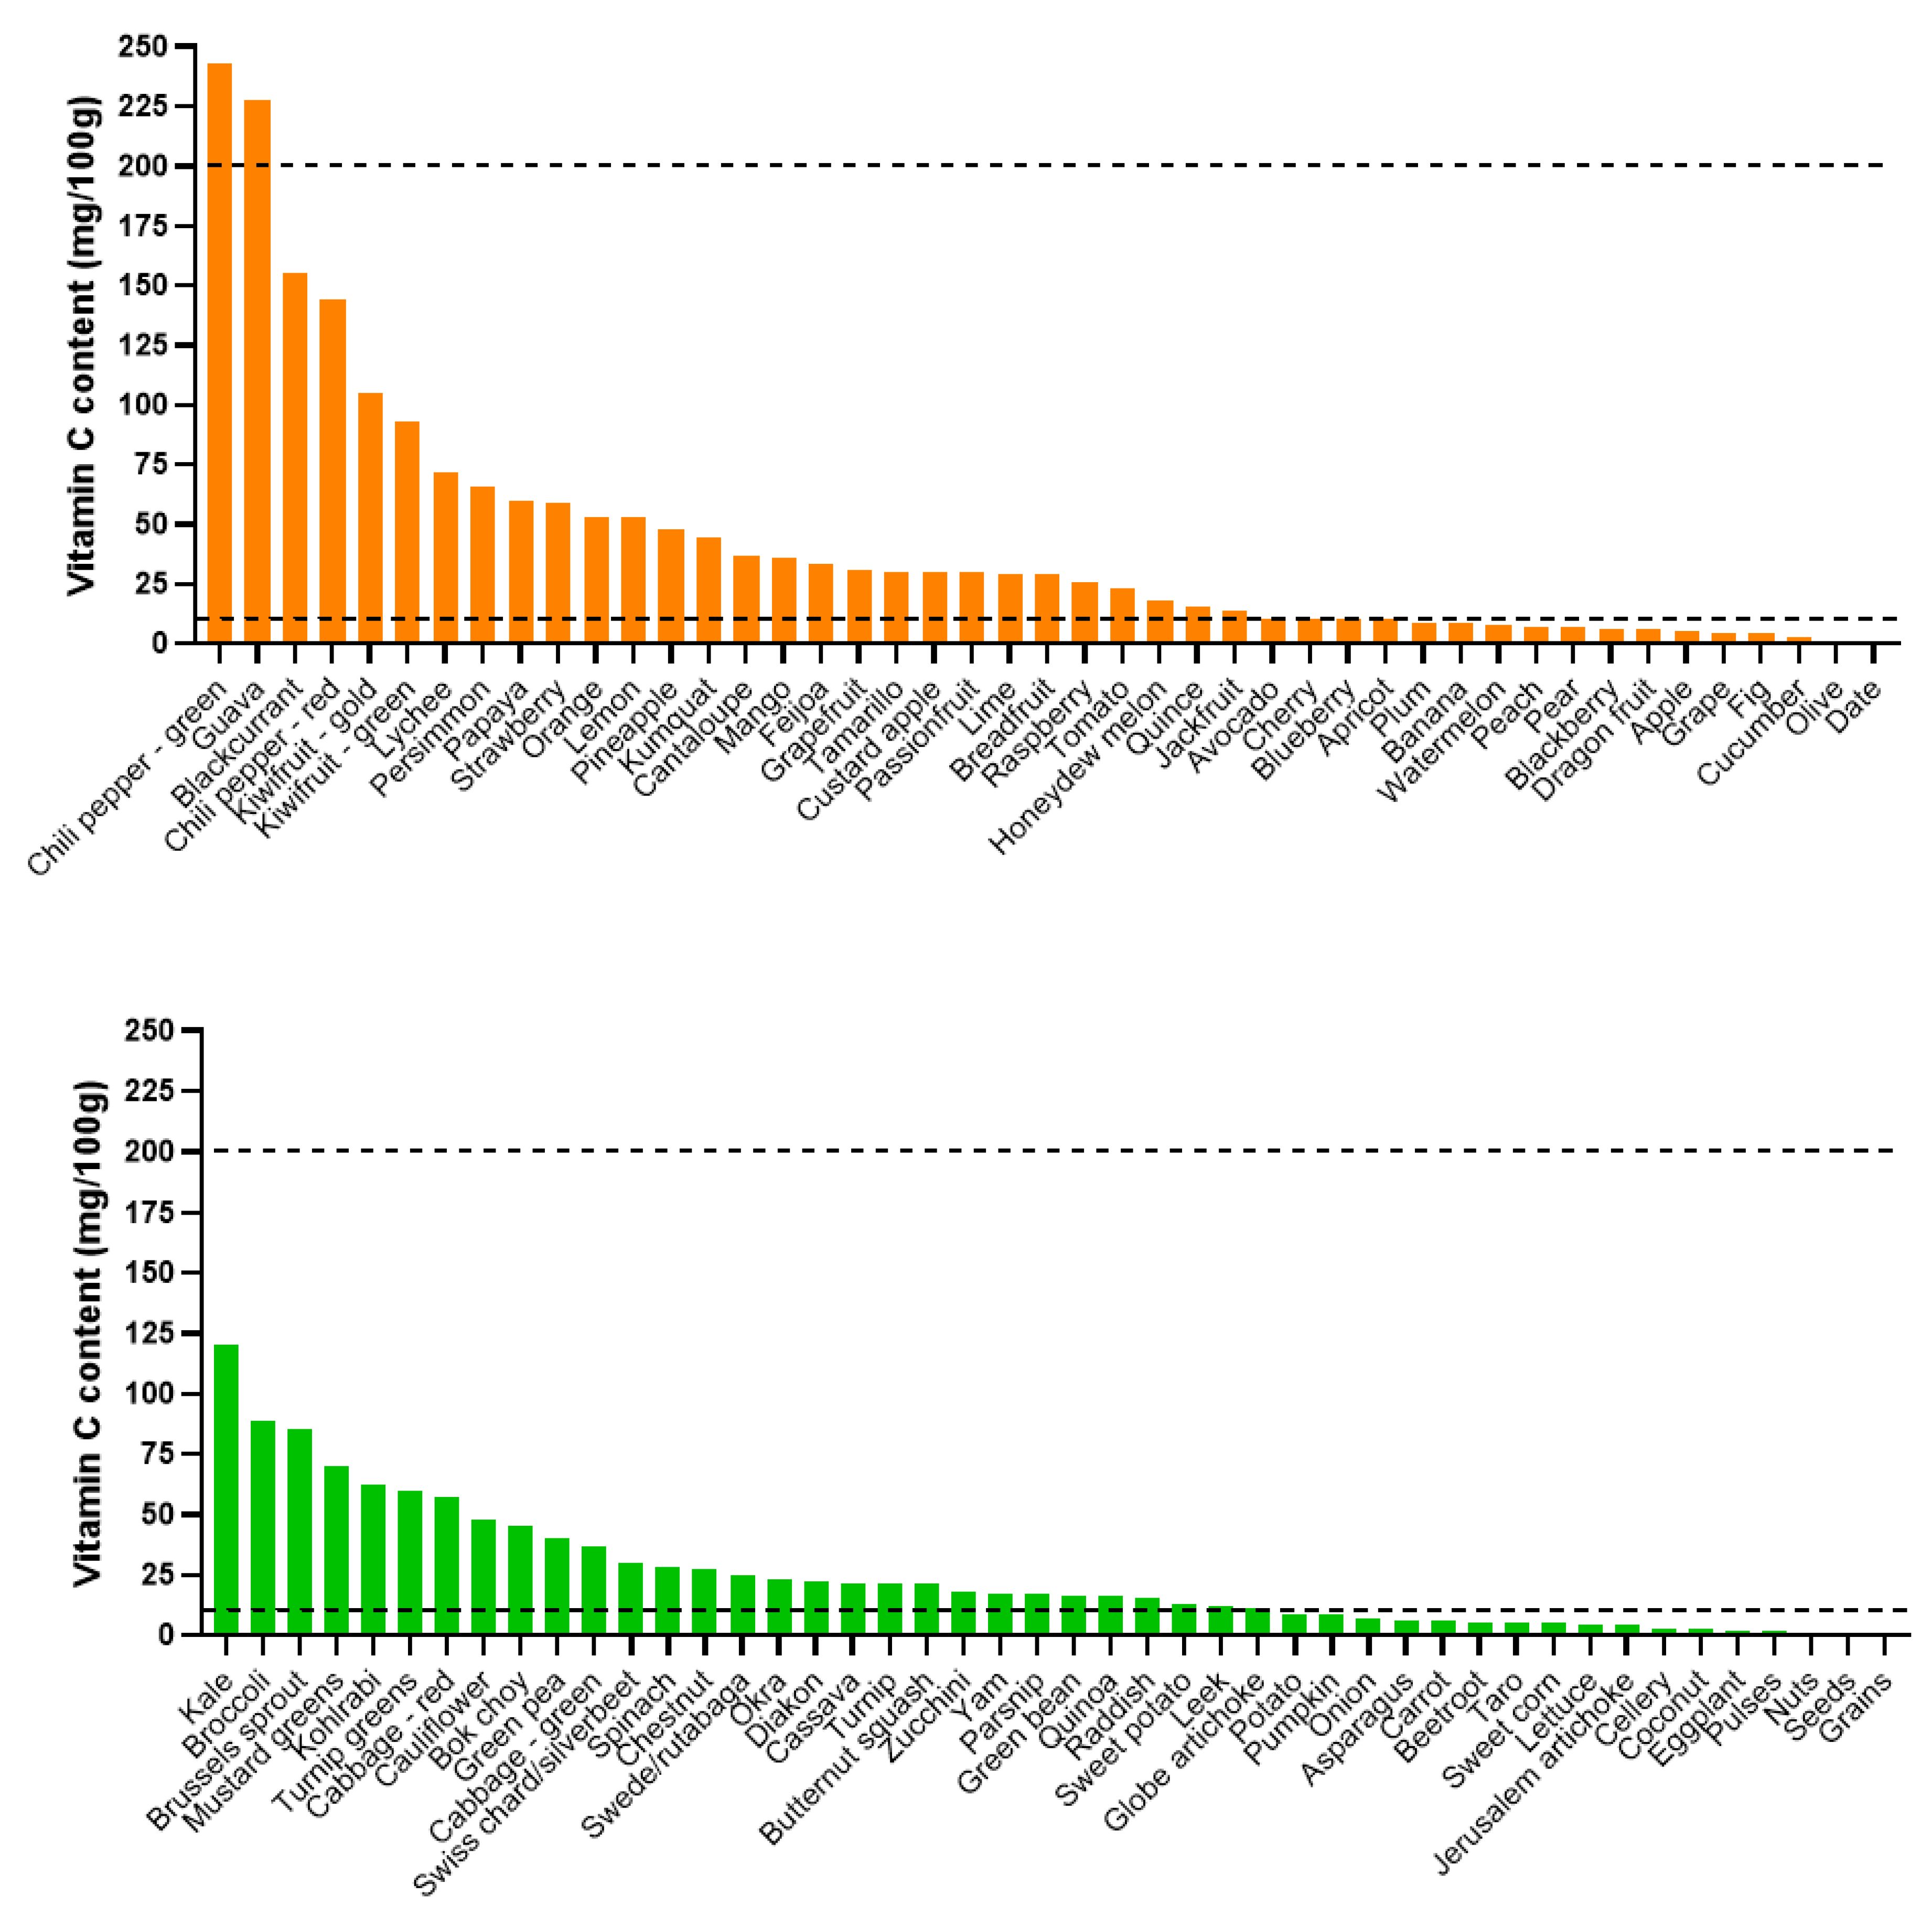
| Dietary intake | Dietary intake, particularly fruit intake, correlates with improved vitamin C status and decreased prevalence of deficiency; is dependent on the amount consumed, frequency of consumption, and type of food consumed as the vitamin C content of food varies. High dietary fat and sugar intake are associated with decreased vitamin C intake and status. | [14,15,16,17,19,20,21,22,23,24] |
| Staple foods | Staple foods such as grains (e.g., rice, millet, wheat/couscous, corn) and some starchy roots and tubers are low in vitamin C; populations who consume these staples can have lower overall vitamin C intake. | [18,25] |
| Traditional cooking practices | Through boiling or steaming, water-soluble vitamins may be leached from food and prolonged cooking of food can destroy vitamin C; this could lead to decreased vitamin C status in certain social or ethnic groups. Drying of leafy vegetables also decreases water-soluble vitamins. | [26,27] |
| Supplement use | Supplement users have significantly higher vitamin C status and negligible prevalence of deficiency. Non-users have a 2–3 fold odds ratio of insufficient and deficient vitamin C status. | [14,15,19,28,29,30] |
| Factor | Summary and Comments | References |
|---|---|---|
| Socioeconomic status/deprivation | Individuals with lower socioeconomic status or higher deprivation have lower vitamin C status and a higher prevalence of deficiency; this is partly due to the higher cost of good quality, nutrient-dense food. | [15,19,21,24,28,40,41,42,43,44,45] |
| Education and social class | Similarly, individuals with lower education and manual occupations have lower vitamin C status. | [14,17,20,28,42] |
| Institutionalized | Institutionalized elderly, and other institutionalized individuals (e.g., priests, prisoners, boarding school children) have lower vitamin C status and a higher prevalence of deficiency; this is partly due to a lower dietary intake. | [41,46,47,48] |
| Factor | Summary and Comments | References |
|---|---|---|
| Geographical region | Vitamin C status varies by geographical region, both within and between countries; this could partly reflect differences in socioeconomic status and available foods. | [17,19,24,40,41,49,50,51] |
| Season | Vitamin C status varies seasonally between countries, likely reflecting different crops and thus the types and/or amounts of vitamin C-rich foods consumed. | [24,30,52,53] |
| Climate | Drought and harsh winter climates have been associated with outbreaks of clinical scurvy. | [36] |
| Pollution | Exposure to environmental pollutants, e.g., smoke, can deplete vitamin C status; this is partly due to enhanced oxidative stress. | [24,42,54,55,56,57,58] |
| Factor | Summary and Comments | References |
|---|---|---|
| Sex | Males generally have lower vitamin C status, and a higher prevalence of deficiency, than females; this is partly a result of a volumetric dilution effect due to the higher fat-free mass of males. This difference is less apparent in some low- and middle-income countries. | [14,15,17,19,22,24,26,28,29,30,42,43,49,50,53,67,68,69,70] |
| Age | Both children and elderly tend to have higher vitamin C status in high-income settings; this could partly be due to lower body weight. Elderly can have a higher prevalence of vitamin C deficiency in some settings; this could be due to lower intake and/or comorbidities. | [14,15,20,24,28,29,41,50,71,72] |
| Race | In the US and UK, African-Caribbean and South Asian people had a lower status than Caucasians. In South Asia, Malays and Indians had a lower status than Chinese; this is thought to be partly due to differences in culinary practices. Differences are more apparent between women of different races. | [15,26,30,73,74] |
| Factor | Summary and Comments | References |
|---|---|---|
| Bodyweight, BMI | Individuals with higher body weight or BMI have lower vitamin C status; this is likely partly due to a volumetric dilution effect. | [14,15,16,24,29,30,43,67,76,77,82,83] |
| Physical activity | Physical activity level positively correlates with vitamin C status, with inactive individuals having a 3-fold odds ratio of deficiency; this is likely partly due to associated lifestyle factors such as diet and body weight. | [28,29] |
| Pregnancy and lactation | Pregnancy is associated with lower vitamin C status; this is partly due to hemodilution and active transfer of vitamin C to the developing fetus and growing infant via breastmilk. | [34] |
| Genetic variants | Polymorphisms in the genes for the vitamin C transporter (SVCT1) and haptoglobin (Hp2-2) are associated with lower vitamin C status; the latter is thought to be due to enhanced oxidative stress. | [6,45,84,85,86,87] |
| Smoking | Smokers have lower vitamin C status and a higher prevalence of deficiency than nonsmokers; this is partly due to enhanced oxidative stress. | [14,15,16,19,20,24,28,29,30,43,45,50,53,54,67,71,88,89,90,91] |
| Disease states | Various communicable and noncommunicable diseases are associated with lower vitamin C status; this is partly due to inflammatory processes and enhanced oxidative stress. | [9,92,93,94] |
© 2020 by the authors. Licensee MDPI, Basel, Switzerland. This article is an open access article distributed under the terms and conditions of the Creative Commons Attribution (CC BY) license (http://creativecommons.org/licenses/by/4.0/).
Share and Cite
Carr, A.C.; Rowe, S. Factors Affecting Vitamin C Status and Prevalence of Deficiency: A Global Health Perspective. Nutrients 2020, 12, 1963. https://doi.org/10.3390/nu12071963
Carr AC, Rowe S. Factors Affecting Vitamin C Status and Prevalence of Deficiency: A Global Health Perspective. Nutrients. 2020; 12(7):1963. https://doi.org/10.3390/nu12071963
Chicago/Turabian StyleCarr, Anitra C., and Sam Rowe. 2020. "Factors Affecting Vitamin C Status and Prevalence of Deficiency: A Global Health Perspective" Nutrients 12, no. 7: 1963. https://doi.org/10.3390/nu12071963
APA StyleCarr, A. C., & Rowe, S. (2020). Factors Affecting Vitamin C Status and Prevalence of Deficiency: A Global Health Perspective. Nutrients, 12(7), 1963. https://doi.org/10.3390/nu12071963