A Comprehensive Critical Assessment of Increased Fruit and Vegetable Intake on Weight Loss in Women


Abstract
1. Introduction
2. Methods
3. Observational Studies
3.1. Primary Studies
3.1.1. Premenopausal Women
Studies from Australia
- Two studies in young Australian women from the Longitudinal Study on Women’s Health (4000 women each; mean baseline age 28 years; BMI 18.5 to <25; and low baseline fruit and vegetable index (FAVI)) showed women in the highest and middle tertile intake of FAVI reduced weight gain by −1.3 to −1.6 kg (95% CI: −0.2 to −2.4 kg) over 6 years (p < 0.01 to p < 0.05) compared to women in the lowest tertile [15,16]. These studies showed that increased FV intake supported reduced weight gain of 0.12 kg for each 10-point increase in FAVI.
Studies from the United States of America
- A prospective study (47,898 NHS II women; mean baseline age of 37.5 and BMI of 23) observed the 4-year weight changes associated with a wide range of foods, including FV and beverages [17]. In premenopausal women mean weight change per daily serving (95% CI; all p < 0.001) for total fruit was −0.30 kg (−0.26 to −0.33 kg) and for total vegetables was −0.16 kg (−0.14 to −0.17 kg). French fries increased body weight by +1.65 kg (1.37 to 1.93 kg) and boiled, baked, or mashed potatoes +0.35 kg (0.22 to 0.48 kg). Fruit juice (100%) increased weight by +0.22 kg (0.19 to 0.26 kg).
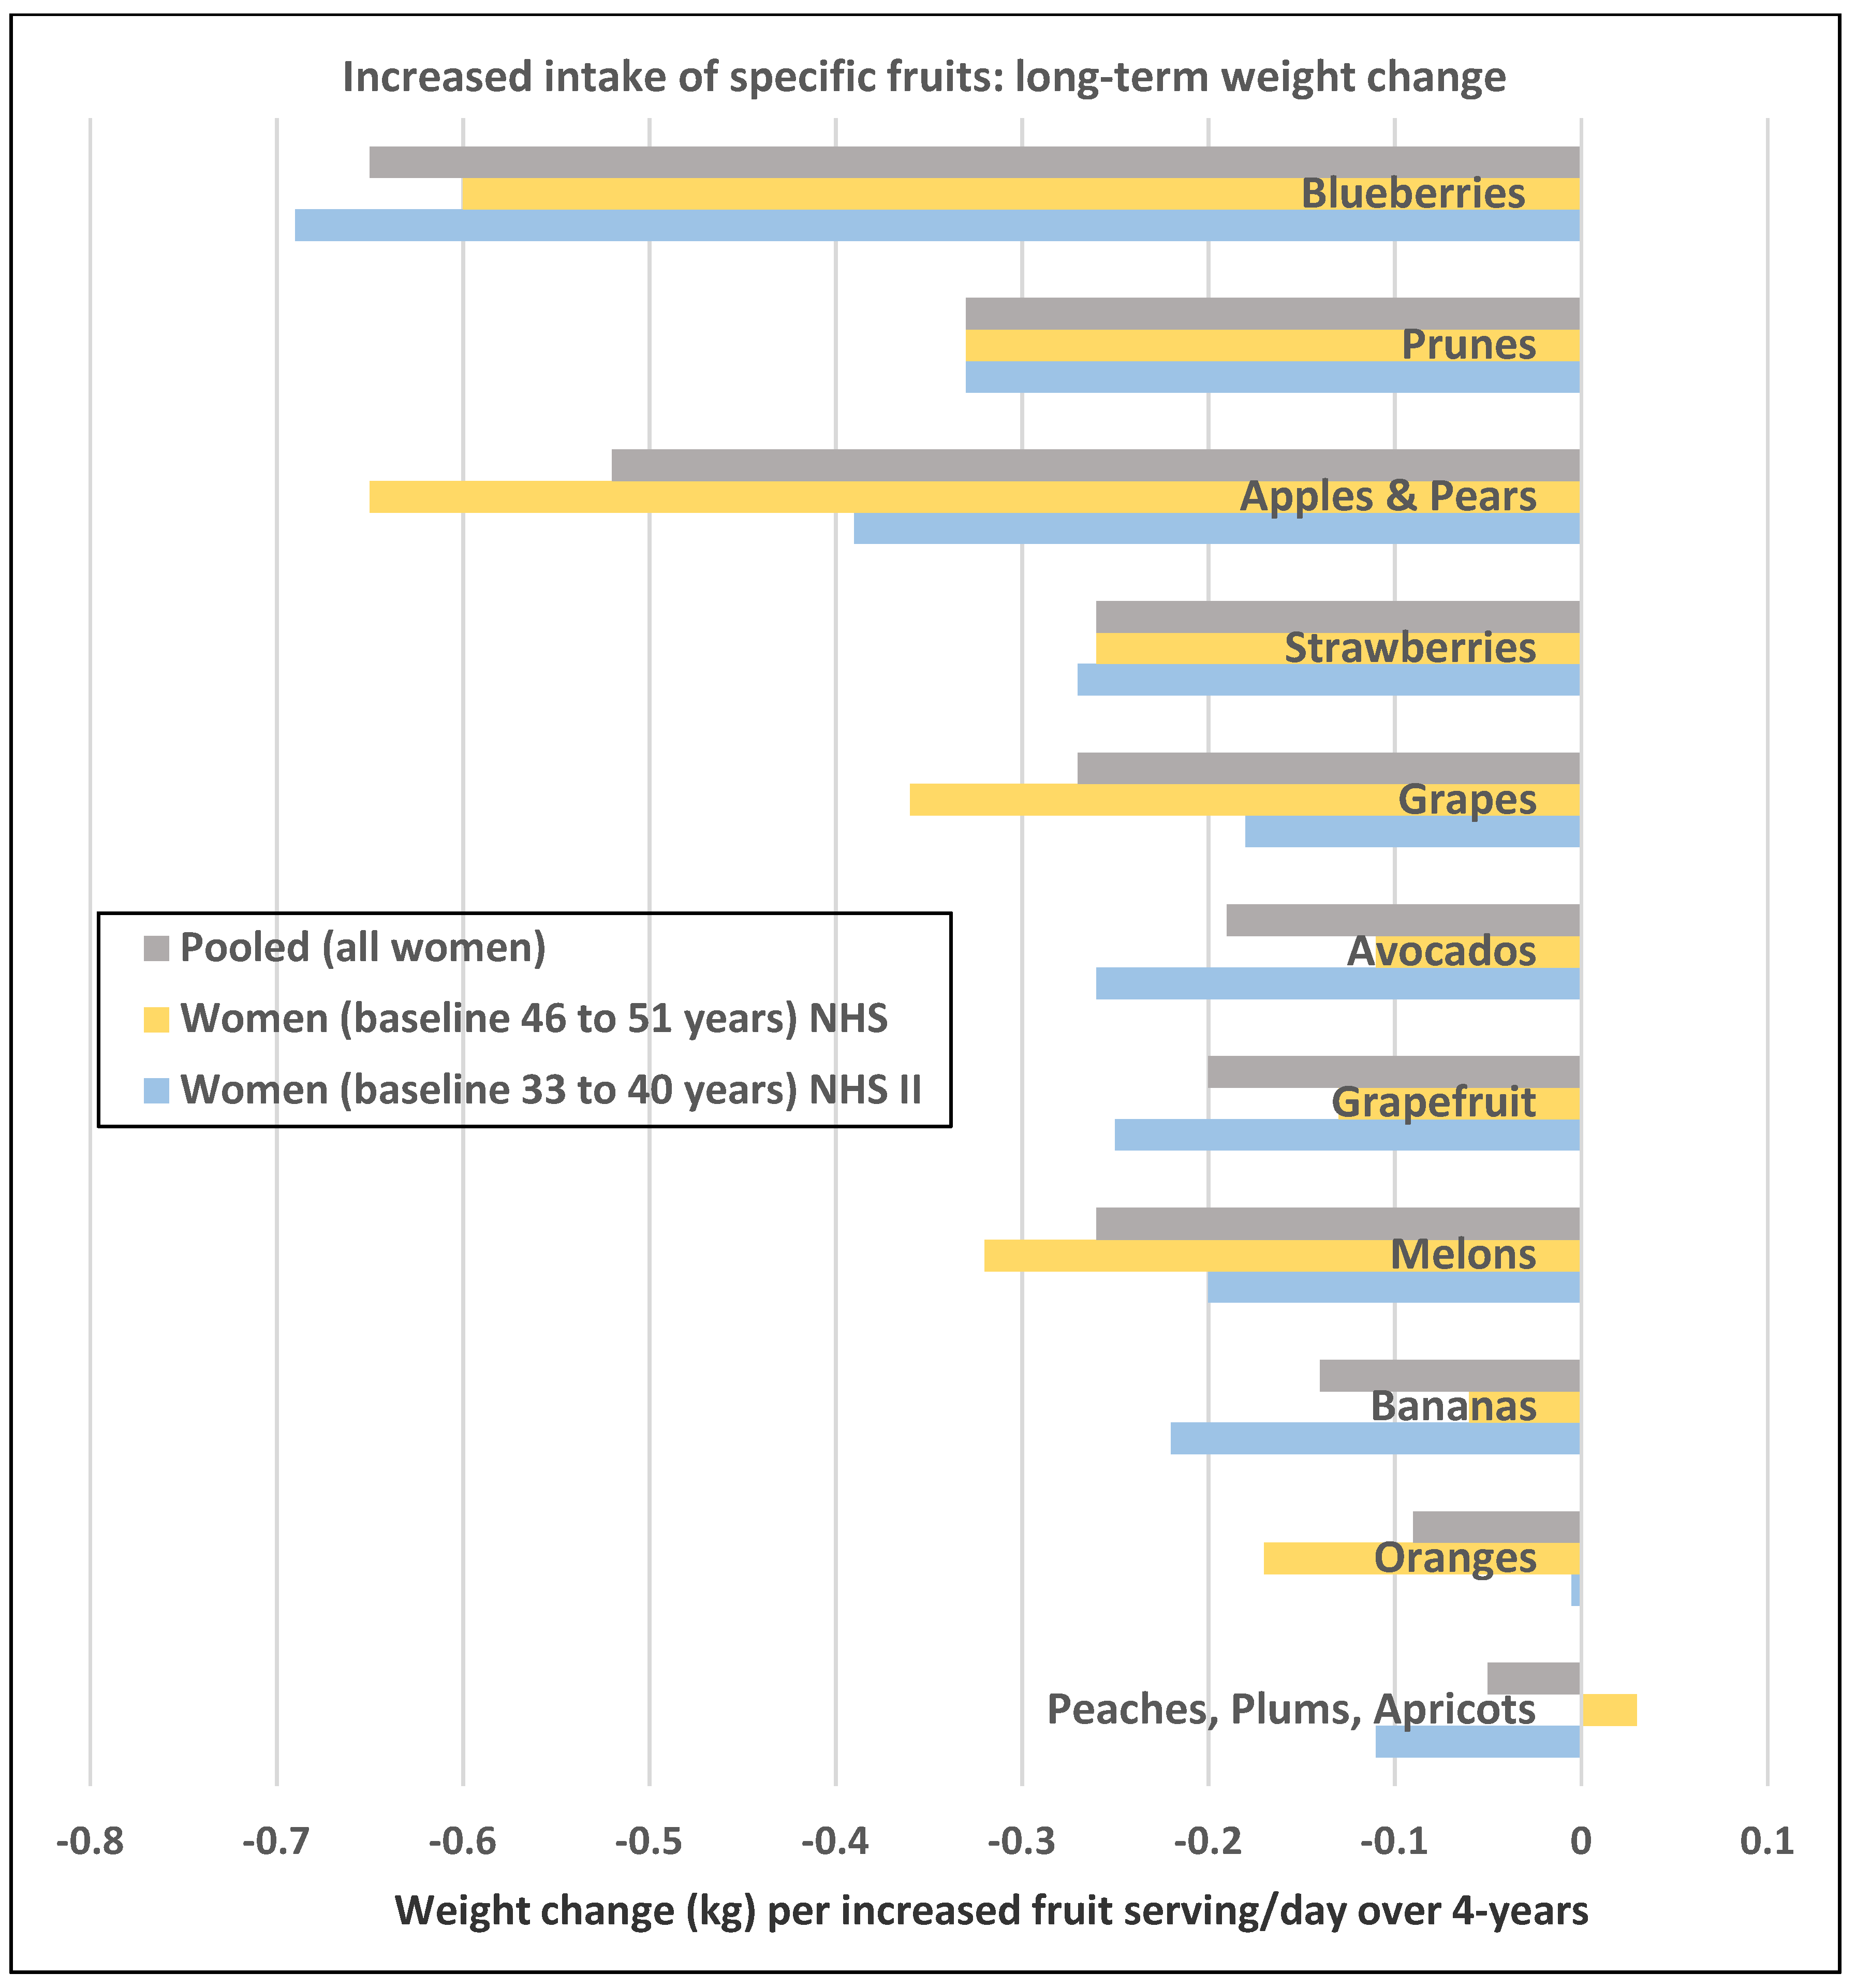
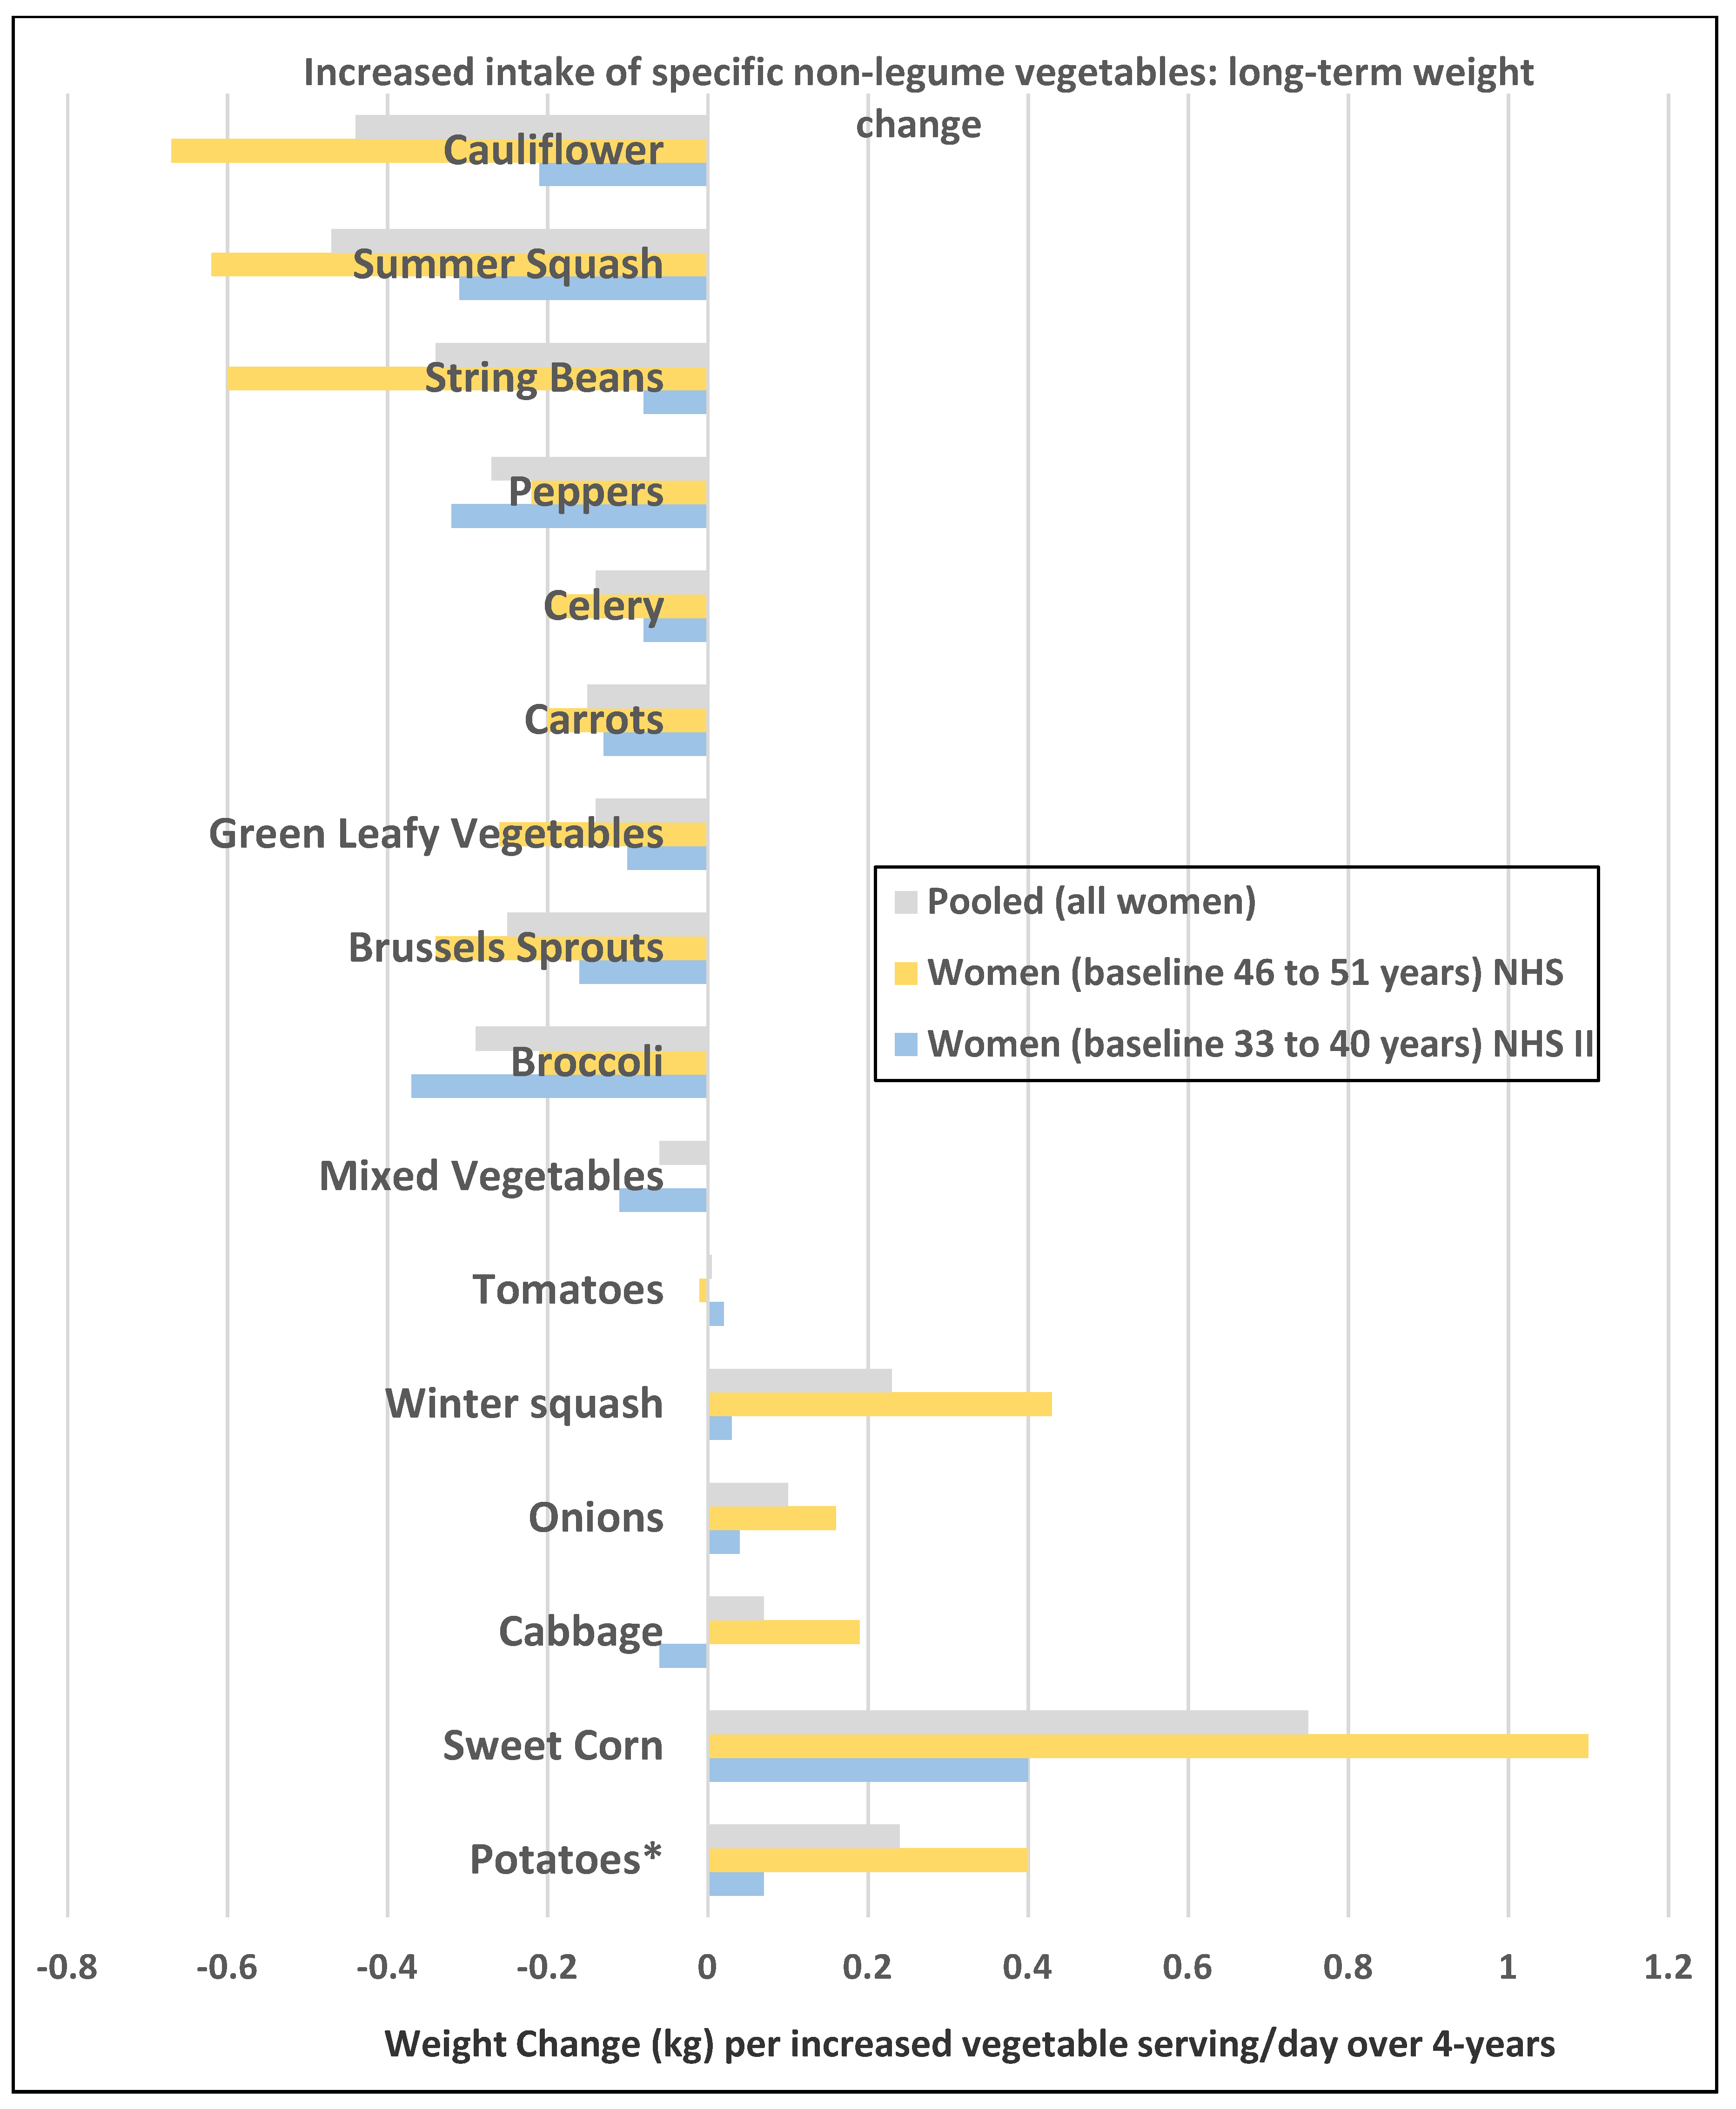
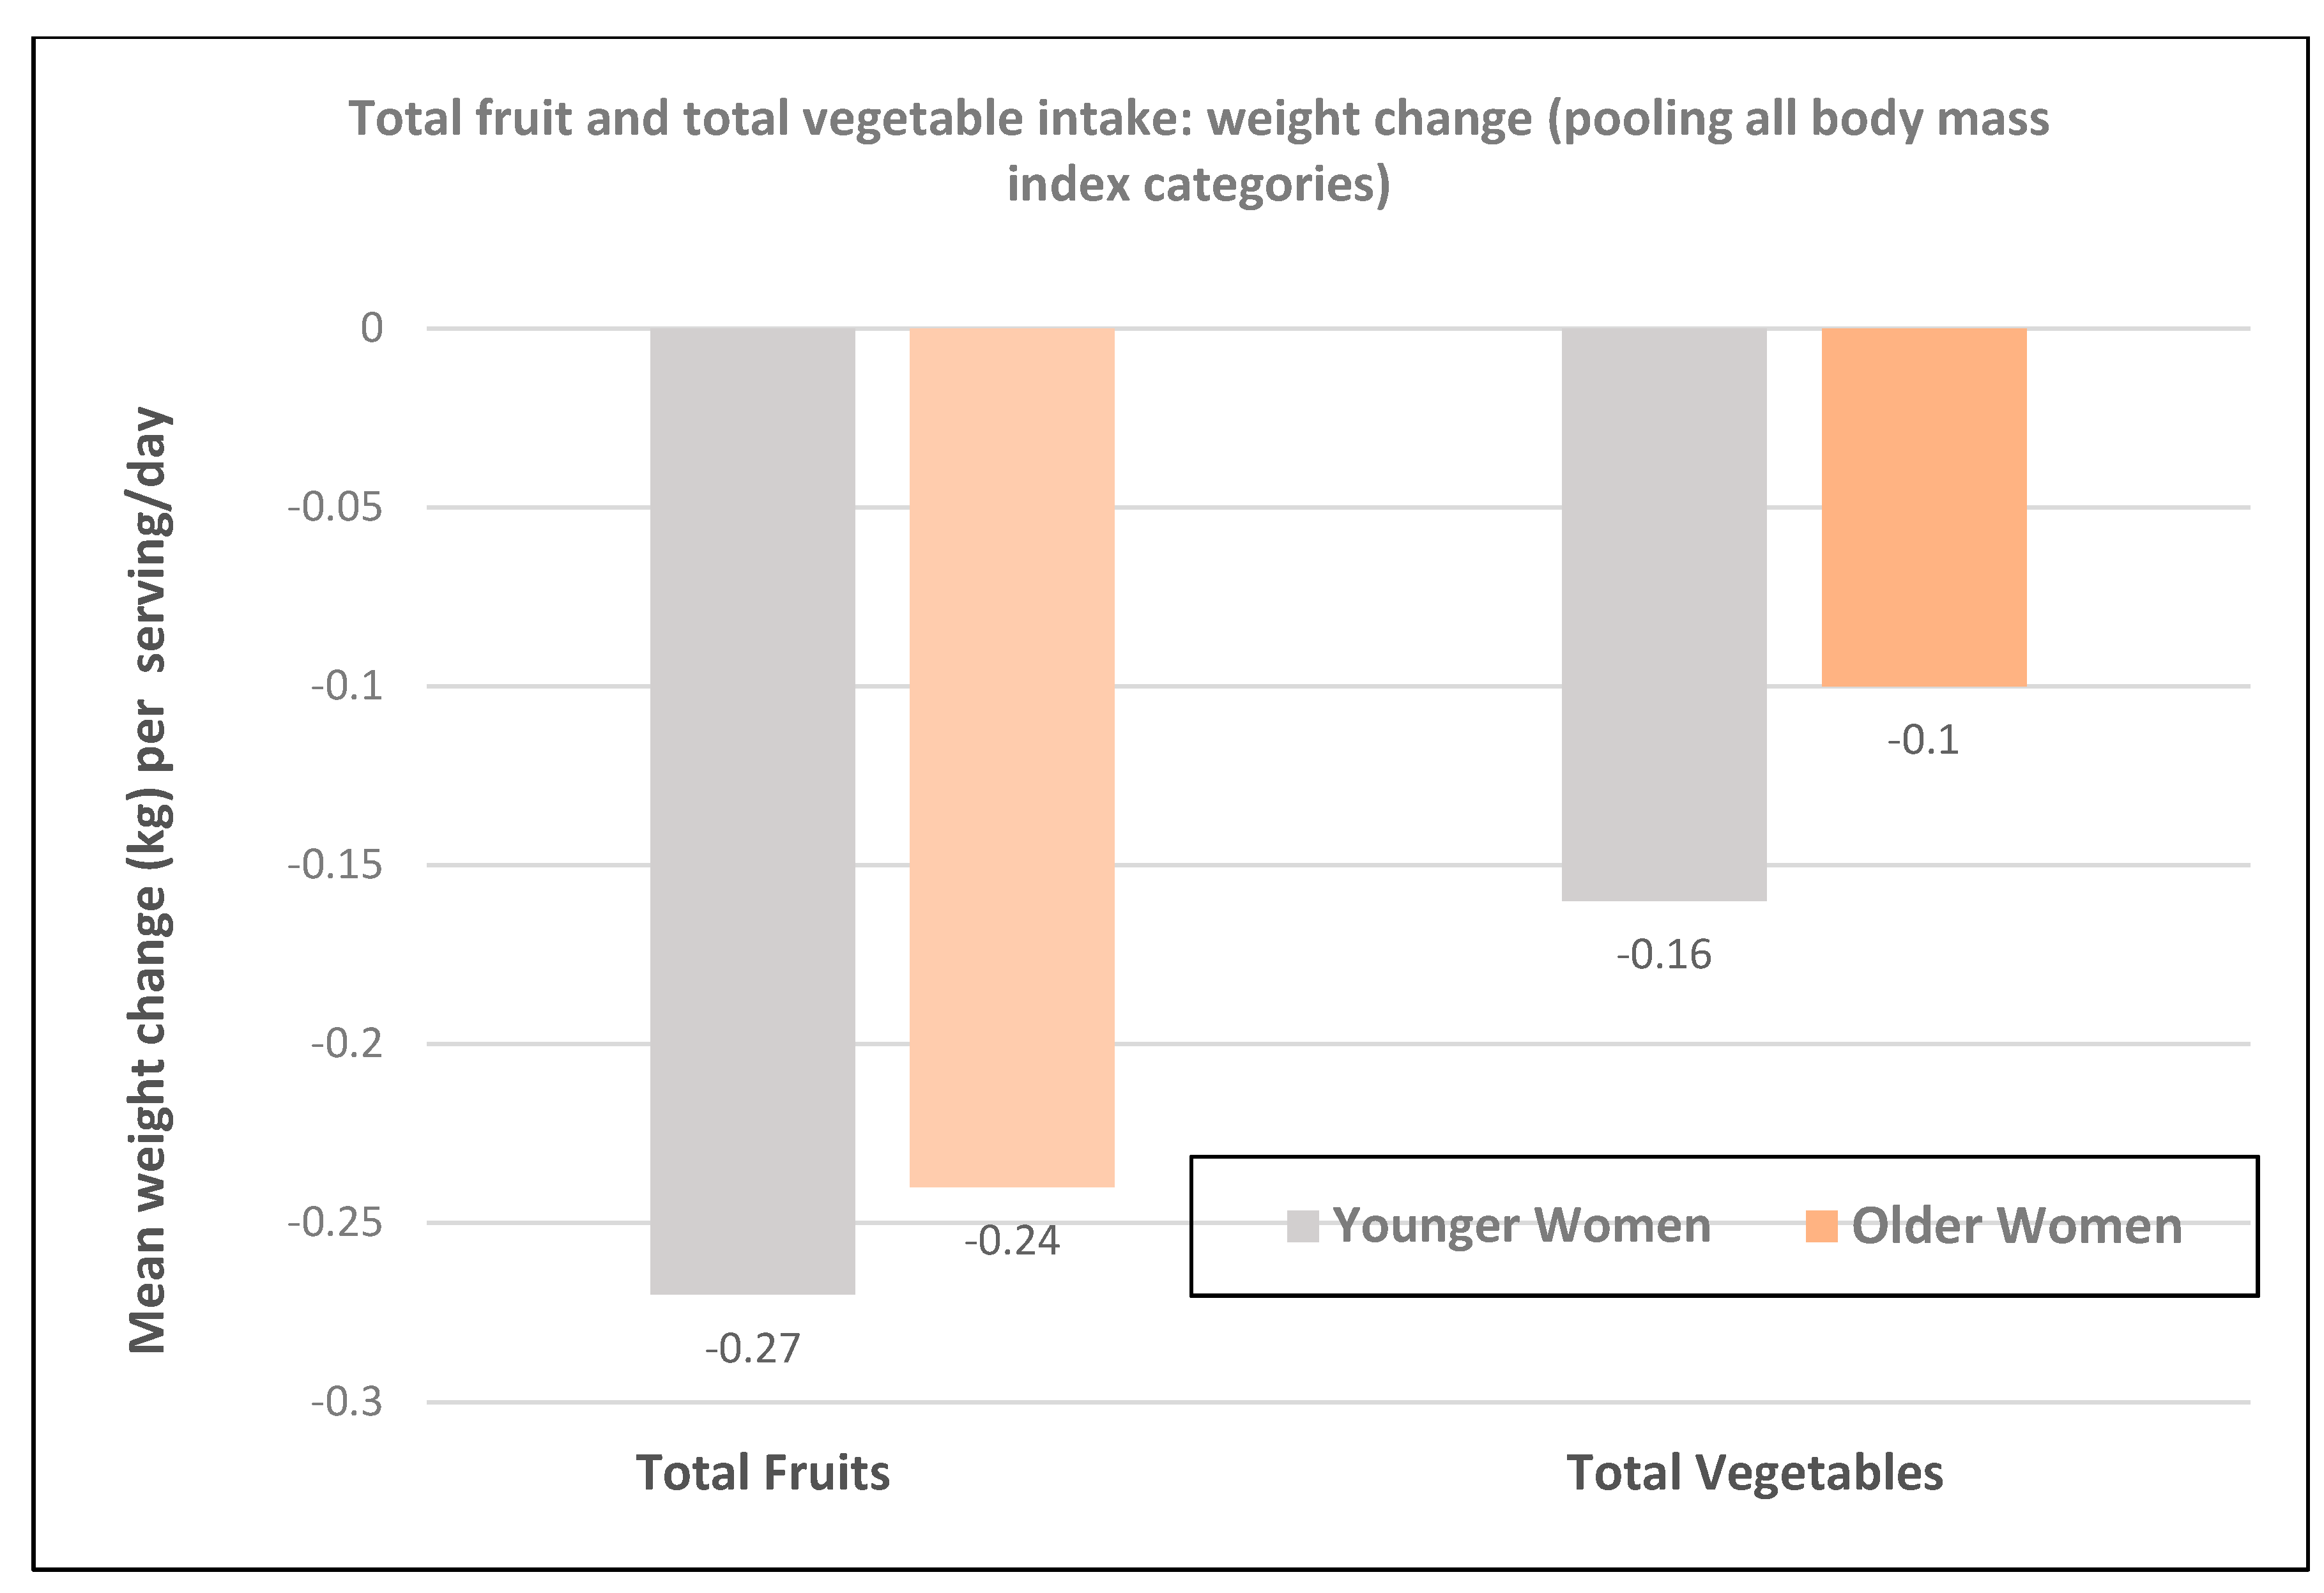
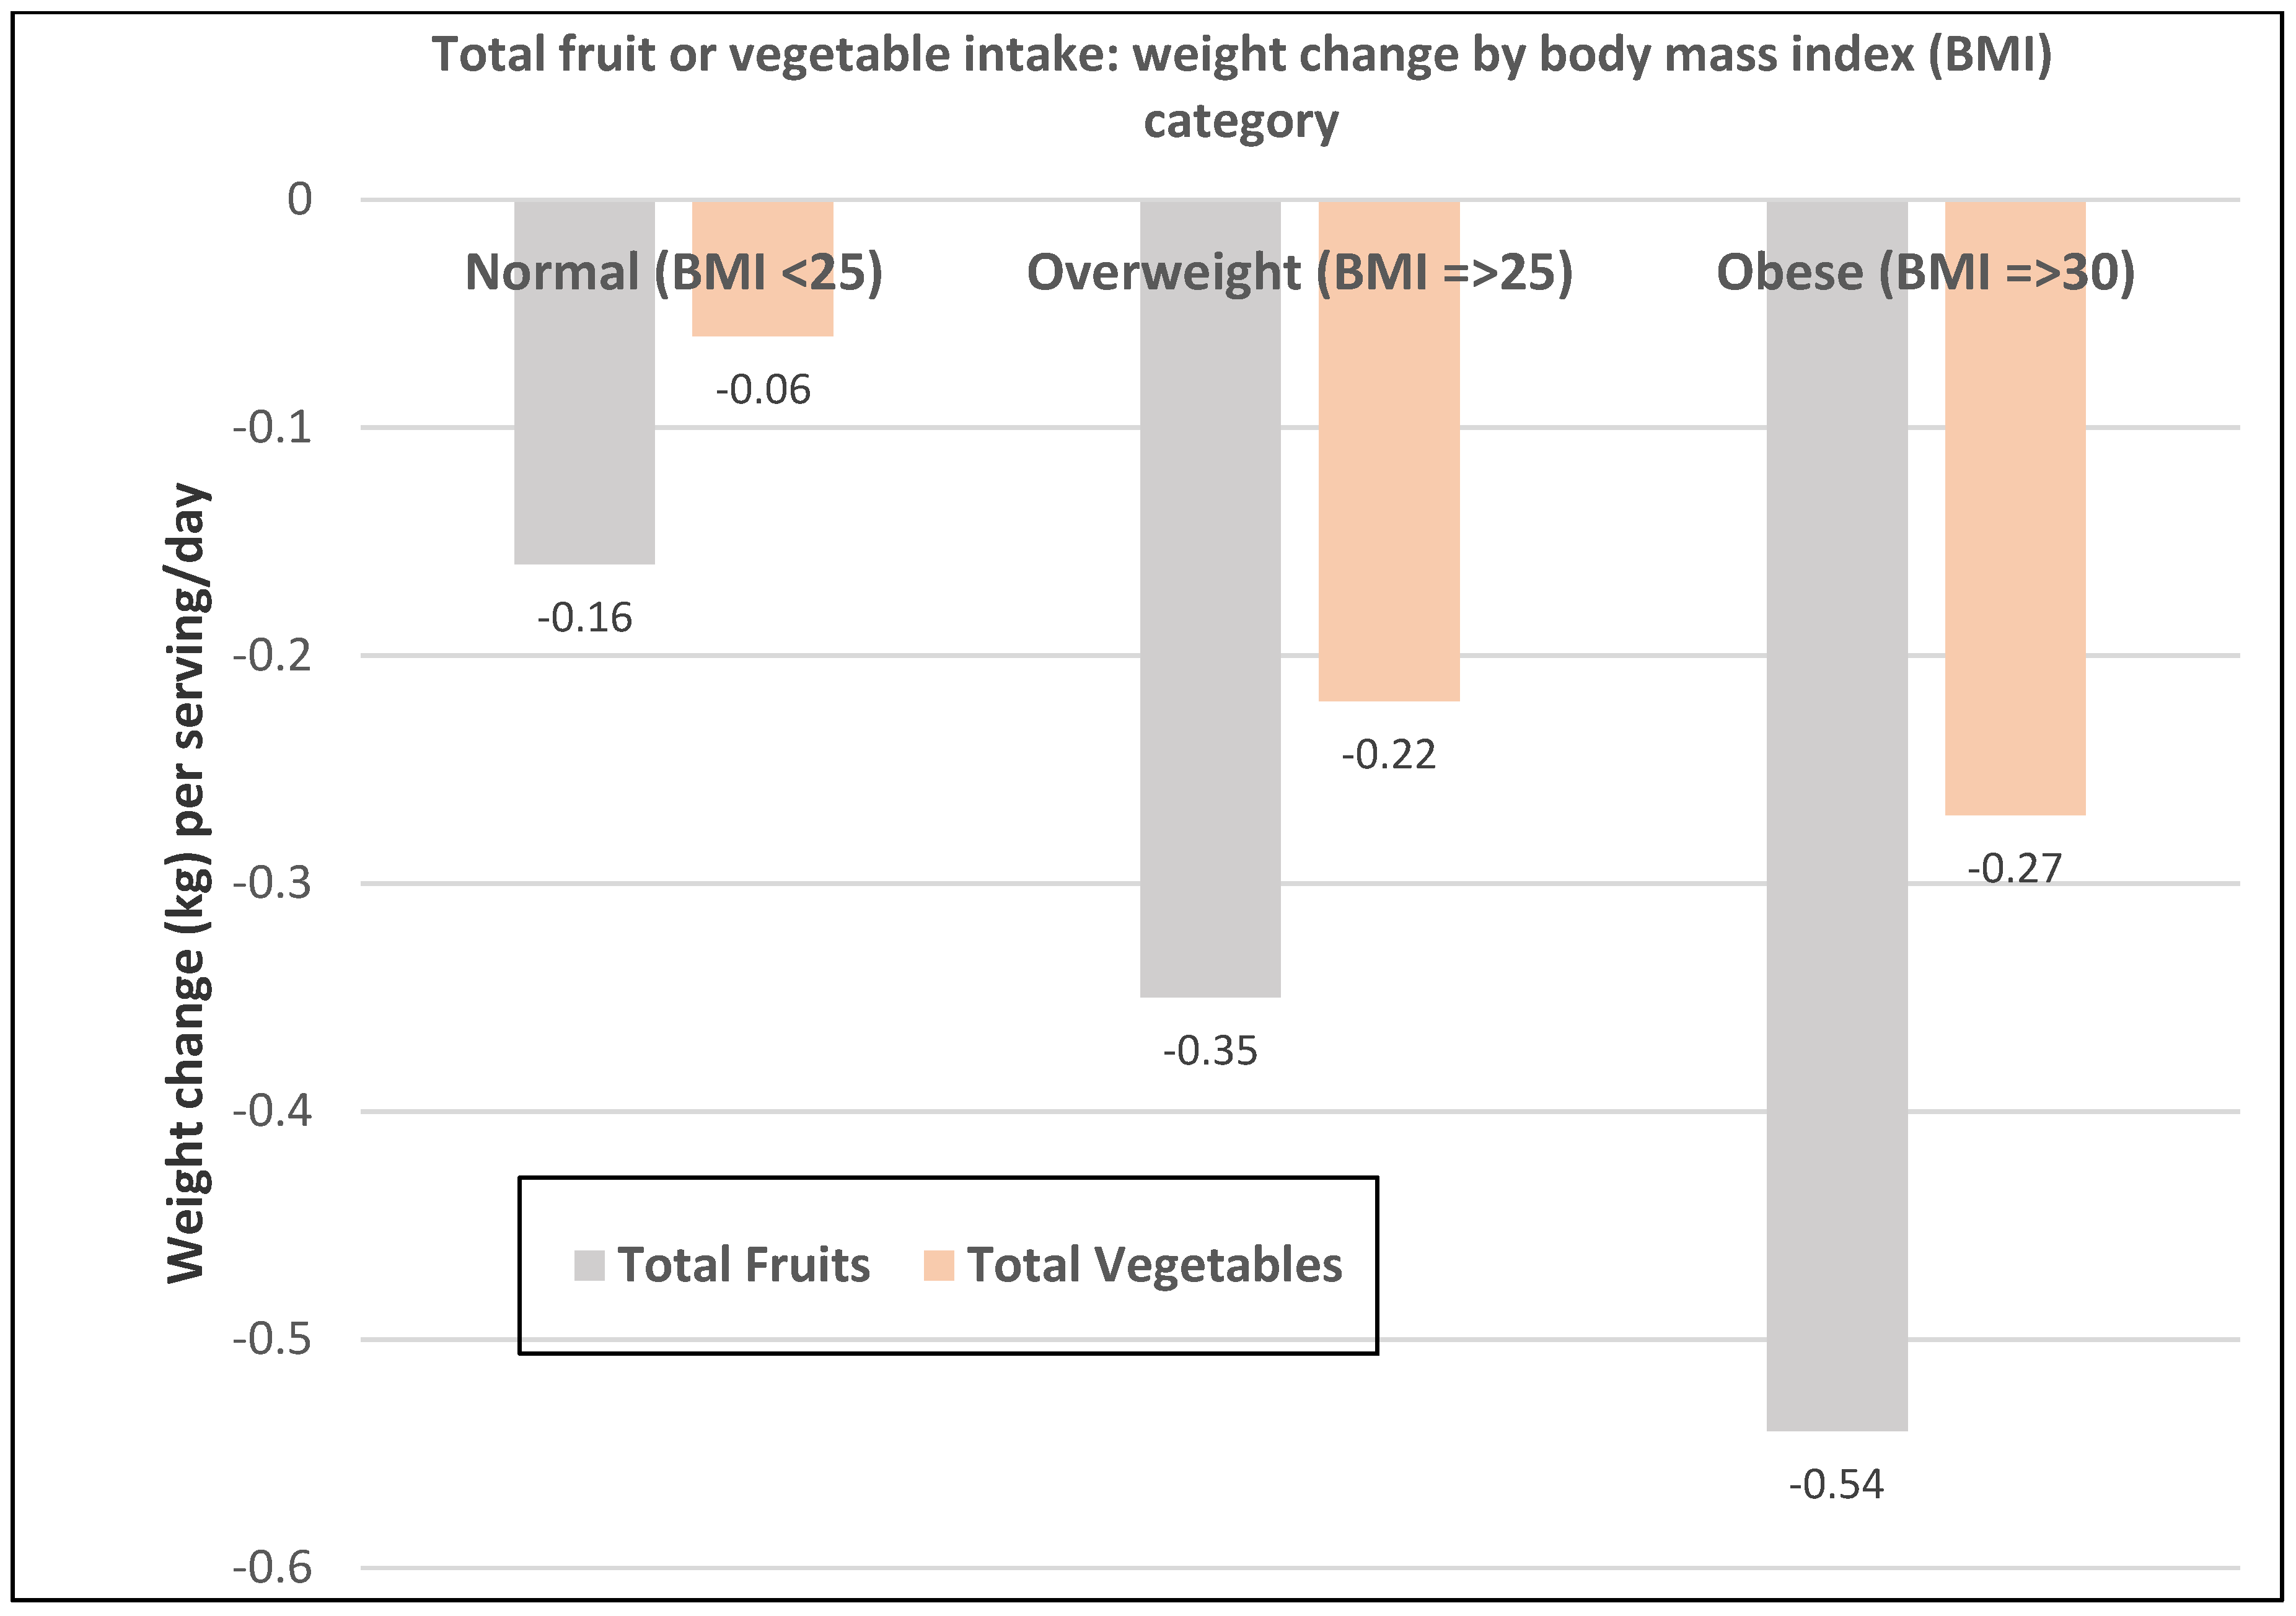
- A prospective study (73,737 NHS II women; mean baseline age of 36 and BMI of 24.2) observed the mean (95% CI) 4-year weight change per serving/day increase in specific fruits or vegetables summarized in Figure 1 and Figure 2 [18]. In premenopausal women, the mean change in body weight change was −0.27 kg (−0.24 to −0.30 kg) for each total fruit serving/day (95% CI; all p < 0.001) and −0.16 kg (−0.14 to −0.17 kg) for each total vegetable serving/day. The top 5 fruits for weight loss were blueberries −0.70 kg (−0.29 to −0.98 kg), apples and pears −0.39 kg (−0.48 to −0.64 kg), prunes −0.33 kg (−0.66 to −0.01 kg), strawberries −0.27 kg (−0.55 to 0.01 kg), and avocados −0.26 kg (−0.79 to 0.28 kg). Whole fruits (excluding fruit juice) were associated with weight loss independent of fiber and GL levels in part because total fruit contains few starchy or high GL varieties. The top 5 non-legume vegetables for weight loss were broccoli −0.37 kg (−0.56 to −0.17), peppers −0.32 kg (−0.57 to −0.06 kg), summer squash −0.31 kg (−0.64 to 0.01 kg), cauliflower −0.21 kg (−0.49 to 0.06 kg), and Brussels sprouts −0.16 kg (−0.61 to 0.28 kg). Total vegetable intake per serving was associated with about half the long-term weight loss compared to total fruit intake. Starchy, lower fiber, and higher GL vegetables were associated with weight gain, and non-starchy vegetables with higher fiber and lower GL were associated with weight loss (p < 0.0001). Younger women over four years tended to have greater weight loss than older women per serving of total vegetables (Figure 3) [18], which may be associated with the higher 4-year weight gain observed in postmenopausal women consuming sweet corn, potatoes, cabbage, onions, or winter squash compared to premenopausal women as shown in Figure 2 [18]. Women who were overweight or obese lost more weight than normal-weight women, and increased fruit intake was more strongly associated with 4-year weight loss than vegetable intake (Figure 4) [18].
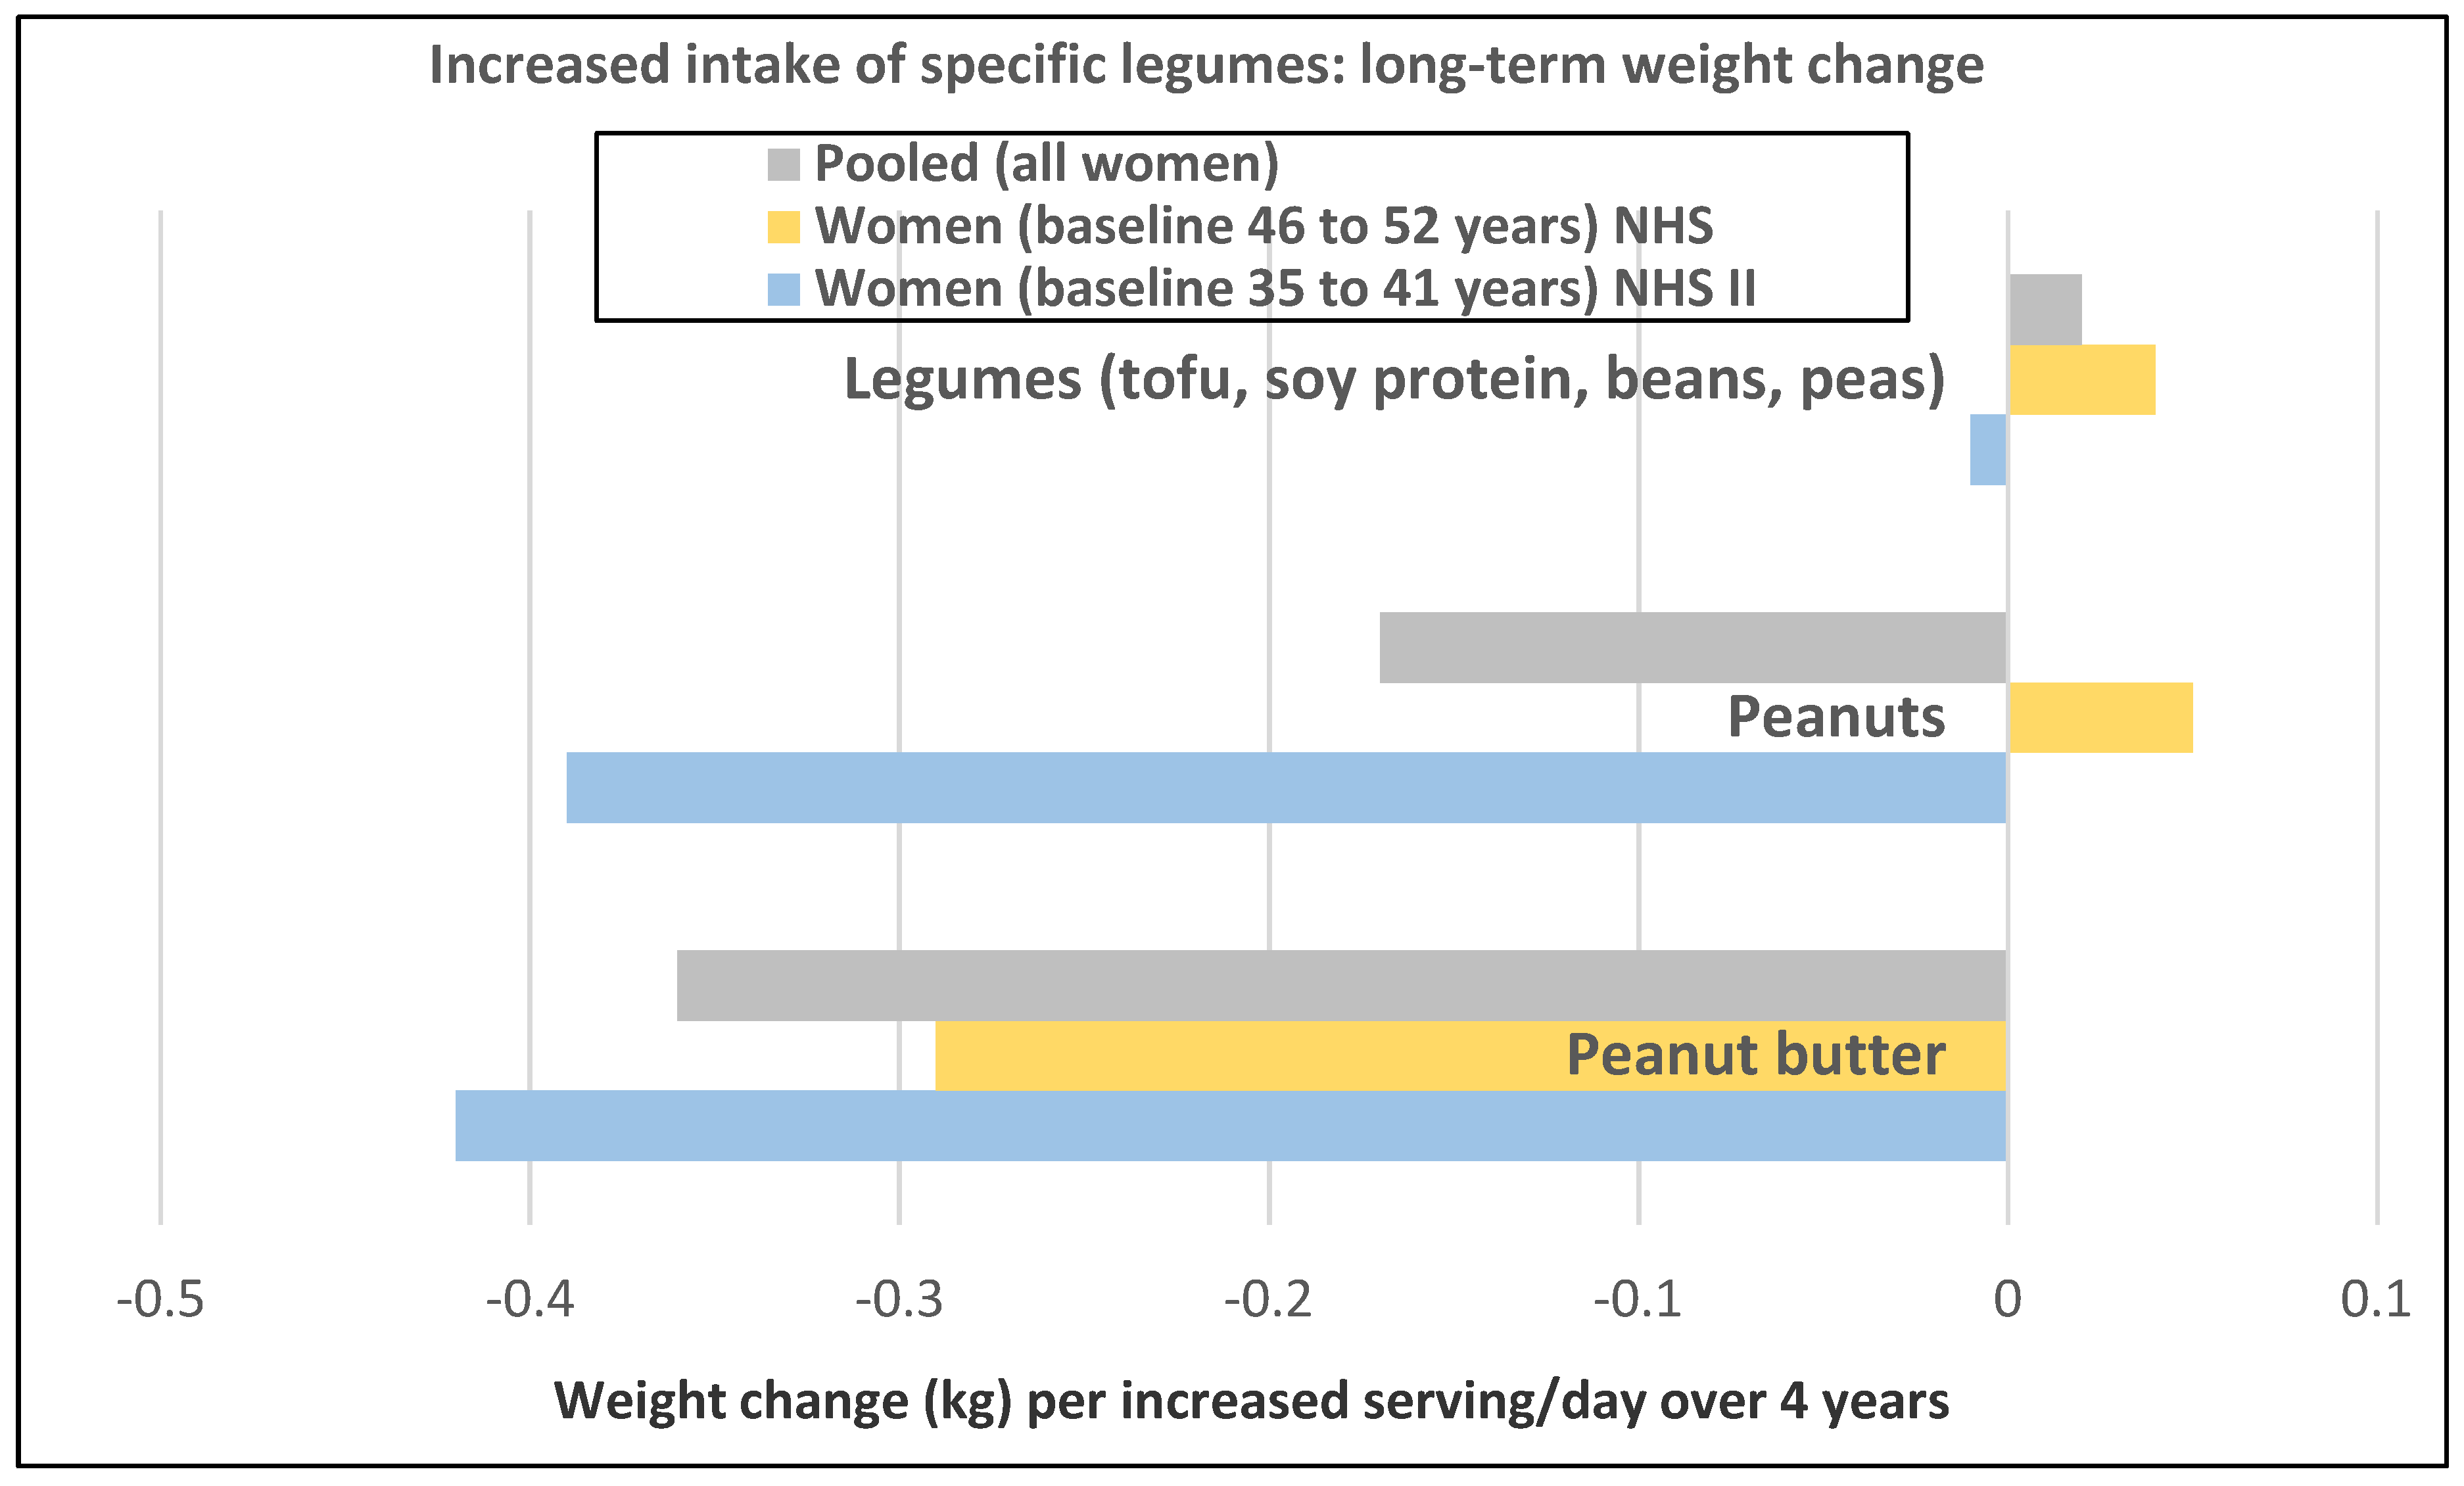
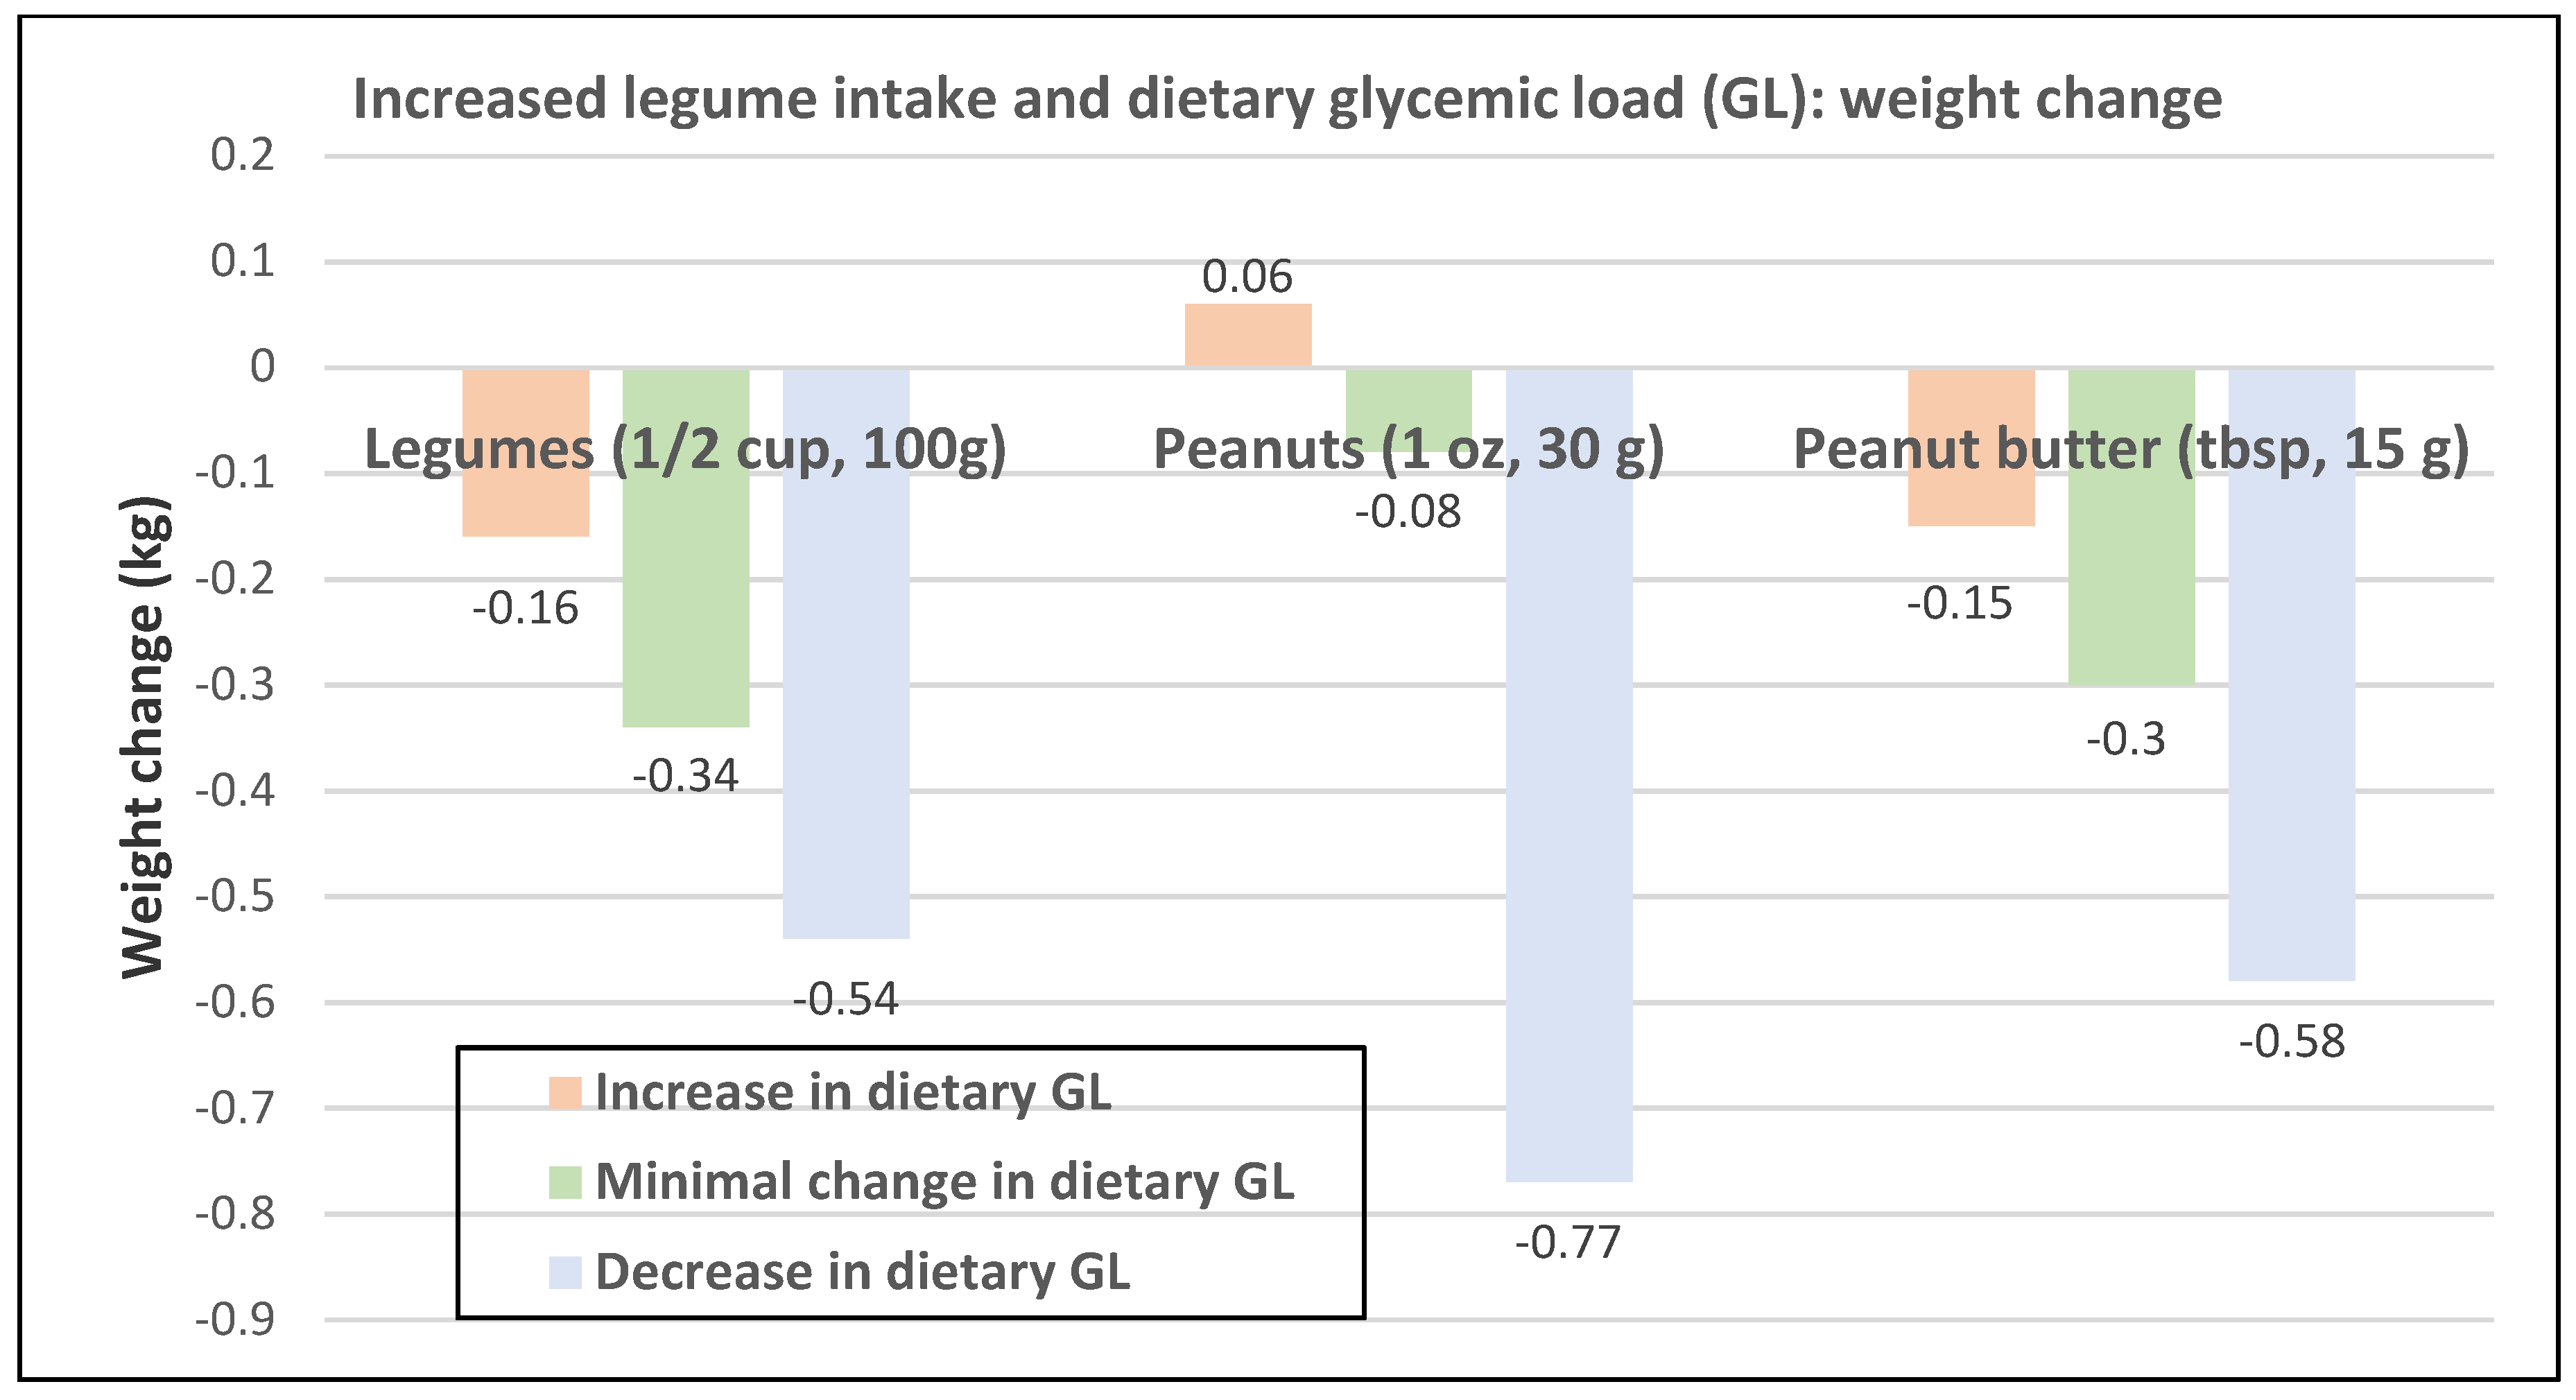
- A prospective study (47,928 NHS II women; mean baseline age of 38 years and BMI of 23.0) observed the mean (95% CI) 4-year weight change per serving/day increase in legumes (Figure 5) [19]. In NHS II women, legumes (tofu, soy protein, peas, beans, lentils, and lima beans) were associated with no weight change and weight loss was associated with intake of peanuts peanut butter. In another study of premenopausal women, an increase in one tofu and soy serving/day was associated with weight loss of −0.8 kg (−0.5 to −1.2 kg) over 4-years [18]. However, the type of dietary carbohydrates consumed with legumes can influence the trajectory of weight change with higher GL diets reducing the odds of weight loss and lower GL diets increasing the odds of weight loss.
- A longitudinal study of 186 women (mean baseline age of 36 years and BMI of 27) observed that women with higher dietary ED (>1.85 kcal/g) who consumed 2.7 FV servings/day gained an average of about 4 kg more weight (p < 0.01) compared to women consuming the lowest dietary ED (<1.5 kcal/g) who consumed 5 FV servings/day over six years [20]. Women consuming the higher FV diet had their mean total energy intake reduced by −225 kcal/day compared to the lower FV diet.
Studies from Europe
- A prospective Spanish study of 6613 women (mean baseline age of 43 years and 22 BMI) consuming a Mediterranean diet in the Seguimiento Universidad de Navarra (SUN) Project observed that multivariate-adjusted FV intake was inversely associated with weight gain over five years and higher dietary fiber was directly associated with consumption of FV [21]. Also, in this study, energy-adjusted total dietary fat (olive oil primarily) intake did not support an independent effect of fat on weight gain.
Studies from Iran
- In a 3-year longitudinal study, approximately 700 Iranian women (mean baseline age of 40 years) consuming healthy low ED, high fiber, and about 2000 kcal/day diets saw more weight loss with a higher intake of total FV [22]. Red and purple FV were associated with a smaller WC.
3.1.2. Postmenopausal Women
Study from New Zealand
- A prospective analysis of the New Zealand Weight-To-Be trial (1293 women; baseline mean age 49.5 years and BMI 34.4) over 24 months observed that hamburgers, fried chicken, hot dogs, bacon or sausage, French fries, and high fat consumption were associated with higher BMI, while eating a diet high in FV, such as green salads, and higher fiber intake were associated with lower BMI [23]. Overall, increasing fruit, vegetables and fiber, and decreasing dietary fat throughout the study were associated with reductions in BMI.
Studies from the United States of America
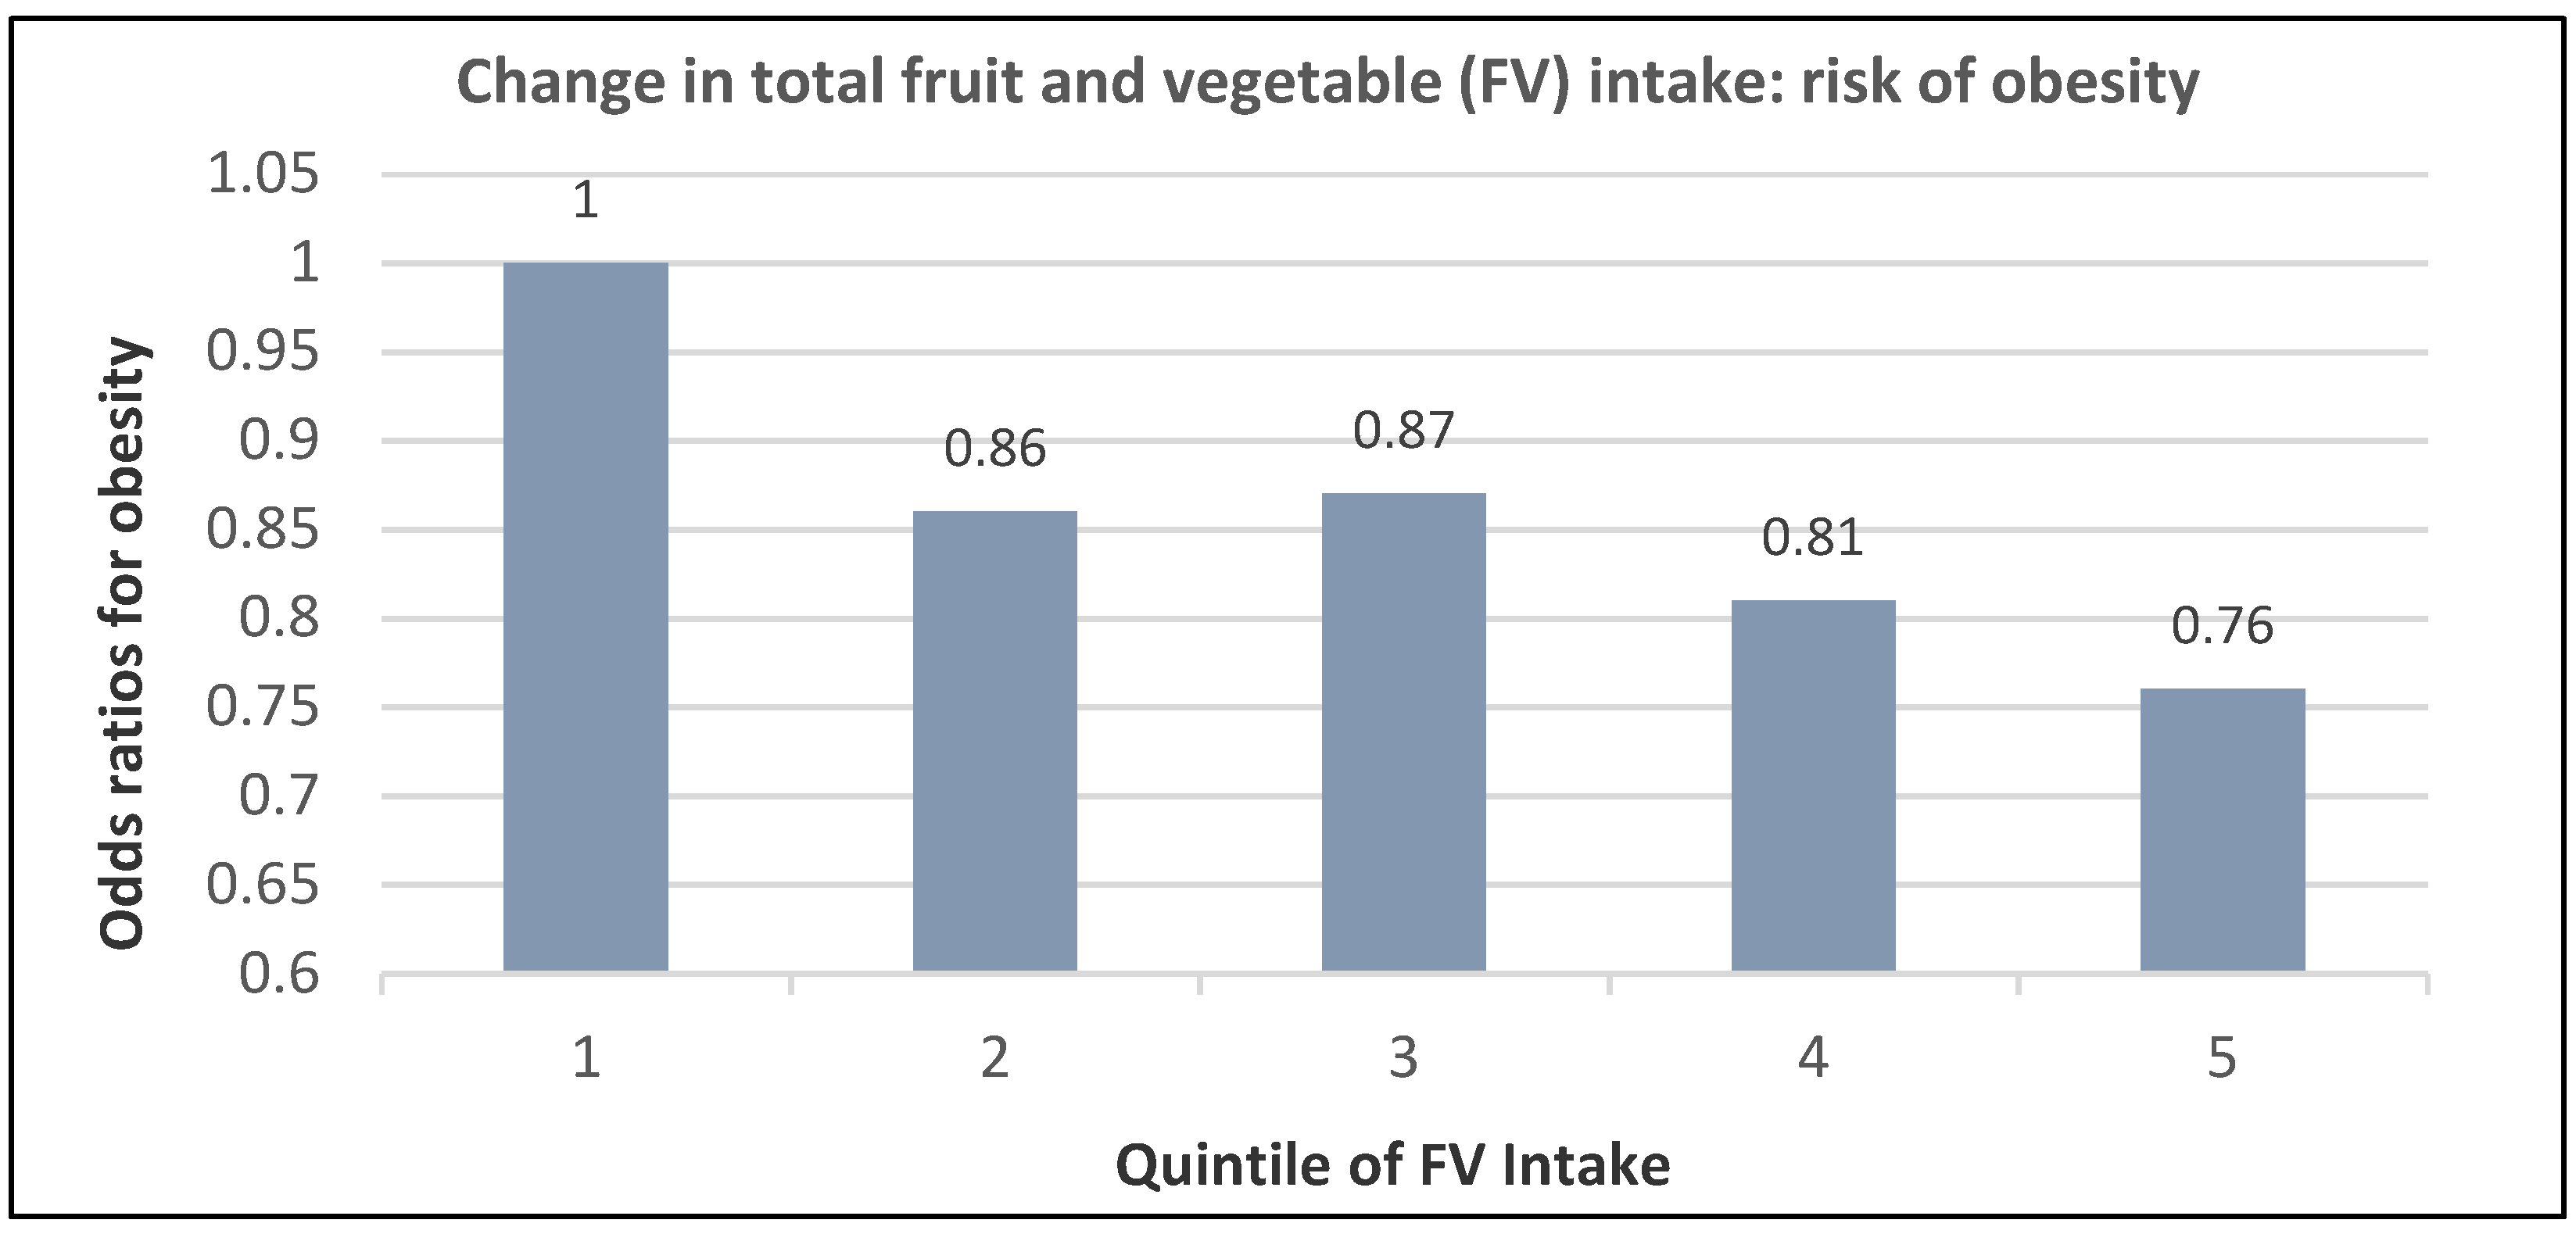
- A prospective study (74,063 NHS women; mean baseline age 51 years and BMI of 24.9) observed that those in the highest quintile of total fruit intake had a 24% lower risk of becoming obese and a 16% lower risk for those in the highest vegetable intake group compared to women with the lowest intake (p-trend < 0.0001) over 12 years of follow-up [24]. The association between increasing quintiles of total FV intake and obesity risk is summarized in Figure 6.
- A prospective study (50,422 NHS women; mean baseline age 52 years and BMI 23.7) observed the 4-year weight changes associated with a wide range of foods, including FV and beverages [17]. In postmenopausal women weight change per daily serving determined at 4-year periods (95% CI); p < 0.001 for total fruit was −0.20 kg (−0.17 to −0.22 kg) and for total vegetables was −0.07 kg (−0.06 to −0.09 kg). French fries increased weight by +1.9 kg (1.57 to 2.16 kg) and boiled, baked, or mashed potatoes increased weight by +0.32 kg (0.24 to 0.40 kg). Fruit juice (100%) increased weight by +0.12 kg (0.09 to 0.15 kg).
- A prospective study (40,415 NHS women; mean baseline age 49 years and BMI 24.7) observed the mean (95% CI) 4-year weight change per serving/day increase from specific fruits or vegetables summarized in Figure 1 and Figure 2 [18]. In postmenopausal women, the mean weight change per increased serving/day for total fruit was −0.24 kg (−0.18 to −0.27 kg) and −0.10 kg (−0.08 to −0.12 kg) for total vegetables. The top 5 fruits for weight loss were apples and pears −0.65 kg (−0.56 to −0.74 kg), blueberries −0.60 kg (−0.37 to −0.84 kg), grapes −0.36 kg (−0.24 to −0.47 kg), prunes −0.27 kg (−0.16 to −0.50 kg), and watermelon −0.32 kg (−0.16 to −0.48 kg). Whole fruits (excluding fruit juice) were associated with weight loss independent of fiber and GL levels in part because total fruit contains fewer starchy or high GL varieties. The top 5 non-legume vegetables were cauliflower −0.67 kg (−0.44 to −0.89 kg), summer squash −0.62 kg (−0.37 to −0.85 kg), string beans −0.60 kg (−0.41 to −0.78 kg), Brussels sprouts −0.34 kg (−0.77 to 0.09 kg), and green leafy vegetables −0.26 kg (−0.20 to −0.31 kg). Total vegetable intake per serving was associated with about half the long-term weight loss compared to total fruit [17,18]. Starchy vegetables such as potatoes and sweet corn were associated with weight gain, whereas higher fiber and lower GL vegetables were associated with weight loss (p < 0.0001). Older women over four years tended to have less weight loss than younger women per serving of total vegetable intake (Figure 3) [18], which may be associated with the higher 4-year weight gain observed in postmenopausal women consuming sweet corn, potatoes, cabbage, onions or winter squash compared to premenopausal women as shown in Figure 2 [18]. Women who were overweight or obese lost more weight than normal-weight women, and increased fruit intake was more strongly associated with 4-year weight loss than vegetable intake (Figure 4) [18].
- A prospective study (46,994 NHS women; mean baseline age 49 years and BMI 23.7) observed the mean (95% CI) 4-year weight change per serving/day increase in protein foods (Figure 5) [19]. In NHS women, no weight change was associated with legumes (tofu, soy protein, peas, beans, lentils, and lima beans), but weight loss was associated with peanut butter. In another study of postmenopausal women, an increase in a serving of tofu and soy was associated with a loss of −1.3 kg (0.5 to 1.7 kg) over 4-years [18]. However, the type of dietary carbohydrates consumed with legumes can influence the trajectory of weight change with higher GL diets reducing the odds of weight loss and lower GL diets increasing the odds of weight loss [19].
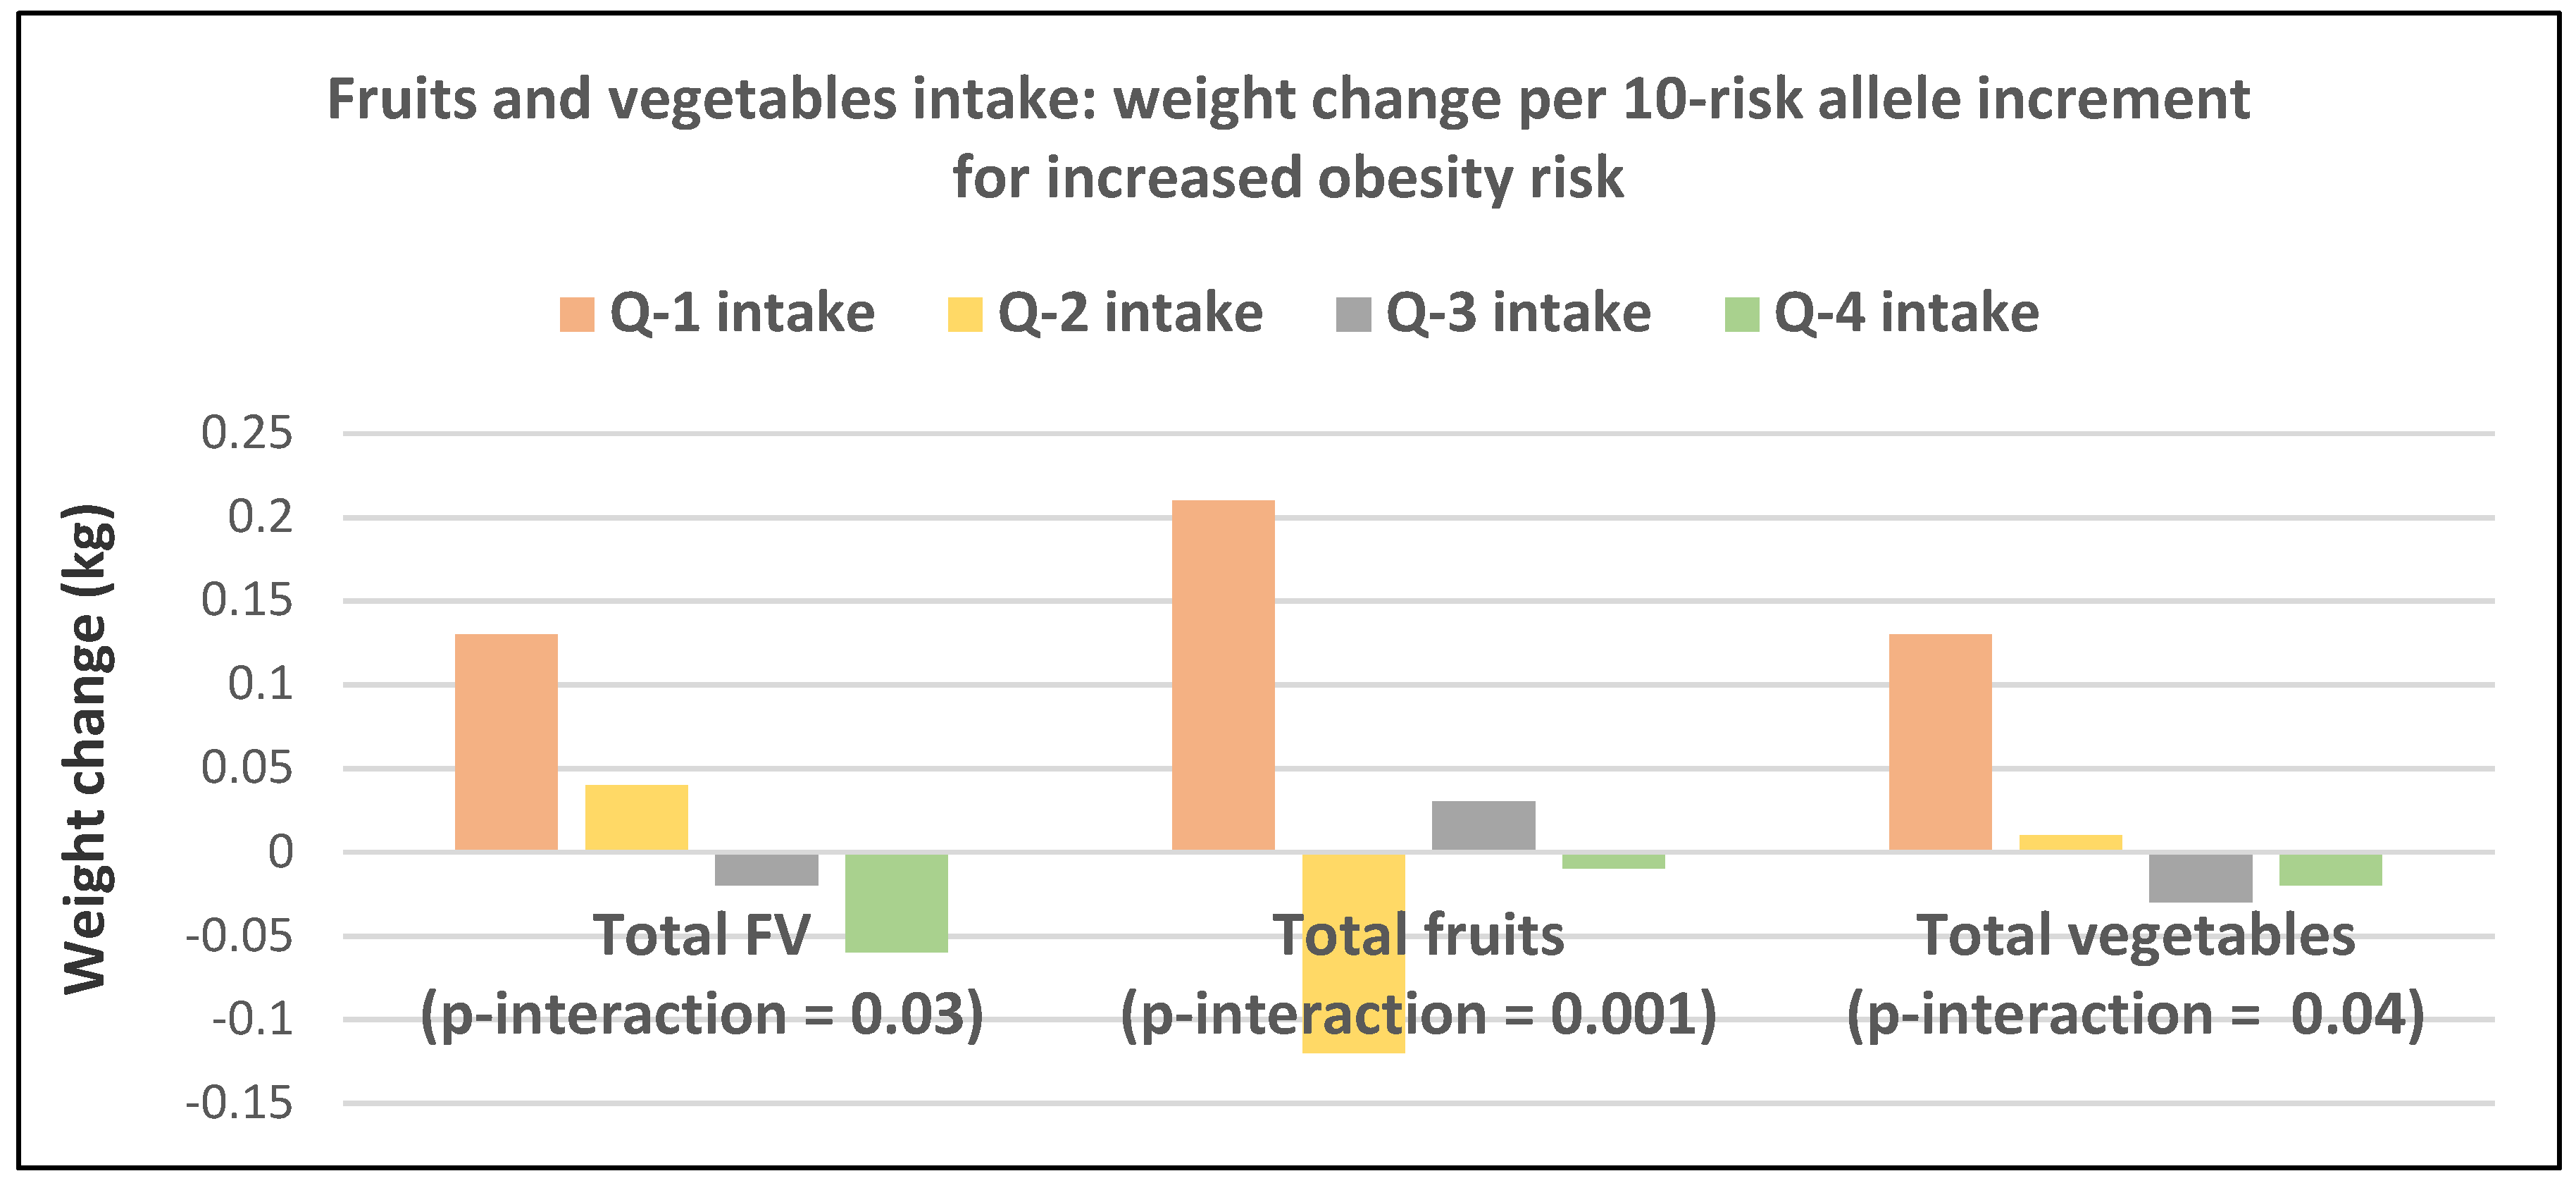
- A prospective study (8943 NHS women; mean baseline age 54 years and BMI of 25.5) examined the effects of total and specific FV intake on genetic susceptibility for increased risk of obesity over repeated 4-year time frames for measuring BMI and body weight changes [25]. BMI change per 10-risk allele increment for susceptibility to obesity was 0.07 + 0.04 kg/m2 among women with the highest decrease in total FV intake and −0.02 + 0.03 kg/m2 among those with the most substantial increase in FV intake (p-interaction < 0.009). Weight change in kg per quartile of FV intake is shown in Figure 7. Berries, citrus fruits, and green leafy vegetables were the most effective in lowering BMI. Women with higher genetic risk for obesity had greater decreased weight with increasing FV intake than those with lower risk.
- The US Women’s Health Initiative (48,106 women; mean baseline age 58 years and BMI of 26.2) observed a loss of −0.43 kg (95% CI: −0.32 to −0.52 kg) for each serving of whole fruit and a weight gain of 0.18 kg (95% CI: 0.05 to 0.31 kg) for each 6 oz serving of 100% fruit juice over three years [26].
- The US Women’s Health Study (18,146 women; mean baseline age 54 years and BMI of 22.4) observed that the consumption of >3.1 fruit servings/day significantly reduced the odds of being overweight or obese by −13% compared to basically no weight change with the consumption of <3 vegetable servings/day (p-trend = 0.22) over 15.9 years [27].
- The Stockholm Public Health Cohort (12,860 women; baseline age 48 years and BMI of 24.9) observed that middle-aged women reduced BMI by −0.06, overweight risk by 6% and risk of obesity by 12% with the consumption of at least a daily serving of fruit compared to less than a daily serving over eight years [28].
- The European Prospective into Cancer (EPIC) and Nutrition-Physical Activity, Nutrition, Alcohol, Cessation of Smoking, Eating Out of Home, and Obesity study in a sub-analysis of women (approx.100,000 women; baseline over 50 years and BMI of 25) observed that each 100-g/day of total vegetable intake was associated with an annual weight increase of 6 g/year (p = 0.03) and total fruit intake per 100-g/day was associated with an annual weight decrease of −10 g/year (p < 0.001) [29].
- EPIC Diet, Obesity and Genes studies (BiOGenes; 28,937 women; baseline age 49 years and BMI of 24.9) over 5.5 years observed in middle-aged normal-weight women that every 100 kcals/day increase in total fruit intake was significantly associated with reduced WC by −11 cm/year compared to −0.05 cm/year for total vegetables whereas every 100 kcals/day of potatoes significantly increased WC by 0.05 cm/year [30,31].
- EPIC BiOGenes study (52,307 women; mean baseline age 53 years and BMI of 25.2) observed in middle-aged slightly overweight women that each 100 g/day increase in FV intake reduced weight gain by −12 g/year (p = 0.02) over 6.5 years [32].
Studies from China
- The Chinese Health and Nutrition study (2387 women; mean baseline age 46 years and BMI of 23.3) observed in middle-aged normal-weight women that each 100 g/day increase in total FV reduced weight by −0.14 kg and BMI by −0.29 over six years. Still, these reductions did not achieve statistical significance [33]. Despite the study’s finding of an insignificant association with weight loss, the Chinese still recommended an increased FV intake to their population to help protect against long-term risk of weight gain.
3.2. Secondary Studies
3.2.1. Premenopausal Women
- A cross-sectional study of 279 low-income overweight or obese African-American women in Pittsburg, Pennsylvania (mean age of 36 + 9.3 years) found that those consuming >5 FV servings/day were 94% more likely to be weight resilient (maintaining weight stability in an obesity risky environment) compared to those eating <5 servings/day [34].
- A Swedish cross-sectional study of 577 women (mean baseline age of 22 years and BMI of 23) observed that young women consuming the recommended amount of FV (500 g/day) had significantly less % body fat compared to those not consuming the recommended levels of FV (26.5% vs. 28.4% p < 0.05), despite no observable differences in BMI or WC between the two groups [35]. This lower % body fat was associated with a significantly lower HOMA-IR (1.48 vs. 1.81; p = 0.001), which suggests the importance of increasing FV intake in young women to reduce the potential long-term risk of pre-diabetes or diabetes.
3.2.2. Post-Menopausal Women
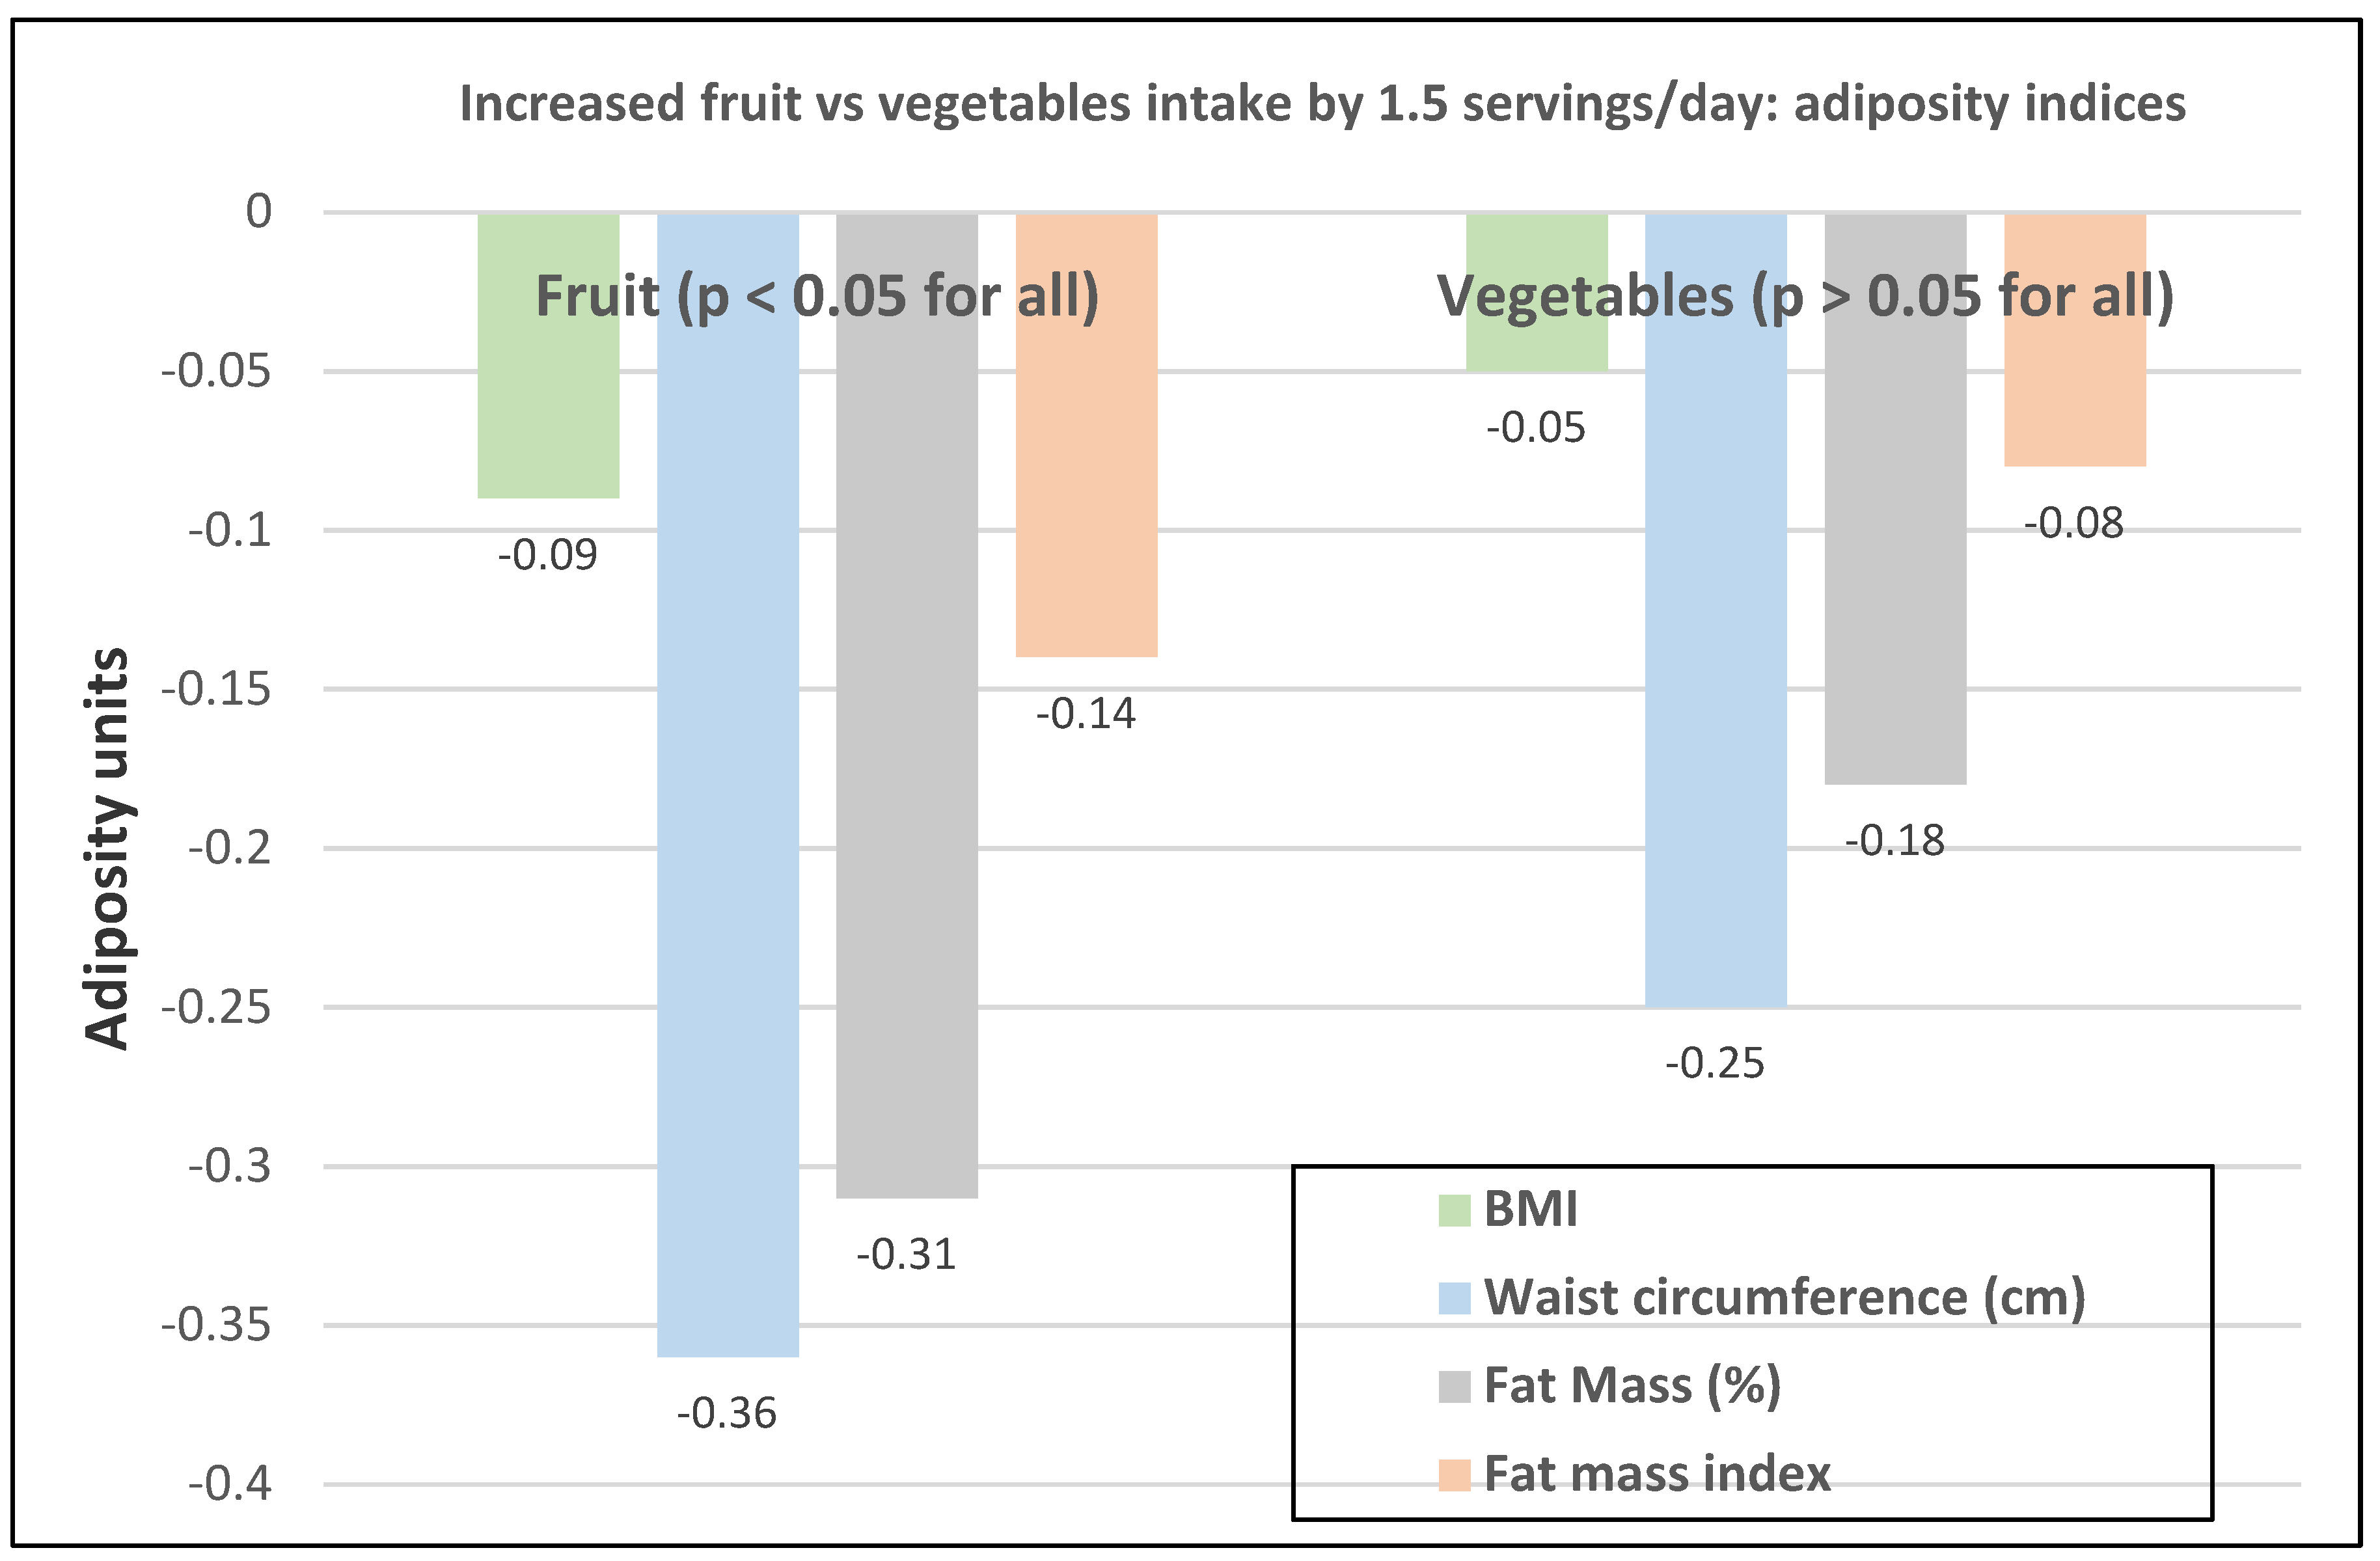
- The cross-sectional Canadian Atlantic Partnership for Tomorrow’s Health Study (26,340 participants, 70% women, mean baseline age 53) observed that an increase of 2.6 servings of total FV/day was inversely associated with BMI (−0.12 kg/m2), WC (−0.4 cm), fat mass (−0.14%), and fat mass index (−0.14 kg/m2) [36]. Fruit (1.5 servings) was consistently inversely associated with body adiposity compared with vegetables (1.5 servings) (Figure 8). Fruit (>2 vs. <1 servings/day) reduced risk of abdominal obesity by 12% (p < 0.001) and vegetables (>3 vs. <2 servings/day) reduced abdominal obesity risk by 6% (p = 0.066).
- In a 6-month retrospective study, 66 obese Brazilian women given guidance to reduce energy intake from ultra-processed foods and increase healthy fiber-rich foods found that women who lost weight increased their consumption of leafy vegetables (p = 0.013) and fruit (p = 0.004), and reduced sweets (p = 0.0008) and fried foods (p = 0.01), thus reducing mean body weight by 3.2%, BMI by 2.5 kg/m2, body fat mass by 1.7% and WC by 4.8 cm compared to baseline levels [37].
- The Netherlands Epidemiology of Obesity cross-sectional study, including 3576 women (mean baseline age 55 years), observed that visceral fat was reduced by 1.3 cm2 for each 100 g increase in fruits or vegetables [38].
- The US and Canadian Adventist Health Study 2 (55,407 normal-weight adults; 63% women; mean baseline age 56-years) observed that the odds of becoming overweight or obese were reduced by 15% in high avocado consumers and 7% in low avocado consumers compared to non-consumers of avocados over an 11-year follow-up [39].
- An Australian cross-sectional study (130,966 women; mean age 62 years) observed that compared to the reference normal-weight women, obese women were 25% and overweight women were 15% less likely to be in the highest fruit intake quartile. In contrast, obese women were 18% and overweight women, 9% more likely to be in the highest vegetable consumption quartile (p < 0.01) [3].
3.3. Randomized Controlled Trials
3.3.1. Primary Studies
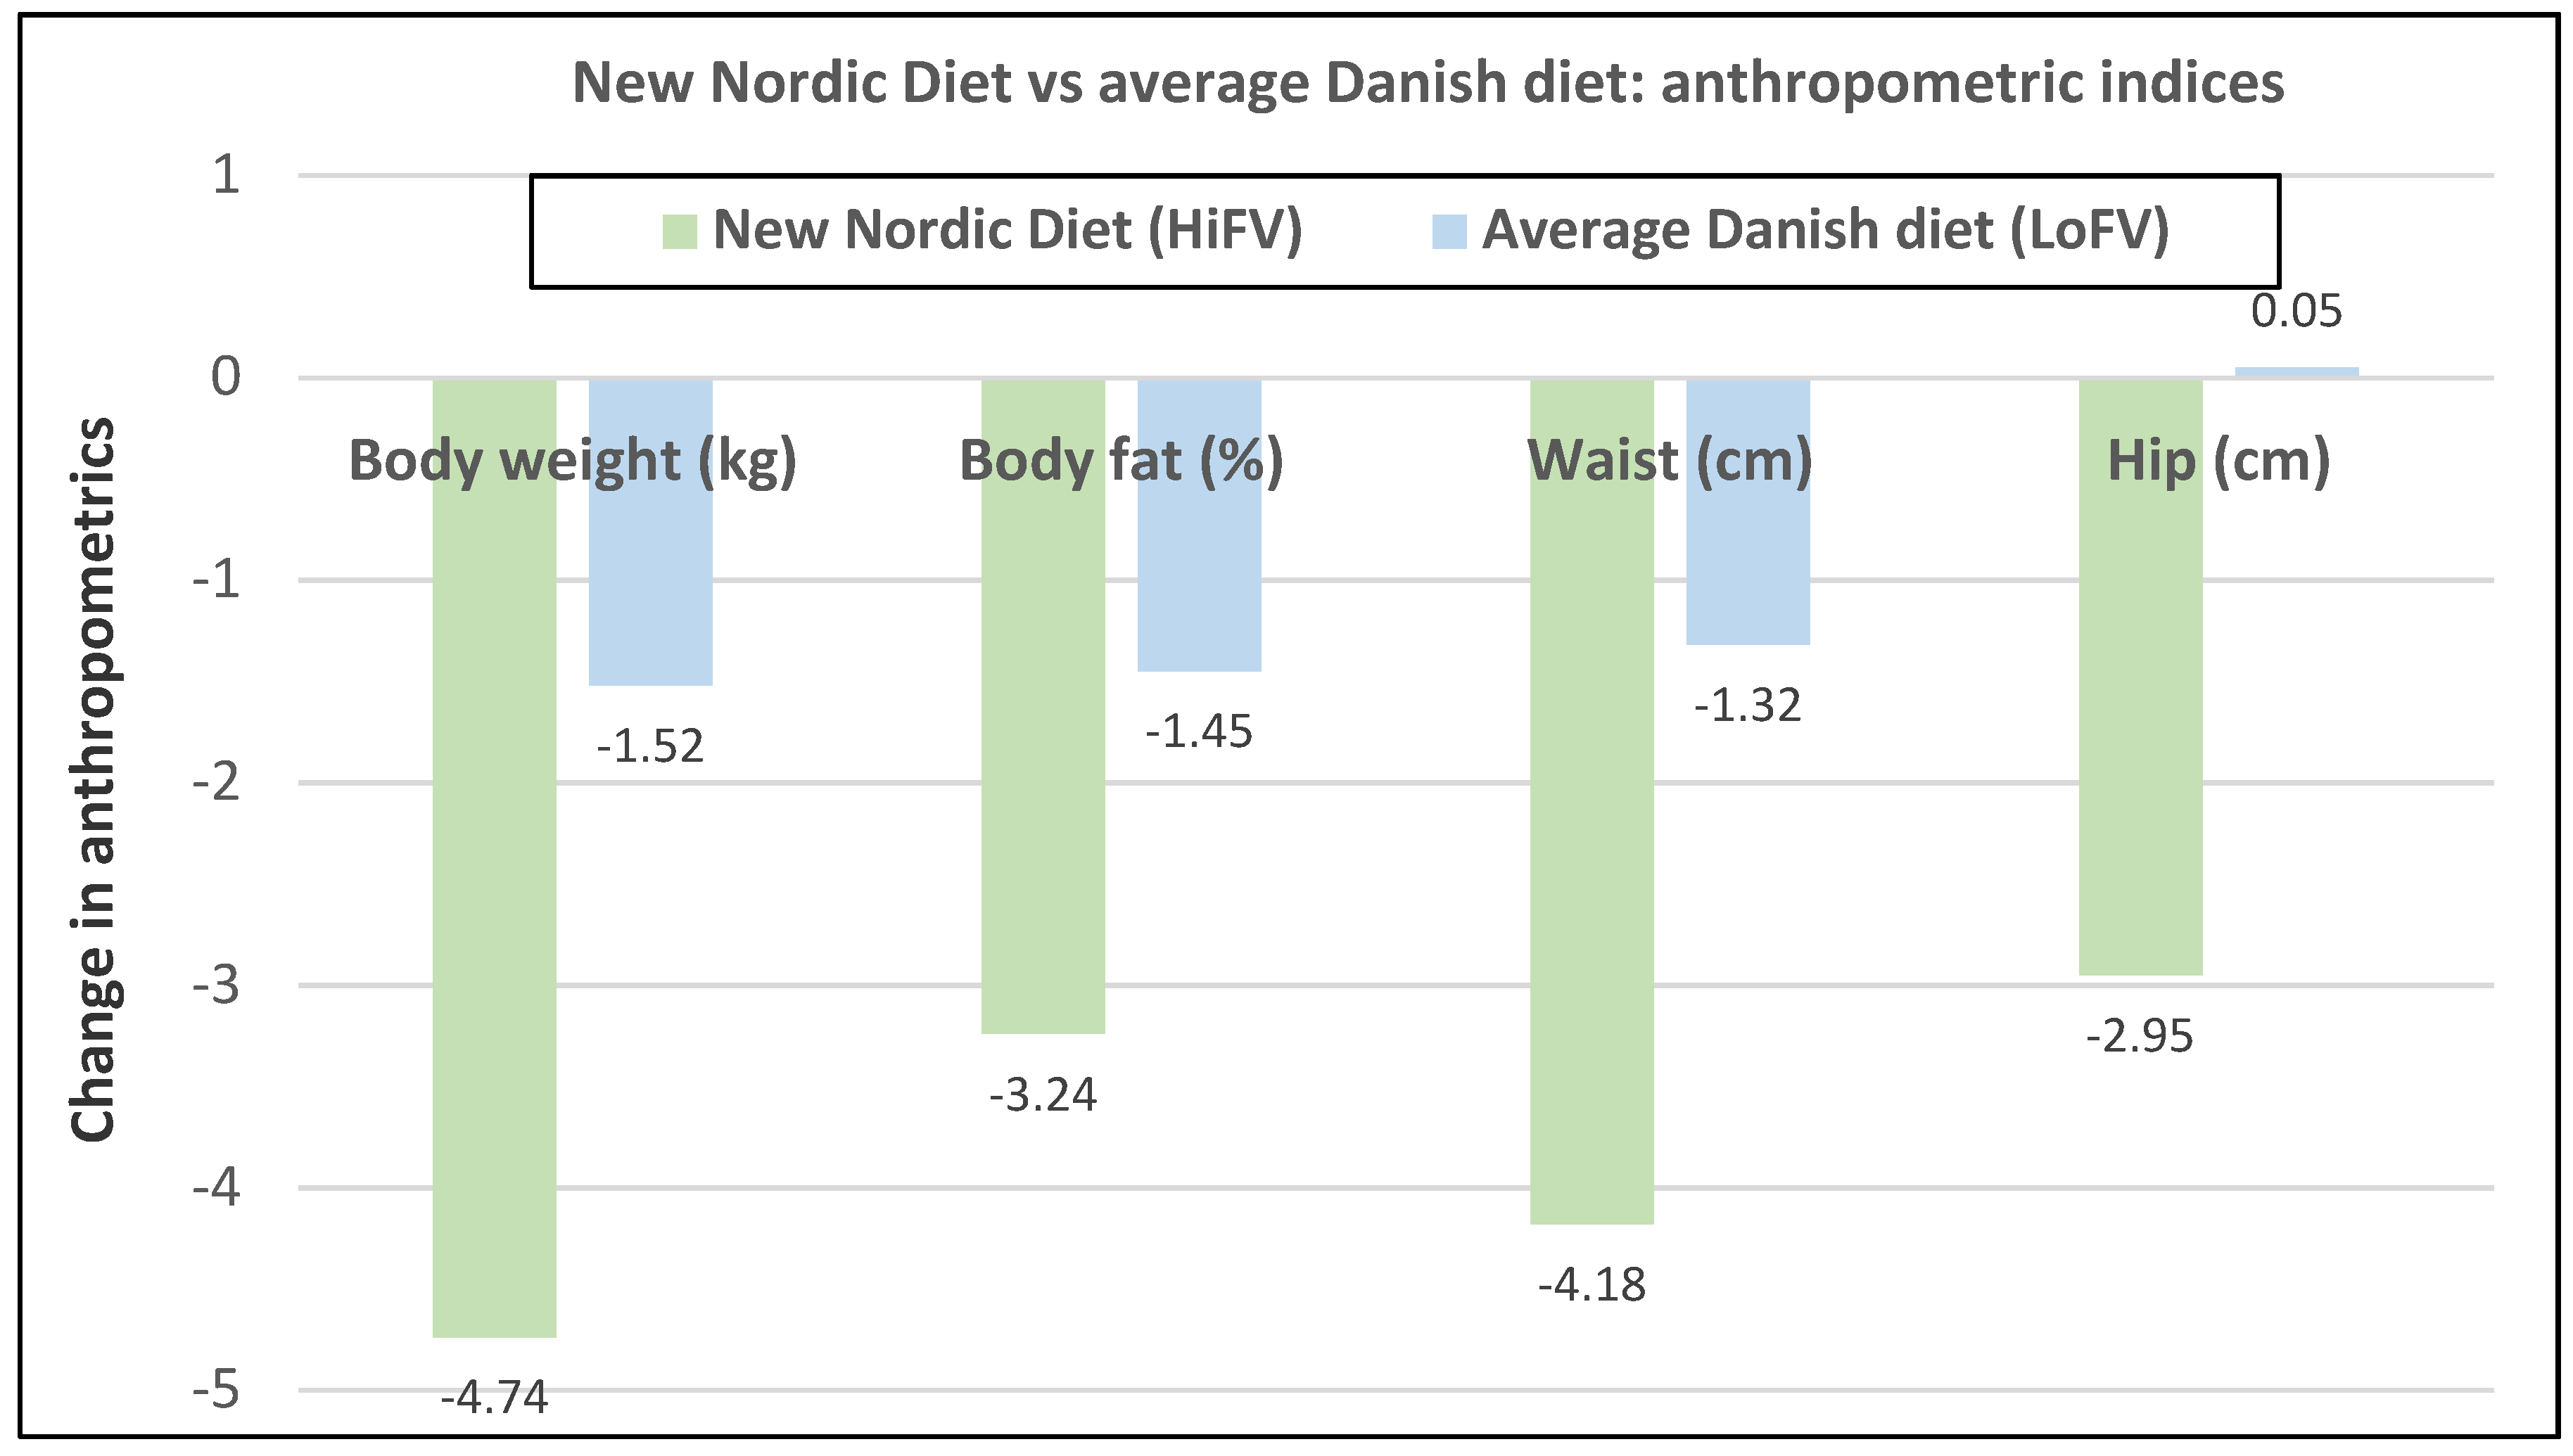
- Premenopausal women—dietary approach #1—ad libitum diets high in healthy FV and restricting higher ED foods vs. a Western-type diet. Centrally obese adults (71% women; mean baseline age 42 years, BMI of 30, and WC of 100 cm) consuming the New Nordic Diet (high in FV) significantly lowered body weight and fat, and waist and hip circumferences compared to the average Danish diet (low in FV) over 26 weeks (Figure 9) [40]. The New Nordic diet reduced total energy intake by −420 kcals, ED by −0.21 kcal/g, and increased fiber intake by 19 g/day versus the average Danish control (Western) diet. The New Nordic diet significantly reduced both systolic and diastolic blood pressure by −5.1 and −3.2 mmHg, respectively.
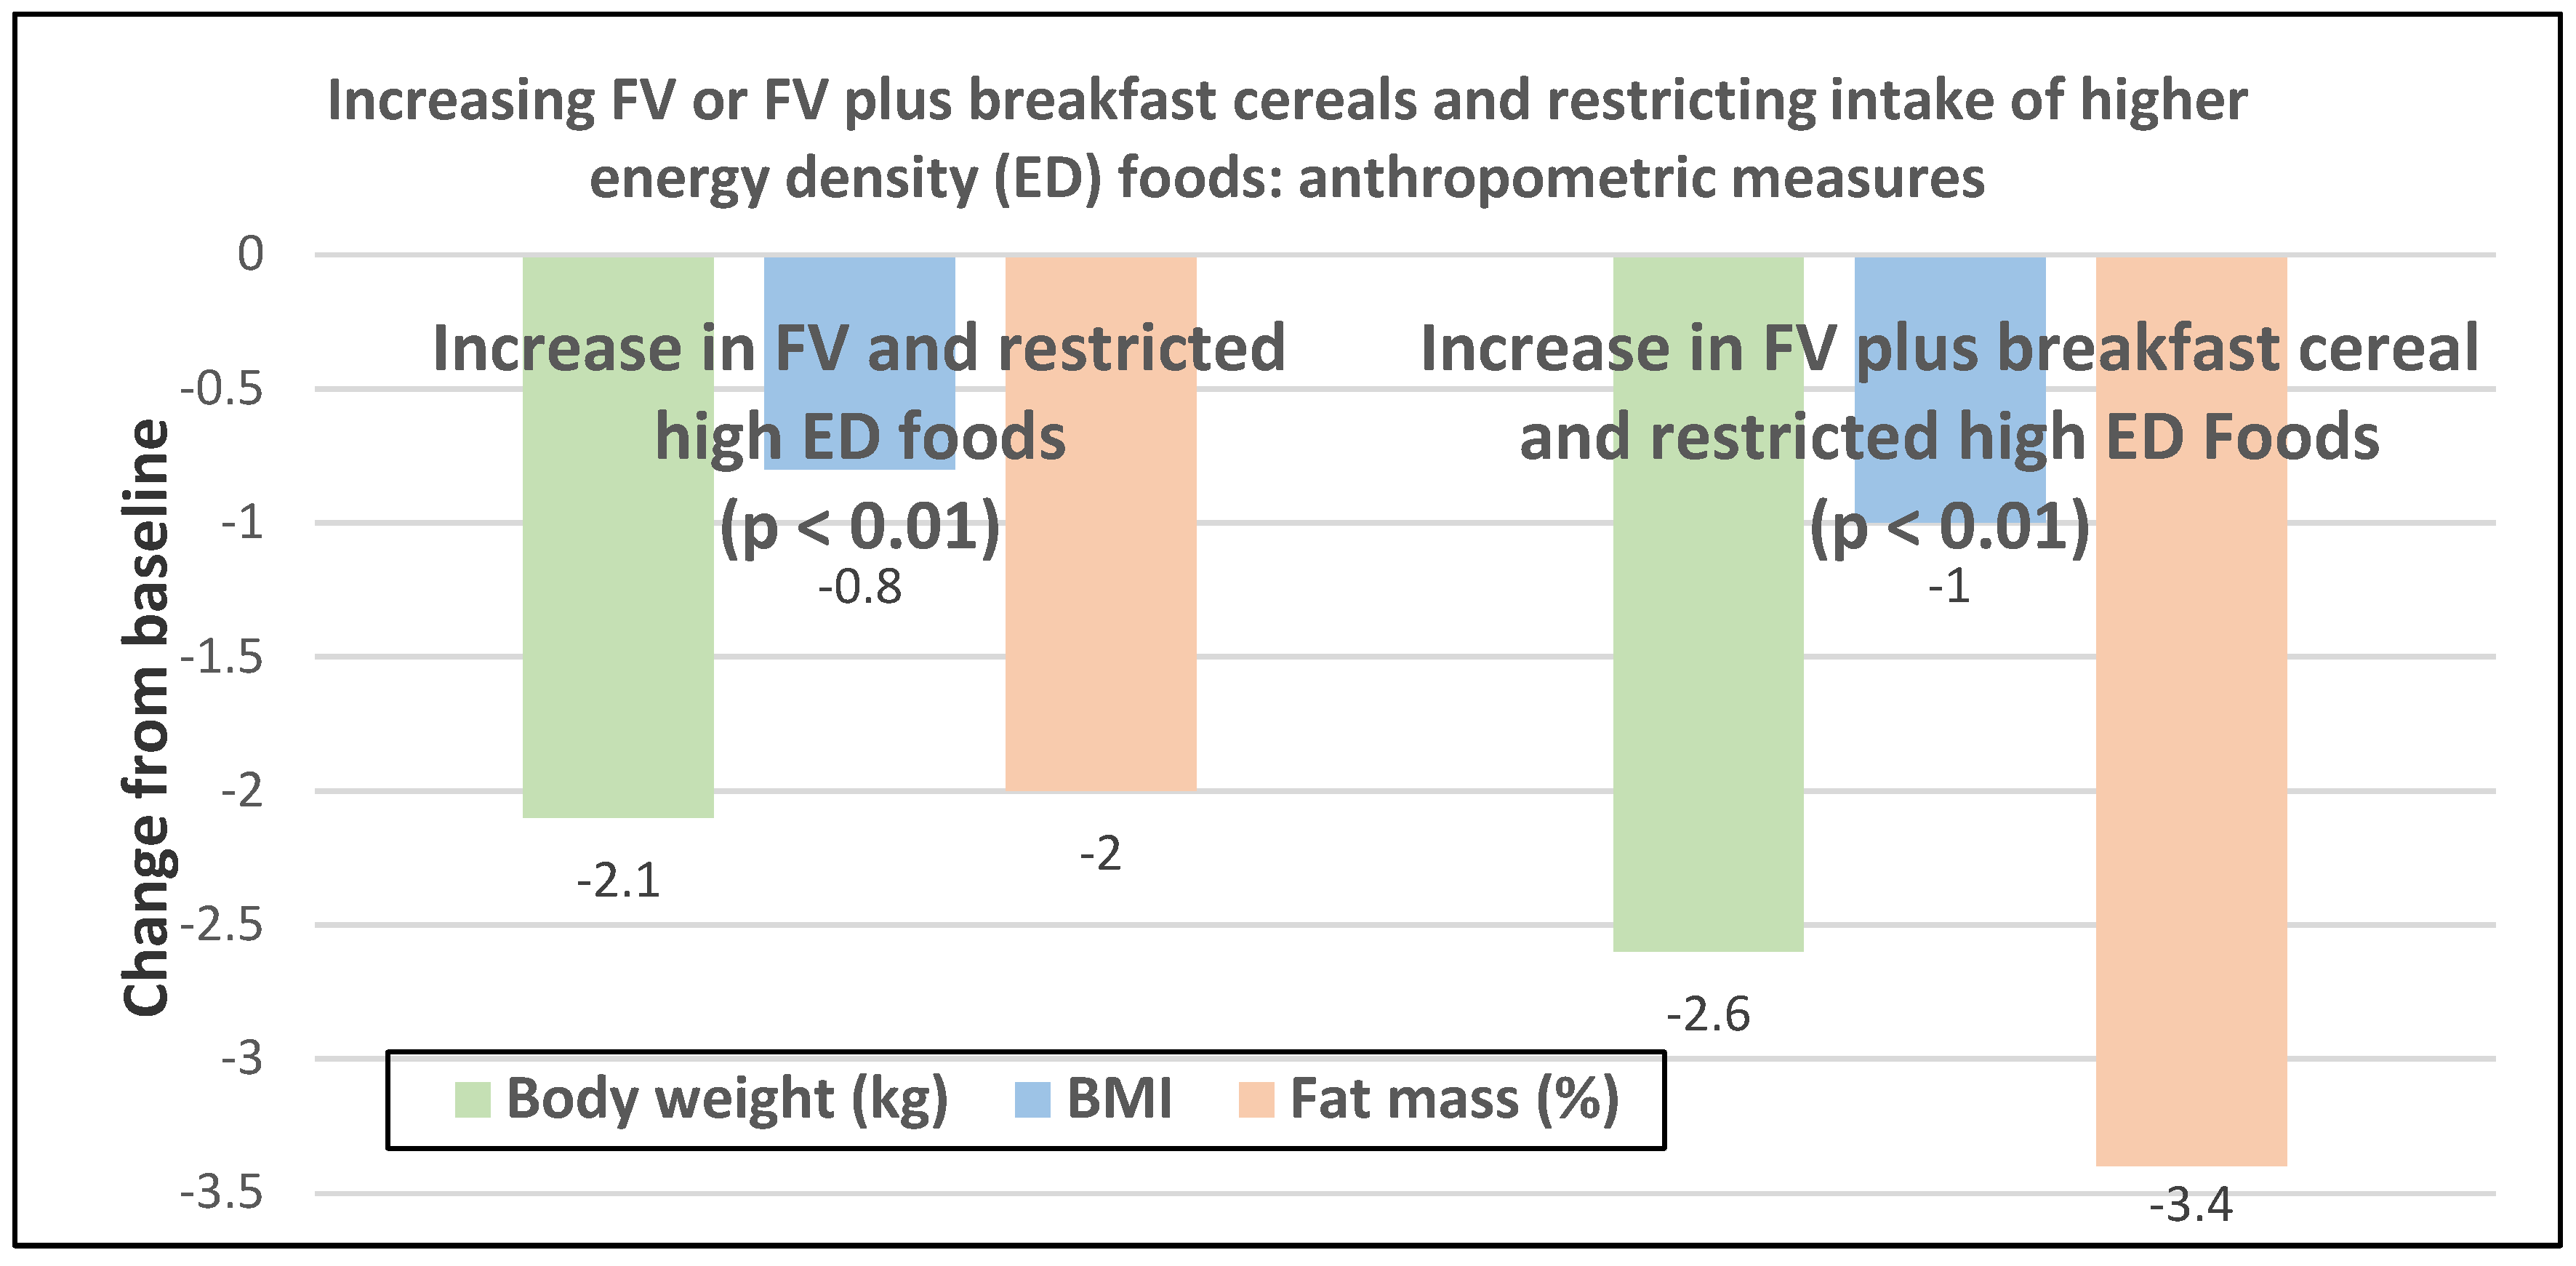
- Premenopausal women—dietary approach #3—guidance to increase FV and cereals and restricting the intake of ED rich foods. Overweight women significantly reduced weight, BMI, and/or % body fat from baseline over six weeks when they increased their FV intake by 4.5 servings/day or FV intake by 2.5 servings/day plus one serving of cereal along with concurrently restricting high ED foods (Figure 11) [42]. Similar findings were also reported in two other papers [43,44].
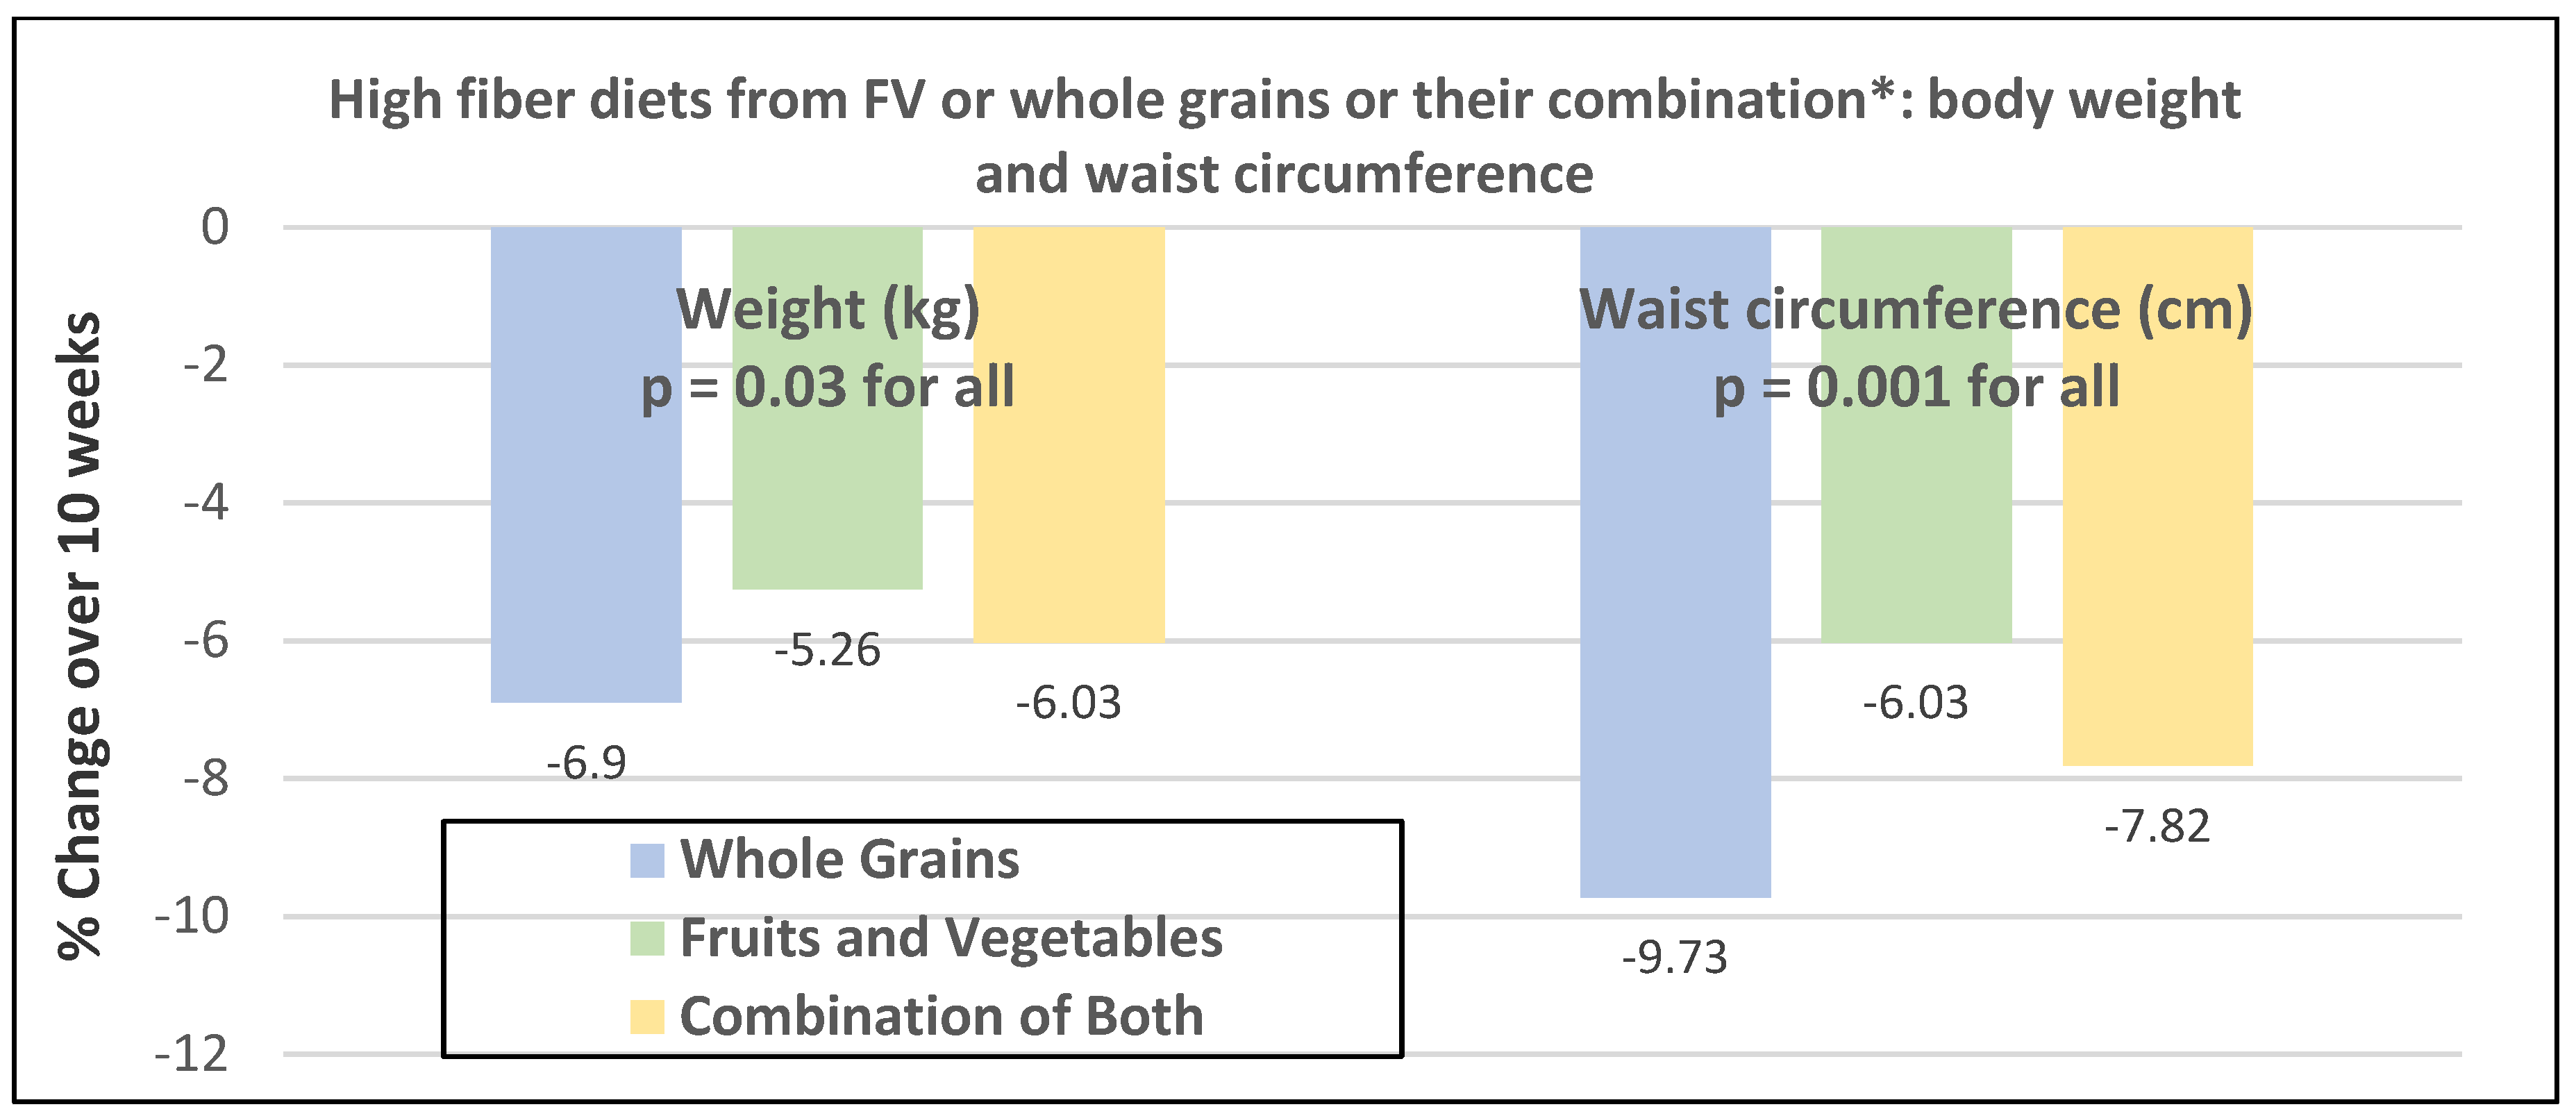
- Premenopausal women—dietary approach #4—increasing high fiber diets from FV and/or cereals with supervision and no energy restrictions. Obese women consuming >35 g/day fiber from FV, whole grain cereals, or a combination of both at high levels with a 2100-kcal diet under supervision, significantly reduced weight and WC after ten weeks (Figure 12) [45].
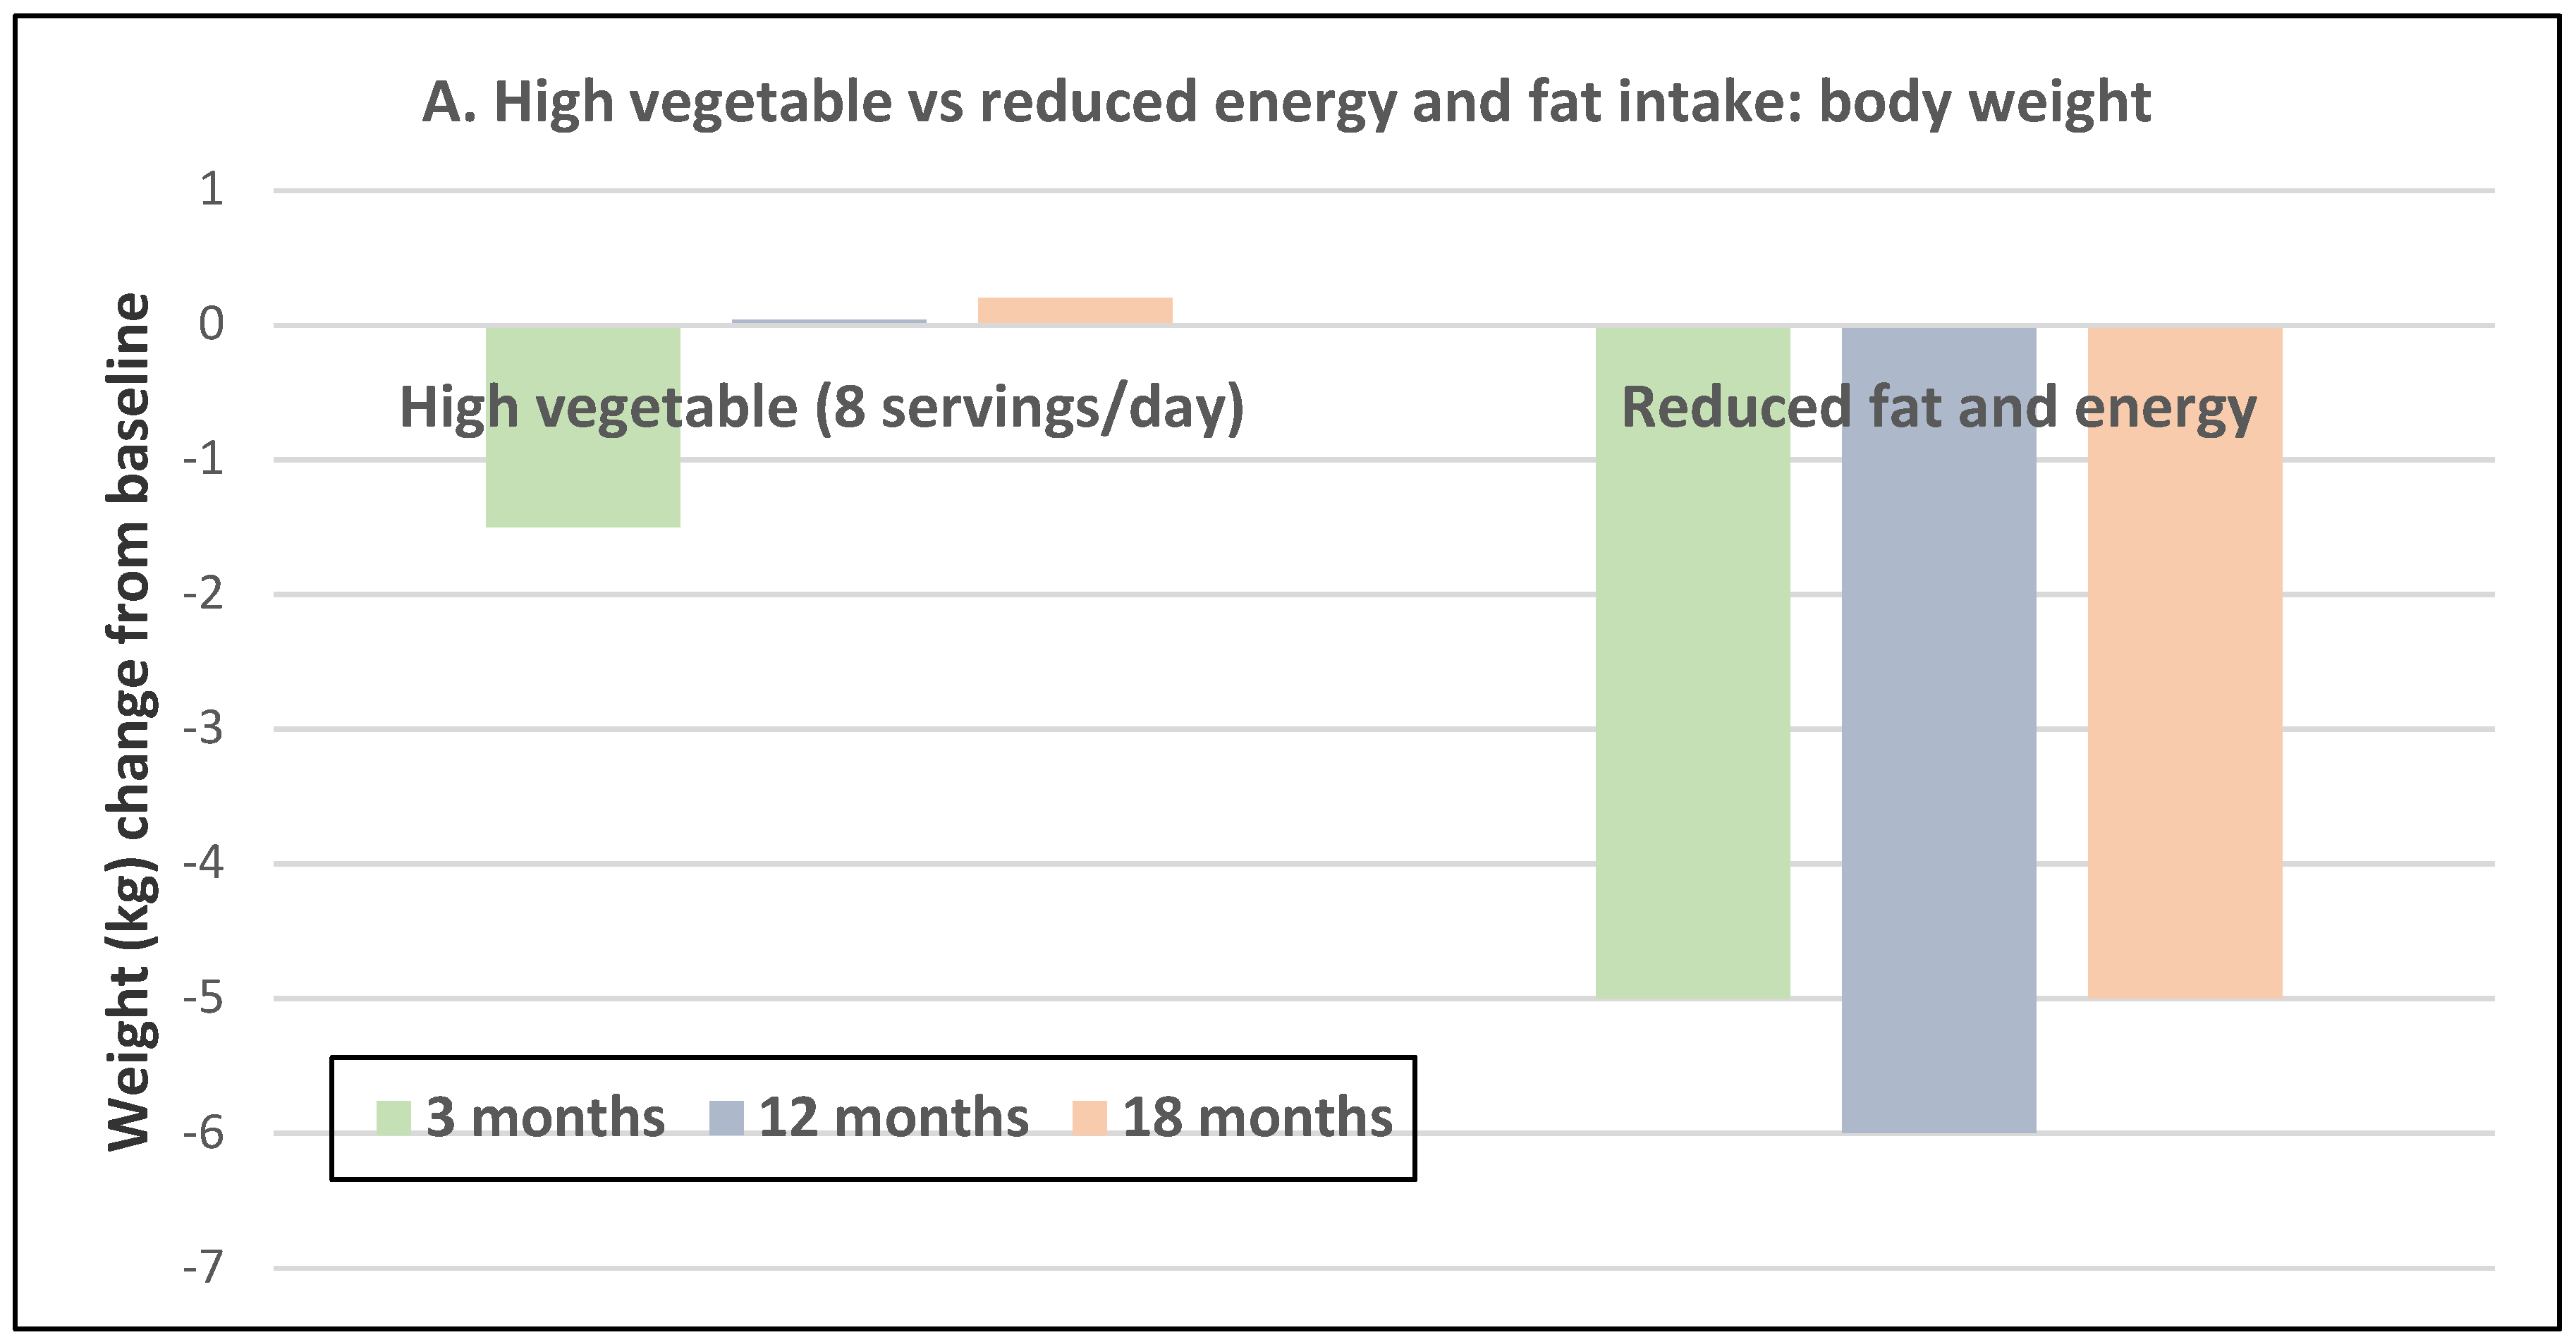
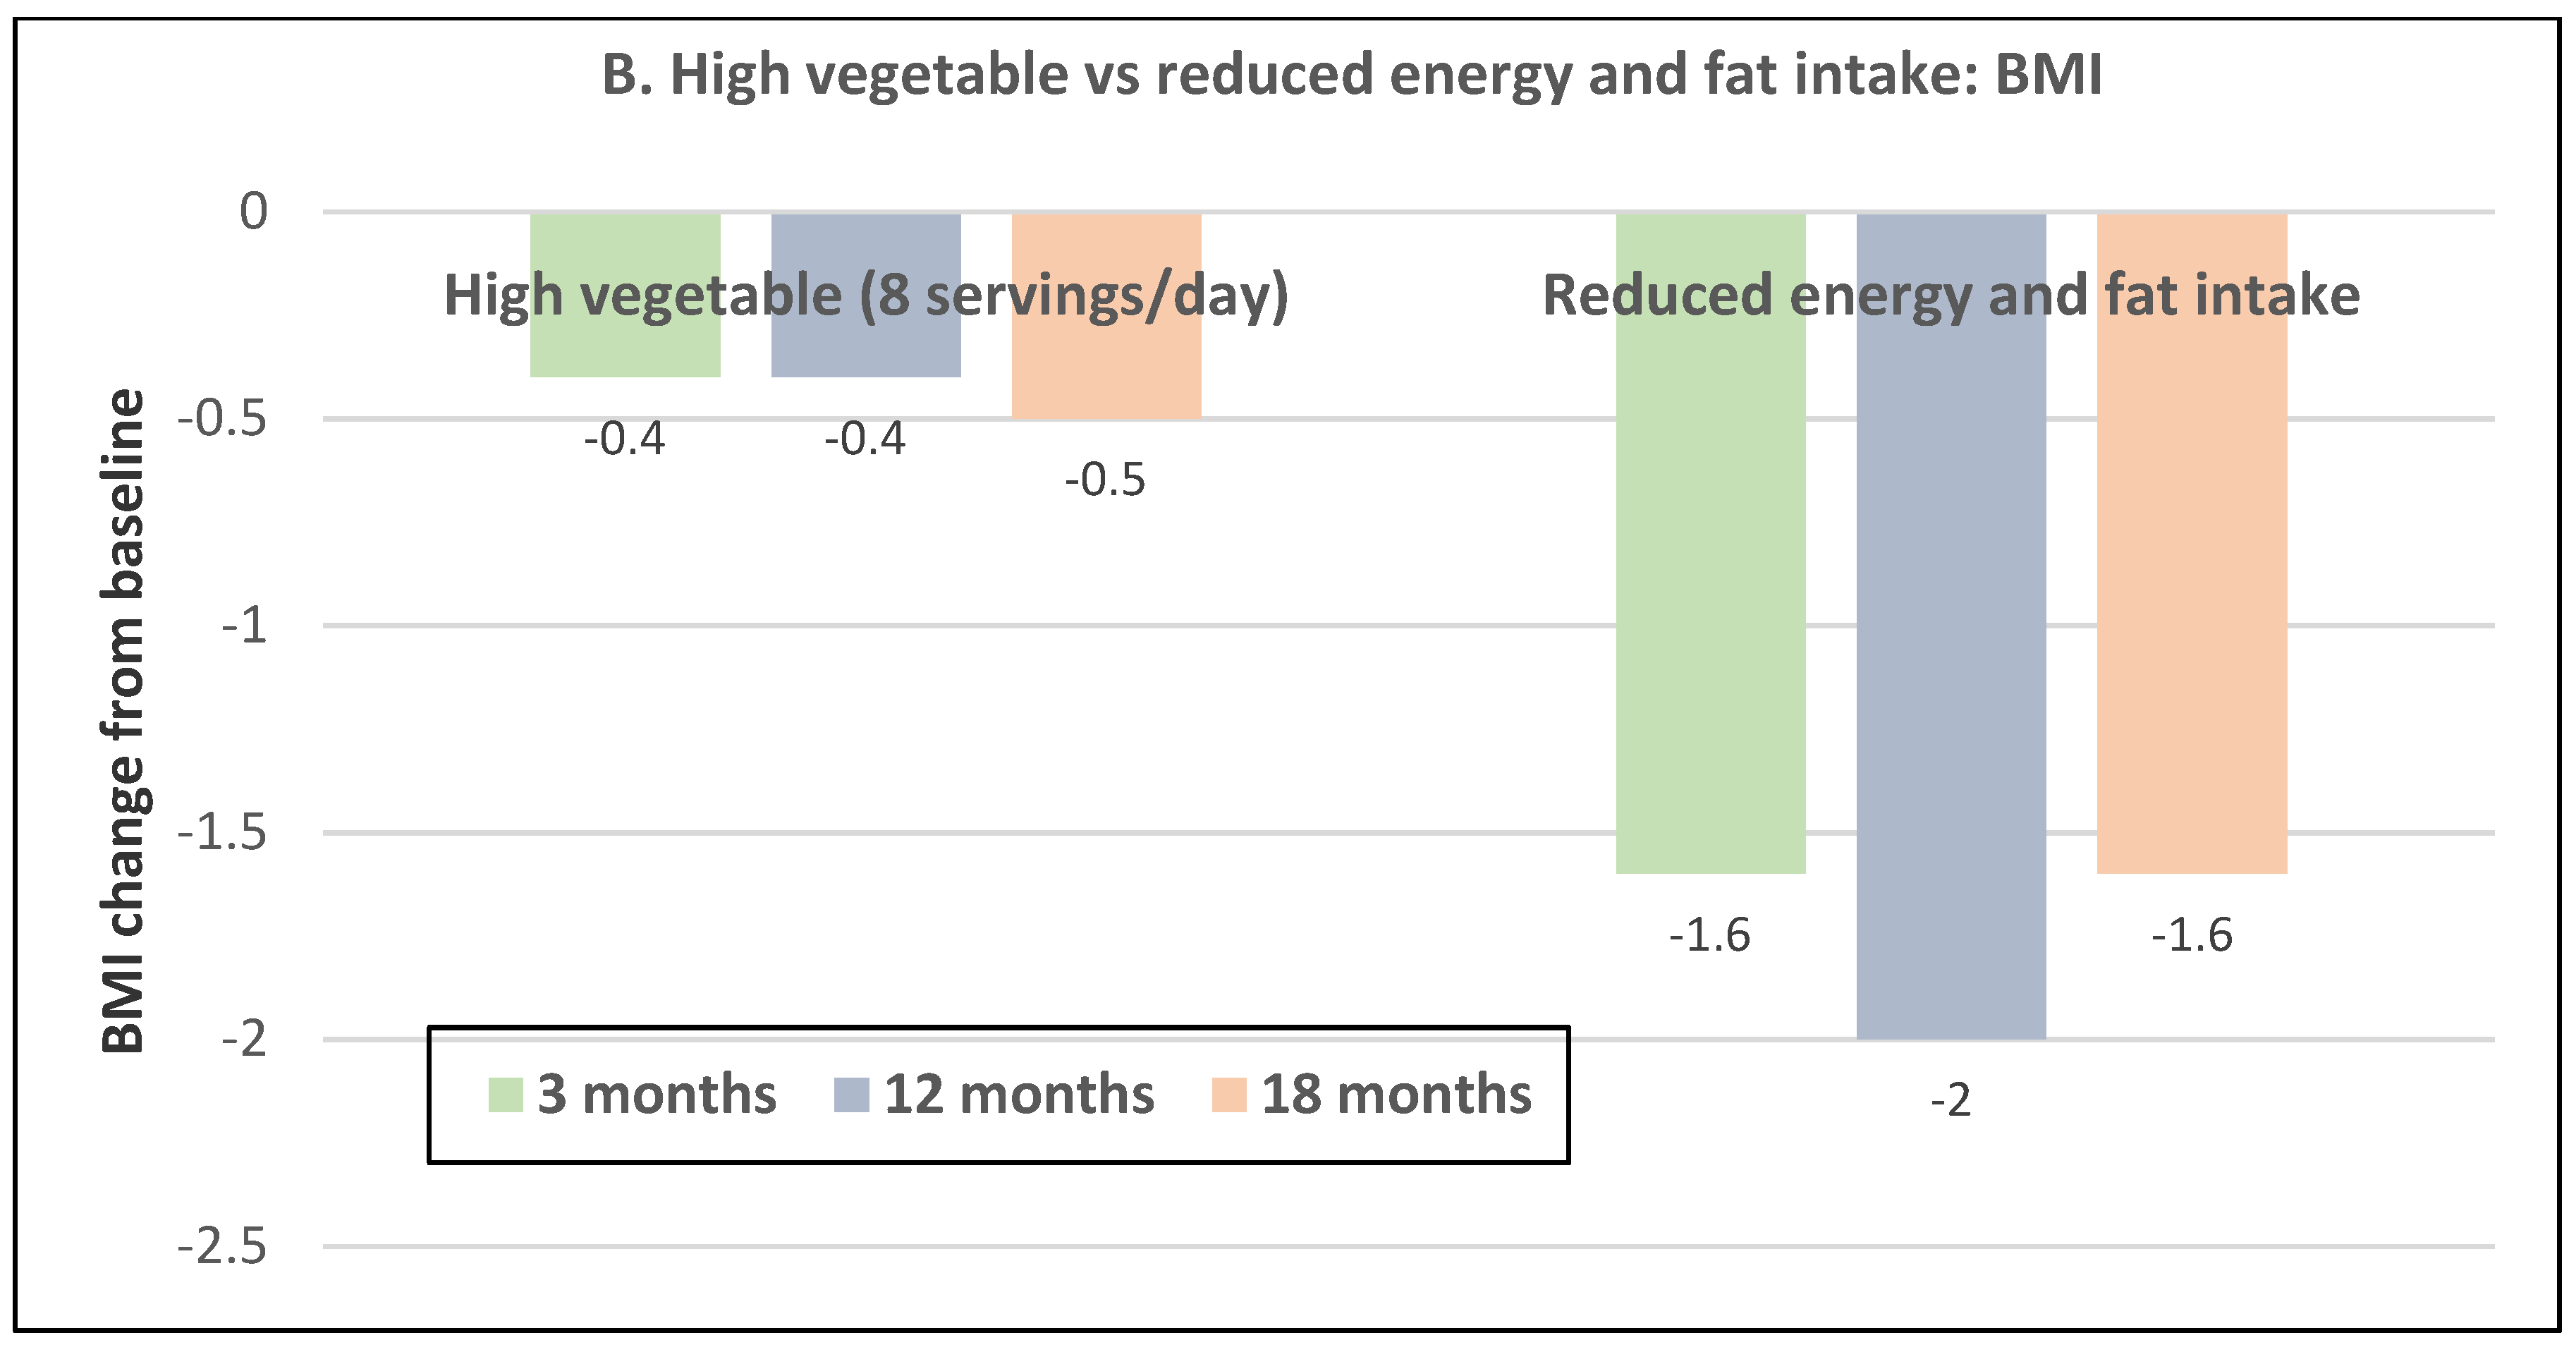
- Premenopausal women—dietary approach #5—high vegetable diet including fried potatoes, 100% fruit, and vegetable juice vs. diets with 500 kcal reduced energy. Overweight and obese women consuming eight vegetable servings/day significantly reduced weight and BMI over three months with individual consultations and prevented weight regain for 18 months of follow-up, but the 500 kcal restricted diet resulted in additional significant weight loss that was maintained over the 18 months of follow-up (Figure 13A,B) [46].
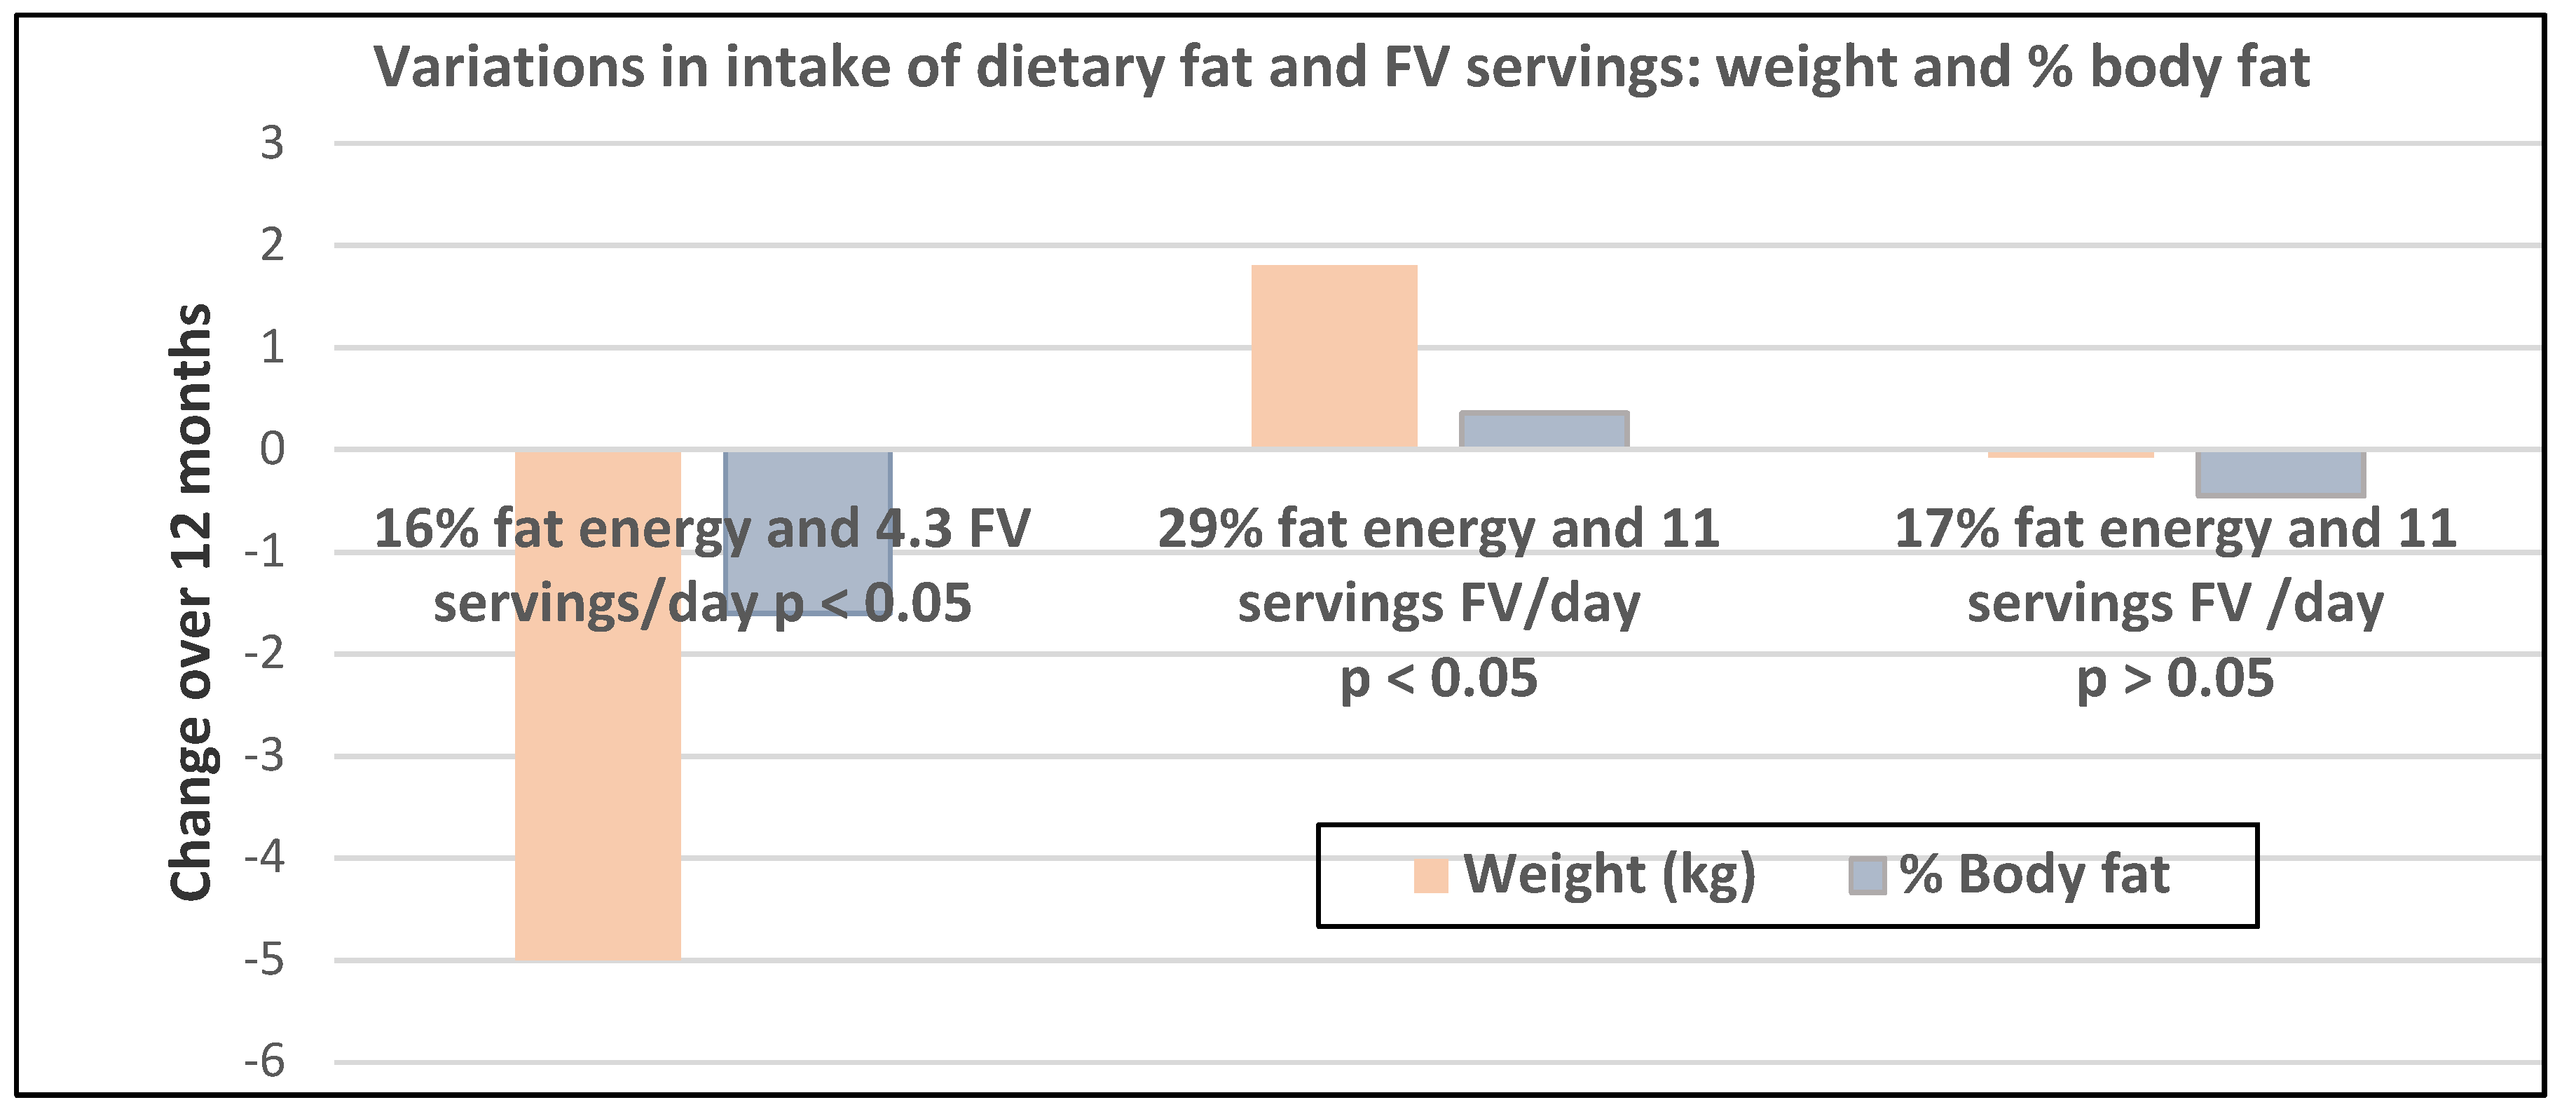
- Premenopausal women—dietary approach #6—varying percent energy from fat and servings of FV. High FV intake, including 100% juice, dried fruit, and starchy vegetables, reduced weight, and % body fat with 16–17% energy from fat compared to an increase in weight and % body fat with 29% energy from fat (Figure 14) [47].
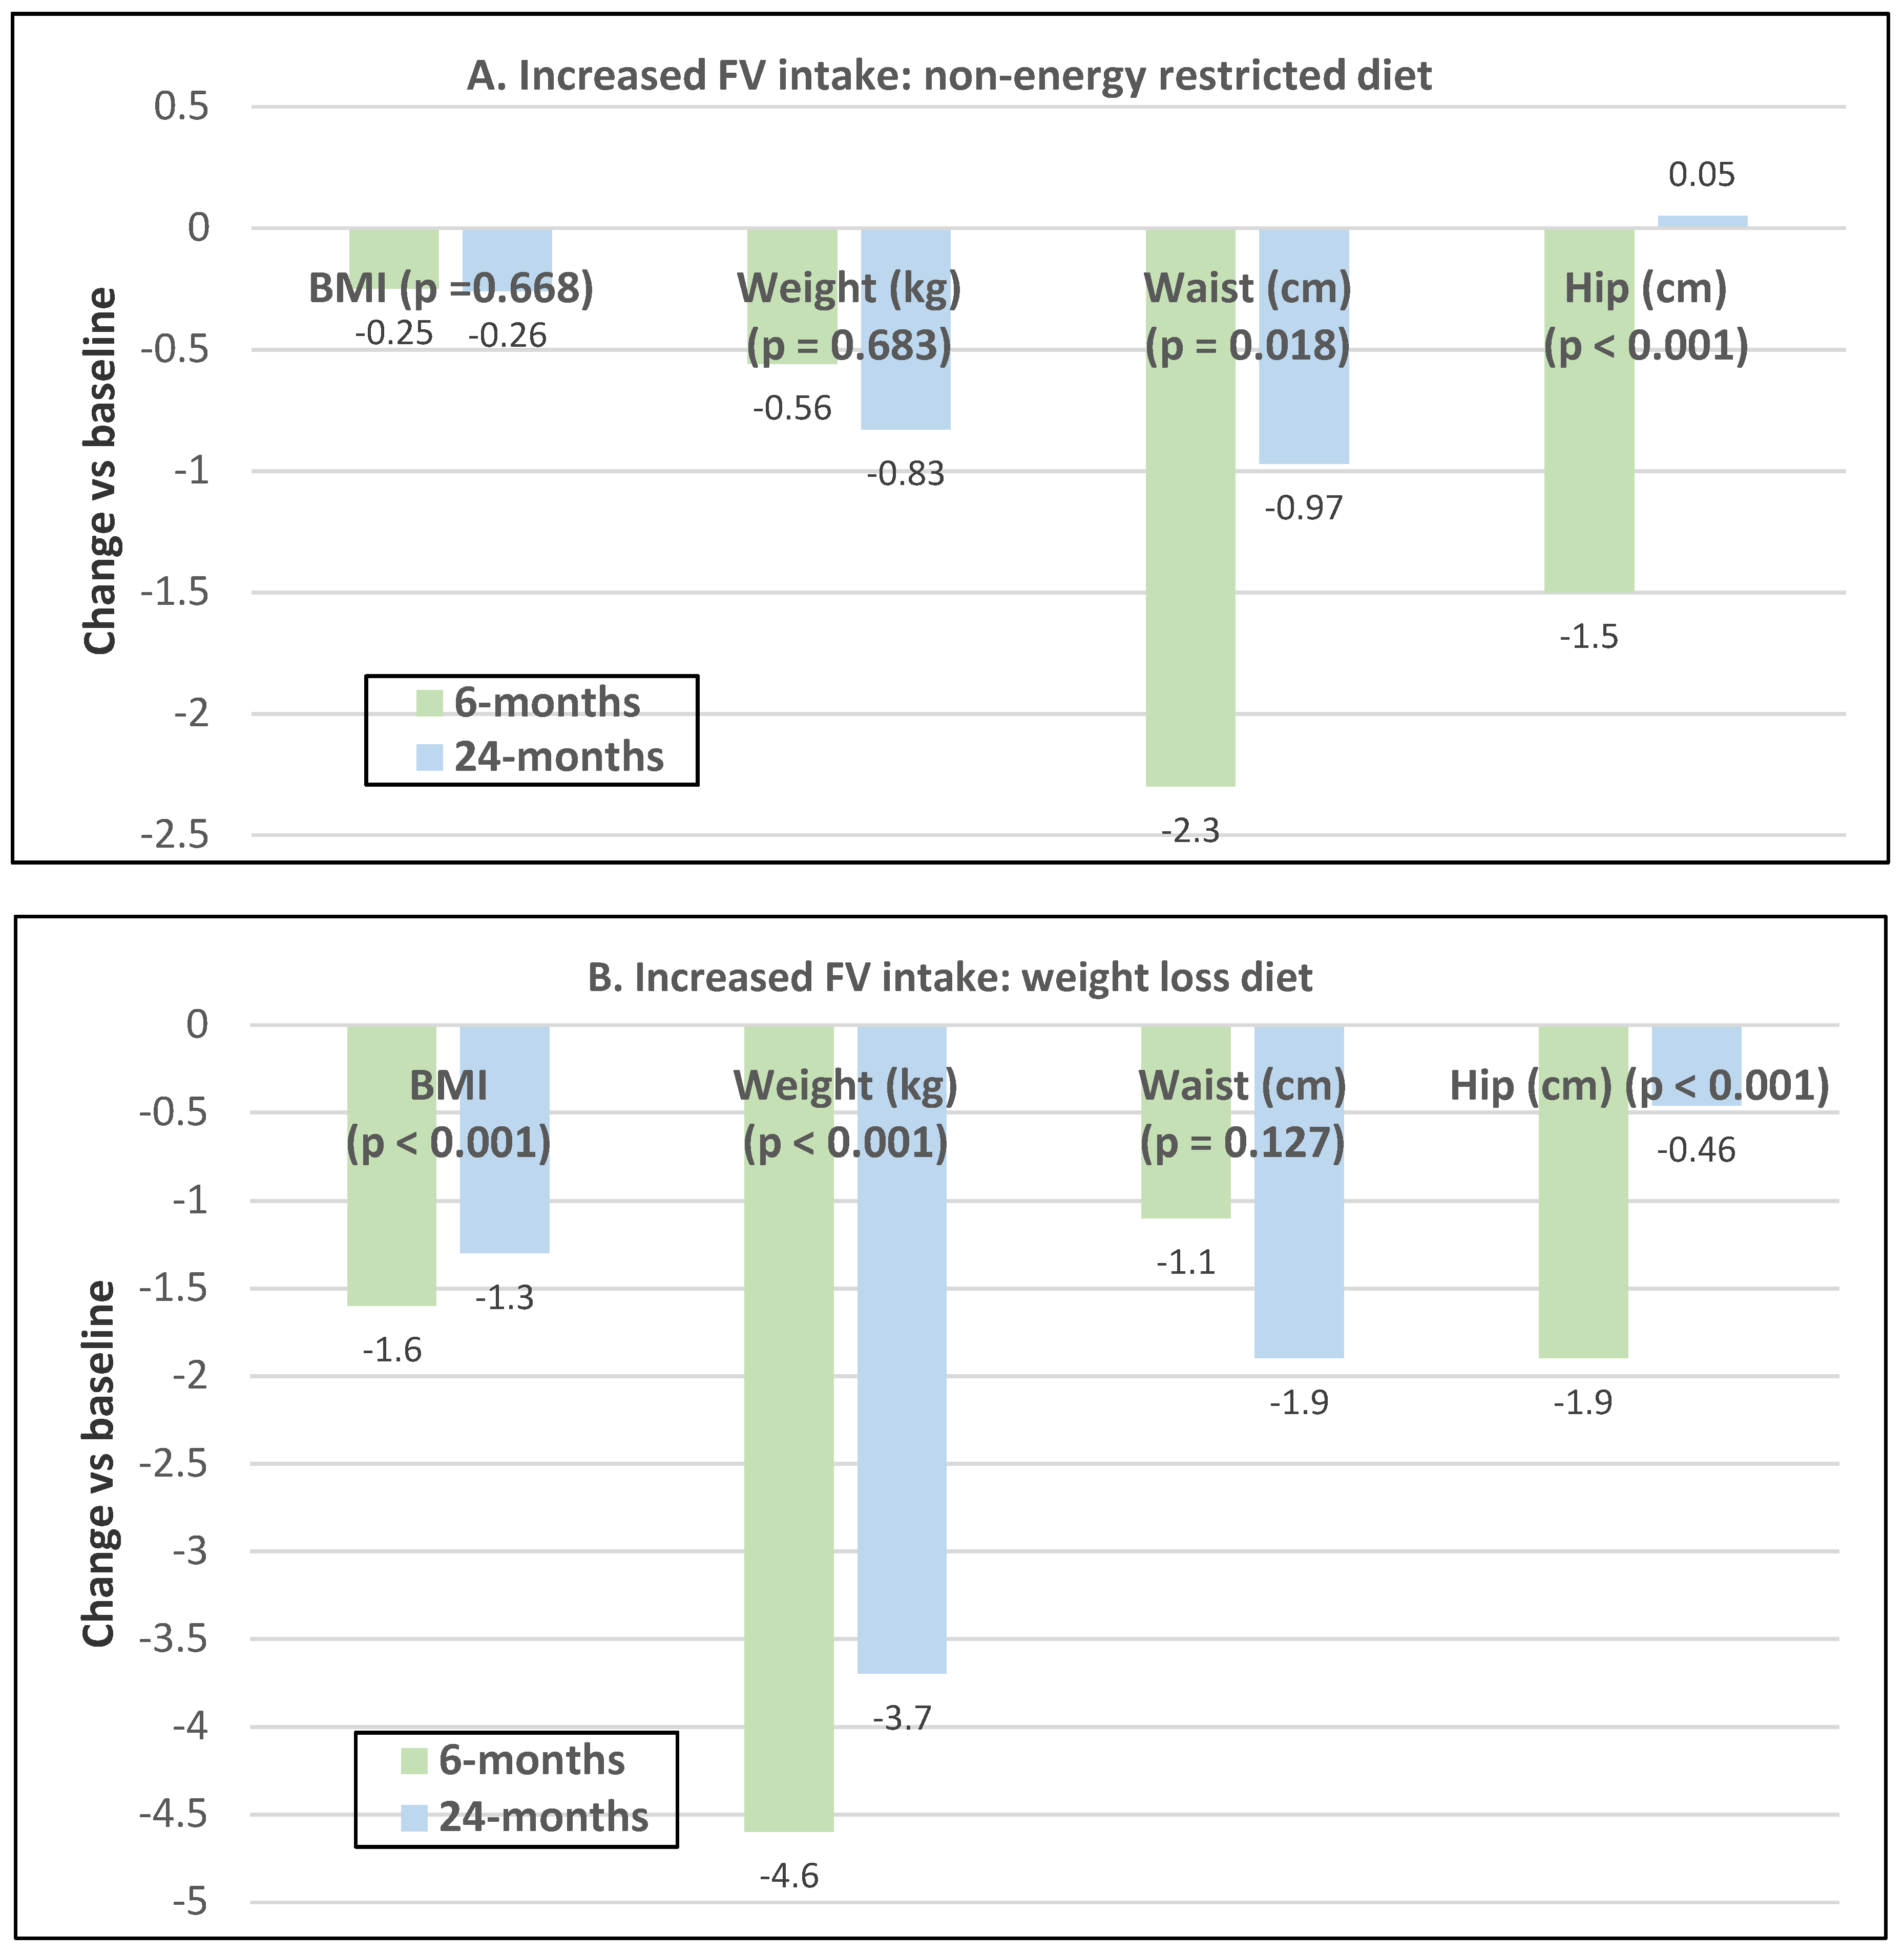
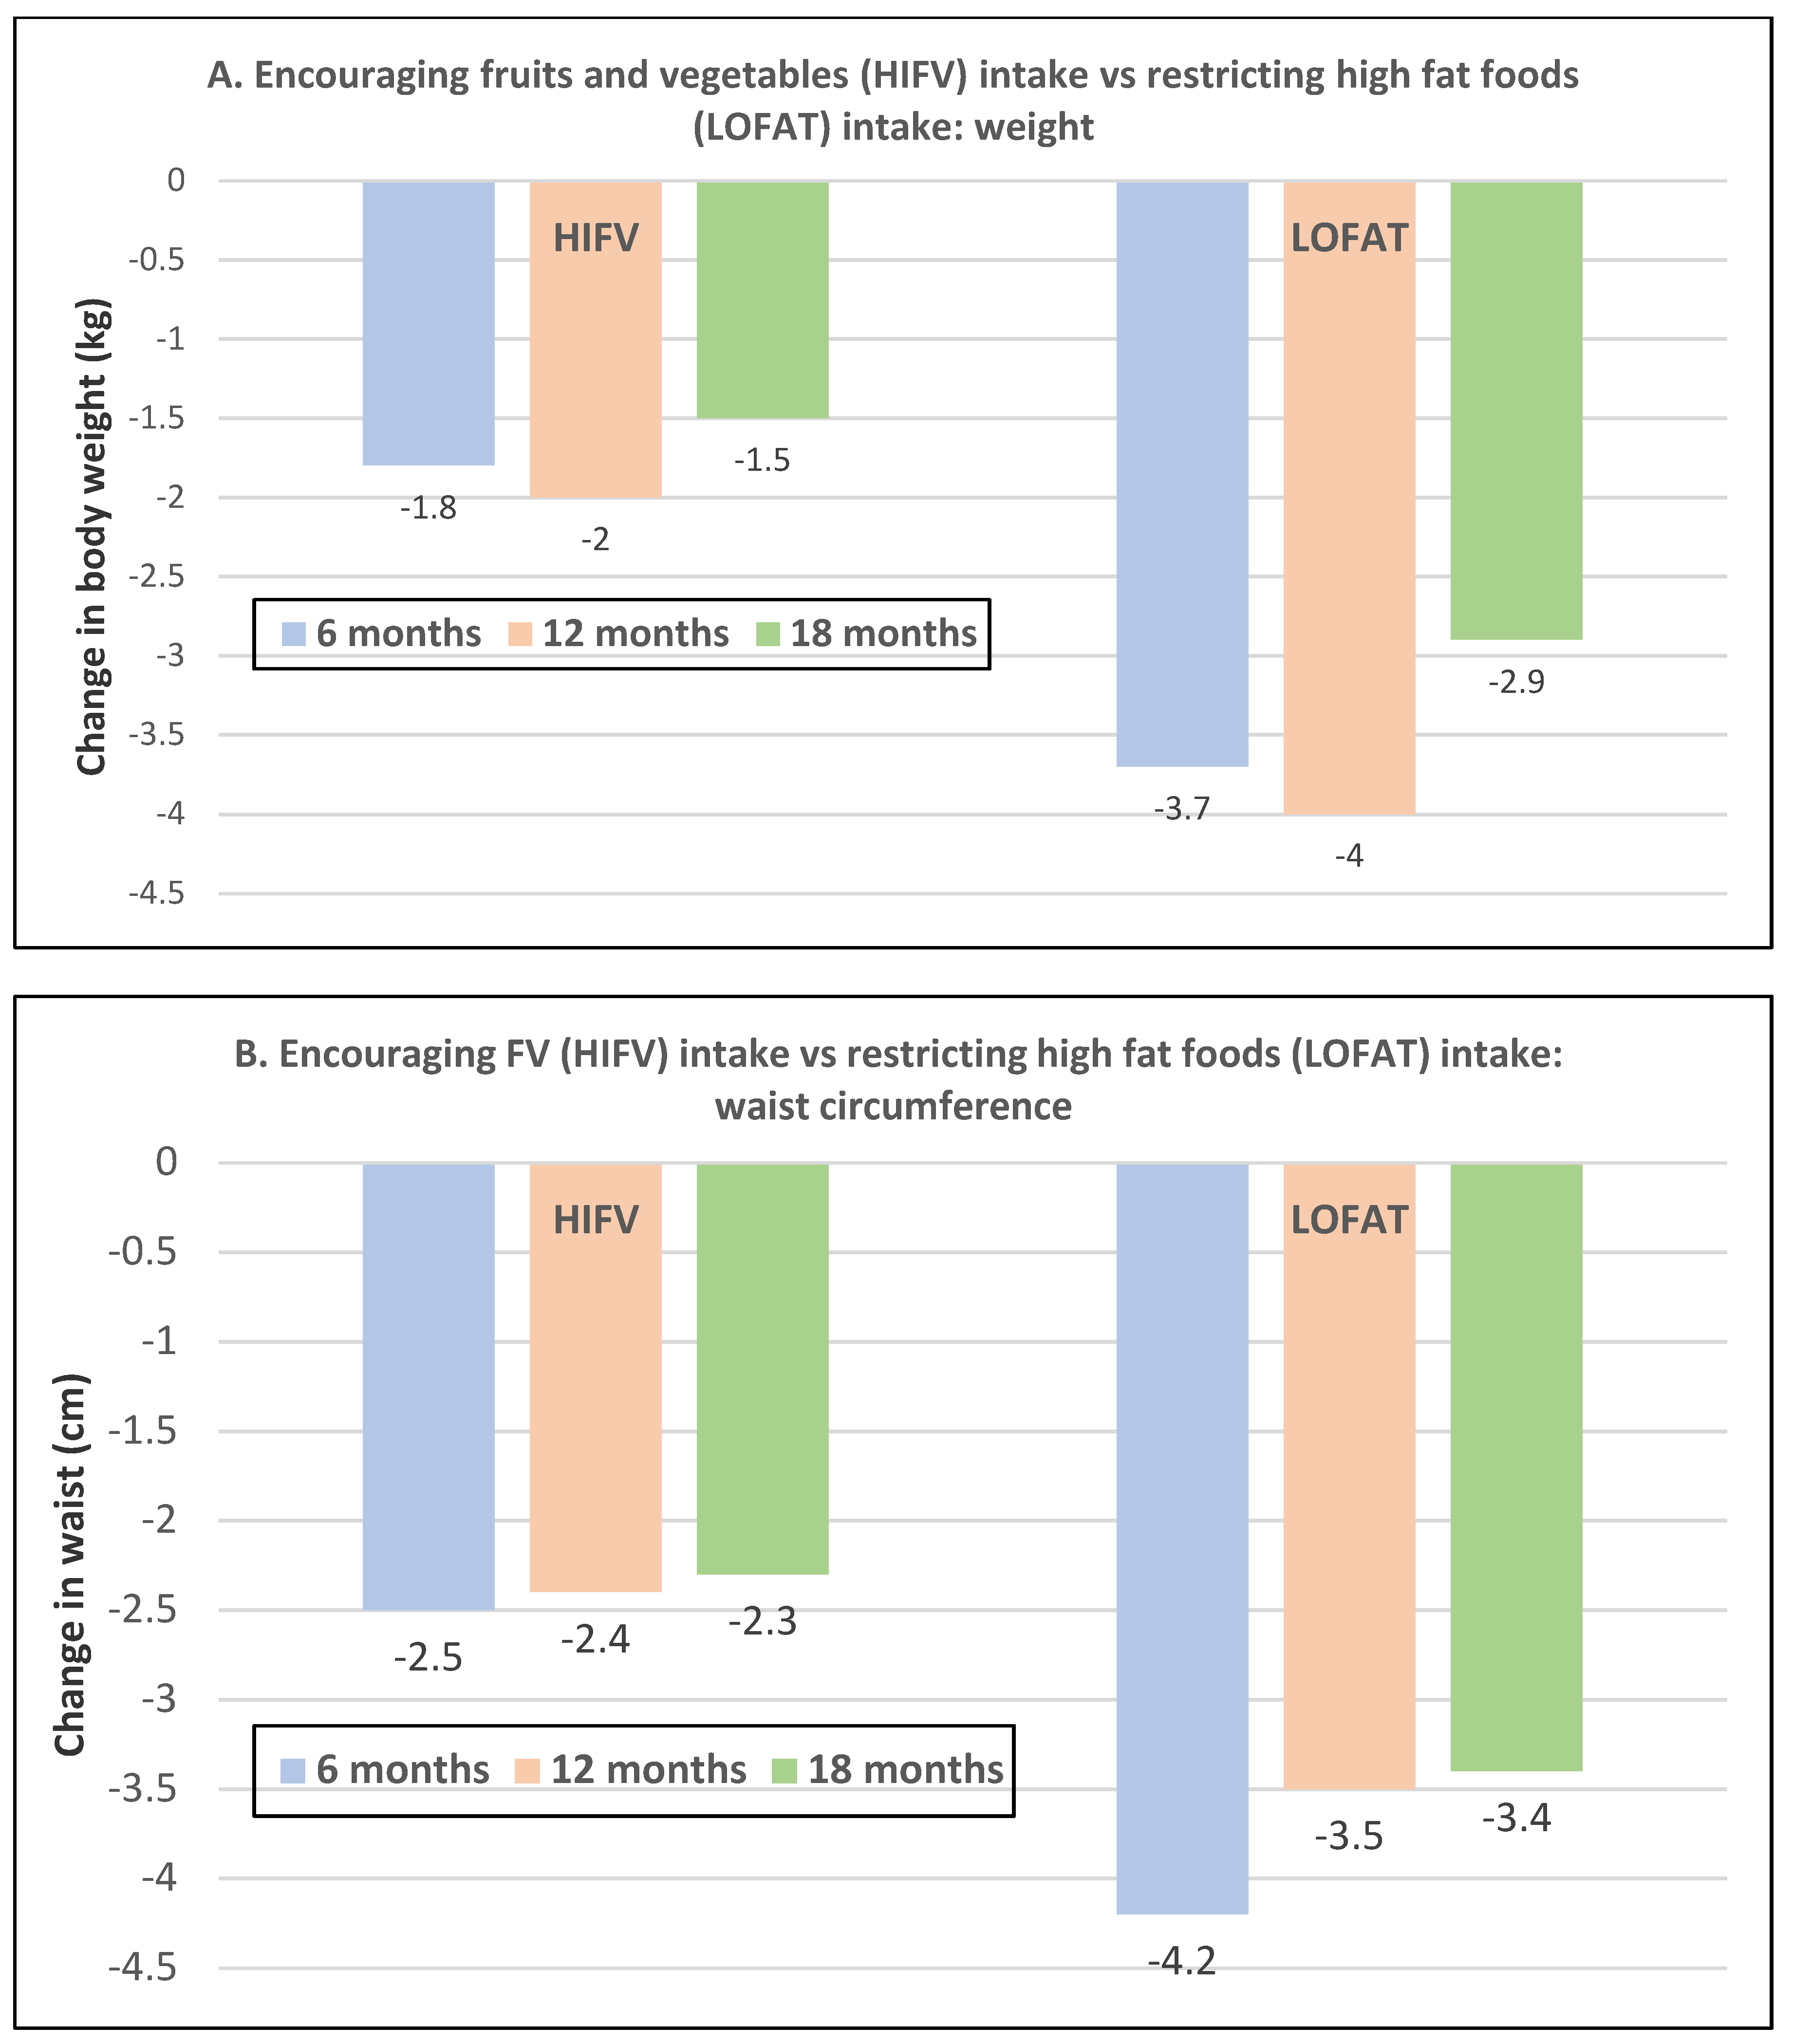
- Premenopausal women—dietary approach #7—moderate increase in FV intake with weight neutral and weight loss diets. Obese women increasing FV intake by 1.3 to 2.2 servings/day in a weight neutral diet over a 6-month intervention had insignificant BMI and weight reduction and significant reductions in waist and hip measures, which were attenuated toward baseline levels after 18-months of follow-up (24-month time point) whereas those increasing FV in a weight loss diet had significant reductions of BMI, weight, waist and hip circumference over 6-months with little attenuation over the 18-month follow-up (Figure 15A,B) [48].
- Premenopausal women—dietary approach #8—reduced energy weight-loss diets with whole fruit or fruit juice. Obese women (mean age 32 years) who consumed hypocaloric diets had the same weight and body fat % reductions with high or low fruit content over eight weeks [49]. In obese Brazilian adults (approx. 70% women; mean age 36 years and baseline BMI of 33.5), the consumption of orange juice (500 mL/day) did not interfere with the effectiveness of weight-loss diets over 12 weeks [50]. In 51 overweight and obese adults (approx. 80% women; mean age 38 years and baseline BMI of 30) consuming one whole Hass avocado/day as part of a hypocaloric diet for 12 weeks supported weight loss, decreased BMI, total body fat (%) and visceral adipose tissue (g) at a similar level as a hypocaloric diet without an avocado/day [51].
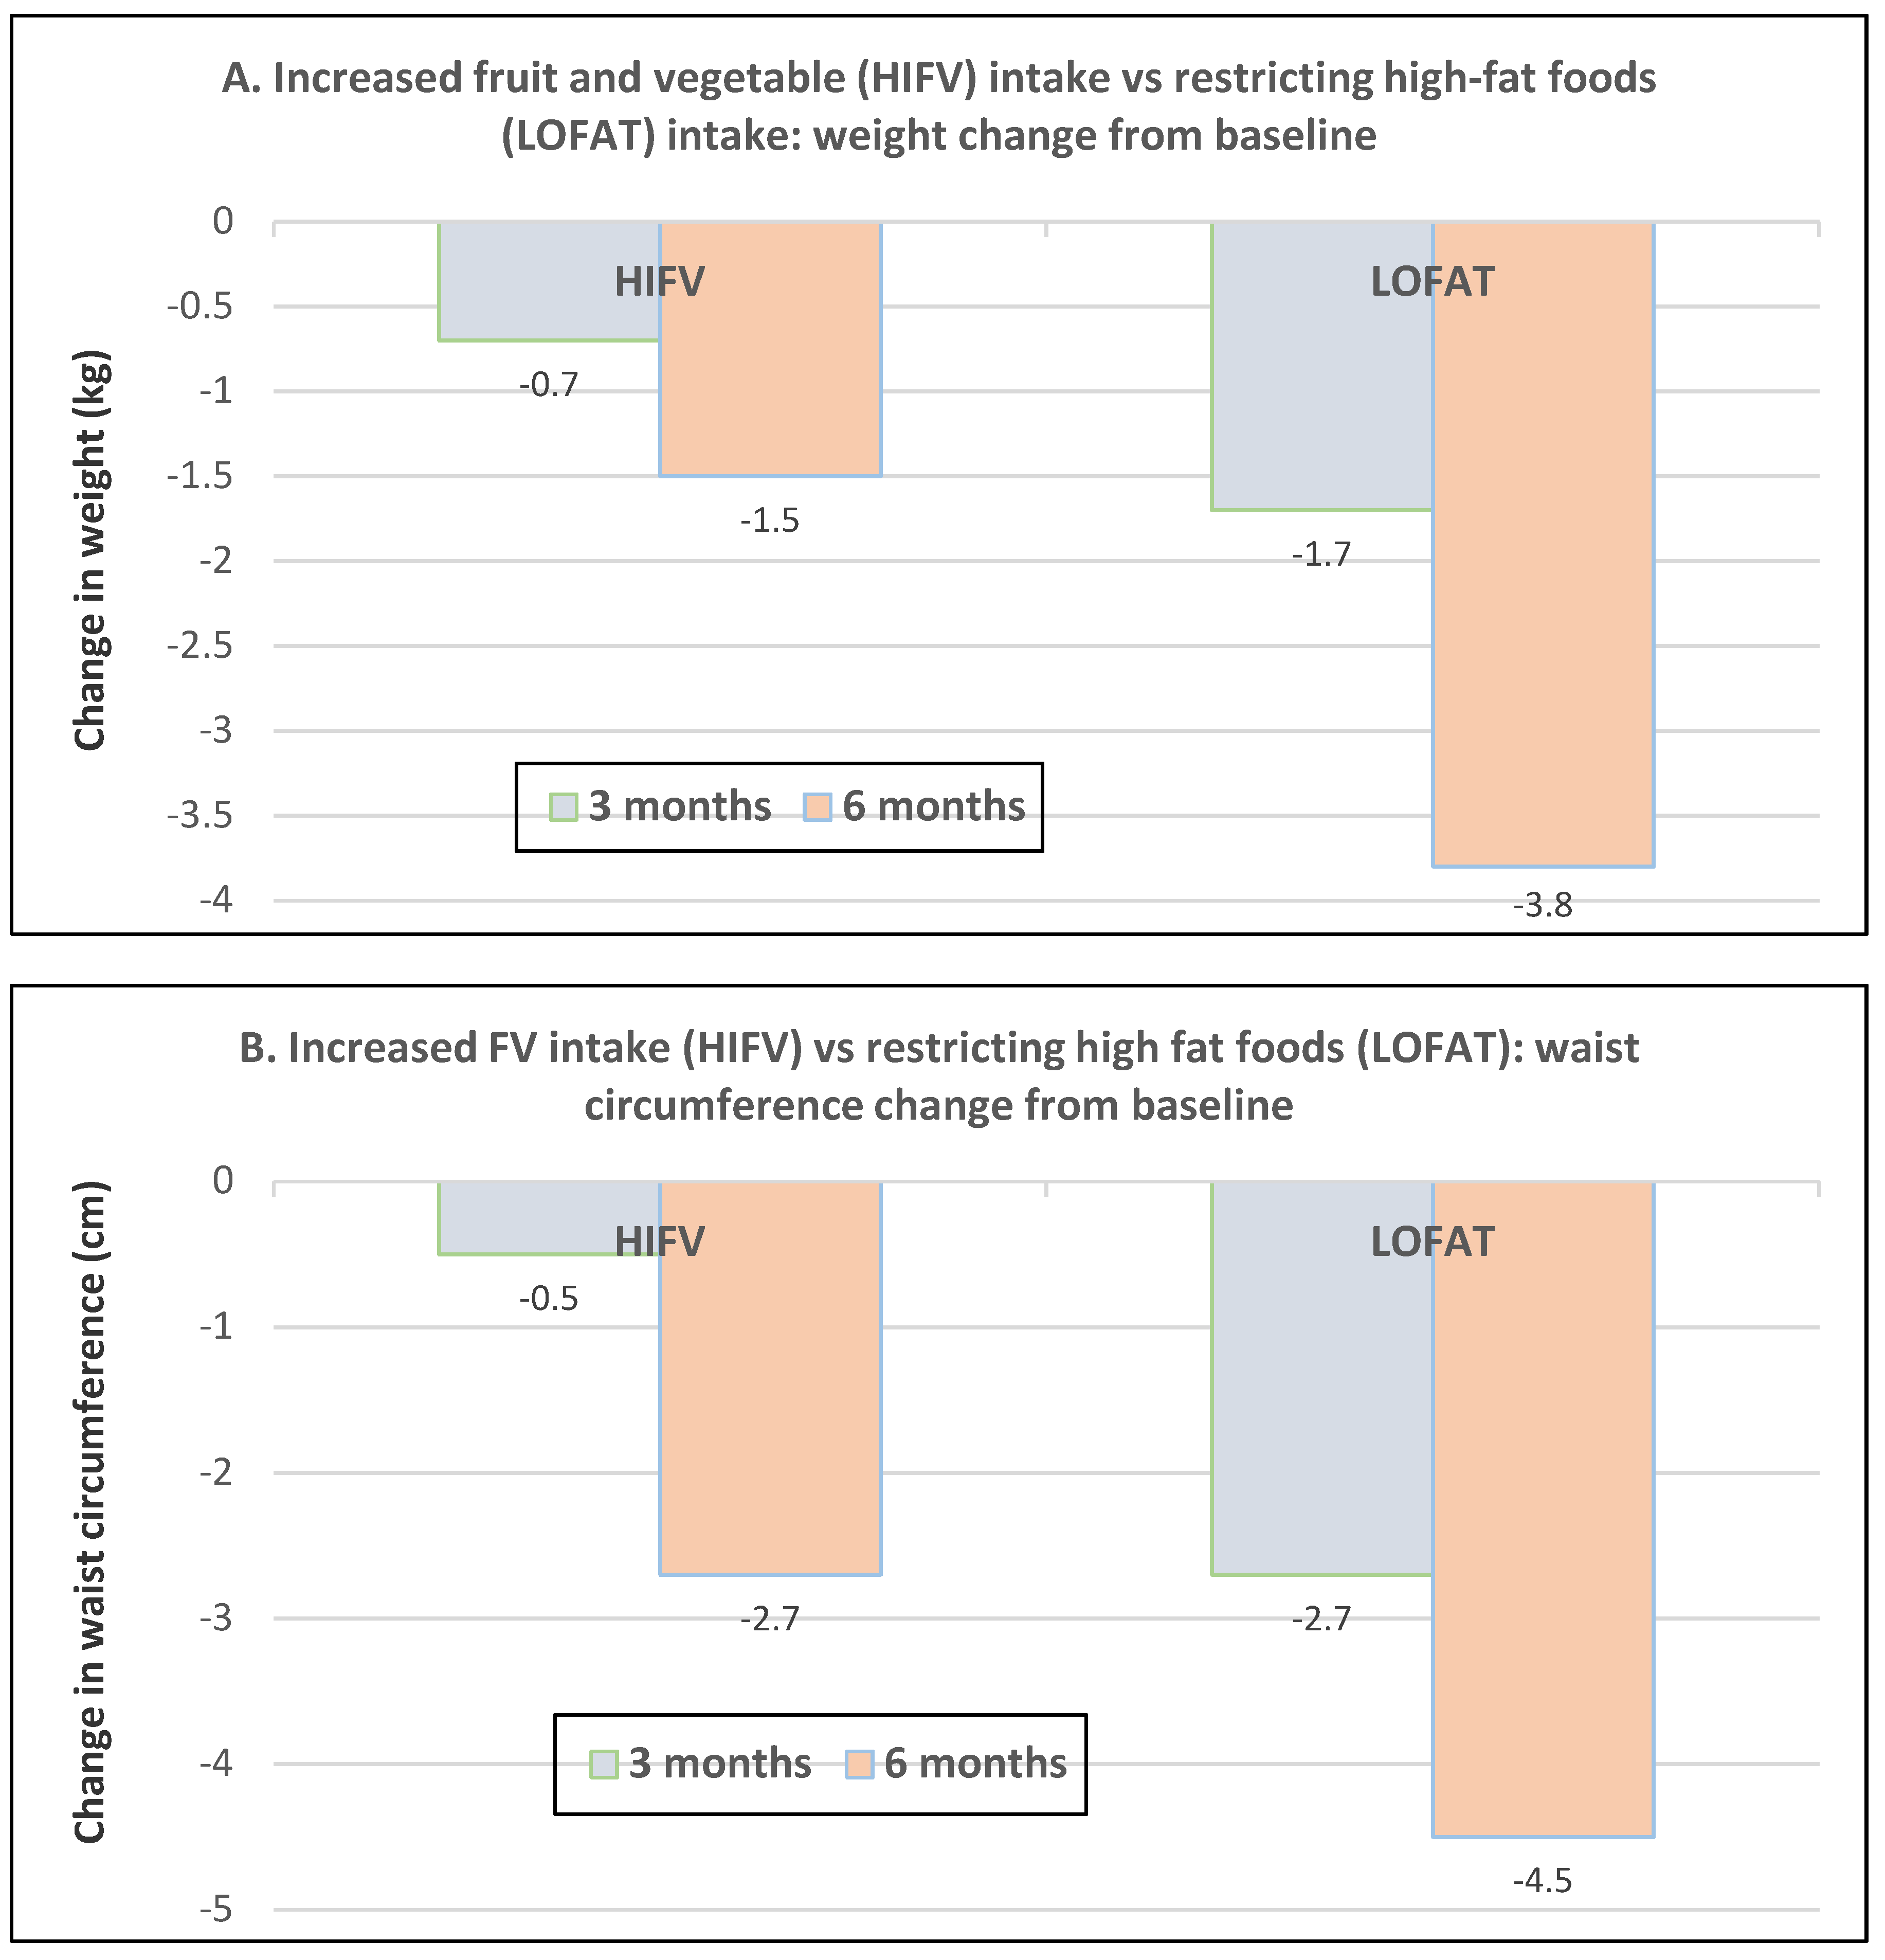
- Postmenopausal women—dietary approach #1—unrestricted messaging to increase FV intake vs. messaging to restrict high-fat foods. Sixty-eight overweight and obese women (mean age 57 years) consuming high FV (HIFV) or reducing consumption of high-fat foods (LOFAT) had significantly lower weight and WC after six months compared to baseline, but the reduced intake of high-fat foods lowered body weight considerably more than the high FV diet (Figure 16A,B) [52]. In the HIFV group, ED was shown to be an independent predictor of weight loss.
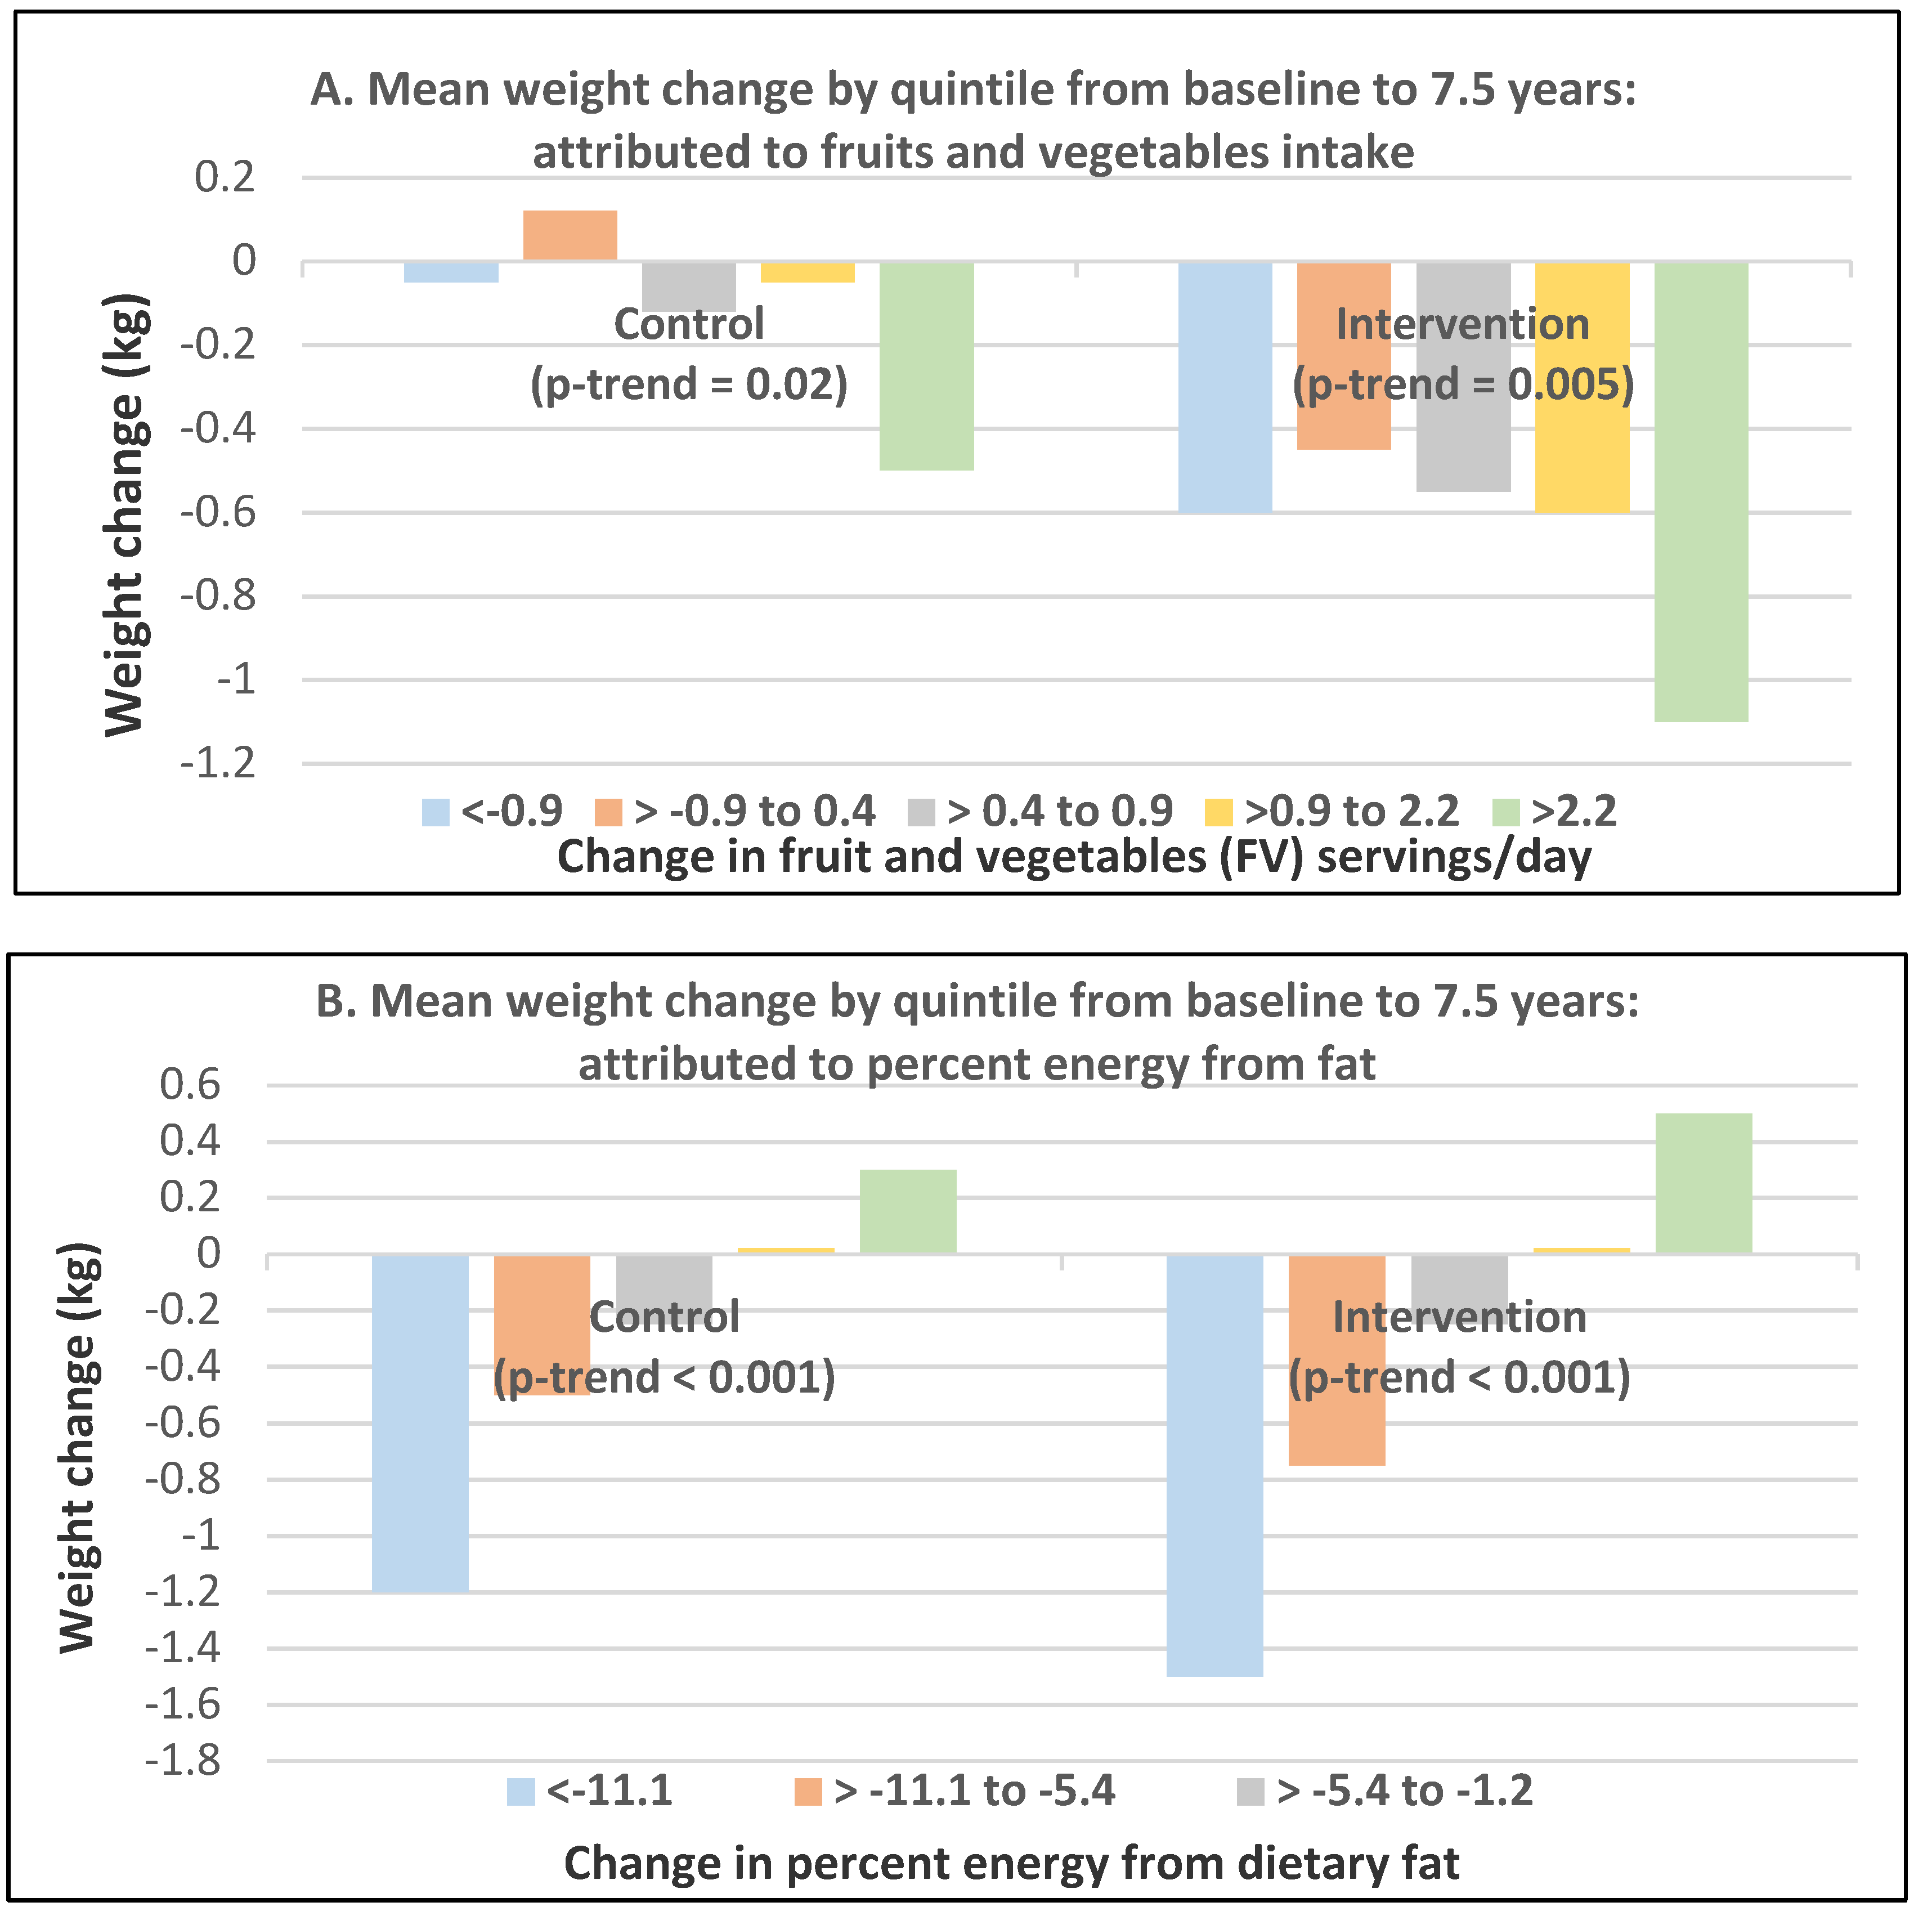
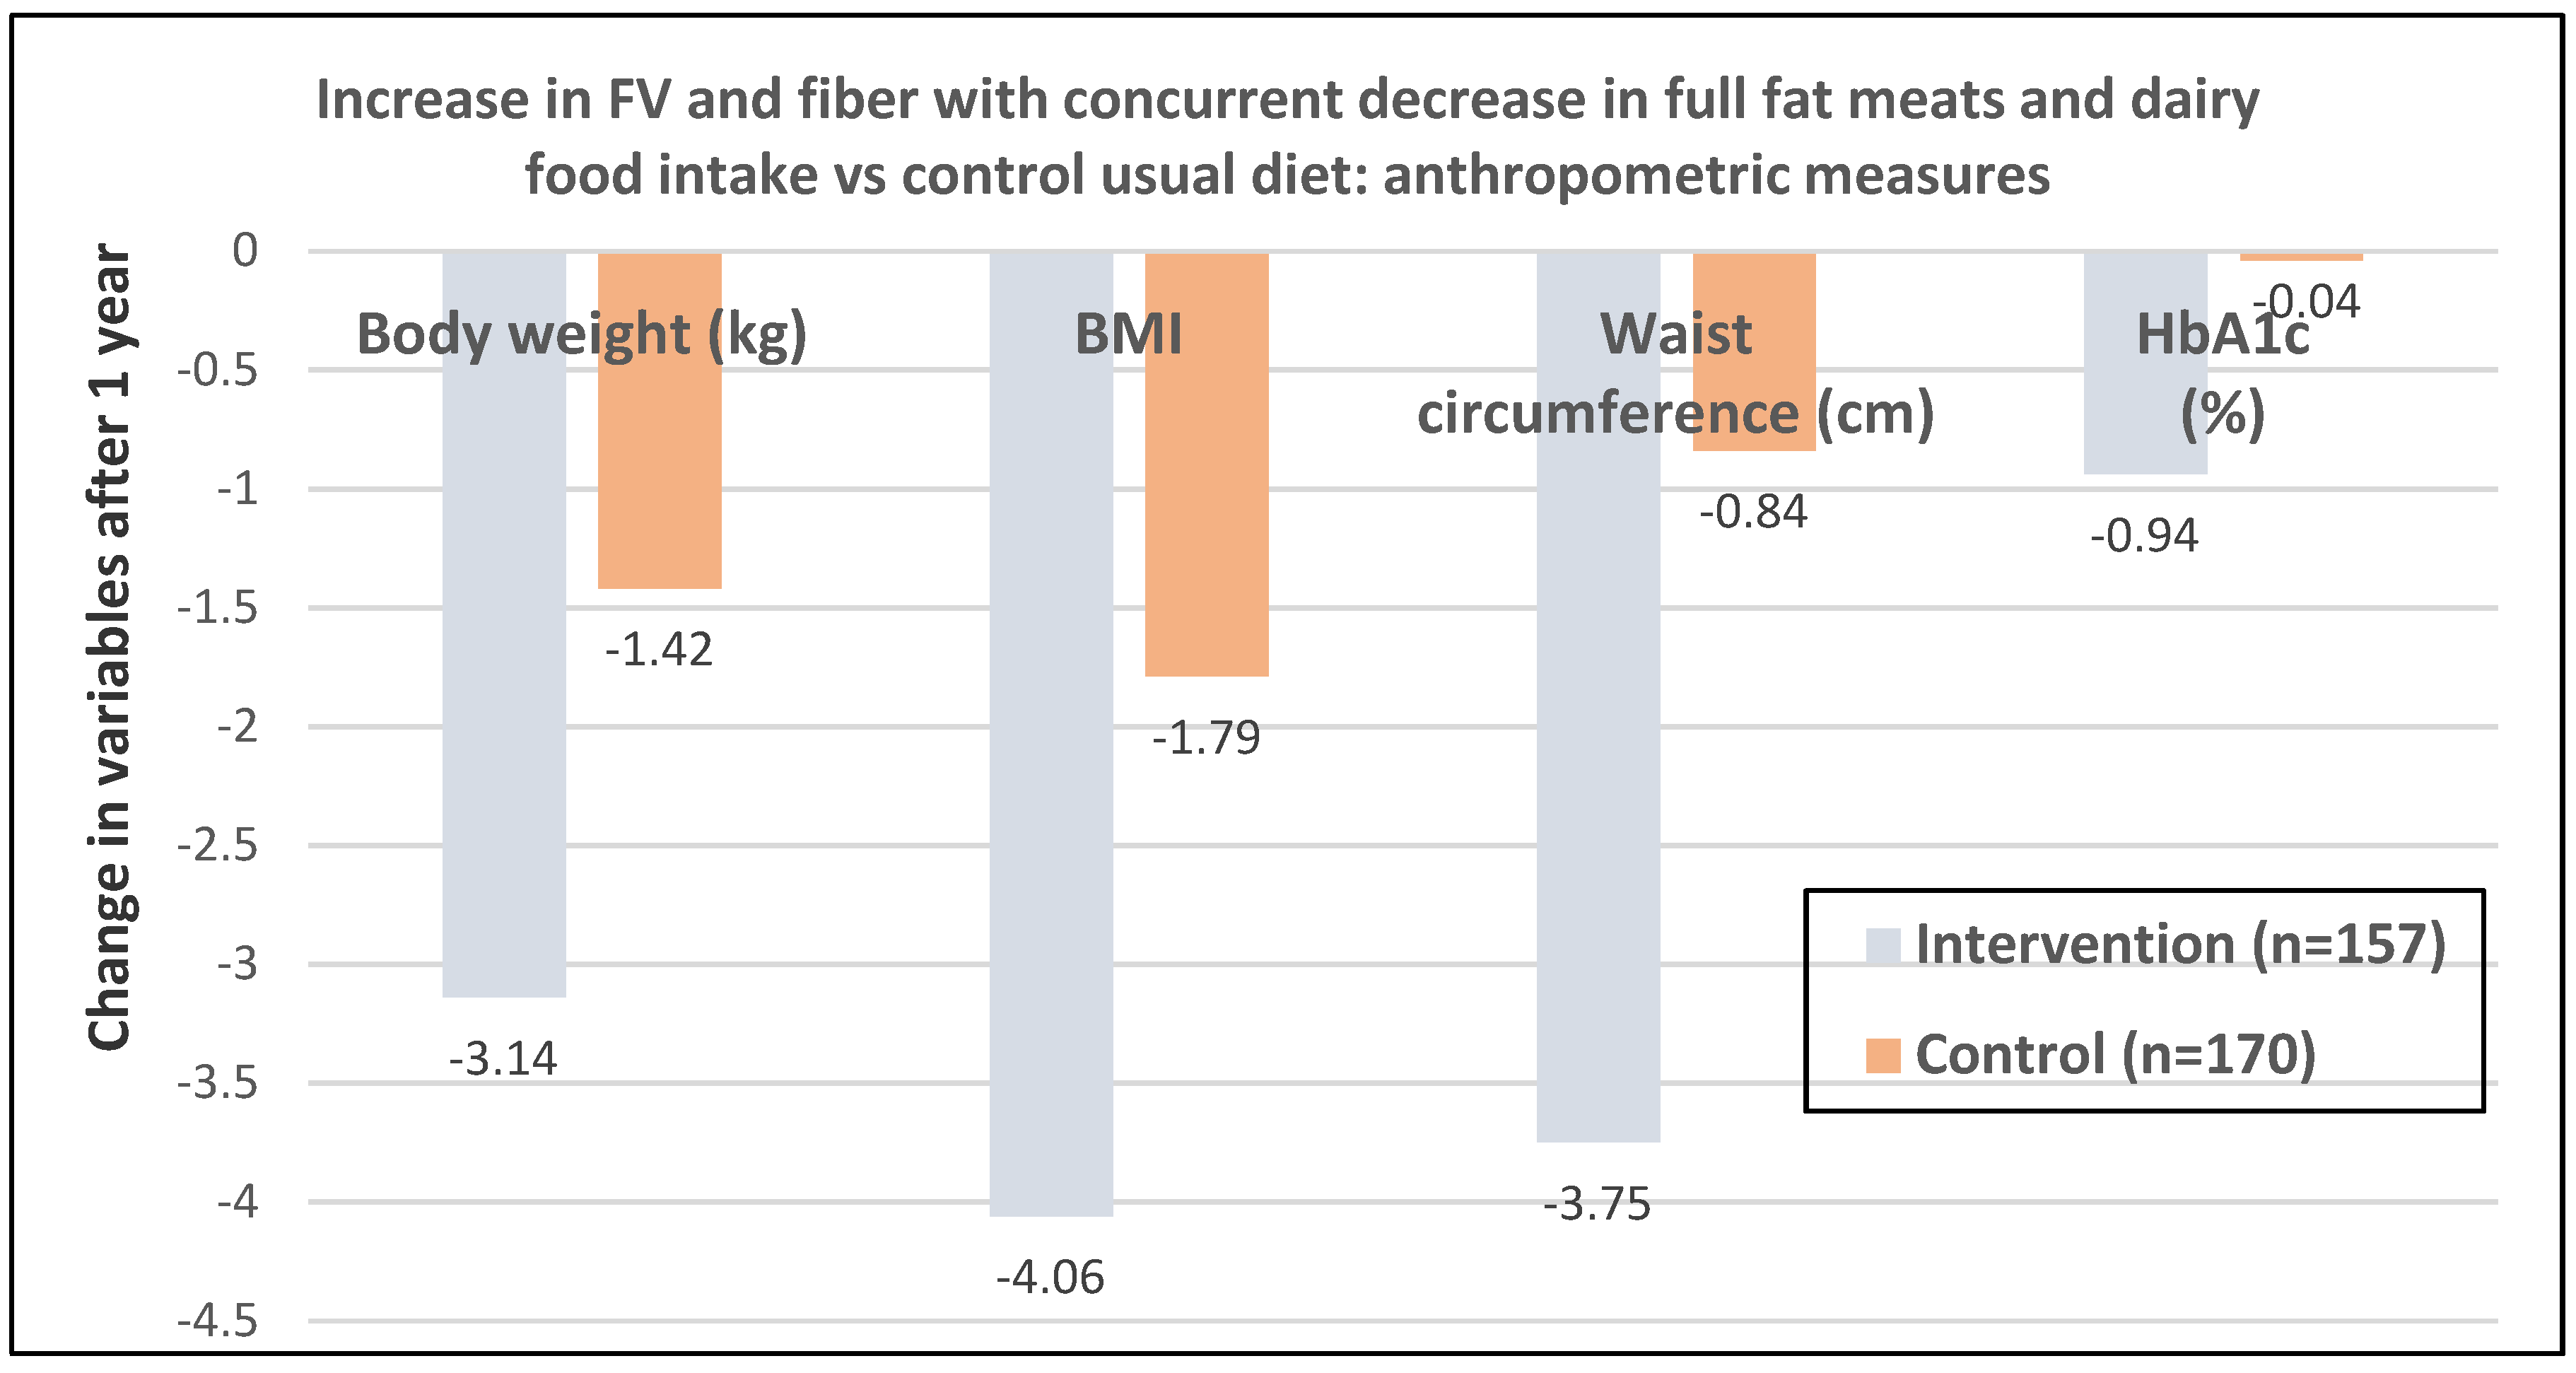
- Postmenopausal women—dietary approach #2—active guidance to increase FV intake vs. passive information on general health goals. In US Women’s Healthy Eating and Living (WHEL) Study, 2718 overweight breast cancer women survivors (mean baseline age 53 years) asked in the active guidance group to increase FV intake and lower ED by 25% had weight loss of −0.05 ± 0.12 kg compared to those with passive, general health information guidance who increased weight by 0.71 ± 0.11 kg after one year [54]. However, after four years, the difference in weight between groups was no longer significant. In a Brazilian RCT of 80 adults (76% women; mean age 47 years and BMI of 29), those who increased FV by 109 ± 320 g/day, including 2.9 ± 5.9 g/day FV fiber, decreased weight by −1.4 ± 2.6 kg and BMI by −0.49 ± 1.06 kg/m2 (p < 0.05) vs. no significant reductions for controls compared to baseline weight after 6 months [55]. An increase of 100 g/day of FV reduced body weight by 500 g and 300 g after six months. The US Women’s Health Initiative Dietary Modification Trial of 48,835 overweight postmenopausal women (mean baseline age 62 years and BMI of 29) intervention included group and individual sessions to encourage reductions in fat intake and increases in FV and grain consumption without adding weight loss or caloric restriction goals [56]. The control group received diet-related education materials. The intervention group women lost weight in the first year (mean of 2.2 kg, p < 0.001) and maintained lower weight than control women during 7.5 years of follow-up (difference, 1.9 kg (<0.001 at one year) and 0.4 kg p = 0.01 at 7.5 years). Greater weight loss was associated with an increase in FV servings or a lower intake of % of energy from fat over 7.5 years follow-up. Increasing FV intake showed a significant trend in both groups for more weight loss compared to baseline (Figure 18A). Decreasing percent energy from fat was associated in both groups with more weight loss from baseline (Figure 18B). Also, increasing fiber showed a significant trend toward more weight loss in the intervention women but not in the control women with an increase in fiber by greater than 5.5 g/day, resulting in approximately 1 kg less weight after 7.5 years compared to baseline body weight.
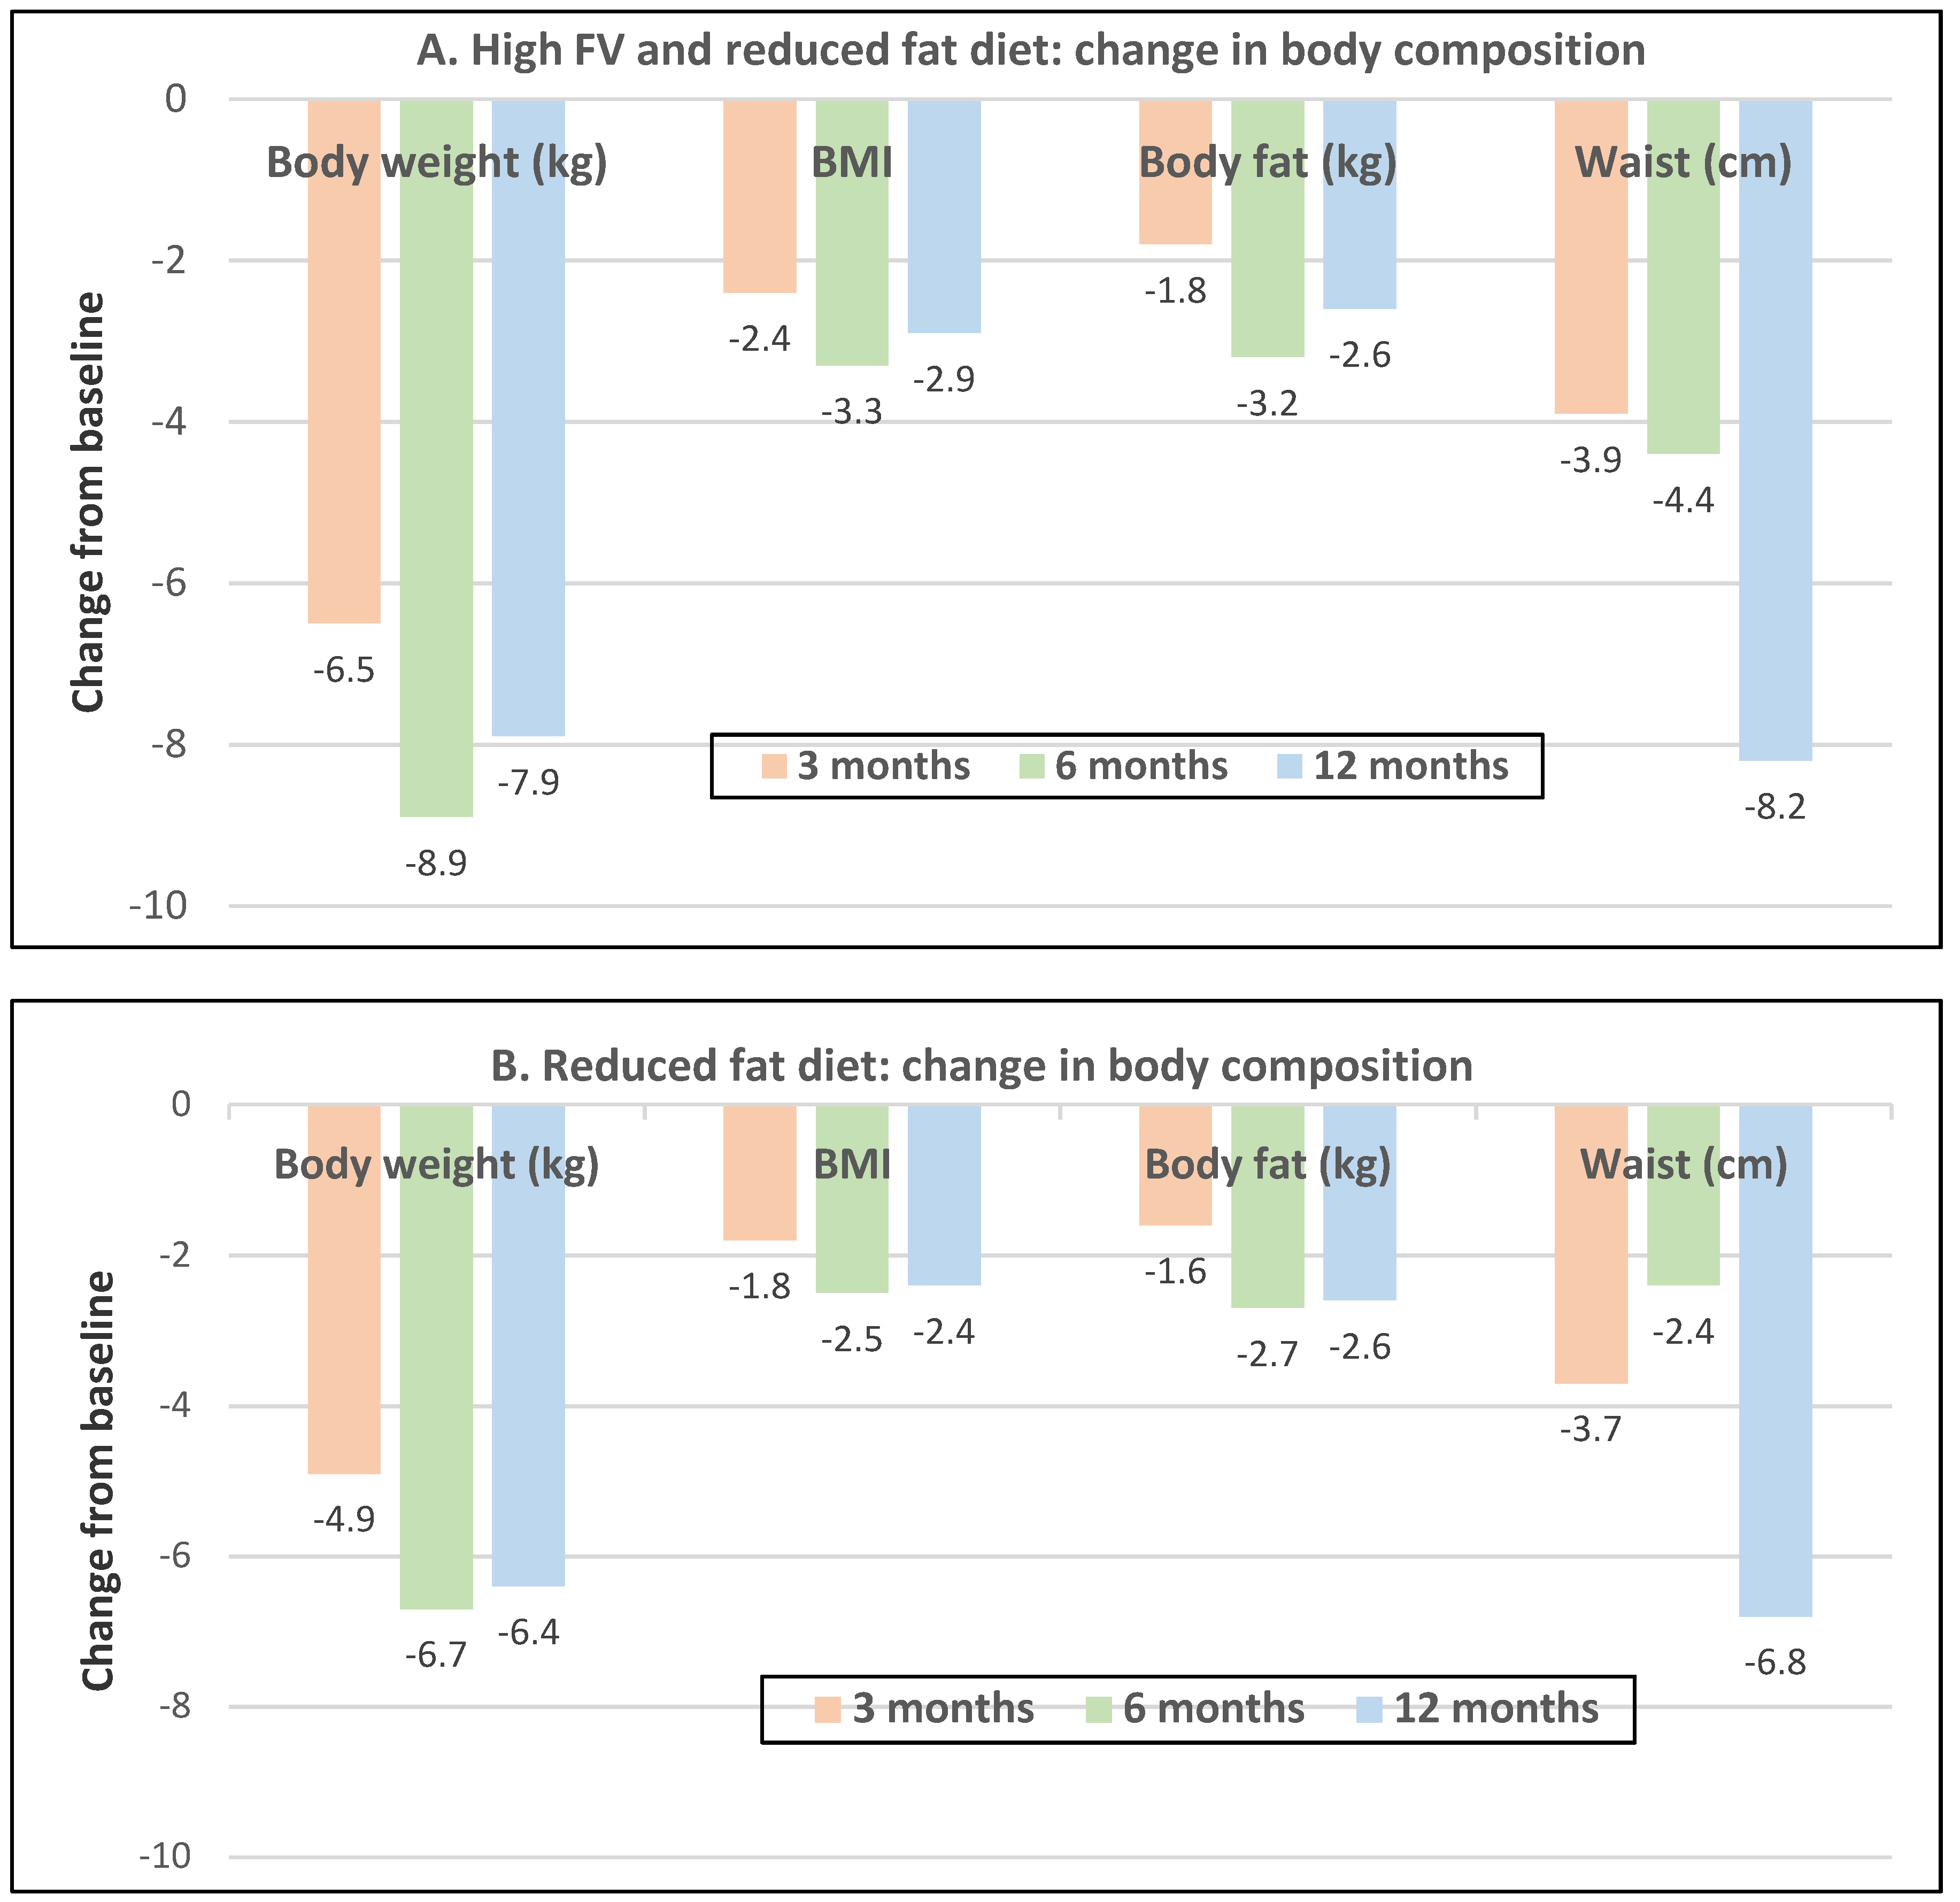
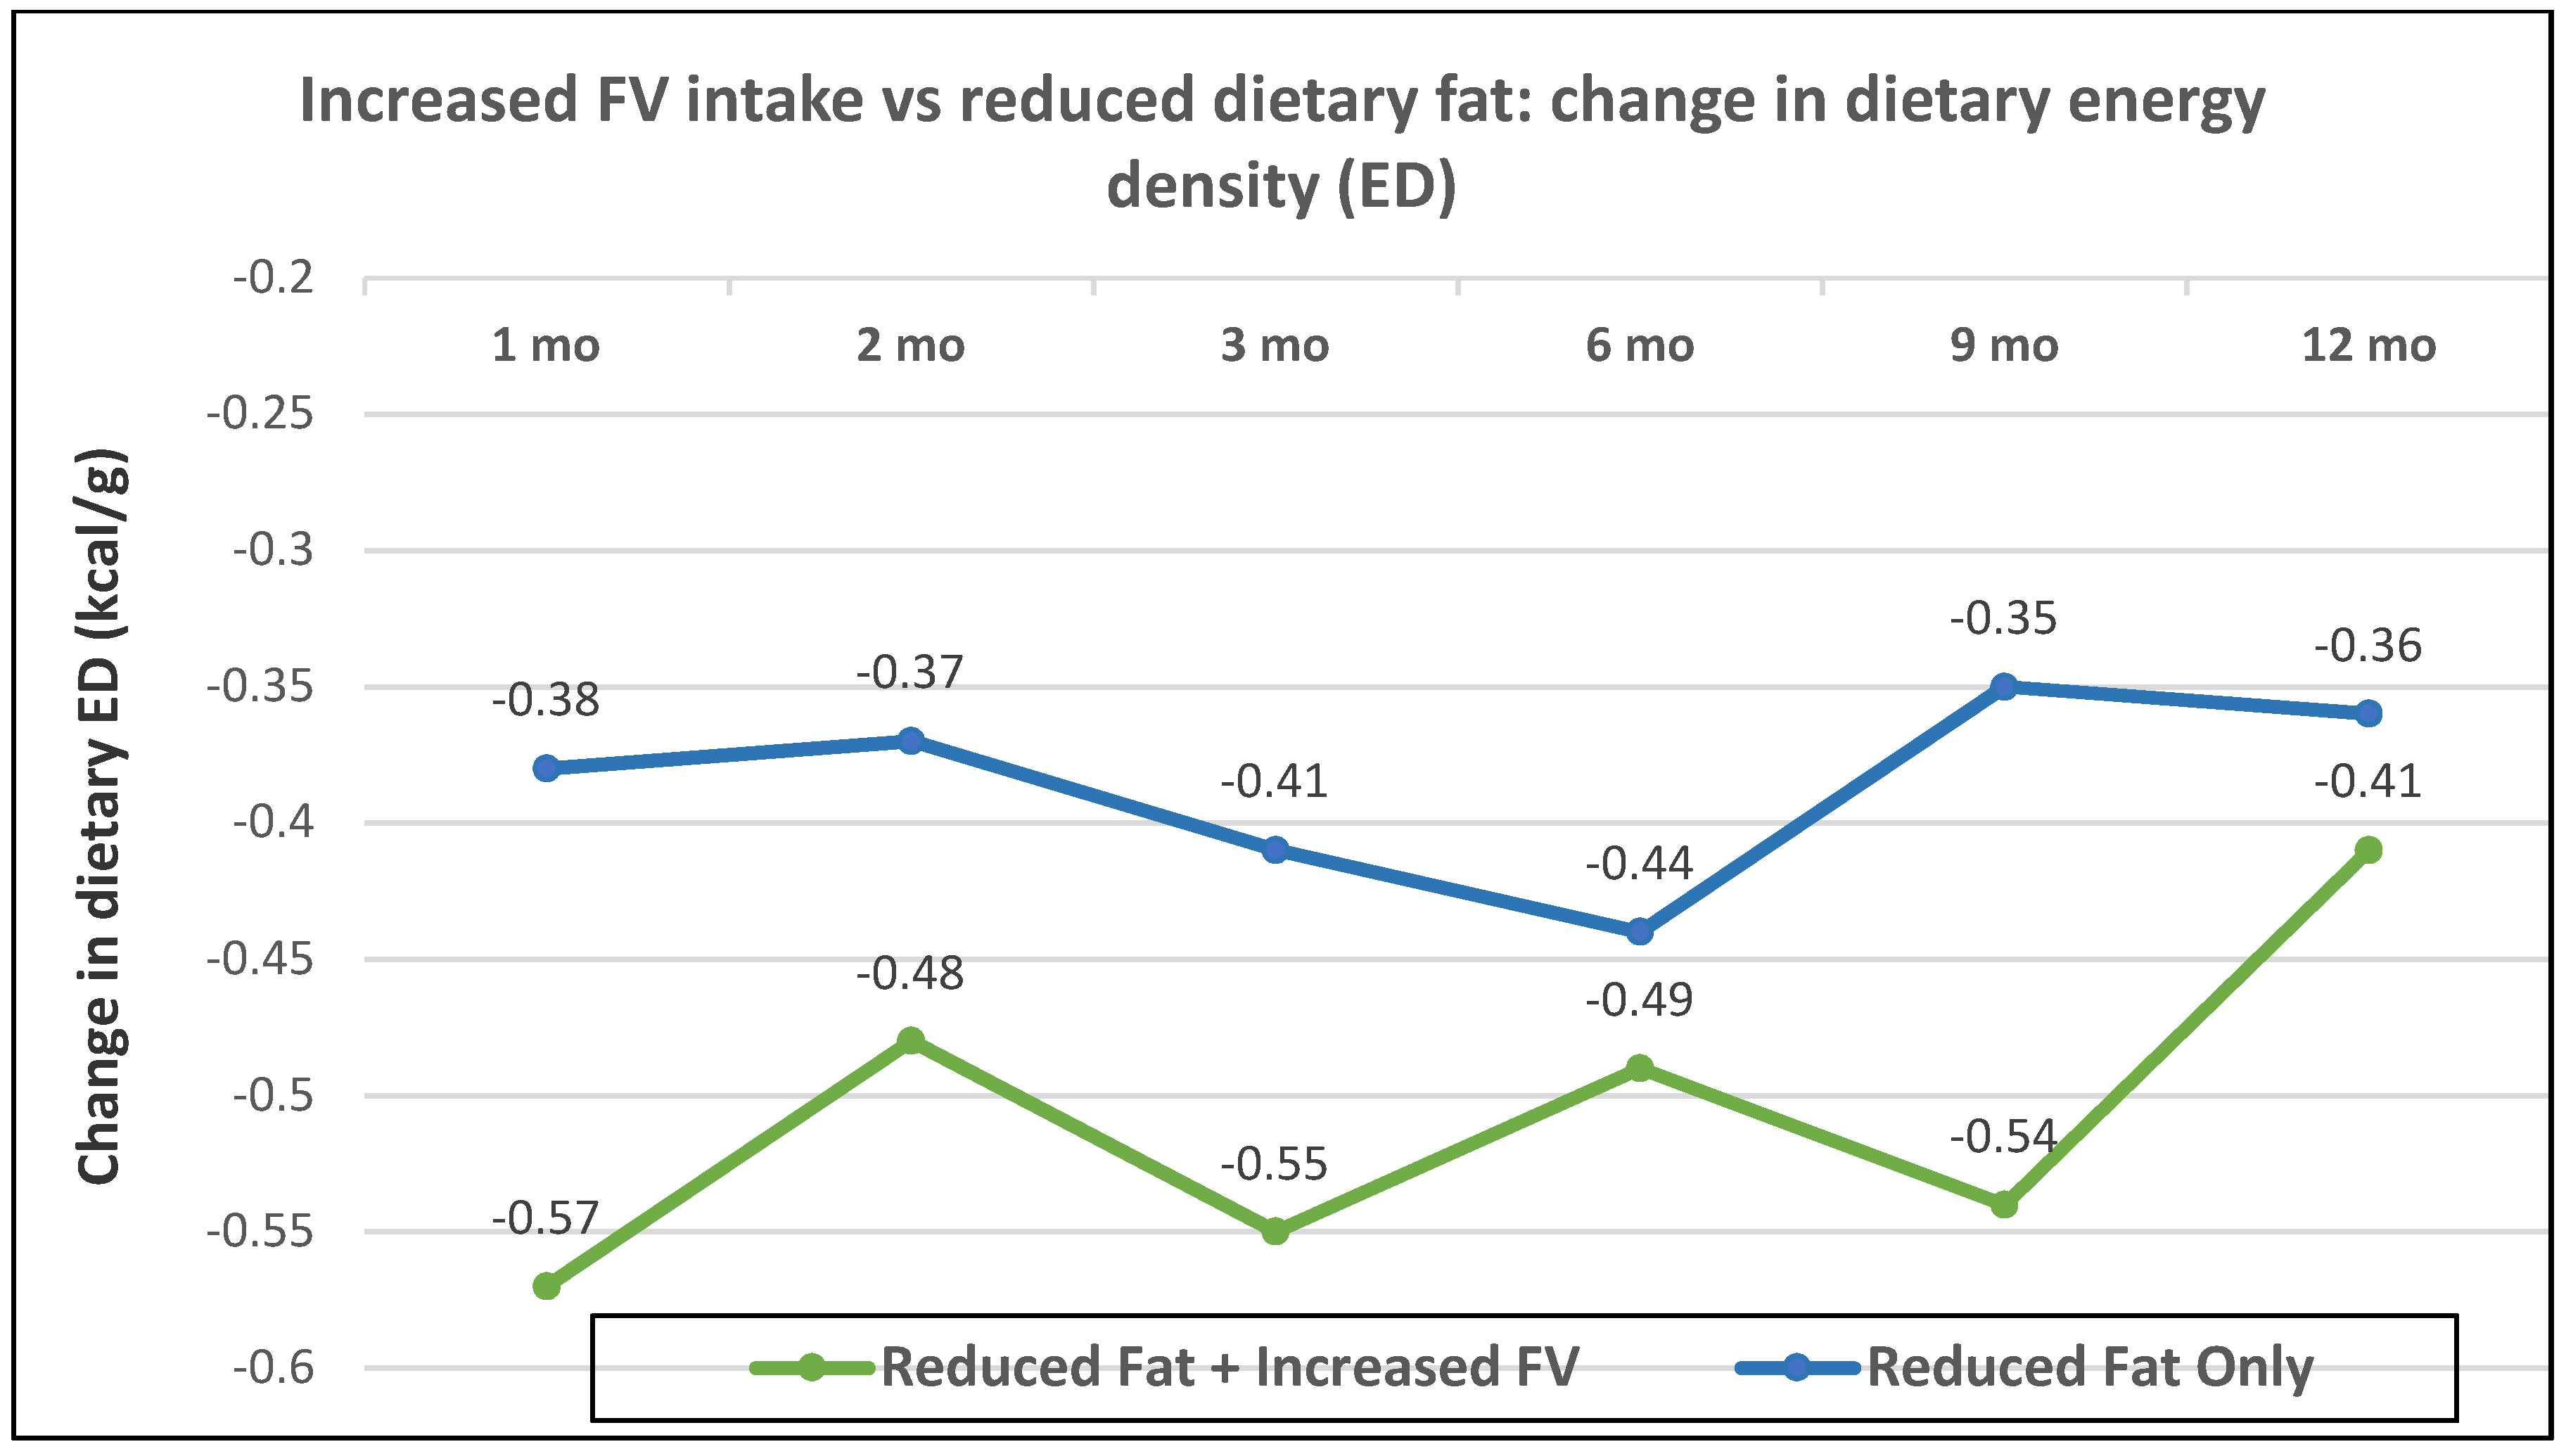
- Postmenopausal women—dietary approach #3—reduced dietary fat with and without increased FV with ad libitum amounts of food. Women in the reduced-fat plus increased FV intake group lost 1.5 kg more weight than the reduced fat and no increase in FV intake group (p = 0.002) (Figure 19A,B), which was attributed to a significantly lower dietary ED from the combination of both FV and lower fat (p = 0.019; Figure 20) [58].
- Postmenopausal women—dietary approach # 4—adding low sodium vegetable juice to Dietary Approaches to Stop Hypertension (DASH) diet. A US RCT in 81 adults (73 women; mean age 50 years) showed that adding low sodium vegetable juice to an energy-restricted DASH diet can aid in weight loss in overweight adults with metabolic syndrome [59]. Overall, in women >45 years, there is probable evidence from RCTs that increased intake of FV can lead to weight loss, especially with concurrent reductions of energy or fat-rich foods. It is also probable that increasing intake of FV alone can contribute to weight stability or modest weight loss that is similar but not as effective as weight-loss diets.
3.3.2. Secondary Study
3.3.3. Legume Vegetables
Premenopausal Women
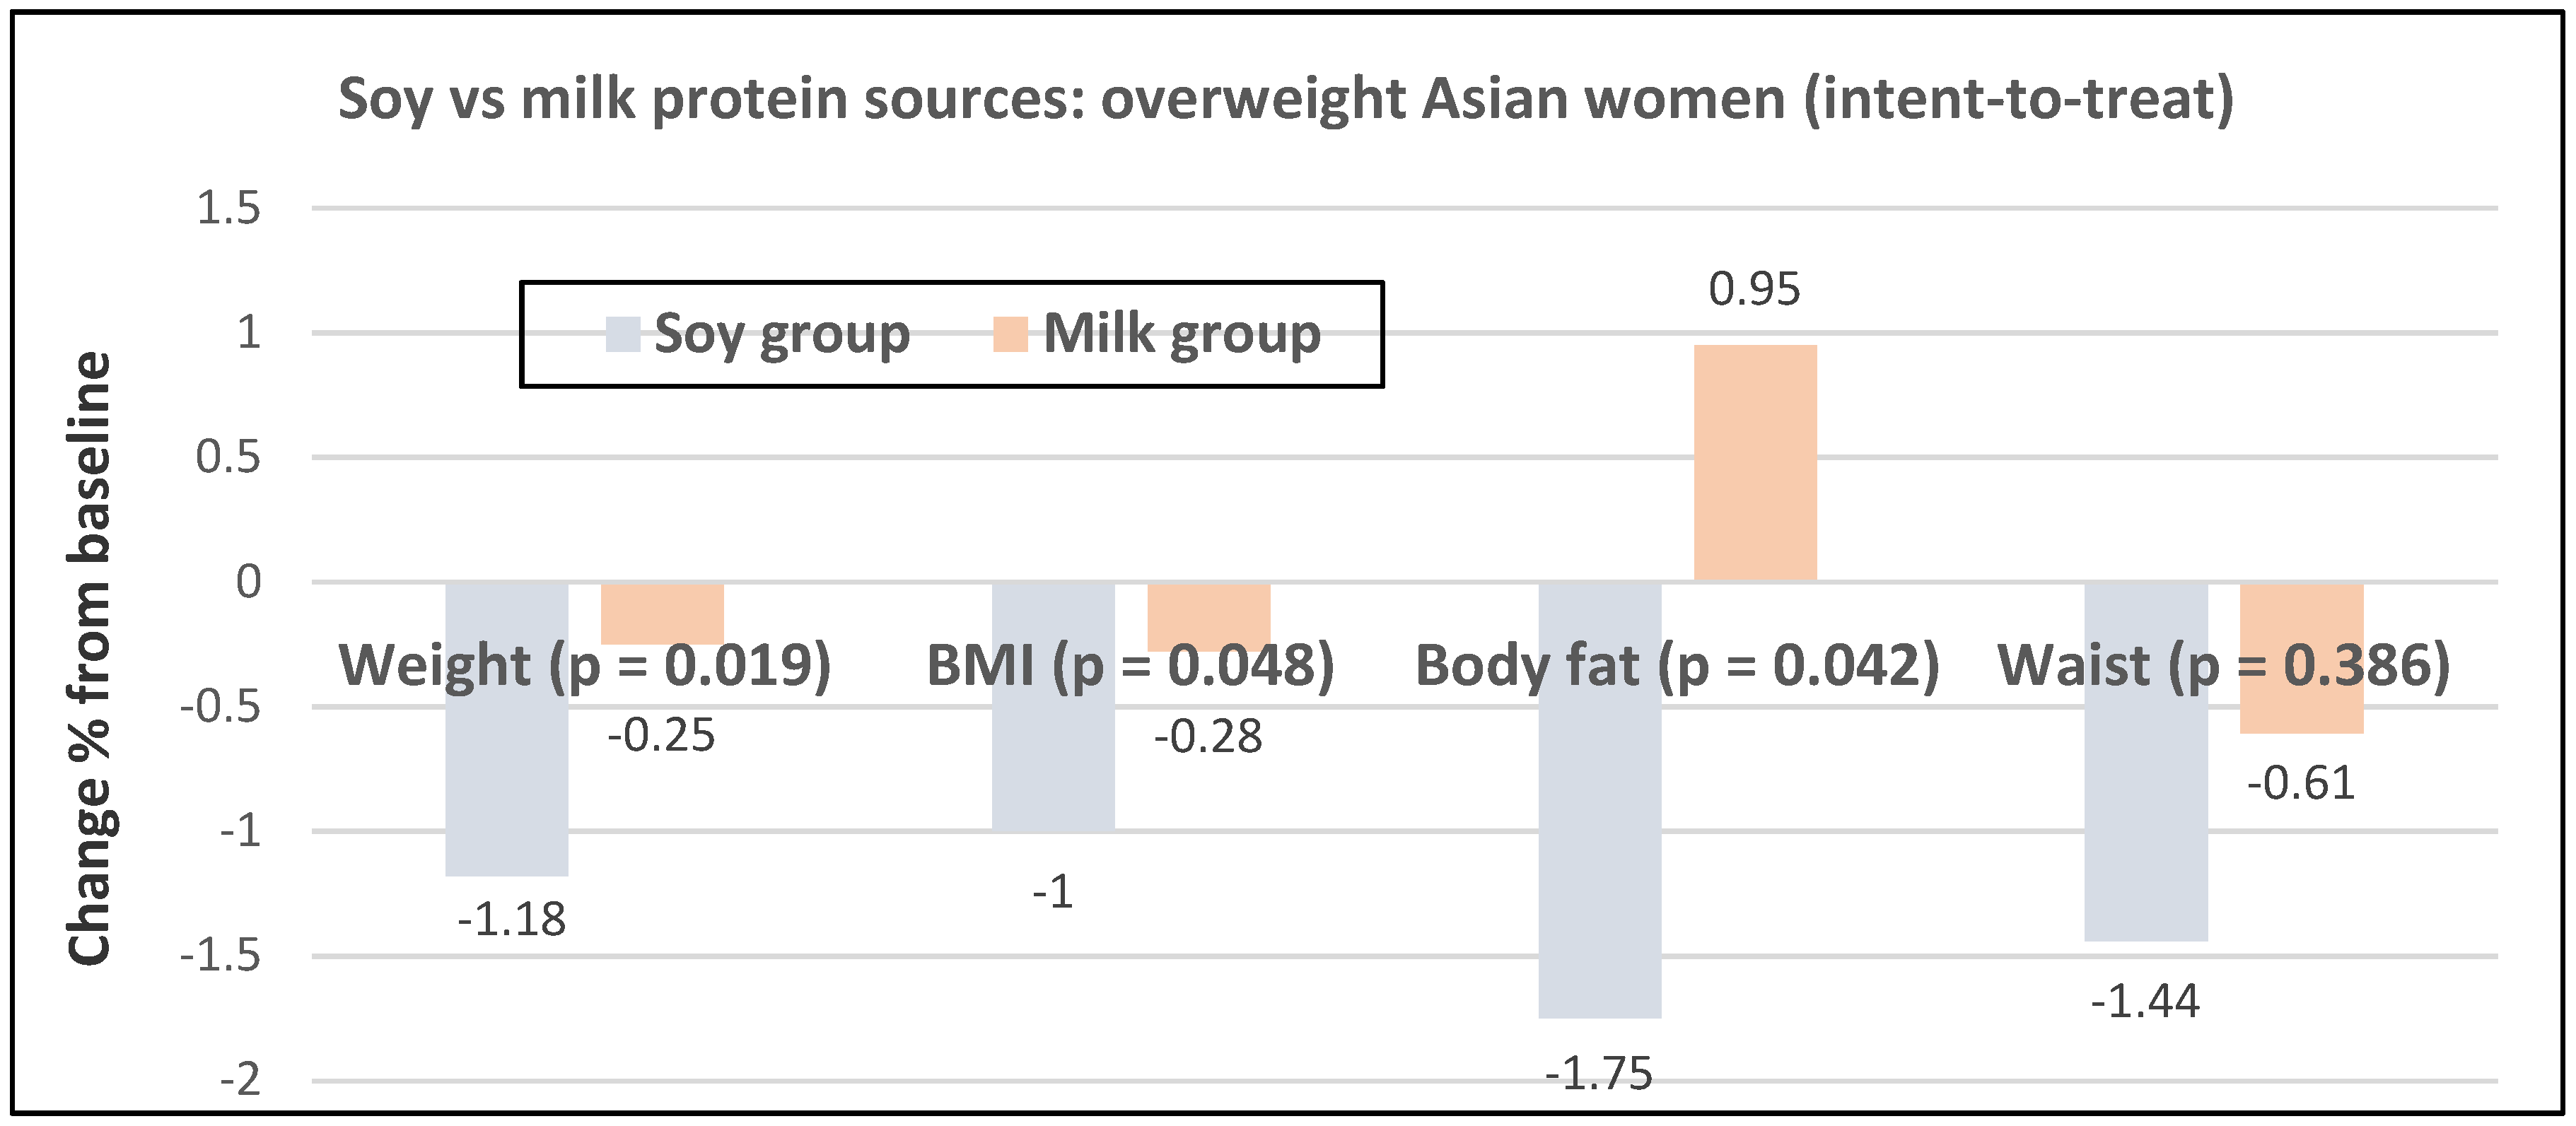
Post-Menopausal Women
3.4. Key Mechanisms Influencing Fruit and Vegetable Effects on Weight Loss
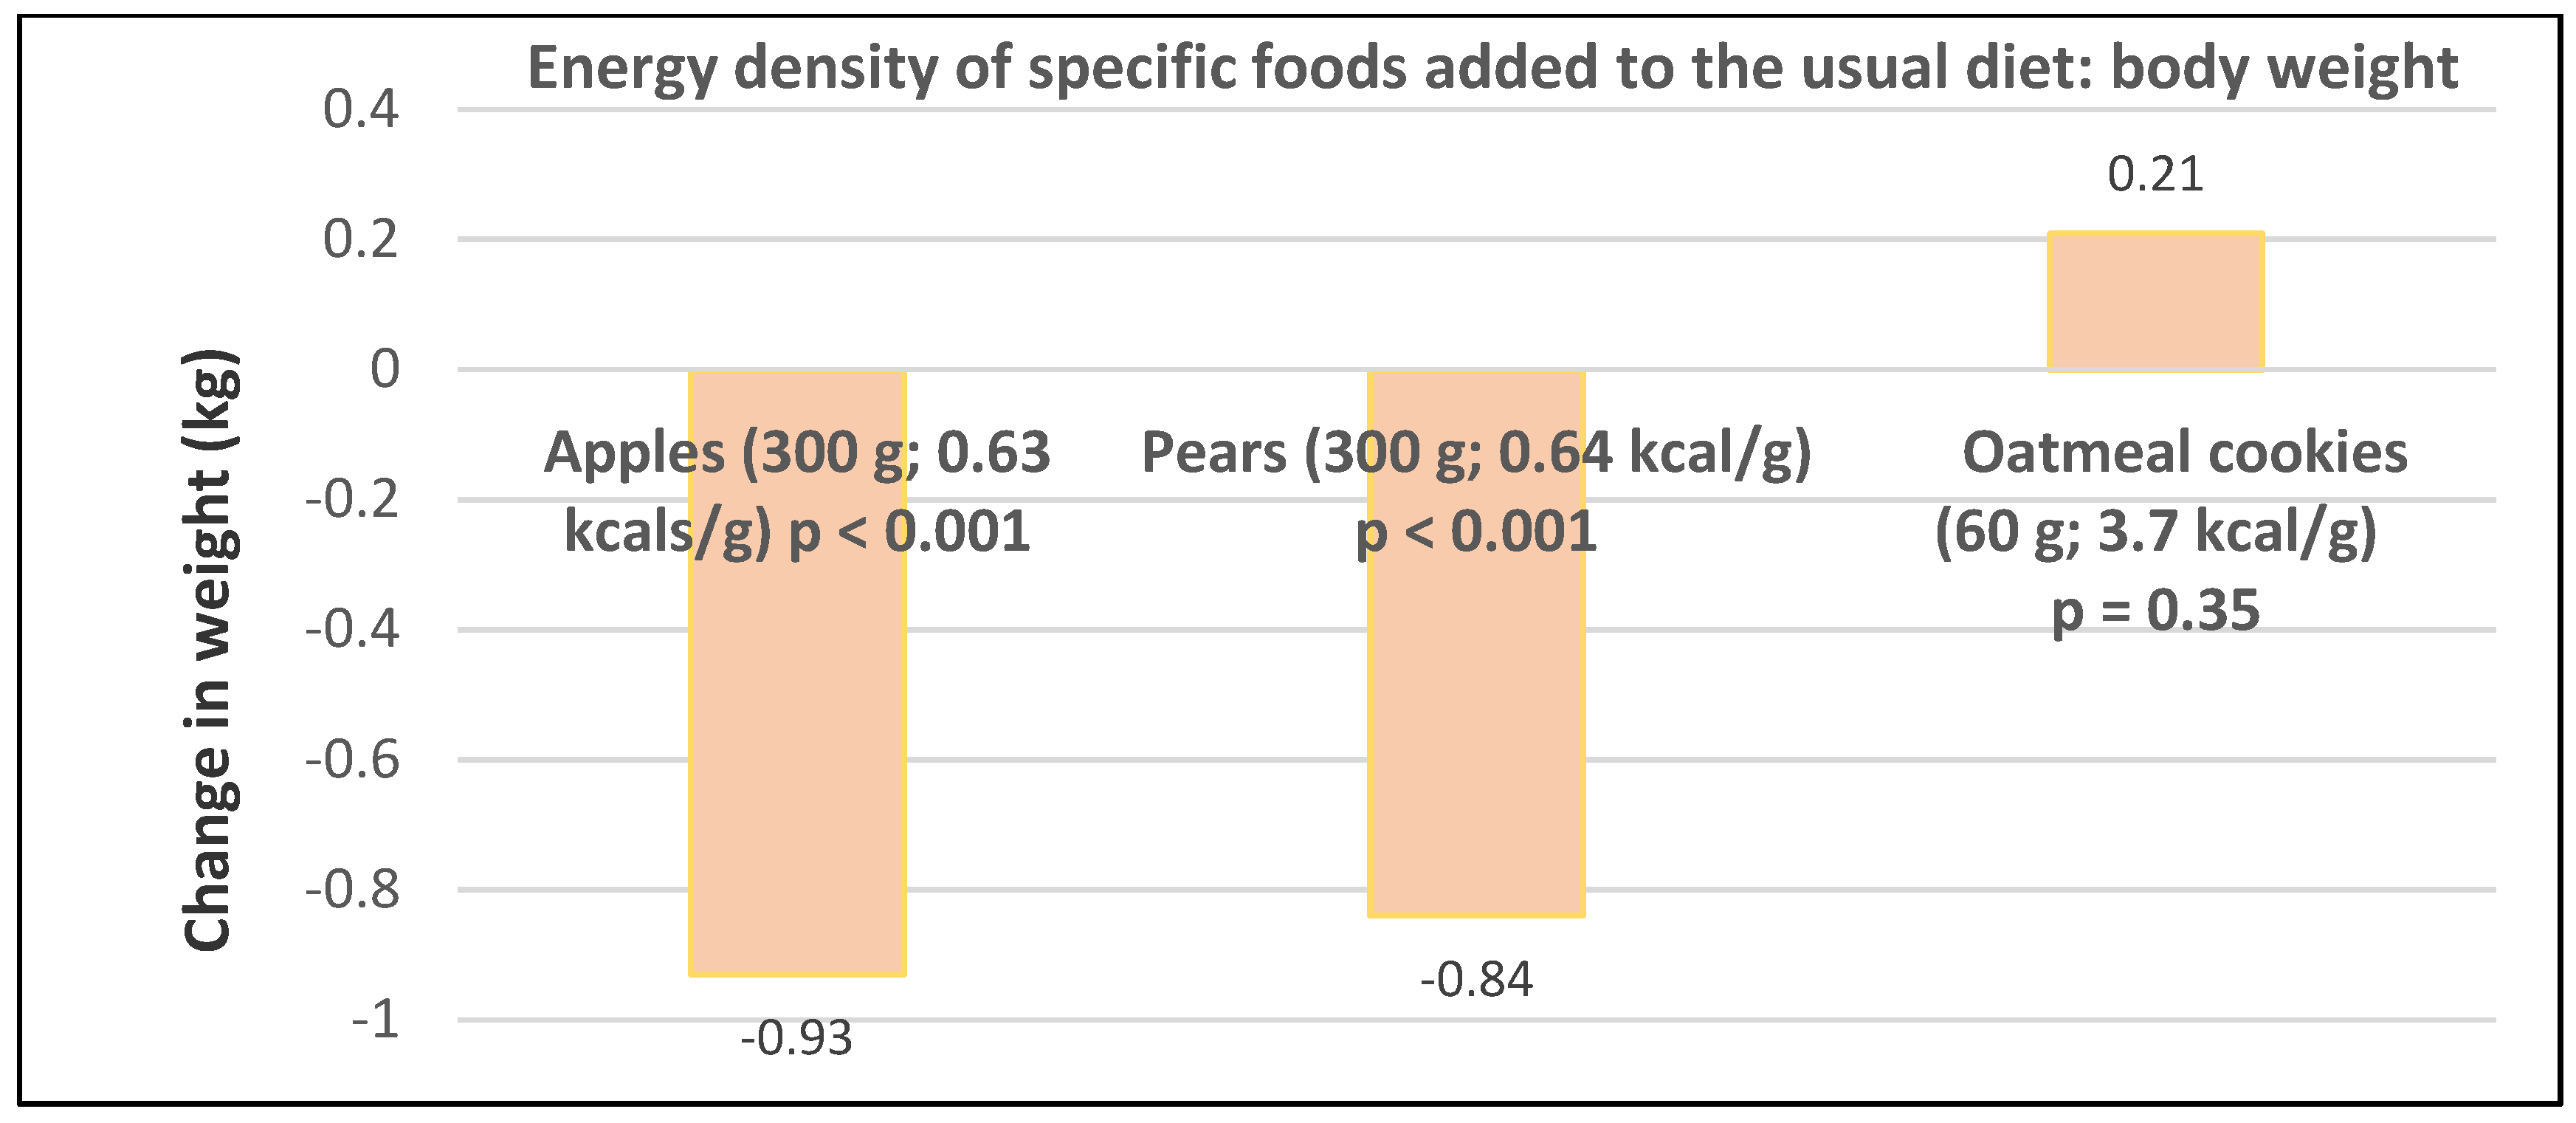
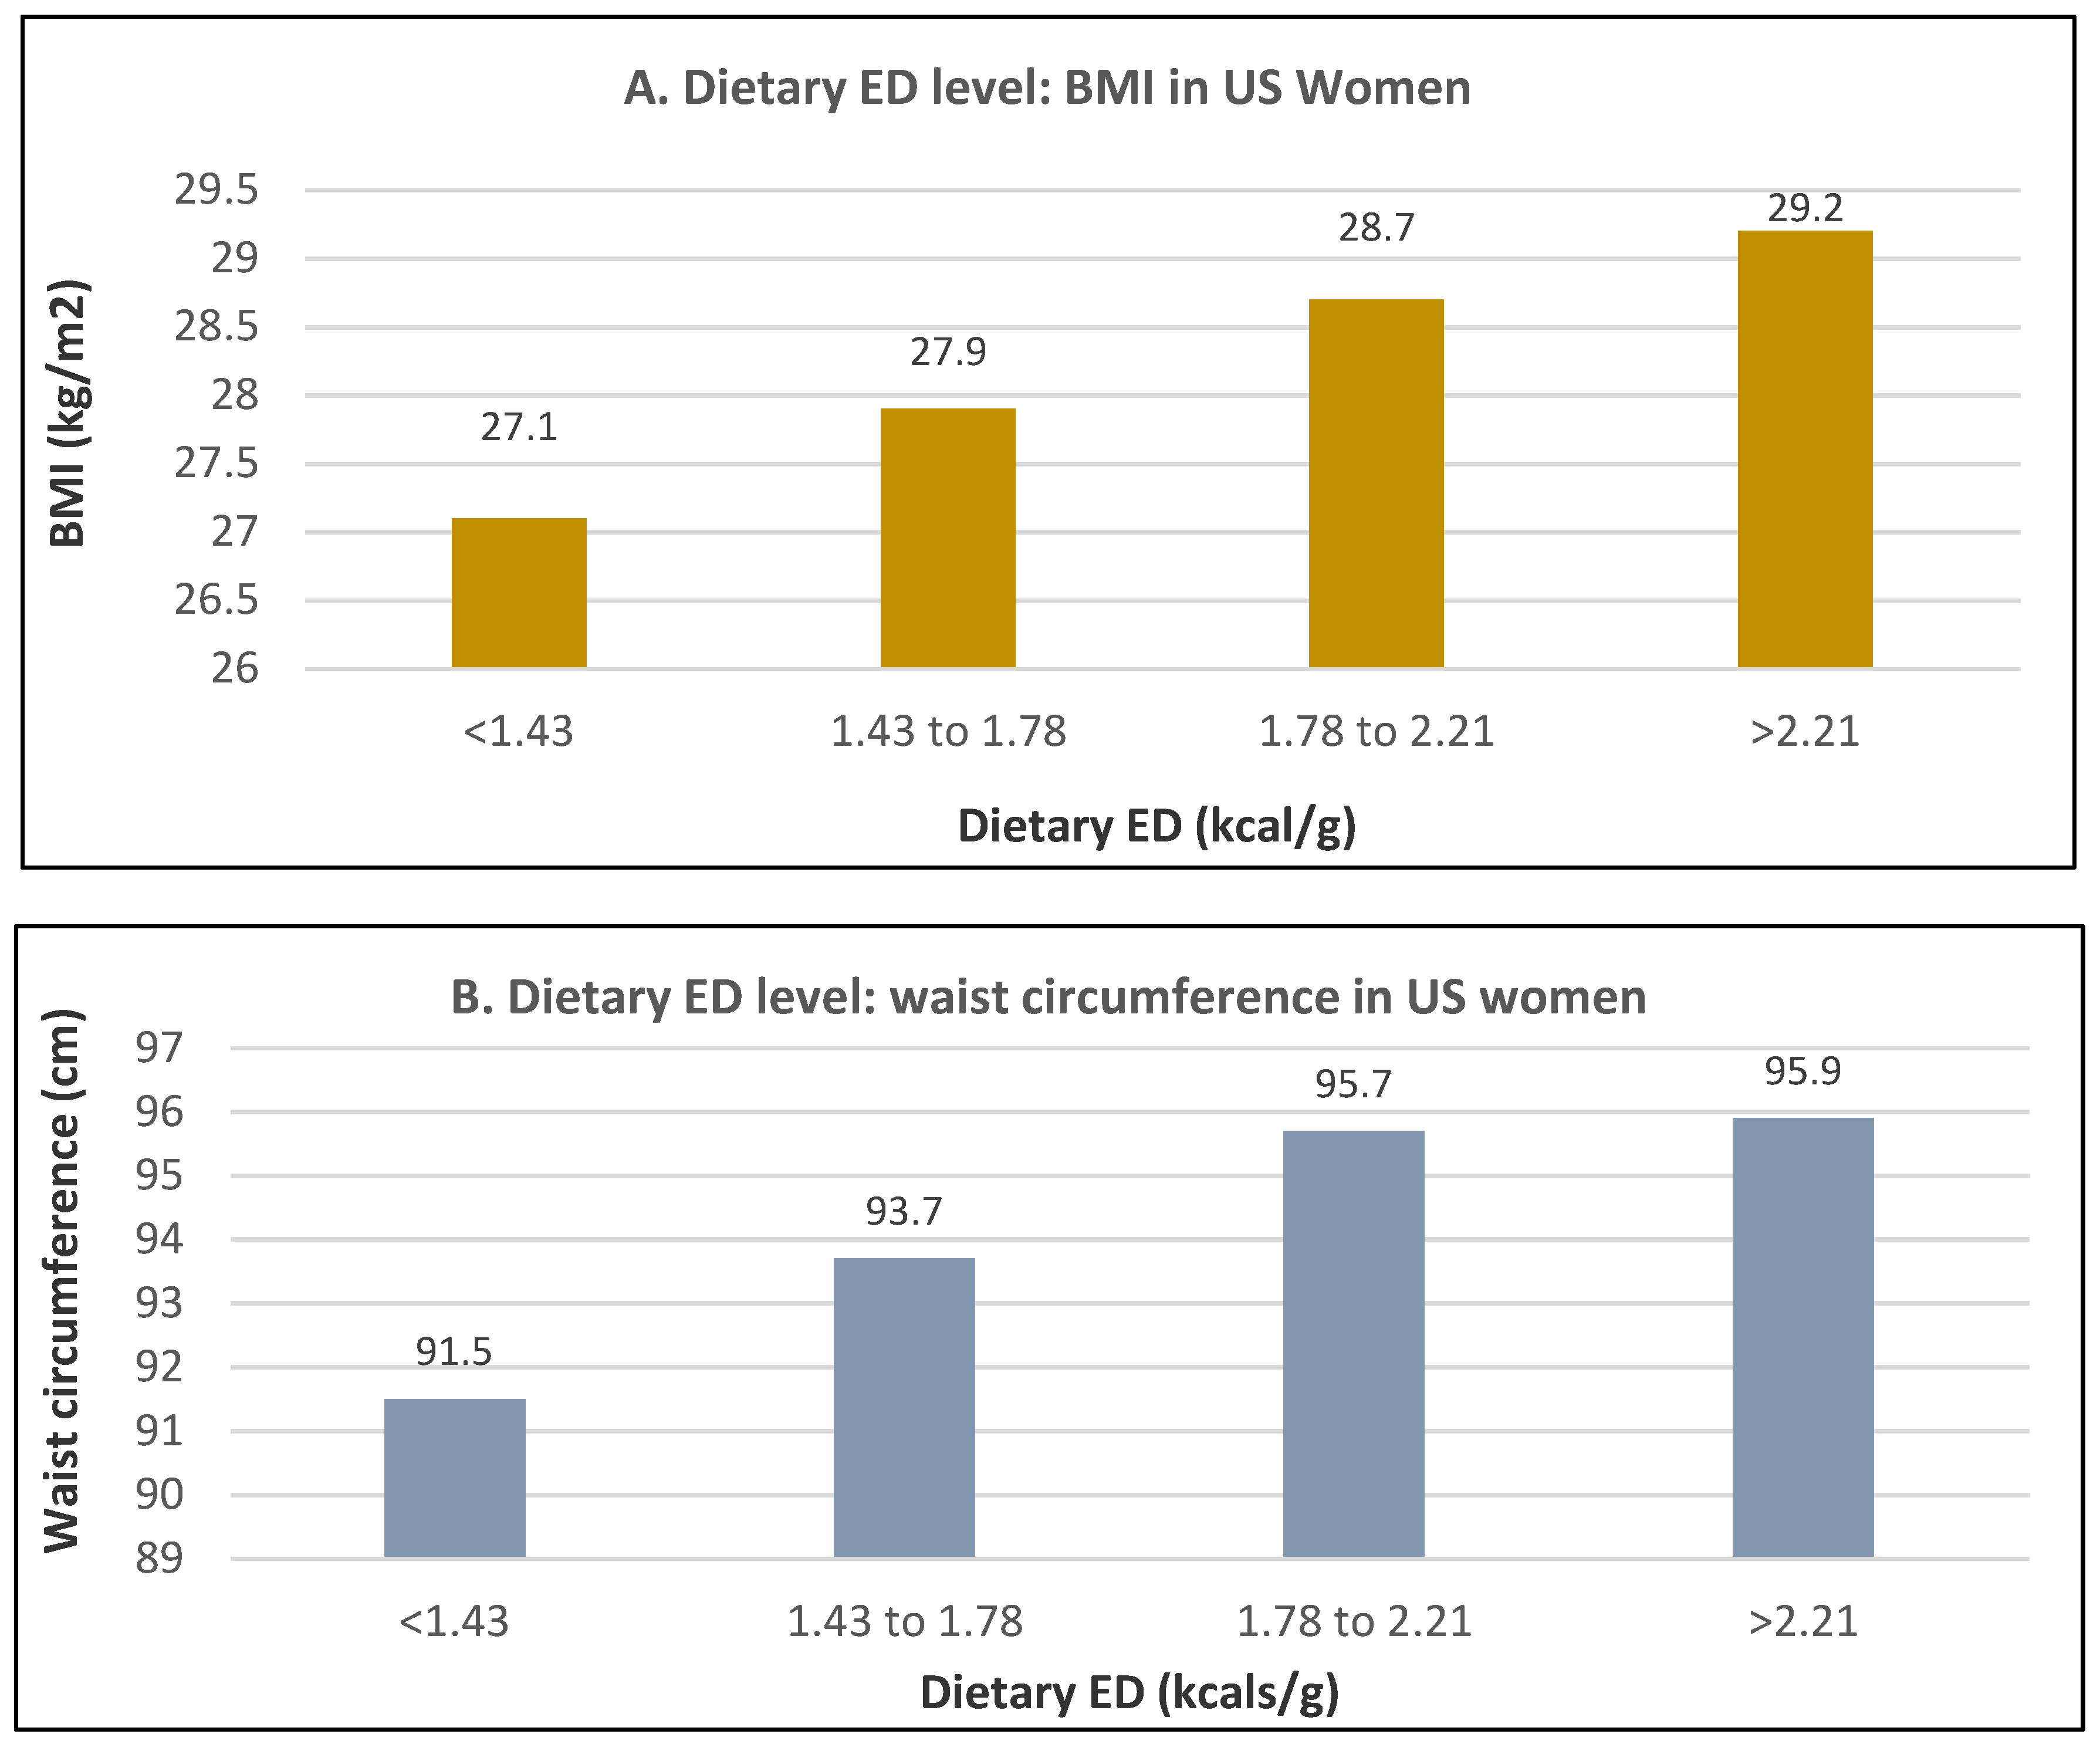
3.4.1. Dietary Energy Density (ED)
3.4.2. Glycemic Load (GL)
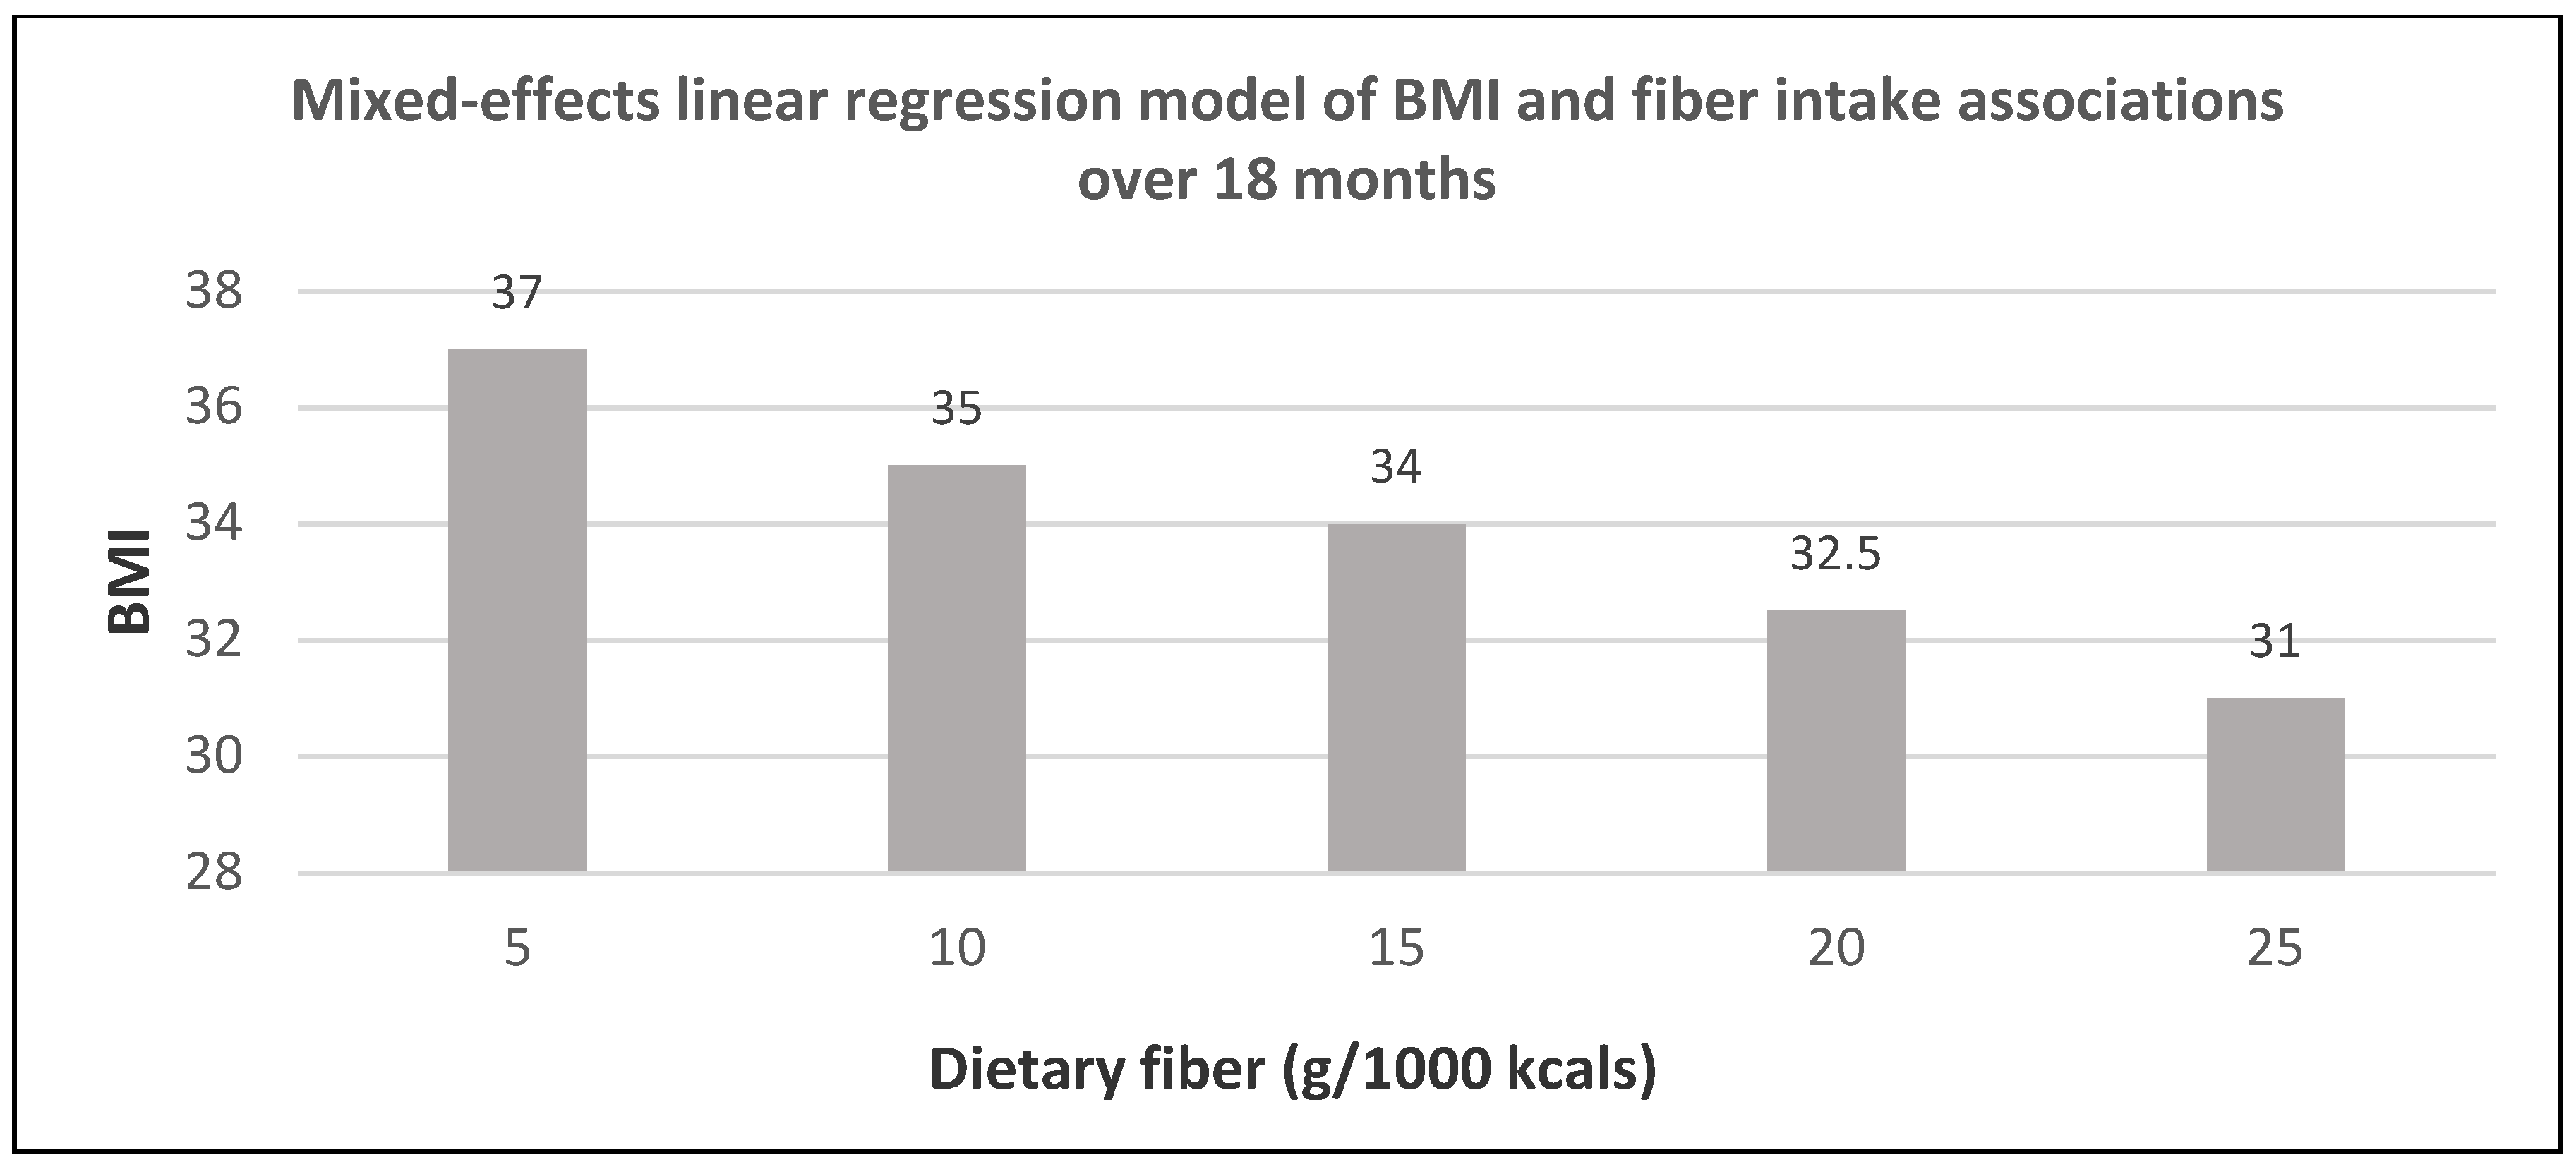
3.4.3. Dietary Fiber
4. Discussion
5. Conclusions
Author Contributions
Funding
Conflicts of Interest
Appendix A


| Low GL ≤10 | Medium GL 11–19 | High GL ≥20 | |
|---|---|---|---|
| Fresh Fruits and 100% Juices | |||
| Avocados | 0.1 | ||
| Strawberries | 1.0 | ||
| Oranges, pears, watermelons, tomato juice, grapefruit | 3.0–4.0 | ||
| Peaches, plums, apricots, blueberries, apples | 5.0–6.0 | ||
| Grapes, runes | 10–11 | ||
| Orange juice, apple juice | 9.0–10 | ||
| Bananas | 11–16 | ||
| Cranberry juice | 16–24 | ||
| Dried Fruits | |||
| Apricots, mangoes, apples | 8–11 | ||
| Dates, dried | 14–20 | ||
| Raisins | 28 | ||
| Vegetables/Legumes | |||
| Peppers, celery, Cauliflower, spinach, kale, iceberg/romaine lettuce, peanuts | 0.1–0.2 | ||
| String beans, eggplant, zucchini, onions, tomatoes, broccoli, Brussels sprouts | 0.4–0.6 | ||
| Carrots, cabbage | 2.0–3.0 | ||
| Winter squash, mix vegetables | 3.7–4.4 | ||
| Tofu, soybeans soy burger, miso, other soy protein | 1.0–5.0 | ||
| Beans, lentils, green peas | 3.0–9.0 | ||
| Sweet corn | 11 | ||
| Baked/mashed/fried potatoes, sweet potatoes, yams | 20–30 | ||
| Fruits | Serving Size | Total Energy (kcals) | Energy Density kcal/g | Total Fiber (g) | Sugar/Starch (g/g) | Protein (g) | Total Lipid (g) |
|---|---|---|---|---|---|---|---|
| Edible Portion | |||||||
| Apples | 1 medium (182g) | 95 | 0.5 | 4.4 | 19/0.0 | 0.5 | 0.3 |
| Avocados | 1/3 medium (50g) | 83 | 1.7 | 3.4 | 0.15/0.6 | 1.0 | 7.4 |
| Bananas | 1 medium (118g) | 105 | 0.9 | 3.1 | 14 /9.0 | 1.3 | 0.4 |
| Blueberries | 1 cup (148g) | 84 | 0.6 | 3.6 | 15 /0.0 | 1.1 | 0.5 |
| Grapes (red or green) | 30 grapes (126-g) | 87 | 0.7 | 1.1 | 20 /0.0 | 0.9 | 0.2 |
| Lemons | 1 fruit (58g) | 17 | 0.3 | 1.6 | 1.5/0 | 0.6 | 0.2 |
| Oranges | 1 medium (131 g) | 62 | 0.5 | 3.1 | 12 /0.0 | 1.3 | 0.2 |
| Peaches | 1 medium (147 g) | 57 | 0.2 | 2.2 | 12 /0.0 | 1.3 | 0.4 |
| Strawberries | 1 cup (147 g) | 47 | 0.4 | 2.9 | 7.2 /0.1 | 1.0 | 0.4 |
| Watermelon | 1/16 (280 g) | 84 | 0.3 | 1.1 | 17 /0.0 | 1.7 | 0.4 |
| Vegetables | Serving Size | Total Energy (kcals) | Energy Density (kcal/g) | Total Fiber (g) | Sugar/Starch (g/g) | Protein (g) | Total Lipid (g) |
|---|---|---|---|---|---|---|---|
| Edible Portion | |||||||
| Broccoli | 1 stalk (148g) | 50 | 0.3 | 3.9 | 2.5/2.0 | 4.2 | 0.5 |
| Carrots Bag (Baby) | 3-oz (85g) | 35 | 0.4 | 2.0 | 5.0/0.0 | 1.0 | 0.0 |
| Celery | 1 medium stalk (40g) | 6.4 | 0.2 | 0.6 | 0.5/0.0 | 0.3 | 0.1 |
| Lettuce/Mixed Salad Greens | Salad (70g) | 10–12 | 0.14–0.17 | 0.8–1.4 | 1.4–0.6/0.0 | 0.6–1.1 | 0.1–0.2 |
| Onions | ¼ cup (28g) | 17 | 0.6 | 2.0 | 4.9/3.0 | 0.3 | 0.0 |
| Bell Peppers | 1 medium (119g) | 29 | 0.2 | 2.1 | 3.6/1.0 | 1.1 | 0.3 |
| Potatoes (baked or boiled) | 1 medium (167g) | 174 | 1.0 | 2.8 | 1.4/28 | 2.8 | 4.1 |
| Potatoes (mashed) | 1 cup (140g) | 190 | 1.4 | 2.0 | 3.0/13 | 3.0 | 12 |
| French Fries Fast Foods | 1 medium 117g | 365 | 4.5 | 4.5 | 0.4/43 | 4.0 | 17 |
| Tomatoes Cherry | 1 cup (149g) | 27 | 0.2 | 1.8 | 4.0/0.0 | 1.3 | 0.3 |
| Sweet Corn | 1 medium ear (102g) | 88 | 0.9 | 2.0 | 6.0/12 | 3.3 | 1.4 |
| Fruits | Non-Legume Vegetables |
|---|---|
| Bananas | Potatoes |
| Apples | Tomatoes |
| Strawberries | Onions |
| Grapes | Carrots |
| Oranges | Broccoli |
| Watermelon | Bell peppers |
| Lemons | Lettuce/Salad Mix |
| Avocados | Cucumbers |
| Peaches | Celery |
| Blueberries | Sweet corn |
References
- Lee-Kwan, S.H.; Moore, L.V.; Blanck, H.M.; Harris, D.M.; Galuska, D. Disparities in state -specific adult fruit and vegetable consumption—United States. 2015. MMWR Morb. Mortal. Wkly. Rep. 2017, 66, 1241–1247. [Google Scholar] [CrossRef] [PubMed]
- US Department of Health and Human Services and U.S. Department of Agriculture. 2015–2020 Dietary Guidelines for Americans. 8th Edition. December 2015. Available online: https://health.gov/dietaryguidelines/2015/guidelines/ (accessed on 31 May 2020).
- Charlton, K.; Kowai, P.; Soriano, M.M.; Williams, S.; Banks, E.; Vo, K.; Byles, J. Fruit and vegetables intake and body mass index in a large sample of middle-ager Australian men and women. Nutrients 2014, 6, 2305–2319. [Google Scholar] [CrossRef] [PubMed]
- Williams, R.L.; Wood, L.G.; Collins, C.E.; Callister, R. Comparison of fruit and vegetable intakes during weight loss in males and females. Eur. J. Clin. Nutr. 2016, 70, 28–34. [Google Scholar] [CrossRef] [PubMed]
- Karfopoulou, E.; Brikou, D.; Mamalaki, E.; Bersimis, F.; Anastasiou, C.A.; Hill, J.O.; Yannakoulia, M. Dietary patterns in weight loss maintenance: Results from the MedWeight study. Eur. J. Nutr. 2017, 56, 991–1002. [Google Scholar] [CrossRef]
- Schwingshackl, L.; Hoffman, G.; Kalle-Uhlmann, T.; Arregui, M.; Buijsse, B.; Boeing, H. Fruit and vegetable consumption and changes in anthropometric variables in adult populations: A systematic review and meta-analysis of prospective cohort studies. PLoS ONE 2015, 10, e0140846. [Google Scholar] [CrossRef]
- Kaiser, K.A.; Brown, A.W.; Bohan Brown, M.M.; Shikany, J.M.; Mattes, R.D.; Allison, D.B. Increased fruit and vegetable intake has no discernible effect on weight loss: A systematic review and meta-analysis. Am. J. Clin. Nutr. 2014, 100, 567–576. [Google Scholar] [CrossRef]
- Mytton, O.T.; Nnoaham, K.; Eyles, H.; Scarborough, P.; Ni Mhurchu, C. Systematic review and meta-analysis of the effect of increased vegetable and fruit consumption on body weight and energy intake. BMC Public Health 2014, 14, 886. [Google Scholar] [CrossRef]
- Tapsell, L.C.; Dunning, A.; Warensjo, E.; Lyons-Wall, P.; Dehlsen, K. Effects of vegetable consumption on weight loss: A review of the evidence with implications for design of randomised controlled trials. Crit. Rev. Food Sci. Nutr. 2014, 54, 1529–1538. [Google Scholar] [CrossRef]
- Arnotti, K.; Bamber, M. Fruit and vegetables consumption in overweight or obese individuals: A meta-analysis. West. J. Nurs. Res. 2020, 42, 308–314. [Google Scholar] [CrossRef]
- Alinia, A.; Hels, O.; Tetens, I. The potential association between fruit intake and body weight—A review. Obes. Rev. 2009, 10, 639–647. [Google Scholar] [CrossRef]
- Guyenet, S.J. Impact of whole, fresh fruit consumption on energy intake and adiposity: A systemic review. Front. Nutr. 2019, 6, 66. [Google Scholar] [CrossRef] [PubMed]
- Ledoux, T.A.; Hingle, M.D.; Baranowski, T. Relationship of fruit and vegetables intake with adiposity: A systematic review. Obesity. Rev. 2011, 12, e143–e150. [Google Scholar] [CrossRef] [PubMed]
- Schulze, M.B.; Fung, T.T.; Manson, J.E.; Willett, W.C.; Hu, F.B. Dietary patterns and changes in body weight in women. Obesity 2006, 14, 1444–1453. [Google Scholar] [CrossRef]
- Aljadani, H.M.; Patterson, A.; Sibbritt, D.; Hutchesson, M.J.; Jensen, M.E.; Collins, C.E. Diet quality, measured by fruit and vegetable intake, predicts weight change in young women. J. Obes. 2013, 2013, 525161. [Google Scholar] [CrossRef] [PubMed]
- Aljadani, H.M.; Patterson, A.; Sibbritt, D.; Taylor, R.M.; Collin, C.E. Frequency and variety of usual intakes of healthy foods, fruit, and vegetables predicts lower 6-year weight gain in young women. Eur. J. Clin. Nutr. 2019, 74, 945–952. [Google Scholar] [CrossRef]
- Mozaffarian, D.; Hao, T.; Rimm, E.B.; Willett, W.C.; Hu, F.B. Changes in diet and lifestyle and long-term weight gain in women and men. N. Engl. J. Med. 2011, 364, 2392–2404. [Google Scholar] [CrossRef]
- Bertoia, M.L.; Mukamal, K.J.; Cahill, L.E.; Hou, T.; Ludwig, D.S.; Mozaffarian, D.; Willett, W.C.; Hu, F.B.; Rimm, E.B. Changes in the intake of fruits and vegetables and weight change in the United States men and women followed for 24 years. Analysis from three prospective cohort studies PLoS Med. 2015, 12, e1001878. [Google Scholar]
- Smith, J.D.; Hou, T.; Ludwig, D.S.; Rimm, E.B.; Willett, W.; Hu, F.B.; Mozaffarian, D. Changes in intake of protein foods, carbohydrate amount and quality, and long-term weight change: Results from 3 prospective cohorts. Am. J. Clin. Nutr. 2015, 101, 1216–1224. [Google Scholar] [CrossRef]
- Savage, J.S.; Marini, M.; Birch, L.L. Dietary energy density predicts women’s weight change over 6 y. Am. J. Clin. Nutr. 2008, 88, 677–684. [Google Scholar] [CrossRef][Green Version]
- Bes-Rastrollo, M.; Martínez-González, M.A.; Sánchez-Villegas, A.; de la Fuente Arrillaga, C.; Alfredo Martínez, J. Association of fiber intake and fruit/vegetable consumption with weight gain in a Mediterranean population. Nutrition 2006, 22, 504–511. [Google Scholar] [CrossRef]
- Mirmian, P.; Bahadoran, Z.; Moslehi, N.; Bastan, S.; Azizi, F. Colors of fruits and vegetables and 3-year changes of cardiometabolic risk factors in adults: Tehran lipid glucose study. Eur. J. Clin. Nutr. 2015, 69, 1215–1219. [Google Scholar] [CrossRef] [PubMed]
- Linde, J.A.; Utter, J.; Jeffery, R.W.; Sherwood, N.E.; Pronk, N.P.; Boyle, R.G. Specific food intake, fat, fiber intake, and behavioral correlates of BMI among overweight and obese members of a managed care organization. Int. J. Behav. Nutr. Phys. Act. 2006, 3, 42. [Google Scholar] [CrossRef] [PubMed][Green Version]
- He, K.; Hu, F.B.; Colditz, G.A.; Manson, J.E.; Willett, W.C.; Liu, S. Changes in intake of fruits and vegetables in relation to risk of obesity and weight gain among middle-aged women. Int. J. Obes. 2004, 28, 1569–1574. [Google Scholar] [CrossRef] [PubMed]
- Wang, T.; Heianza, Y.; Sun, D.; Zheng, Y.; Ma, W.; Rimm, E.B.; Manson, J.E.; Hu, F.B.; Willett, W.C.; Qi, L. Improving fruit and vegetable intake attenuates the genetic association with long-term weight gain. Am. J. Clin. Nutr. 2019, 110, 759–768. [Google Scholar] [CrossRef] [PubMed]
- Auerbach, B.J.; Littman, A.J.; Krieger, J.; Young, B.A.; Larson, J.; Tinker, L.; Neuhouser, M.I. Association of 10% juice consumption and 3-year weight change among postmenopausal women in the Women’s Health Initiative. Prev. Med. 2018, 109, 8–10. [Google Scholar] [CrossRef] [PubMed]
- Rautiainen, S.; Wang, L.; Lee, I.-M.; Manson, J.E.; Buring, J.E. Higher intake of fruit, but not vegetables or fiber, at baseline is associated with lower risk of becoming overweight or obese in middle-aged and older women of normal BMI at baseline. J. Nutr. 2015, 145, 960–968. [Google Scholar] [CrossRef] [PubMed]
- De Munter, J.S.; Tynelius, P.; Magnusson, C.; Rasmussen, F. Longitudinal analysis of lifestyle habits in relation to body mass index, onset of overweight and obesity: Results from a large population-based cohort in Sweden. Scand. J. Public Health 2016, 43, 236–245. [Google Scholar] [CrossRef]
- Vergnaud, A.-C.; Norat, T.; Romaguera, D.; Mouw, T.; May, A.M.; Romieu, I.; Freisling, H.; Slimani, N.; Boutron-Rualt, B.-R.; Clavel-Chapelon, F.; et al. Fruit and vegetable consumption and prospective weight change in participants of the European Prospective into Cancer and Nutrition-Physical Activity, Nutrition, Alcohol, Cessation of Smoking, Eating Out of Home, and Obesity study. Am. J. Clin. Nutr. 2012, 95, 184–193. [Google Scholar] [CrossRef]
- Romaguera, D.; Ängquist, L.; Du, H.; Jakobsen, M.U.; Forouhi, N.G.; Halkjær, J.; Feskens, E.J.; Masala, G.; Steffen, A.; Palli, D.; et al. Food composition of the diet in relation to changes in waist circumference adjusted for body mass index. PLoS ONE 2011, 6, e23384. [Google Scholar] [CrossRef]
- Romaguera, D.; Ängquist, L.; Du, H.; Jakobsen, M.U.; Forouhi, N.G.; Halkjær, J.; Feskens, E.J.; Masala, G.; Steffen, A.; Palli, D.; et al. Dietary Determinants of Changes in Waist Circumference Adjusted for Body Mass Index—A Proxy Measure of Visceral Adiposity. PLoS ONE 2010, 5, e11588. [Google Scholar] [CrossRef]
- Buijsse, B.; Feskens, E.J.M.; Schulze, M.B.; Forouhi, N.G.; Wareham, N.J.; Sharp, S.; Palli, D.; Tognon, G.; Halkjaer, J.; Tjønneland, A.; et al. Fruit and vegetable intakes and subsequent changes in body weight in European populations: Results from the project on Diet, Obesity, and Genes (DiOGenes). Am. J. Clin. Nutr. 2009, 90, 202–209. [Google Scholar] [CrossRef] [PubMed]
- Yuan, S.; Yu, H.J.; Liu, M.W.; Huang, Y.; Yang, Y.H.; Tang, B.W.; Song, Y.; Cao, Z.K.; Wu, H.J.; He, Q.Q.; et al. The association of fruit and vegetable consumption with changes in weight and body mass index in Chinese adults: A cohort study. Public Health 2018, 157, 121–126. [Google Scholar] [CrossRef] [PubMed]
- Parisi, S.M.; Bodnar, L.M.; Dubowitz, T. Weight resilience and fruit and vegetable intake among African. Public Health Nutr. 2018, 21, 391–402. [Google Scholar] [CrossRef] [PubMed]
- Fernstron, M.; Fernberg, U.; Hurtig-Wennlof, A. Insulin resistance (HOMA-IR) and body fat (%) are associated to low intake of fruit and vegetables in Swedish, young adults: The cross-sectional lifestyle, biomarkers and atherosclerosis study. BMC Nutr. 2019, 5, 15. [Google Scholar] [CrossRef]
- Yu, Z.M.; DeClercq, V.; Cui, Y.; Forbes, C.; Grandy, S.; Keats, M.; Parker, L.; Sweeney, E.; Dummer, T.J.B. Fruit and vegetable intake and body adiposity among populations in Eastern Canada: The Atlantic Partnership for Tomorrow’s Health. BMJ Open 2018, 8, e018060. [Google Scholar] [CrossRef]
- Aguiar-Bloemer, A.C.; Japur, C.C.; Francisco, L.V.; Diez-Garcia, R.W. Dietary quality differences between women with and without weight loss in nutritional treatment. Clin. Nutr. ESPEN 2019, 34, 110–115. [Google Scholar] [CrossRef]
- Van Eekelen, E.; Geelen, A.; Alssema, M.; Lamb, H.J.; de Roos, A.; Rosendaal, F.R.; de Mutsert, R. Sweet snacks are positively, and fruits and vegetables are negatively associated with visceral or liver fat content in middle-aged men and women. J. Nutr. 2019, 149, 304–313. [Google Scholar] [CrossRef]
- Heskey, C.; Oda, K.; Sabate, J. Avocado intake, and longitudinal weight and body mass index changes in an adult cohort. Nutrients 2019, 11, 691. [Google Scholar] [CrossRef]
- Poulsen, S.K.; Due, A.; Jordy, A.B.; Kiens, B.; Stark, K.D.; Stender, S.; Holst, C.; Astrup, A.; Larsen, T.M. Health effect of the New Nordic Diet in adults with increased waist circumference: A 6-mo randomized controlled trial. Am. J. Clin. Nutr. 2014, 99, 35–45. [Google Scholar] [CrossRef]
- De Oliveira, M.C.; Sichieri, R.; Mozzer, R.V. A low-energy-dense diet adding fruit reduces weight and energy intake in women. Appetite 2008, 51, 291–295. [Google Scholar] [CrossRef]
- Rodriguez-Rodriguez, E.; Lopez-Sobaler, A.M.; Navarro, A.R.; Bermejo, J.M.; Ortega, R.M.; Andres, P. Vitamin B-6 status improves in overweight/obese women following a hypocaloric diet rich in breakfast cereals and may help in maintaining fat-free mass. Int. J. Obes. 2008, 32, 1552–1558. [Google Scholar] [CrossRef]
- Ortega, R.M.; Lopez-Sobaler, A.M.; Andres, P.; Rodriguez-Rodriguez, E.; Apraricio, A.; Bermejo, L.M.; Garcia-Gonzalez, L.; Basabe, B. Changes in in thiamin intake and blood levels in young, overweight/obese women following hypocaloric diets based on the increased relative consumption of cereals or vegetables. Eur. J. Clin. Nutr. 2007, 61, 77–82. [Google Scholar] [CrossRef] [PubMed]
- Ortega, R.M.; Lopez-Sobaler, A.M.; Andres, P.; Rodriguez-Rodriguez, E.; Apraricio, A.; Bermejo, L.M.; Lopez-Plaza, B. Changes in folate status in overweight/obese women following two different weight control programmes based on an increased consumption of vegetables or fortified breakfast cereals. Br. J. Nutr. 2006, 96, 712–718. [Google Scholar] [PubMed]
- Fatahi, S.; Daneshzad, E.; Kord-Varkaneh, H.; Bellissimo, N.; Brett, N.R.; Azadbakht, L. Impact of diets rich in whole grains and fruits and vegetables on cardiovascular risk factors in overweight and obese women: A randomized clinical feeding trial. J. Am. Coll. Nutr. 2018, 37, 568–577. [Google Scholar] [CrossRef]
- Tanumihardjo, S.A.; Valentine, A.R.; Zhang, Z.; Whigham, L.D.; Lai, H.C.; Atkinson, R.L. Strategies to increase vegetable or reduce energy and fat intake induce weight loss in adults. Exp. Biol. Med. 2009, 234, 542–552. [Google Scholar] [CrossRef] [PubMed]
- Djuric, Z.; Poore, K.M.; Depper, J.B.; Uhley, V.E.; Lababidi, S.; Covington, C.; Klurfeld, D.M.; Simon, M.S.; Kucuk, O.; Heilbrun, L.K. Methods to increase fruit and vegetable intake with and without a decrease in fat intake: Compliance and effects on body weight in the Nutrition and Breast Health Study. Nutr. Cancer 2002, 43, 141–151. [Google Scholar] [CrossRef] [PubMed]
- Mensinger, J.L.; Calogero, R.M.; Stranges, S.; Tylka, T.L. A weight-neural versus weight-loss approach for health promotion in women with high BMI: A randomized-controlled trial. Appetite 2016, 105, 364–374. [Google Scholar] [CrossRef] [PubMed]
- Crujeiras, A.B.; Parra, M.D.; Rodríguez, M.C.; Martínez de Morentin, B.E.; Martínez, J.A. A role for fruit content in energy-restricted diets in improving antioxidant status in obese women during weight loss. Nutrition 2006, 22, 593–599. [Google Scholar] [CrossRef]
- Ribeiro, C.; Dourado, G.; Cesar, T. Orange juice allied to a reduced-calorie diet resulted in weight loss and ameliorates obesity-related biomarkers: A randomized control trial. Nutrition 2017, 38, 13–19. [Google Scholar] [CrossRef]
- Henning, S.M.; Yang, J.; Woo, S.L.; Lee, R.-P.; Huang, J.; Rasmusen, A.; Carpenter, C.L.; Thames, G.; Gilbuena, I.; Tseng, C.-H.; et al. Hass avocado inclusion in a weight-loss diet supported weight loss and altered gut microbiota: A 12-week randomized parallel-controlled trial. Curr. Dev. Nutr. 2019, 3, nzz068. [Google Scholar] [CrossRef]
- Lapointe, A.; Weisnagel, S.; Provencher, V.; Begin, C.; Dufour-Bouchard, A.; Trudeau, C.; Lemieux, S. Using restrictive messages to limit high-fat foods or nonrestrictive messages to increase fruit and vegetable intake: What works better for postmenopausal women? Eur. J. Clin. Nutr. 2010, 64, 194–202. [Google Scholar] [CrossRef] [PubMed]
- Lapointe, A.; Weisnagel, S.; Provencher, V.; Begin, C.; Dufour-Bouchard, A.; Trudeau, C.; Lemieux, S. Comparison of a dietary intervention promoting high intake of fruits and vegetables with a low-fat approach: Long-term effects on dietary intakes, eating behaviors and body weight in postmenopausal women. Br. J. Nutr. 2010, 104, 1080–1090. [Google Scholar] [CrossRef] [PubMed]
- Saquib, N.; Natarajan, L.; Rock, C.; Flatt, S.; Madlensky, L.; Kealey, S.; Pierce, J. The impact of a long-term reduction in dietary energy density on body weight within a randomized diet trial. Nutr. Cancer 2008, 60, 31–38. [Google Scholar] [CrossRef] [PubMed]
- Sartorelli, D.S.; Franco, L.J.; Cardoso, M.A. High intake of fruits and vegetables predicts weight loss in Brazilian overweight adults. Nutr. Res. 2008, 28, 233–238. [Google Scholar] [CrossRef] [PubMed]
- Howard, B.V.; Manson, J.E.; Stefanick, M.L.; Beresford, S.A.; Frank, G.; Jones, B.; Rodabough, R.J.; Snetselaar, L.; Thomson, C.; Tinker, L.; et al. Low-fat dietary pattern and weight change over 7 years The Women’s Health Initiative Dietary Modification Trial. JAMA 2006, 295, 39–49. [Google Scholar] [CrossRef]
- Thomson, C.; Rock, C.; Giuliano, A.; Newton, T.; Cui, H.; Reid, P.; Green, T.; Alberts, D. Longitudinal changes in body weight and body composition among women previously treated for breast cancer consuming a high-vegetable, fruit and fiber, low-fat diet. Eur. J. Nutr. 2005, 44, 18–25. [Google Scholar] [CrossRef]
- Ello-Martin, J.A.; Roe, L.S.; Ledikwe, J.H.; Beach, A.M.; Rolls, B.J. Dietary energy density in the, treatment of obesity: A year-long trial comparing 2 weight-loss diets. Am. J. Clin. Nutr. 2007, 85, 1465–1477. [Google Scholar] [CrossRef]
- Shenoy, S.F.; Poston, W.S.C.; Reeves, R.S.; Kazaks, A.G.; Holt, R.R.; Keen, C.L.; Chen, H.J.; Haddock, C.K.; Winters, B.L.; Khoo, C.S.H.; et al. Weight loss in individuals with metabolic syndrome given DASH diet counseling when provided a low sodium vegetable juice: A randomized controlled trial. Nutr. J. 2010, 9, 8. [Google Scholar] [CrossRef]
- Champagne, C.M.; Broyles, S.T.; Moran, L.D.; Cash, K.C.; Levy, E.J.; Lin, P.-H.; Batch, B.C.; Lien, L.F.; Funk, K.L.; Dalcin, A.; et al. Dietary intakes associated with successful weight loss and maintenance during the Weight Loss Maintenance Trial. J. Am. Diet. Assoc. 2011, 111, 1826–1835. [Google Scholar] [CrossRef]
- Karamali, M.; Kashanian, M.; Alaeinasab, S.; Asemi, Z. The effect of dietary soy intake on weight loss, glycaemic control, lipid profiles and biomarkers of inflammation and oxidative stress in women with polycystic ovary syndrome: A randomised clinical trial. J. Hum. Nutr. Diet. 2018, 31, 533–543. [Google Scholar] [CrossRef]
- Speaker, K.J.; Sayer, R.D.; Peters, J.C.; Foley, H.N.; Pan, Z.; Wyatt, H.R.; Flock, M.R.; Mukherjea, R.; Hill, J.O. Effects of consuming a high-protein diet with or without soy protein during weight loss and maintenance: A non-inferiority, randomized clinical efficacy trial. Obes. Sci. Pract. 2018, 4, 357–366. [Google Scholar] [CrossRef] [PubMed]
- Kjølbæk, L.; Sørensen, L.B.; Søndertoft, N.B.; Rasmussen, C.K.; Lorenzen, J.K.; Serena, A.; Astrup, A.; Larsen, L.H. Protein supplements after weight loss do not improve weight maintenance compared with recommended dietary protein intake despite beneficial effects on appetite sensation and energy expenditure: A randomized, controlled, double-blinded trial. Am. J. Clin. Nutr. 2017, 106, 684–697. [Google Scholar] [CrossRef] [PubMed]
- St-Onge, M.-P.; Claps, N.; Wolper, C.; Heymsfield, S.B. Supplementation with soy-protein rich foods does not enhance weight loss. J. Am. Diet. Assoc. 2007, 107, 500–505. [Google Scholar] [CrossRef]
- Turner, T.F.; Nance, L.M.; Strickland, W.D.; Malcolm, R.J.; Pechon, S.; O’Neil, P.M. Dietary adherence and satisfaction with bean-based high fiber weight loss diet. ISRN Obes. 2013, 2013, 915415. [Google Scholar] [CrossRef] [PubMed]
- Gravel, K.; Lemieux, S.; Asselin, G.; Dufresne, A.; Lemay, A.; Forest, J.-C.; Dodin, S. Effects of pulse consumption in women presenting components of the metabolic syndrome: A randomized controlled trial. Mediterr. J. Nutr. Metab. 2010, 3, 143–151. [Google Scholar]
- Liu, Z.-M.; Ho, S.C.; Chen, Y.-M.; Ho, Y.P. A mild favorable effect of soy protein with isoflavones on body composition—A 6-month double-blind randomized placebo-controlled trial among Chinese postmenopausal women. Int. J. Obes. 2010, 34, 309–318. [Google Scholar] [CrossRef]
- Rouhani, M.H.; Haghighatdoost, F.; Surkan, P.J.; Azadbakht, L. Associations between dietary energy density and obesity: A systematic review and meta-analysis of observational studies. Nutrition 2016, 32, 1037–1047. [Google Scholar] [CrossRef]
- Bes-Rastrollo, M.; van Dam, R.M.; Martinez-Gonzalez, M.A.; Li, T.Y.; Sampson, L.L.; Frank, B.; Hu, F.B. A prospective study of dietary energy density and weight gain in women. Am. J. Clin. Nutr. 2008, 88, 769–777. [Google Scholar] [CrossRef]
- Goulet, J.; Lapointe, B.; Lamarche, B.; Lemieux, S. Effect of a nutritional intervention promoting the Mediterranean food pattern on anthropometric profile in healthy women from the Quebec City metropolitan area. Eur. J. Clin. Nutr. 2007, 61, 1291–1300. [Google Scholar] [CrossRef]
- Brunstrom, J.M.; Drake, A.C.L.; Forde, C.G.; Rogers, P.J. Undervalued and ignored: Are humans poorly adapted to energy dense foods? Appetite 2018, 120, 589–595. [Google Scholar] [CrossRef]
- Kant, A.K.; Graubard, B.I. Energy density of diets reported by American adults: Association with food group intake, nutrient intake and body weight. Int. J. Obes. 2005, 29, 950–956. [Google Scholar] [CrossRef] [PubMed]
- Vernarelli, J.A.; Mitchell, D.C.; Rolls, B.J.; Hartman, T.J. Dietary energy density is associated with obesity and other biomarkers of chronic diseases in US adults. Eur. J. Nutr. 2015, 54, 59–65. [Google Scholar] [CrossRef] [PubMed]
- National Center for Chronic Disease Prevention and Health Promotion. Low-Energy-Dense Foods and Weight Management: Cutting Calories While Controlling Hunger. Available online: https://www.cdc.gov/nccdphp/dnpa/nutrition/pdf/r2p_energy_density.pdf (accessed on 1 June 2020).
- National Center for Chronic Disease Prevention and Health Promotion. Can Eating Fruits and Vegetables Help People to Manage Their Weight? Research to Practice Series; No. 1. Available online: https://www.cdc.gov/nccdphp/dnpa/nutrition/pdf/rtp_practitioner_10_07.pdf (accessed on 31 May 2020).
- Rolls, B.J. Dietary energy density: Applying behavioural science to weight management. Nutr. Bull. 2017, 42, 246–253. [Google Scholar] [CrossRef] [PubMed]
- Vernarelli, J.A.; Mitchell, D.C.; Rolls, B.J.; Hartman, T.J. Dietary energy density and obesity: How consumption patterns differ by body weight status. Eur. J. Nutr. 2018, 57, 351–361. [Google Scholar] [CrossRef]
- Raynor, H.A.; Van Walleghen, E.L.; Bachman, J.L. Dietary energy density and successful weight loss maintenance. Eat. Behav. 2011, 12, 119–125. [Google Scholar] [CrossRef]
- Murakami, K.; McCaffrey, T.A.; Livingstone, B.E. Associations of dietary glycaemic index and glycaemic load with foods and nutrient intake and general and central obesity in British adults. Br. J. Nutr. 2013, 110, 2047–2057. [Google Scholar] [CrossRef]
- Miketinas, D.C.; Bray, G.A.; Beyl, R.A.; Ryan, D.H.; Sacks, F.M.; Champagne, C.M. Fiber intake predicts weight loss and dietary adherence in adults consuming calorie-restricted diets: The POUNDS Lost (Preventing Overweight Using Novel Dietary Strategies) Study. J. Nutr. 2019, 149, 1742–1748. [Google Scholar] [CrossRef]
- Saffari, M.; Pakpour, A.H.; Mohammadi-Zeidi, I.; Samadi, M.; Chen, H. Long-term effects of motivational interviewing on dietary intake and weight loss in Iranian obese/overweight women. Health Promot. Perspect. 2014, 4, 206–213. [Google Scholar]
- Buscemi, J.; Pugach, O.; Springfield, S.; Jang, J.; Tussing-Humphreys, L.; Schiffer, L.; Stolley, M.; Fitzgibbon, M.L. Associations between fiber intake and body mass index (BMI) among African-American women participating in a randomized weight loss and maintenance trial. Eat. Behav. 2018, 29, 48–53. [Google Scholar] [CrossRef]
- Boeing, H.; Bechthold, A.; Bub, A.; Ellinger, S.; Haller, D.; Kroke, A.; Leschik, E.; Muller, S.; Oberritter, H.; Schulze, M.; et al. Critical review: Vegetables and fruit in the prevention of chronic diseases. Eur. J. Nutr. 2012, 51, 637–663. [Google Scholar] [CrossRef]
- U.S. Department of Agriculture, Agricultural Research Service. Food Data Central, 2019. Available online: www.fdc.nal.usda.gov (accessed on 1 June 2020).
- Atkinson, F.S.; Foster-Powell, K.; Brand-Miller, J.C. International tables of glycemic index and glycemic load values: 2008. Diabetes Care 2008, 31, 2281–2283. [Google Scholar] [CrossRef] [PubMed]
- Top 20 Fruits and Vegetables Sold in the U.S. Available online: www.PMA.com/content/articles/top-20-fruits-and-vegetables-sold-in-the-US (accessed on 1 June 2020).


| Intake/day | Western Dietary Pattern (US) | USDA Base Pattern | DASH Diet Pattern | Healthy Mediterranean Pattern | Healthy Vegetarian Pattern (Lact-Ovo Based) | New Nordic Diet |
|---|---|---|---|---|---|---|
| Fiber (g) | 16 | 31 | 29+ | 31 | 35+ | 40+ |
| Fruit (cups) | ≤1.0 | 2.0 | 2.5 | 2.5 | 2.0 | 2.0 w/berries |
| Vegetables (cups) | ≤1.5 | 2.5 | 2.1 | 2.5 | 2.5 | 3–4 w/root vegetables |
| Legumes (ounces) | -- | 1.5 | 0.5 | 1.5 | 3.0 | 1.0+ |
| Soy products (ounces) | 0.0 | 0.5 | -- | -- | 1.1 | -- |
| Whole-grains (ounces) | 0.6 | 3.0 | 4.0 | 3.0 | 3.0 | 2.0 + |
| Nuts/Seeds (ounces) | 0.5 | 0.6 | 1.0 | 0.6 | 1.0 | 1.0 + |
© 2020 by the authors. Licensee MDPI, Basel, Switzerland. This article is an open access article distributed under the terms and conditions of the Creative Commons Attribution (CC BY) license (http://creativecommons.org/licenses/by/4.0/).
Share and Cite
Dreher, M.L.; Ford, N.A. A Comprehensive Critical Assessment of Increased Fruit and Vegetable Intake on Weight Loss in Women. Nutrients 2020, 12, 1919. https://doi.org/10.3390/nu12071919
Dreher ML, Ford NA. A Comprehensive Critical Assessment of Increased Fruit and Vegetable Intake on Weight Loss in Women. Nutrients. 2020; 12(7):1919. https://doi.org/10.3390/nu12071919
Chicago/Turabian StyleDreher, Mark L., and Nikki A. Ford. 2020. "A Comprehensive Critical Assessment of Increased Fruit and Vegetable Intake on Weight Loss in Women" Nutrients 12, no. 7: 1919. https://doi.org/10.3390/nu12071919
APA StyleDreher, M. L., & Ford, N. A. (2020). A Comprehensive Critical Assessment of Increased Fruit and Vegetable Intake on Weight Loss in Women. Nutrients, 12(7), 1919. https://doi.org/10.3390/nu12071919