Results of a Mass Media Campaign in South Africa to Promote a Sugary Drinks Tax

 and
and
Abstract
1. Introduction
Media Campaigns and Policy Support
2. Materials and Methods
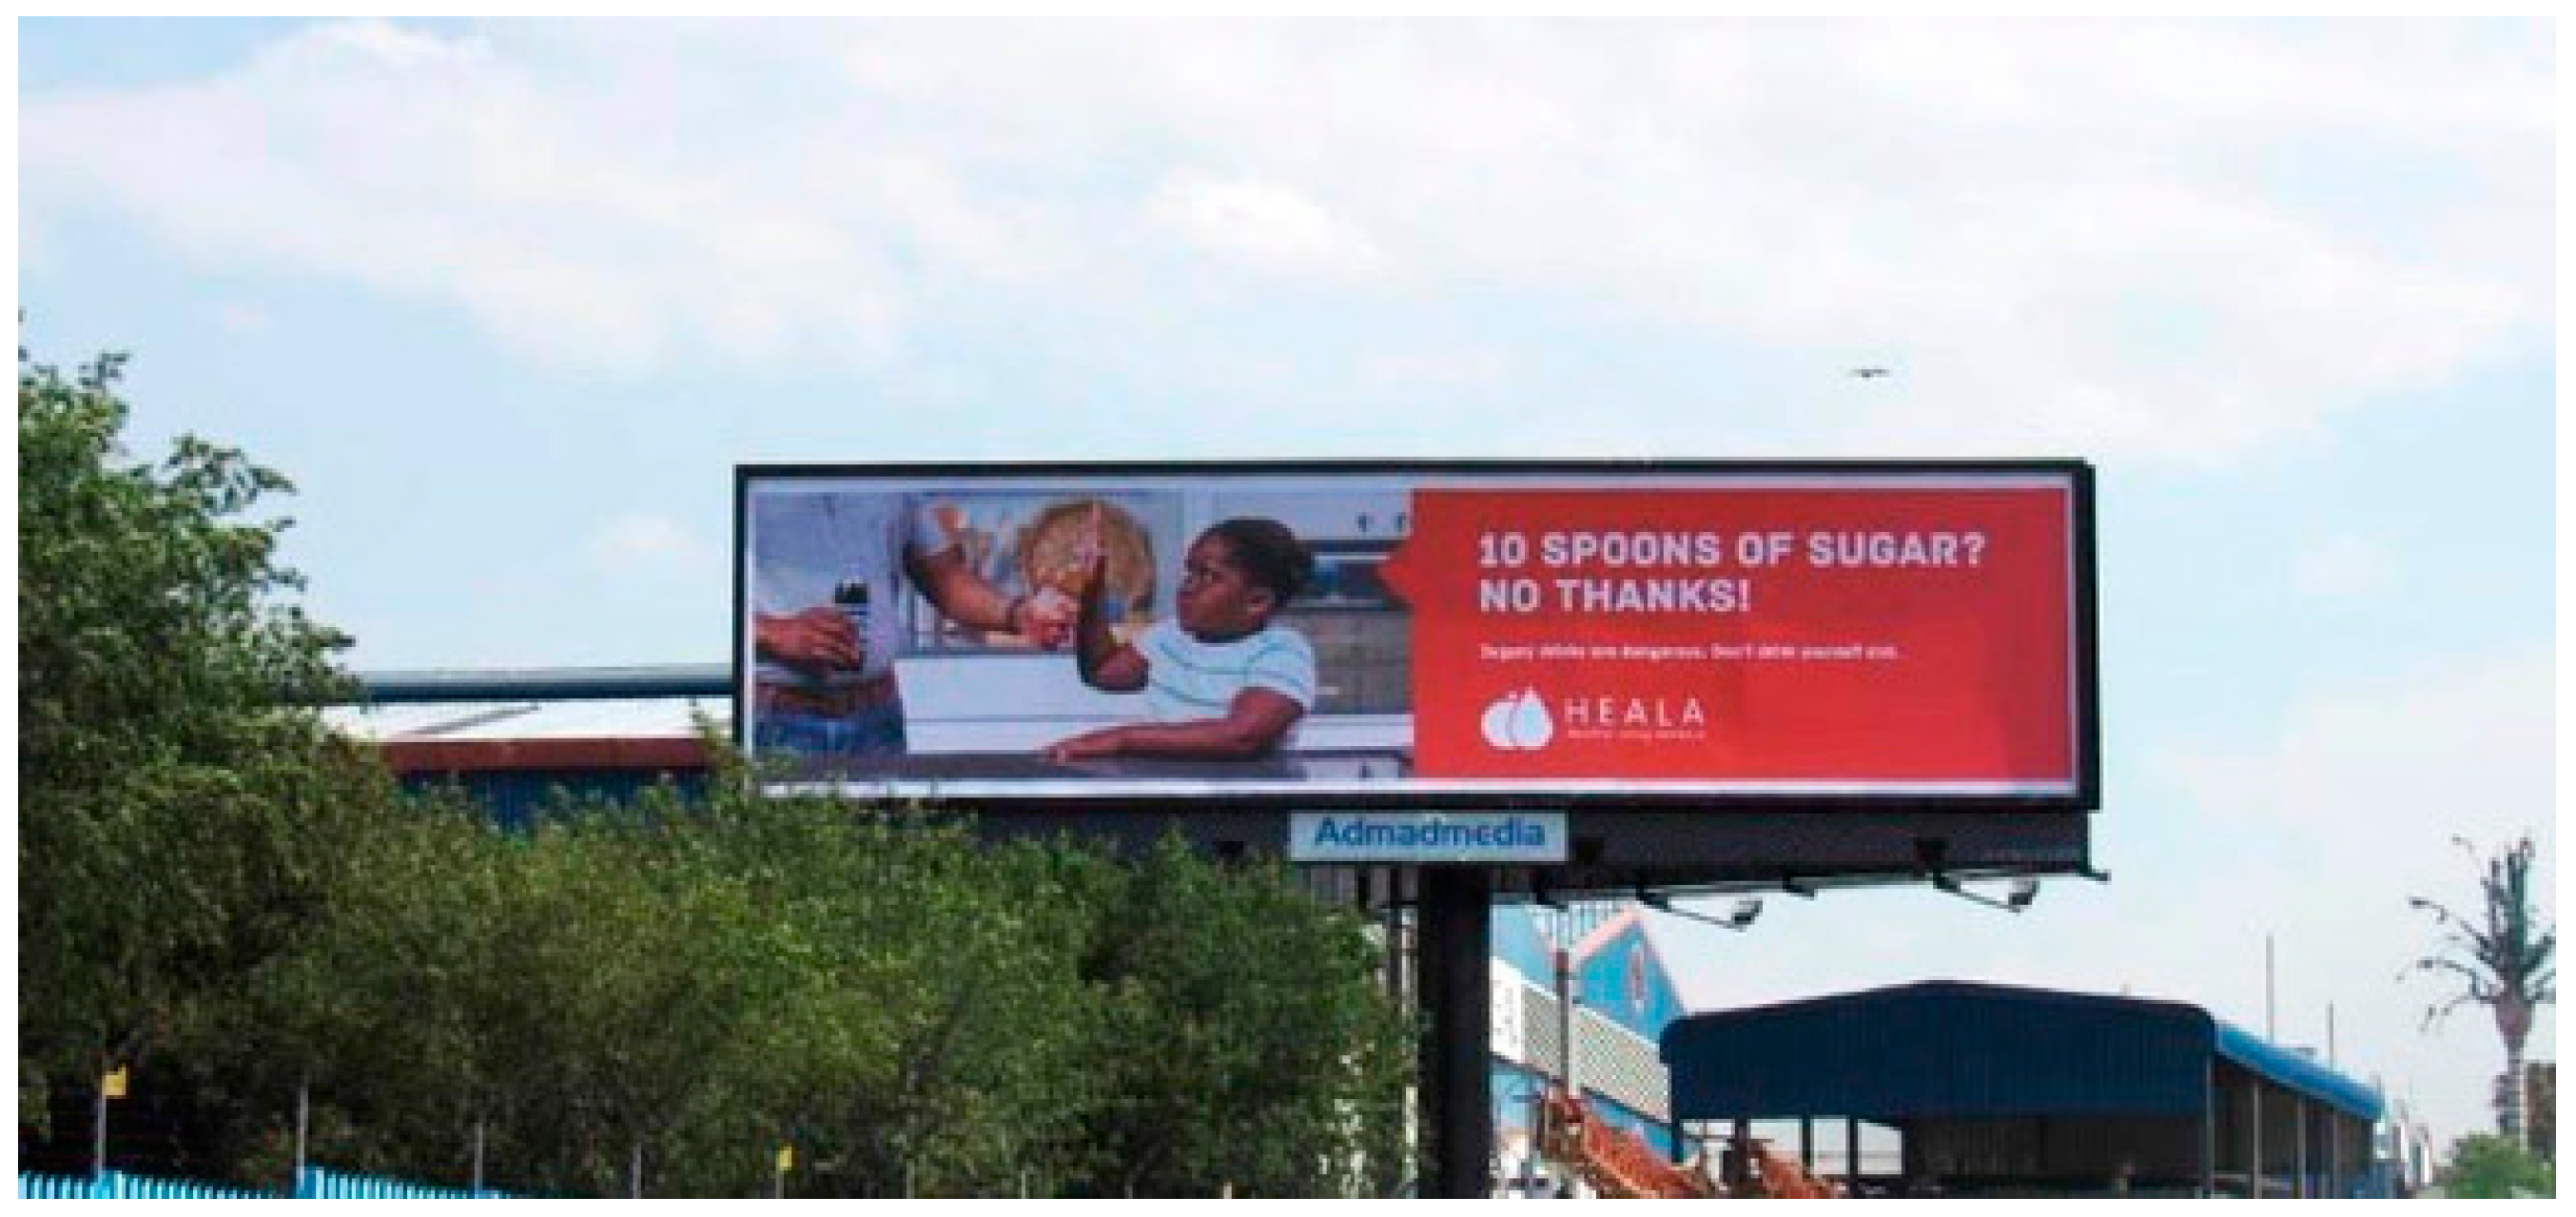
2.1. South Africa’s “Are You Drinking Yourself Sick?” Campaign
2.2. Sample and Data Collection
2.3. Questionnaire and Measures
2.4. Data Analysis
3. Results
3.1. Sample Characteristics
3.2. Recall of Messages About Harms of Sugary Drinks
3.3. Reactions to the Campaign
3.4. Knowledge and Attitudes
3.4.1. Changes from the Pre- to the Post-Campaign Period
3.4.2. Impact of Campaign Awareness Within the Post-Campaign Period
3.5. Support for Government Action
3.5.1. Changes from the Pre- to the Post-Campaign Period
3.5.2. Impact of Campaign Awareness within the Post-Campaign Period
3.6. Behavioral Intentions and Behaviors
3.6.1. Changes from the Pre- to the Post-Campaign Period
3.6.2. Impact of Campaign Awareness Within the Post-Campaign Period
4. Discussion
5. Conclusions
Author Contributions
Funding
Acknowledgments
Conflicts of Interest
References
- Health Effects of Overweight and Obesity in 195 Countries over 25 Years. N. Engl. J. Med. 2017, 377, 13–27. [CrossRef] [PubMed]
- World Health Organiation. Obesity and Overweight. Available online: https://www.who.int/news-room/fact-sheets/detail/obesity-and-overweight (accessed on 19 May 2020).
- Collaborators, G.R.F. Global, regional, and national comparative risk assessment of 79 behavioural, environmental and occupational, and metabolic risks or clusters of risks in 188 countries, 1990–2013: A systematic analysis for the Global Burden of Disease Study 2013. Lancet 2015, 386, 2287–2323. [Google Scholar]
- Shisana, O. The south African National Health and Nutrition Examination Survey: SANHANES-1; HSRC Press: Cape Town, South Africa, 2013. [Google Scholar]
- Hu, F.B.; Malik, V.S. Sugar-sweetened beverages and risk of obesity and type 2 diabetes: Epidemiologic evidence. Physiol. Behav. 2010, 100, 47–54. [Google Scholar] [CrossRef]
- Basu, S.; McKee, M.; Galea, G.; Stuckler, D. Relationship of soft drink consumption to global overweight, obesity, and diabetes: A cross-national analysis of 75 countries. Am. J. Public Health 2013, 103, 2071–2077. [Google Scholar] [CrossRef] [PubMed]
- Malik, V.S.; Popkin, B.M.; Bray, G.A.; Després, J.-P.; Willett, W.C.; Hu, F.B. Sugar-sweetened beverages and risk of metabolic syndrome and type 2 diabetes: A meta-analysis. Diabetes Care 2010, 33, 2477–2483. [Google Scholar] [CrossRef]
- Norman, R.; Bradshaw, D.; Schneider, M.; Joubert, J.; Groenewald, P.; Lewin, S.; Steyn, K.; Vos, T.; Laubscher, R.; Nannan, N.; et al. A comparative risk assessment for South Africa in 2000: Towards promoting health and preventing disease. S. Afr. Med. J. 2007, 97, 637–641. [Google Scholar]
- Singh, G.M.; Micha, R.; Khatibzadeh, S.; Shi, P.; Lim, S.; Andrews, K.G.; Engell, R.E.; Ezzati, M.; Mozaffarian, D.; Nutrition, G.B.o.D. Global, regional, and national consumption of sugar-sweetened beverages, fruit juices, and milk: A systematic assessment of beverage intake in 187 countries. PLoS ONE 2015, 10, e0124845. [Google Scholar] [CrossRef]
- Ronquest-Ross, L.-C.; Vink, N.; Sigge, G.O. Food consumption changes in South Africa since 1994. S. Afr. J. Sci. 2015, 111, 1–12. [Google Scholar] [CrossRef]
- Vorster, H.H.; Kruger, A.; Wentzel-Viljoen, E.; Kruger, H.S.; Margetts, B.M. Added sugar intake in South Africa: Findings from the Adult Prospective Urban and Rural Epidemiology cohort study. Am. J. Clin. Nutr. 2014, 99, 1479–1486. [Google Scholar] [CrossRef]
- Collaboration, N.R.F. Trends in adult body-mass index in 200 countries from 1975 to 2014: A pooled analysis of 1698 population-based measurement studies with 19.2 million participants. Lancet 2016, 387, 1377–1396. [Google Scholar]
- Pillay-van Wyk, V.; Msemburi, W.; Laubscher, R.; Dorrington, R.E.; Groenewald, P.; Glass, T.; Nojilana, B.; Joubert, J.D.; Matzopoulos, R.; Prinsloo, M. Mortality trends and differentials in South Africa from 1997 to 2012: Second National Burden of Disease Study. Lancet Glob. Health 2016, 4, e642–e653. [Google Scholar] [CrossRef]
- Taber, D.R.; Dulin-Keita, A.; Fallon, M.; Chaloupka, F.J.; Andreyeva, T.; Schwartz, M.B.; Harris, J.L. Society of Behavioral Medicine (SBM) position statement: Enact taxes on sugar sweetened beverages to prevent chronic disease. Transl. Behav. Med. 2018. [Google Scholar] [CrossRef] [PubMed]
- Powell, L.M.; Chriqui, J.F.; Khan, T.; Wada, R.; Chaloupka, F.J. Assessing the potential effectiveness of food and beverage taxes and subsidies for improving public health: A systematic review of prices, demand and body weight outcomes. Obes. Rev. 2013, 14, 110–128. [Google Scholar] [CrossRef] [PubMed]
- Andreyeva, T.; Long, M.W.; Brownell, K.D. The impact of food prices on consumption: A systematic review of research on the price elasticity of demand for food. Am. J. Public Health 2010, 100, 216–222. [Google Scholar] [CrossRef] [PubMed]
- Brownell, K.D.; Farley, T.; Willett, W.C.; Popkin, B.M.; Chaloupka, F.J.; Thompson, J.W.; Ludwig, D.S. The public health and economic benefits of taxing sugar-sweetened beverages. N. Engl. J. Med. 2009, 361, 1599. [Google Scholar] [CrossRef]
- Colchero, M.A.; Popkin, B.M.; Rivera, J.A.; Ng, S.W. Beverage purchases from stores in Mexico under the excise tax on sugar sweetened beverages: Observational study. BMJ 2016, 352, h6704. [Google Scholar] [CrossRef] [PubMed]
- Colchero, M.A.; Salgado, J.C.; Unar-Munguía, M.; Molina, M.; Ng, S.; Rivera-Dommarco, J.A. Changes in prices after an excise tax to sweetened sugar beverages was implemented in Mexico: Evidence from urban areas. PLoS ONE 2015, 10, e0144408. [Google Scholar] [CrossRef]
- Andreyeva, T.; Chaloupka, F.J.; Brownell, K.D. Estimating the potential of taxes on sugar-sweetened beverages to reduce consumption and generate revenue. Prev. Med. 2011, 52, 413–416. [Google Scholar] [CrossRef]
- Escobar, M.A.C.; Veerman, J.L.; Tollman, S.M.; Bertram, M.Y.; Hofman, K.J. Evidence that a tax on sugar sweetened beverages reduces the obesity rate: A meta-analysis. BMC Public Health 2013, 13, 1072. [Google Scholar]
- Stacey, N.; Mudara, C.; Ng, S.W.; van Walbeek, C.; Hofman, K.; Edoka, I. Sugar-based beverage taxes and beverage prices: Evidence from South Africa’s Health Promotion Levy. Soc. Sci. Med. 2019, 238, 112465. [Google Scholar] [CrossRef]
- Jacobs, A.; Richtel, M. She Took on Colombia’s Soda Industry. Then She Was Silenced. Available online: https://www.nytimes.com/2017/11/13/health/colombia-soda-tax-obesity.html (accessed on 15 March 2020).
- George, A. Not so sweet refrain: Sugar-sweetened beverage taxes, industry opposition and harnessing the lessons learned from tobacco control legal challenges. Health Econ. Policy Law 2019, 14, 509–535. [Google Scholar] [CrossRef]
- Tangcharoensathien, V.; Chandrasiri, O.; Kunpeuk, W.; Markchang, K.; Pangkariya, N. Addressing NCDs: Challenges from Industry Market Promotion and Interferences. Int. J. Health Policy Manag. 2019, 8, 256–260. [Google Scholar] [CrossRef] [PubMed]
- Delobelle, P. Big Tobacco, Alcohol, and Food and NCDs in LMICs: An Inconvenient Truth and Call to Action Comment on “Addressing NCDs: Challenges from Industry Market Promotion and Interferences”. Int. J. Health Policy Manag. 2019, 8, 727–731. [Google Scholar] [CrossRef]
- Du, M.; Tugendhaft, A.; Erzse, A.; Hofman, K.J. Sugar-Sweetened Beverage Taxes: Industry Response and Tactics. Yale J. Biol. Med. 2018, 91, 185–190. [Google Scholar] [PubMed]
- Backholer, K.; Martin, J. Sugar-sweetened beverage tax: The inconvenient truths. Public Health Nutr. 2017, 20, 3225–3227. [Google Scholar] [CrossRef] [PubMed]
- Hofman, K.J.; Thow, A.M.; Erzse, A.; Tugendhaft, A.; Stacey, N.; SA, P. The Political Economy of Sugar-Sweetened Beverage Taxation in South Africa: Lessons for Policy Making Session: Abstract Session for Young Researchers. Available online: https://pmac2019.com/uploads/poster/A183-AGNESERZSE-3da6.pdf (accessed on 29 May 2020).
- Wakefield, M.A.; Loken, B.; Hornik, R.C. Use of mass media campaigns to change health behaviour. Lancet 2010, 376, 1261–1271. [Google Scholar] [CrossRef]
- Stead, M.; Gordon, R.; Angus, K.; McDermott, L. A systematic review of social marketing effectiveness. Health Educ. 2007, 107, 126–191. [Google Scholar] [CrossRef]
- Dixon, H.; Scully, M.; Cotter, T.; Maloney, S.; Wakefield, M. Healthy weight and lifestyle advertisements: An assessment of their persuasive potential. Health Educ. Res. 2015, 30, 569–579. [Google Scholar] [CrossRef]
- Dixon, H.; Scully, M.; Durkin, S.; Brennan, E.; Cotter, T.; Maloney, S.; O’Hara, B.J.; Wakefield, M. Finding the keys to successful adult-targeted advertisements on obesity prevention: An experimental audience testing study. BMC Public Health 2015, 15, 804. [Google Scholar] [CrossRef]
- Morley, B.; Niven, P.; Dixon, H.; Swanson, M.; Szybiak, M.; Shilton, T.; Pratt, I.S.; Slevin, T.; Wakefield, M. Association of the LiveLighter mass media campaign with consumption of sugar-sweetened beverages: Cohort study. Health Promot. J. Austr. 2019, 30 (Suppl. 1), 34–42. [Google Scholar] [CrossRef]
- King, E.L.; Grunseit, A.C.; O’Hara, B.J.; Bauman, A.E. Evaluating the effectiveness of an Australian obesity mass-media campaign: How did the ‘Measure-Up’ campaign measure up in New South Wales? Health Educ. Res. 2013, 28, 1029–1039. [Google Scholar] [CrossRef] [PubMed]
- Wammes, B.; Oenema, A.; Brug, J. The evaluation of a mass media campaign aimed at weight gain prevention among young Dutch adults. Obesity 2007, 15, 2780–2789. [Google Scholar] [CrossRef] [PubMed]
- Croker, H.; Lucas, R.; Wardle, J. Cluster-randomised trial to evaluate the ‘Change for Life’mass media/social marketing campaign in the UK. BMC Public Health 2012, 12, 404. [Google Scholar] [CrossRef] [PubMed]
- Morley, B.; Niven, P.; Dixon, H.; Swanson, M.; Szybiak, M.; Shilton, T.; Pratt, I.S.; Slevin, T.; Hill, D.; Wakefield, M. Population-based evaluation of the ‘LiveLighter’ healthy weight and lifestyle mass media campaign. Health Educ. Res. 2016, 31, 121–135. [Google Scholar] [CrossRef] [PubMed]
- Pollard, C.M.; Miller, M.R.; Daly, A.M.; Crouchley, K.E.; O’Donoghue, K.J.; Lang, A.J.; Binns, C.W. Increasing fruit and vegetable consumption: Success of the Western Australian Go for 2&5 campaign. Public Health Nutr. 2008, 11, 314–320. [Google Scholar] [PubMed]
- Dixon, H.; Borland, R.; Segan, C.; Stafford, H.; Sindall, C. Public Reaction to Victoria’s “2 Fruit ‘n’ 5 Veg Every Day” Campaign and Reported Consumption of Fruit and Vegetables. Prev. Med. 1998, 27, 572–582. [Google Scholar] [CrossRef] [PubMed]
- Boles, M.; Adams, A.; Gredler, A.; Manhas, S. Ability of a mass media campaign to influence knowledge, attitudes, and behaviors about sugary drinks and obesity. Prev. Med. 2014, 67, S40–S45. [Google Scholar] [CrossRef]
- Farley, T.A.; Halper, H.S.; Carlin, A.M.; Emmerson, K.M.; Foster, K.N.; Fertig, A.R. Mass Media Campaign to Reduce Consumption of Sugar-Sweetened Beverages in a Rural Area of the United States. Am. J. Public Health 2017, 107, 989–995. [Google Scholar] [CrossRef]
- Morley, B.C.; Niven, P.H.; Dixon, H.G.; Swanson, M.G.; McAleese, A.B.; Wakefield, M.A. Controlled cohort evaluation of the LiveLighter mass media campaign’s impact on adults’ reported consumption of sugar-sweetened beverages. BMJ Open 2018, 8, e019574. [Google Scholar] [CrossRef]
- McCombs, M. Agenda setting function of mass media. Public Relat. Rev. 1977, 3, 89–95. [Google Scholar] [CrossRef]
- Durkin, S.; Brennan, E.; Wakefield, M. Mass media campaigns to promote smoking cessation among adults: An integrative review. Tob. Control 2012, 21, 127–138. [Google Scholar] [CrossRef] [PubMed]
- Bandura, A. Health promotion by social cognitive means. Health Educ. Behav. 2004, 31, 143–164. [Google Scholar] [CrossRef] [PubMed]
- McGuire, W.J. Public communication as a stratey for inducing health-promoting behaviorial change. Prev. Med. 1984, 13, 299–319. [Google Scholar] [CrossRef]
- Jeong, M.; Gilmore, J.S.; Bleakley, A.; Jordan, A. Local news media framing of obesity in the context of a sugar-sweetened beverage reduction media campaign. J. Nutr. Educ. Behav. 2014, 46, 583–588. [Google Scholar] [CrossRef] [PubMed]
- Puhl, R.; Peterson, J.L.; Luedicke, J. Fighting obesity or obese persons? Public perceptions of obesity-related health messages. Int. J. Obes. (Lond.) 2013, 37, 774–782. [Google Scholar] [CrossRef]
- Culliinan, K.; Majija, L.; Cotter, T.; Kotov, A.; Mullin, S.; Murukutla, N. A Case Study of South Africa’s Campaign for a Tax on Sugary Beverages: Lessons for Public Health Advocates. Nutr. Today 2020, in press. [Google Scholar]


| Pre-Campaign | Post- Campaign | p-Value | |
|---|---|---|---|
| (n = 1000) | (n = 1000) | ||
| Age (Mean ± SD) (years) | 34 ± 10.49 | 35 ± 10.65 | 0.041 * |
| Women (%) | 50 | 50 | 1.000 |
| Parent/primary care giver to children under 16 (%) | 59 | 55 | 0.058 |
| Education (%) | |||
| High school and below | 83 | 86 | 0.100 |
| Above high school | 17 | 15 | |
| Employment status (%) | |||
| Unemployed | 37 | 44 | 0.019 * |
| Employed | 55 | 49 | |
| Student | 5 | 4 | |
| Other | 4 | 3 | |
| Socioeconomic status (%) | |||
| Low | 9 | 12 | 0.252 |
| Medium | 66 | 64 | |
| High | 25 | 25 | |
| Fruit and vegetable intake in the last seven days (%) | |||
| Two or fewer times | 42 | 47 | 0.048 * |
| Three or more times | 58 | 53 | |
| Frequency of watching television in the last seven days (%) | |||
| Less than four hours | 75 | 58 | <0.001 * |
| More than four hours | 25 | 42 | |
| Vigorous physical activity in the last seven days (%) | |||
| Two or fewer days | 60 | 43 | <0.001 * |
| Three or more days | 40 | 57 | |
| Body mass index (%) | |||
| Underweight | 1 | 3 | 0.122 |
| Normal weight | 30 | 33 | |
| Overweight | 25 | 20 | |
| Obese | 44 | 44 | |
| Self-rated health status (%) | |||
| Poor/fair health | 15 | 24 | <0.001 * |
| Good/excellent health | 85 | 76 |
| Post-Campaign | |||
|---|---|---|---|
| Unaware (n = 453) | Aware (n = 547) | p-Value | |
| Age (Mean ± SD) (years) | 36 ± 10.50 | 35 ± 10.77 | 0.010 * |
| Gender (%) | |||
| Men | 52 | 49 | <0.001 * |
| Women | 39 | 61 | |
| Parent/primary caregiver of children under 16 (%) | |||
| Yes | 44 | 56 | 0.287 |
| No | 47 | 53 | |
| Education (%) | |||
| High school and below | 45 | 55 | 0.344 |
| Above high school | 49 | 51 | |
| Employment status (%) | |||
| Unemployed | 45 | 55 | 0.078 |
| Employed | 47 | 53 | |
| Student | 33 | 67 | |
| Other | 58 | 43 | |
| Tobacco user (%) | |||
| Yes | 45 | 55 | 0.982 |
| No | 45 | 55 | |
| Socioeconomic status (%) | |||
| Low | 52 | 48 | 0.023 * |
| Medium | 47 | 53 | |
| High | 39 | 62 | |
| Vigorous physical activity in the last seven days (%) | |||
| Two or fewer days | 50 | 50 | 0.102 |
| Three or more days | 44 | 56 | |
| Fruit and vegetable intake in the last seven days (%) | |||
| Two or fewer times | 42 | 58 | 0.056 |
| Three or more times | 48 | 52 | |
| Frequency of watching television in the last seven days (%) | |||
| Less than four hours | 51 | 49 | <0.001 * |
| More than four hours | 38 | 62 | |
| Body mass index (%) | |||
| Underweight | 46 | 54 | 0.212 |
| Normal weight | 37 | 63 | |
| Overweight | 47 | 53 | |
| Obese | 48 | 52 | |
| Self-rated health (%) | |||
| Poor/fair health | 48 | 52 | 0.425 |
| Good/excellent health | 45 | 52 | |
| Reactions to the Campaign | Campaign Aware (n = 547) |
|---|---|
| % that agreed that the campaign… | |
| Was believable | 86 |
| Was relevant to me | 79 |
| Taught me something new | 83 |
| Made me stop and think | 82 |
| Made me feel concerned about the impact of sugary drinks on my health | 85 |
| Made me motivated to reduce my consumption of sugary drinks | 85 |
| Made me motivated to reduce my child’s consumption of sugary drinks | 82 |
| Made me more supportive of government action to reduce sugary drink consumption in my country | 81 |
| I would like others to see this ad | 90 |
| This ad provides a public service/it is in the public’s interest to watch it | 87 |
| % that discussed the campaign with… | |
| Family | 33 |
| Friends | 24 |
| Colleagues | 11 |
| Doctor or health worker | 6 |
| Likelihood of reducing the amount of sugary drinks consumed as a result of seeing the campaign (% likely) | 68 |
| Support for ads like this one on the health effects of sugary drinks being shown on TV (% support) | 83 |
| Pre-Campaign | Post-Campaign | Post-Campaign | ||||||
|---|---|---|---|---|---|---|---|---|
| p-Value | Unaware | Aware | p-Value | Adj. OR^ (95% CI) | p-Value | |||
| (n = 1000) | (n = 1000) | (n = 453) | (n = 547) | |||||
| In your opinion, how much of a problem, if at all, are the following in South Africa? (% Very much/A lot) | ||||||||
| Overweight or obesity among adults | 73 | 75 | 0.169 | 73 | 77 | 0.155 | 1.25 (0.93, 1.68) | 0.135 |
| Overweight or obesity among children | 61 | 67 | 0.003 * | 65 | 69 | 0.162 | 1.22 (0.93, 1.60) | 0.162 |
| Under-nutrition | 55 | 61 | 0.004 * | 61 | 61 | 0.977 | 1.02 (0.78, 1.33) | 0.888 |
| Oral health | 49 | 56 | 0.001 * | 58 | 55 | 0.308 | 0.88 (0.68, 1.14) | 0.324 |
| Does being overweight or obese increase risk of…? (% Somewhat/greatly) | ||||||||
| An adult’s developing serious illnesses | 87 | 88 | 0.774 | 86 | 89 | 0.105 | 1.56 (1.05, 2.30) | 0.028 * |
| A child’s developing serious illnesses | 78 | 87 | <0.001 * | 84 | 89 | 0.021 * | 1.49 (1.02, 2.18) | 0.040 * |
| Diabetes | 96 | 94 | 0.008 * | 92 | 95 | 0.153 | 1.50 (0.89, 2.54) | 0.131 |
| Hypertension | 96 | 94 | 0.050 * | 94 | 93 | 0.255 | 0.76 (0.45, 1.29) | 0.313 |
| Heart disease, including heart attacks | 94 | 93 | 0.647 | 92 | 95 | 0.069 | 1.61 (0.96, 2.70) | 0.069 |
| Cancer | 64 | 65 | 0.608 | 65 | 65 | 0.790 | 0.97 (0.74, 1.26) | 0.803 |
| Premature death | 89 | 86 | 0.121 | 86 | 87 | 0.853 | 1.11 (0.76, 1.60) | 0.600 |
| In your opinion, to what extent does the consumption of sugary drinks lead to being overweight or obese? (% Very much/a great deal) | 66 | 71 | 0.007 * | 66 | 75 | 0.002 * | 1.62 (1.22, 2.16) | 0.001 * |
| Does drinking sugary drinks increase the risk of suffering from…? (% Somewhat/greatly) | ||||||||
| Diabetes | 71 | 71 | 0.126 | 69 | 73 | 0.084 | 1.27 (0.96, 1.69) | 0.094 |
| High blood pressure | 65 | 70 | 0.017 * | 67 | 71 | 0.175 | 1.28 (0.97, 1.69) | 0.088 |
| Cancer | 41 | 47 | 0.010 * | 45 | 48 | 0.437 | 1.15 (0.89, 1.49) | 0.288 |
| Obesity | 59 | 66 | 0.003 * | 62 | 68 | 0.055 | 1.29 (0.99, 1.69) | 0.061 |
| Dental problems | 45 | 55 | <0.001 * | 48 | 60 | <0.001 * | 1.64 (1.27, 2.13) | <0.001 * |
| Top three contributors to obesity are: (% that mentioned) | ||||||||
| Eating junk foods | 92 | 97 | <0.001 * | 97 | 97 | 0.736 | 0.98 (0.48, 2.00) | 0.952 |
| Drinking sugary drinks | 76 | 90 | <0.001 * | 89 | 91 | 0.426 | 1.04 (0.68, 1.58) | 0.860 |
| Lack of exercise | 80 | 88 | <0.001 * | 86 | 89 | 0.088 | 1.41 (0.96, 2.07) | 0.080 |
| Agreement with statements about obesity/sugary drinks (% agree) | ||||||||
| Childhood obesity is a problem in my country | 74 | 80 | 0.001 * | 82 | 78 | 0.235 | 0.89 (0.64, 1.23) | 0.464 |
| Too much sugar can cause severe health problems | 87 | 90 | 0.020 * | 91 | 90 | 0.353 | 0.82 (0.53, 1.27) | 0.368 |
| Advertising of sugary drinks and junk foods encourages children toward unhealthy diets | 76 | 82 | 0.001 * | 81 | 83 | 0.517 | 1.13 (0.81, 1.58) | 0.462 |
| As long as I exercise regularly, too much sugar will not harm my health | 56 | 64 | <0.001 * | 68 | 61 | 0.017 * | 0.72 (0.55, 0.95) | 0.019 * |
| The nutrition labels on food and drinks help me to make healthy choices | 77 | 79 | 0.254 | 80 | 79 | 0.543 | 0.87 (0.64, 1.20) | 0.394 |
| Concerned about the effect of drinking sugary drinks on your health? (% concerned) | -- | 58 | -- | 53 | 62 | 0.007 * | 1.52 (1.17, 1.97) | 0.002 * |
| Pre-Campaign | Post-Campaign | Post-Campaign | ||||||
|---|---|---|---|---|---|---|---|---|
| p-Value | Unaware | Aware | p-Value | Adj. OR^ (95% CI) | p-Value | |||
| (n = 1000) | (n = 1000) | (n = 453) | (n = 547) | |||||
| Government Support (%) | ||||||||
| It is important for my government to be involved in helping to solve the problem of obesity in South Africa | 73 | 84 | <0.001 * | 84 | 83 | 0.694 | 0.92 (0.65, 1.30) | 0.631 |
| I intend to support government efforts to increase children’s access to healthy foods and drinks | 80 | 84 | 0.014 * | 85 | 84 | 0.534 | 0.89 (0.63, 1.27) | 0.530 |
| Government actions to reduce the public’s access to sugary drinks will hurt our economy | 70 | 69 | 0.961 | 72 | 68 | 0.185 | 0.81 (0.62, 1.07) | 0.144 |
| The government should pass and enforce policies that discourage the consumption of junk food and sugary drinks | 67 | 76 | <0.001 * | 78 | 75 | 0.244 | 0.89 (0.65, 1.20) | 0.429 |
| I support public education advertising campaigns that warn about the damages of sugary drinks and junk food on your health | 79 | 81 | 0.344 | 78 | 83 | 0.023 * | 1.50 (1.09, 2.08) | 0.013 * |
| I support restrictions on the sale and/or provision of sugary drinks and junk food in school | 66 | 74 | <0.001 * | 70 | 77 | 0.015 * | 1.48 (1.11, 1.98) | 0.009 * |
| I support banning or restricting advertising and/or marketing of sugary drinks and junk foods that is targeted at children | 63 | 69 | 0.005 * | 65 | 72 | 0.008 * | 1.56 (1.18, 2.06) | 0.002 |
| I support requiring clear labels on the front of food and beverage packages that tell consumers if products are high in sugar, salt or fat | 80 | 81 | 0.339 | 80 | 82 | 0.474 | 1.17 (0.84, 1.62) | 0.355 |
| I support a ban on the marketing or advertising of junk food/sugary drinks on school property and at school activities | 61 | 69 | <0.001 * | 65 | 73 | 0.007 * | 1.54 (1.17, 2.03) | 0.002 * |
| I support a tax on sugary drinks if the money collected were invested in public programmes | 62 | 70 | <0.001 * | 65 | 74 | 0.002 * | 1.67 (1.26, 2.20) | <0.001 * |
| As part of its plan to address obesity in South Africa, the Department of Health recommends increasing the tax on sugary drinks, and the Department of Finance/Treasury has proposed a tax on sugar content that amounts to a roughly 20% tax on sugary drinks. Do you support or oppose the government’s proposal to tax sugary drinks? | 43 | 58 | <0.001 * | 54 | 62 | 0.012 * | 1.46 (1.13, 1.89) | 0.004 * |
| Pre-Campaign | Post-Campaign | p-Value | Post-Campaign | |||||
|---|---|---|---|---|---|---|---|---|
| Unaware | Aware | p-Value | Adj. OR^(95% CI) | p-Value | ||||
| (n = 1000) | (n = 1000) | (n = 453) | (n = 547) | |||||
| Behaviors and Behavioral Intentions | ||||||||
| Thought of the health-related harms of being overweight/obese? (% often) | 45 | 48 | 0.116 | 46 | 49 | 0.344 | 1.15 (0.89, 1.49) | 0.288 |
| Thought of the harms to your health of consuming sugary drinks? (% often) | 44 | 50 | 0.003 * | 52 | 49 | 0.419 | 0.95 (0.73, 1.23) | 0.691 |
| I would like my family to reduce their consumption of sugary drinks (% agree) | 67 | 79 | <0.001 * | 78 | 81 | 0.257 | 1.35 (0.98, 1.86) | 0.064 |
| I intend to… (% agree) | ||||||||
| Reduce my consumption of sugary drinks | 66 | 74 | <0.001 * | 73 | 75 | 0.490 | 1.14 (0.85, 1.54) | 0.378 |
| Reduce how often I offer sugary drinks to a child | 65 | 74 | <0.001 * | 72 | 75 | 0.362 | 1.25 (0.93, 1.68) | 0.133 |
| % confident in ability to… | <0.001 * | |||||||
| Reduce my consumption of sugary drinks | 65 | 73 | <0.001 * | 73 | 73 | 0.994 | 1.03 (0.77, 1.38) | 0.830 |
| Reduce my child’s consumption of sugary drinks | 66 | 78 | <0.001 * | 76 | 79 | 0.341 | 1.30 (0.85, 1.97) | 0.225 |
| % likely to... | ||||||||
| Reduce my consumption of sugary drinks in the next seven days | 52 | 58 | 0.003 * | 60 | 57 | 0.331 | 0.95 (0.73, 1.23) | 0.681 |
| Reduce my child’s consumption of sugary drinks in the next seven days | 54 | 64 | <0.001 * | 62 | 66 | 0.392 | 1.32 (0.91, 1.91) | 0.143 |
| Reduction in consumption of sugary drinks compared to six months ago | 23 | 27 | 0.020 * | 27 | 27 | 0.809 | 0.98 (0.74, 1.31) | 0.913 |
| Increase in consumption of water compared to six months ago | -- | 42 | -- | 39 | 45 | 0.048 * | 1.34 (1.03, 1.74) | 0.027 * |
© 2020 by the authors. Licensee MDPI, Basel, Switzerland. This article is an open access article distributed under the terms and conditions of the Creative Commons Attribution (CC BY) license (http://creativecommons.org/licenses/by/4.0/).
Share and Cite
Murukutla, N.; Cotter, T.; Wang, S.; Cullinan, K.; Gaston, F.; Kotov, A.; Maharjan, M.; Mullin, S. Results of a Mass Media Campaign in South Africa to Promote a Sugary Drinks Tax. Nutrients 2020, 12, 1878. https://doi.org/10.3390/nu12061878
Murukutla N, Cotter T, Wang S, Cullinan K, Gaston F, Kotov A, Maharjan M, Mullin S. Results of a Mass Media Campaign in South Africa to Promote a Sugary Drinks Tax. Nutrients. 2020; 12(6):1878. https://doi.org/10.3390/nu12061878
Chicago/Turabian StyleMurukutla, Nandita, Trish Cotter, Shuo Wang, Kerry Cullinan, Fathima Gaston, Alexey Kotov, Meena Maharjan, and Sandra Mullin. 2020. "Results of a Mass Media Campaign in South Africa to Promote a Sugary Drinks Tax" Nutrients 12, no. 6: 1878. https://doi.org/10.3390/nu12061878
APA StyleMurukutla, N., Cotter, T., Wang, S., Cullinan, K., Gaston, F., Kotov, A., Maharjan, M., & Mullin, S. (2020). Results of a Mass Media Campaign in South Africa to Promote a Sugary Drinks Tax. Nutrients, 12(6), 1878. https://doi.org/10.3390/nu12061878