Development of Fortified Citrus Olive Oils: From Their Production to Their Nutraceutical Properties on the Cardiovascular System

 ,
,  , ,
, ,  , , ,
, , ,  , ,
, ,  ,
,  and
and
Abstract

1. Introduction
2. Materials and Methods
2.1. Plant Material
2.2. Citrus Peels Cryomaceration and Citrus Olive Oil Extraction
2.3. Citrus Oils Chemical Analyses
2.3.1. Chemicals
2.3.2. Chemical Quality Standards
2.3.3. Total Phenol
2.3.4. Free-Radical Scavenging Capacity (FRSC)
2.3.5. Intensity of Bitterness (IB)
2.3.6. Carotenoids and Chlorophylls
2.3.7. Extraction and Detection of Tocopherols (Vitamin E)
2.3.8. HPLC-PDA/UV-ESI-MS/MS Analyses of Olive Oil Samples
2.3.9. Statistical Analysis of Chemical Data
2.4. Sensory Analysis
2.4.1. Quantitative Descriptive Analysis
2.4.2. Statistical Analysis of Sensory Data
2.5. In Vivo Evaluation of Nutraceutical Value of Olive Oils
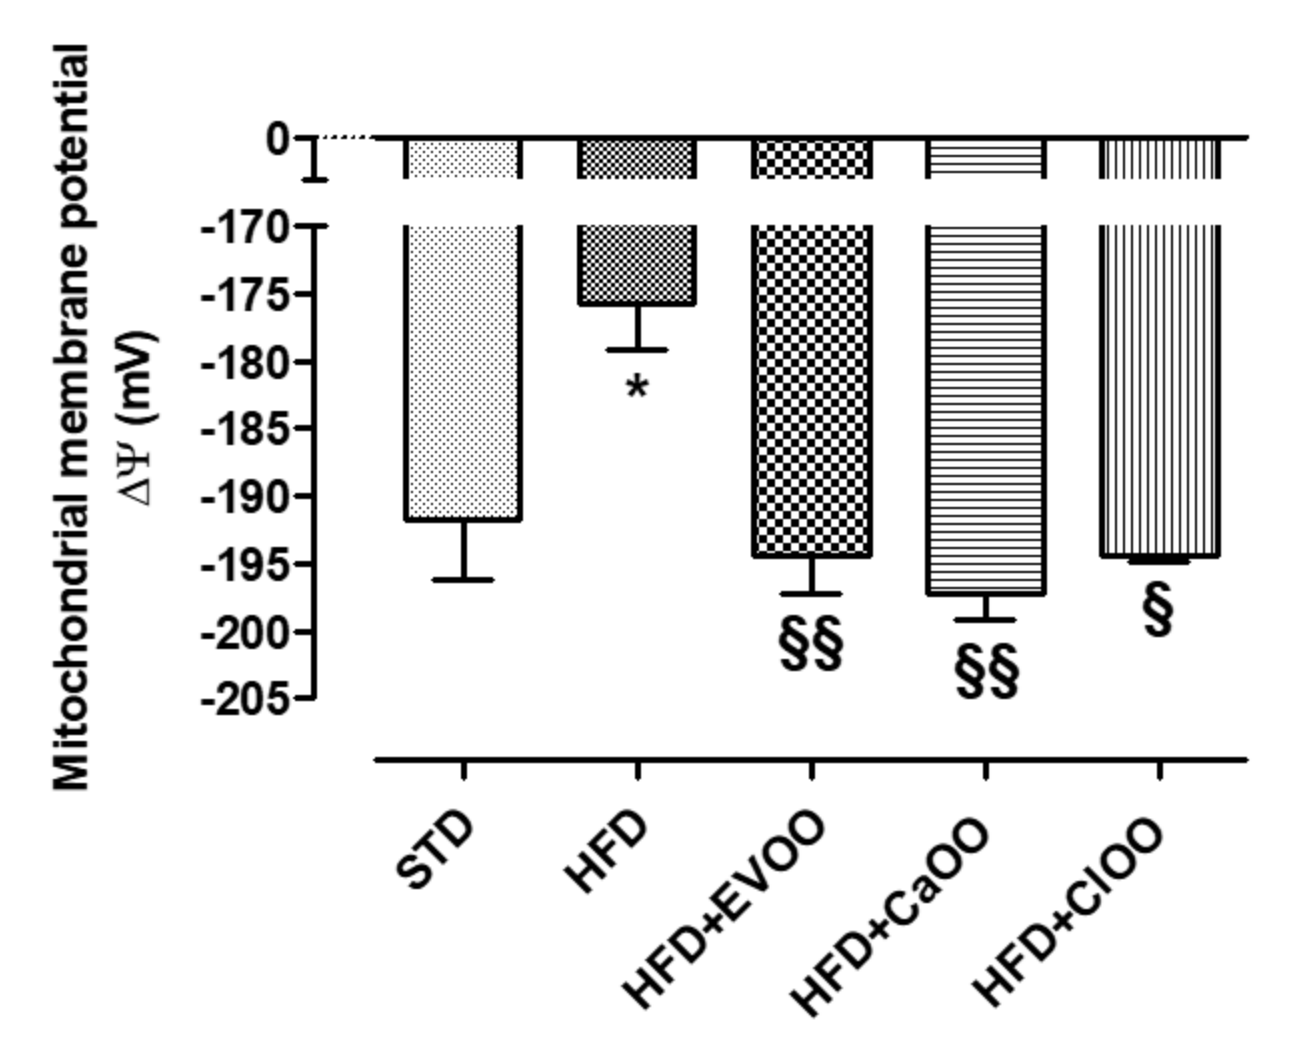
2.5.1. Functional Analysis of Cardiac Mitochondrial Membrane Potential
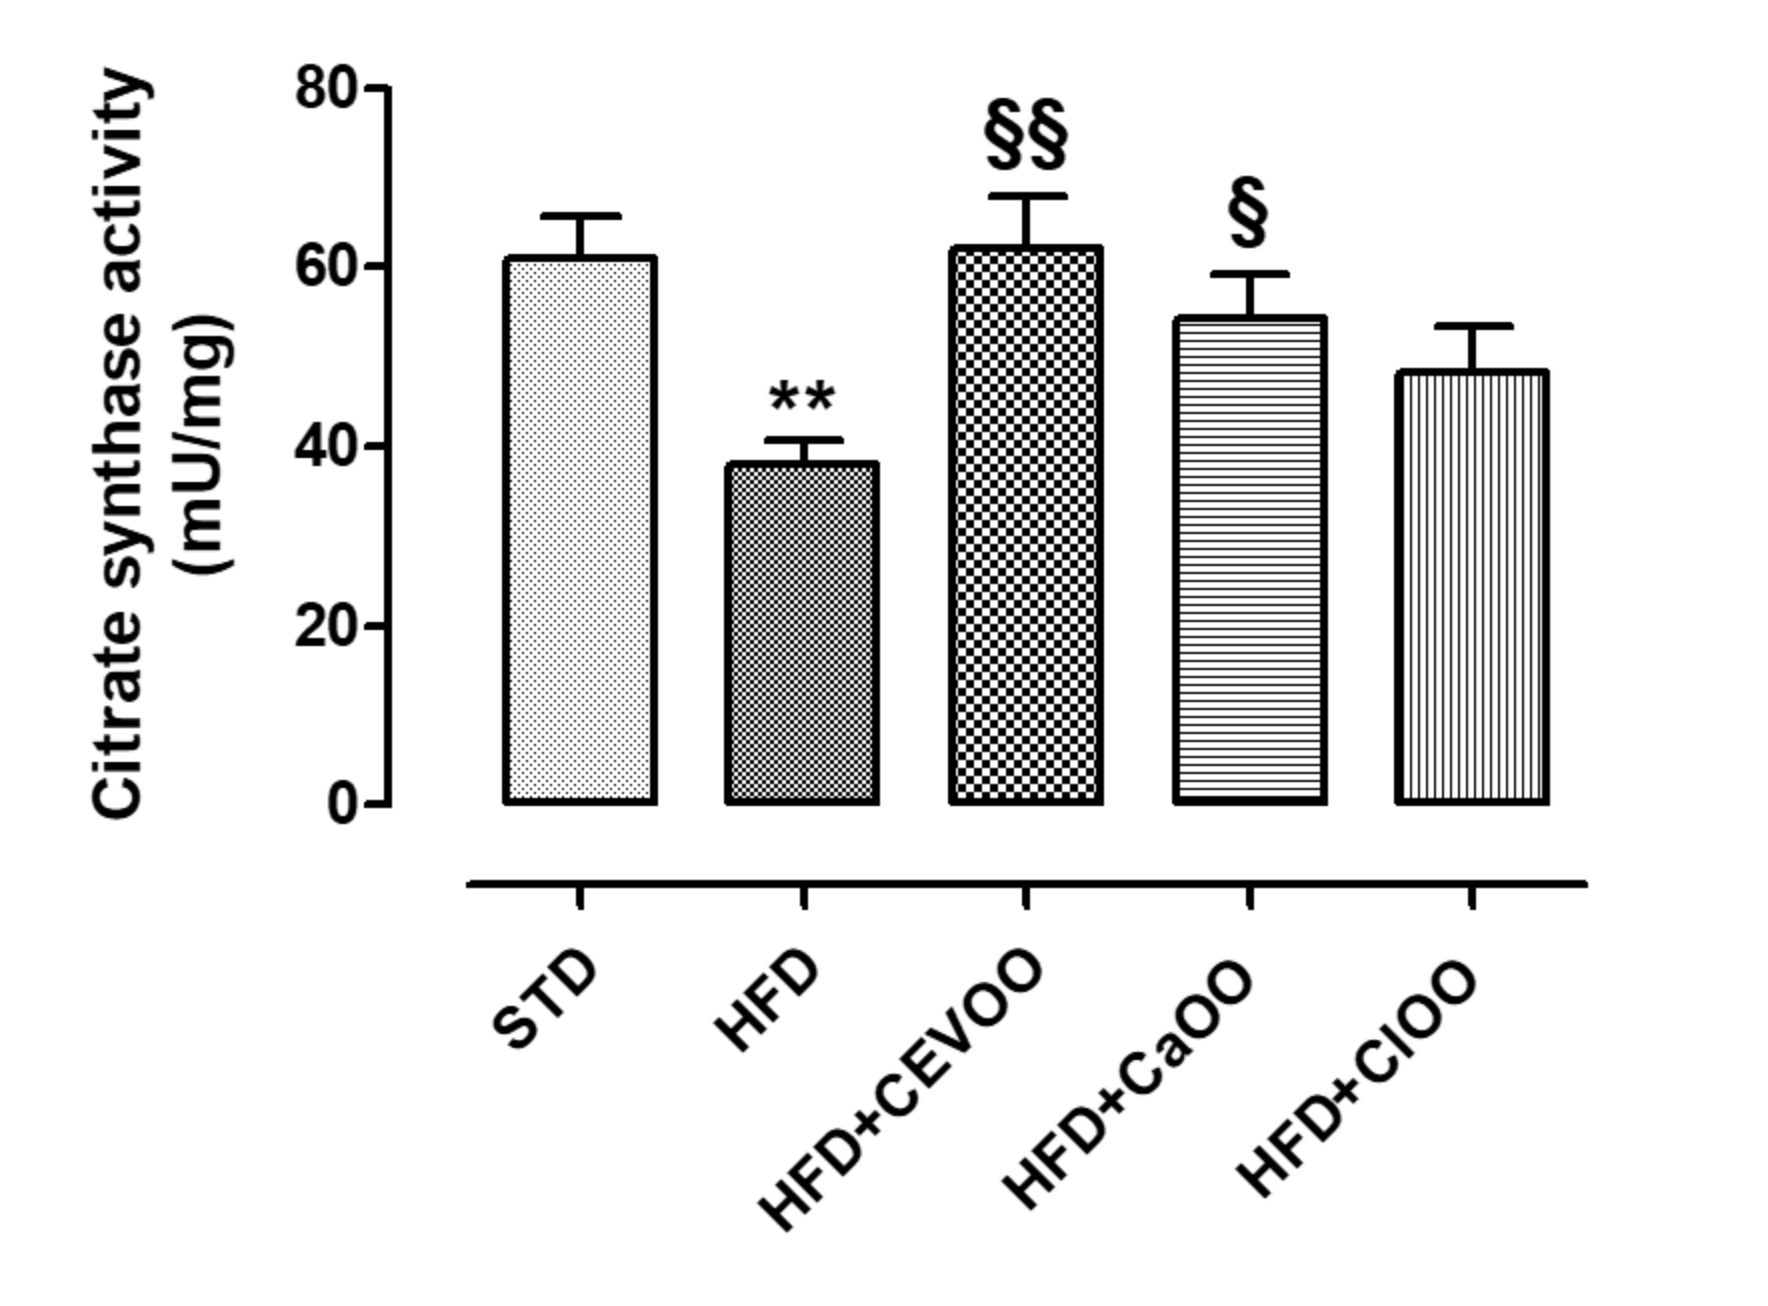
2.5.2. Evaluation of Citrate Synthase Activity on Adipose Tissue
2.5.3. Western Blot
2.5.4. Tube Formation from Vessel Rings
2.5.5. RNA Isolation and Quantitative RT-PCR
2.5.6. Immunohistochemical Analysis
3. Results
3.1. Oil Chemical Characterization
3.1.1. Legal Quality Parameters
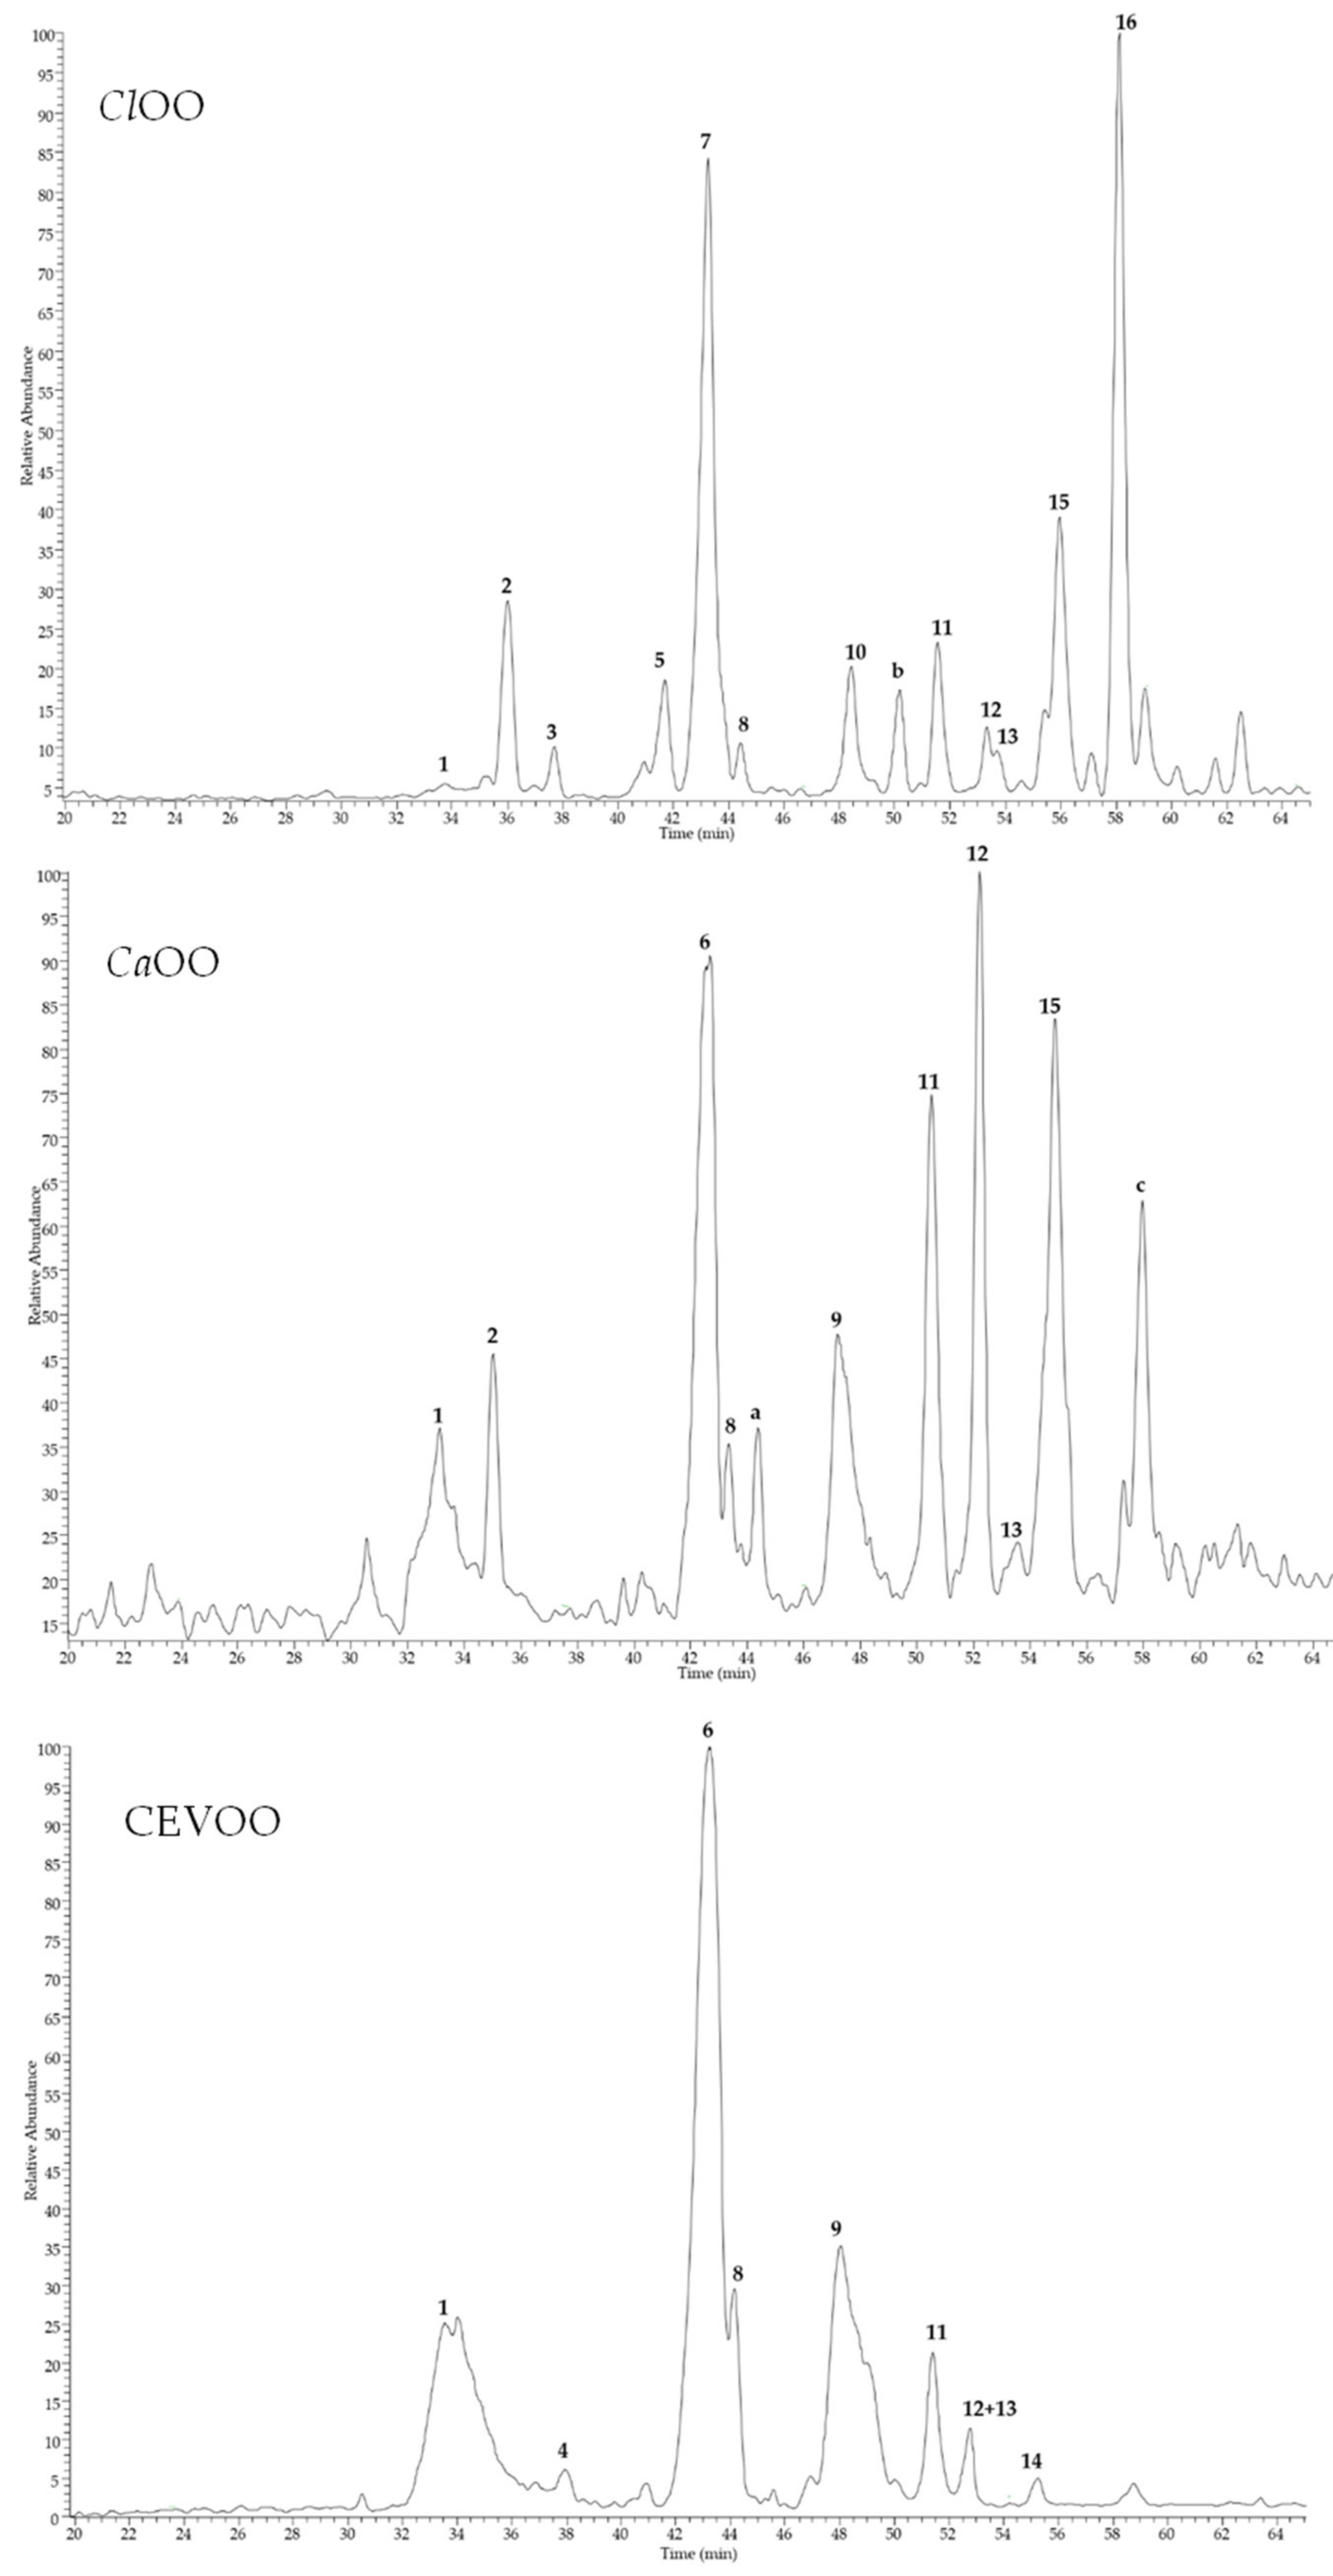
3.1.2. Phytochemical Composition
3.1.3. Sensory Profiles
3.2. Nutraceutical Features of Citrus Olive Oils
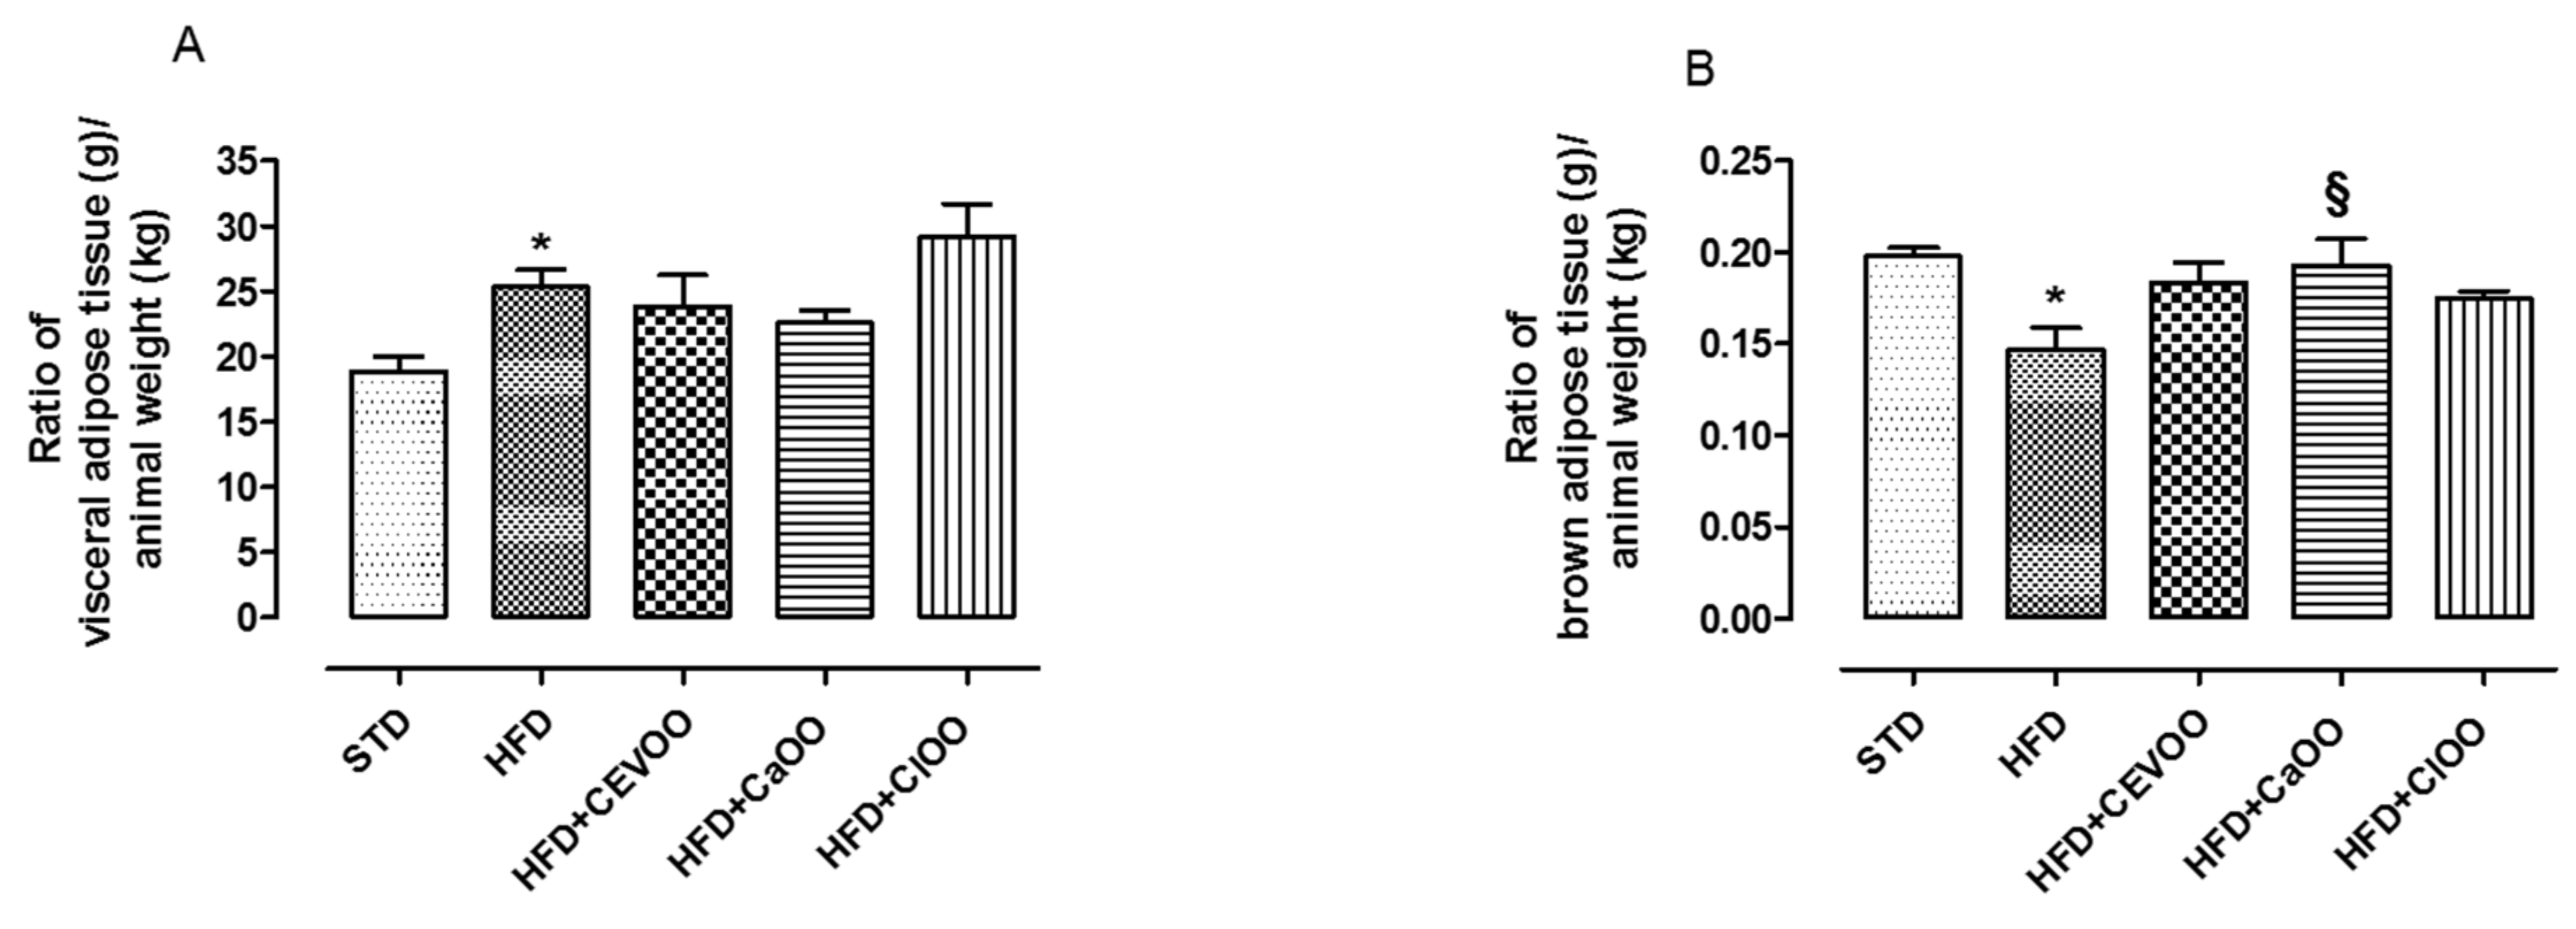
3.2.1. Effects of CEVOO, CaOO and ClOO Supplementation on Cardiometabolic Profile in HFD-Fed Rats
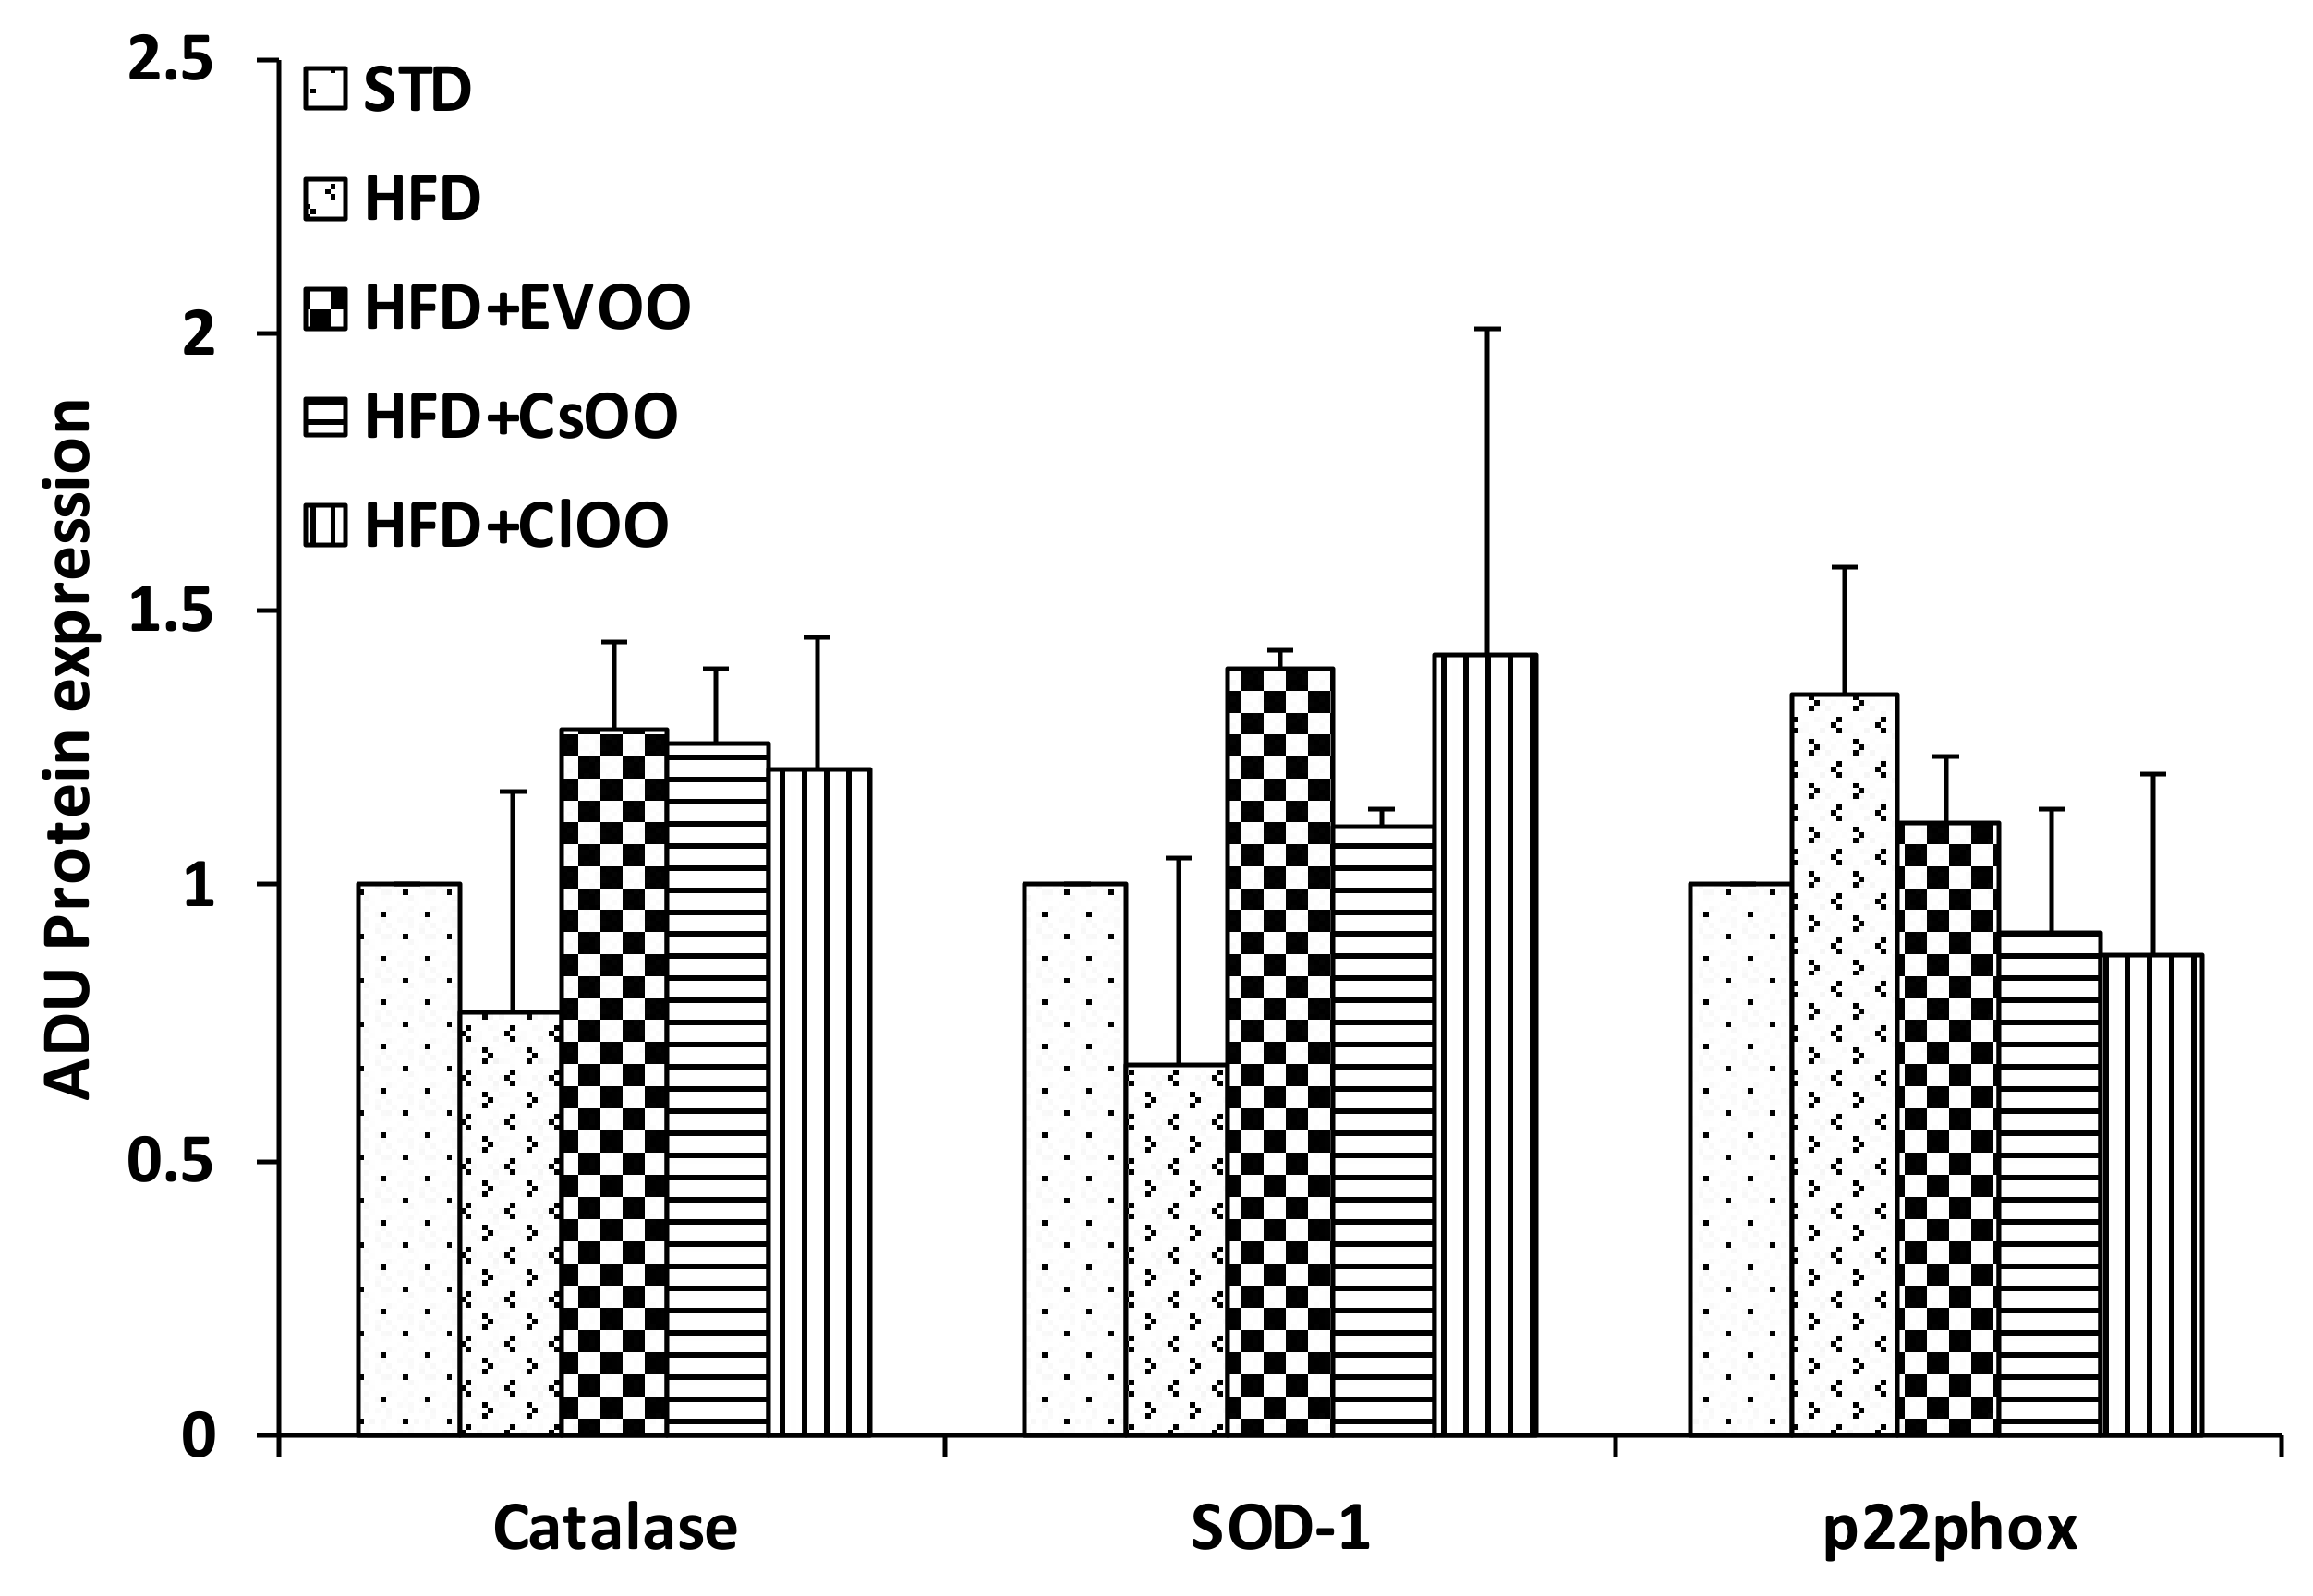
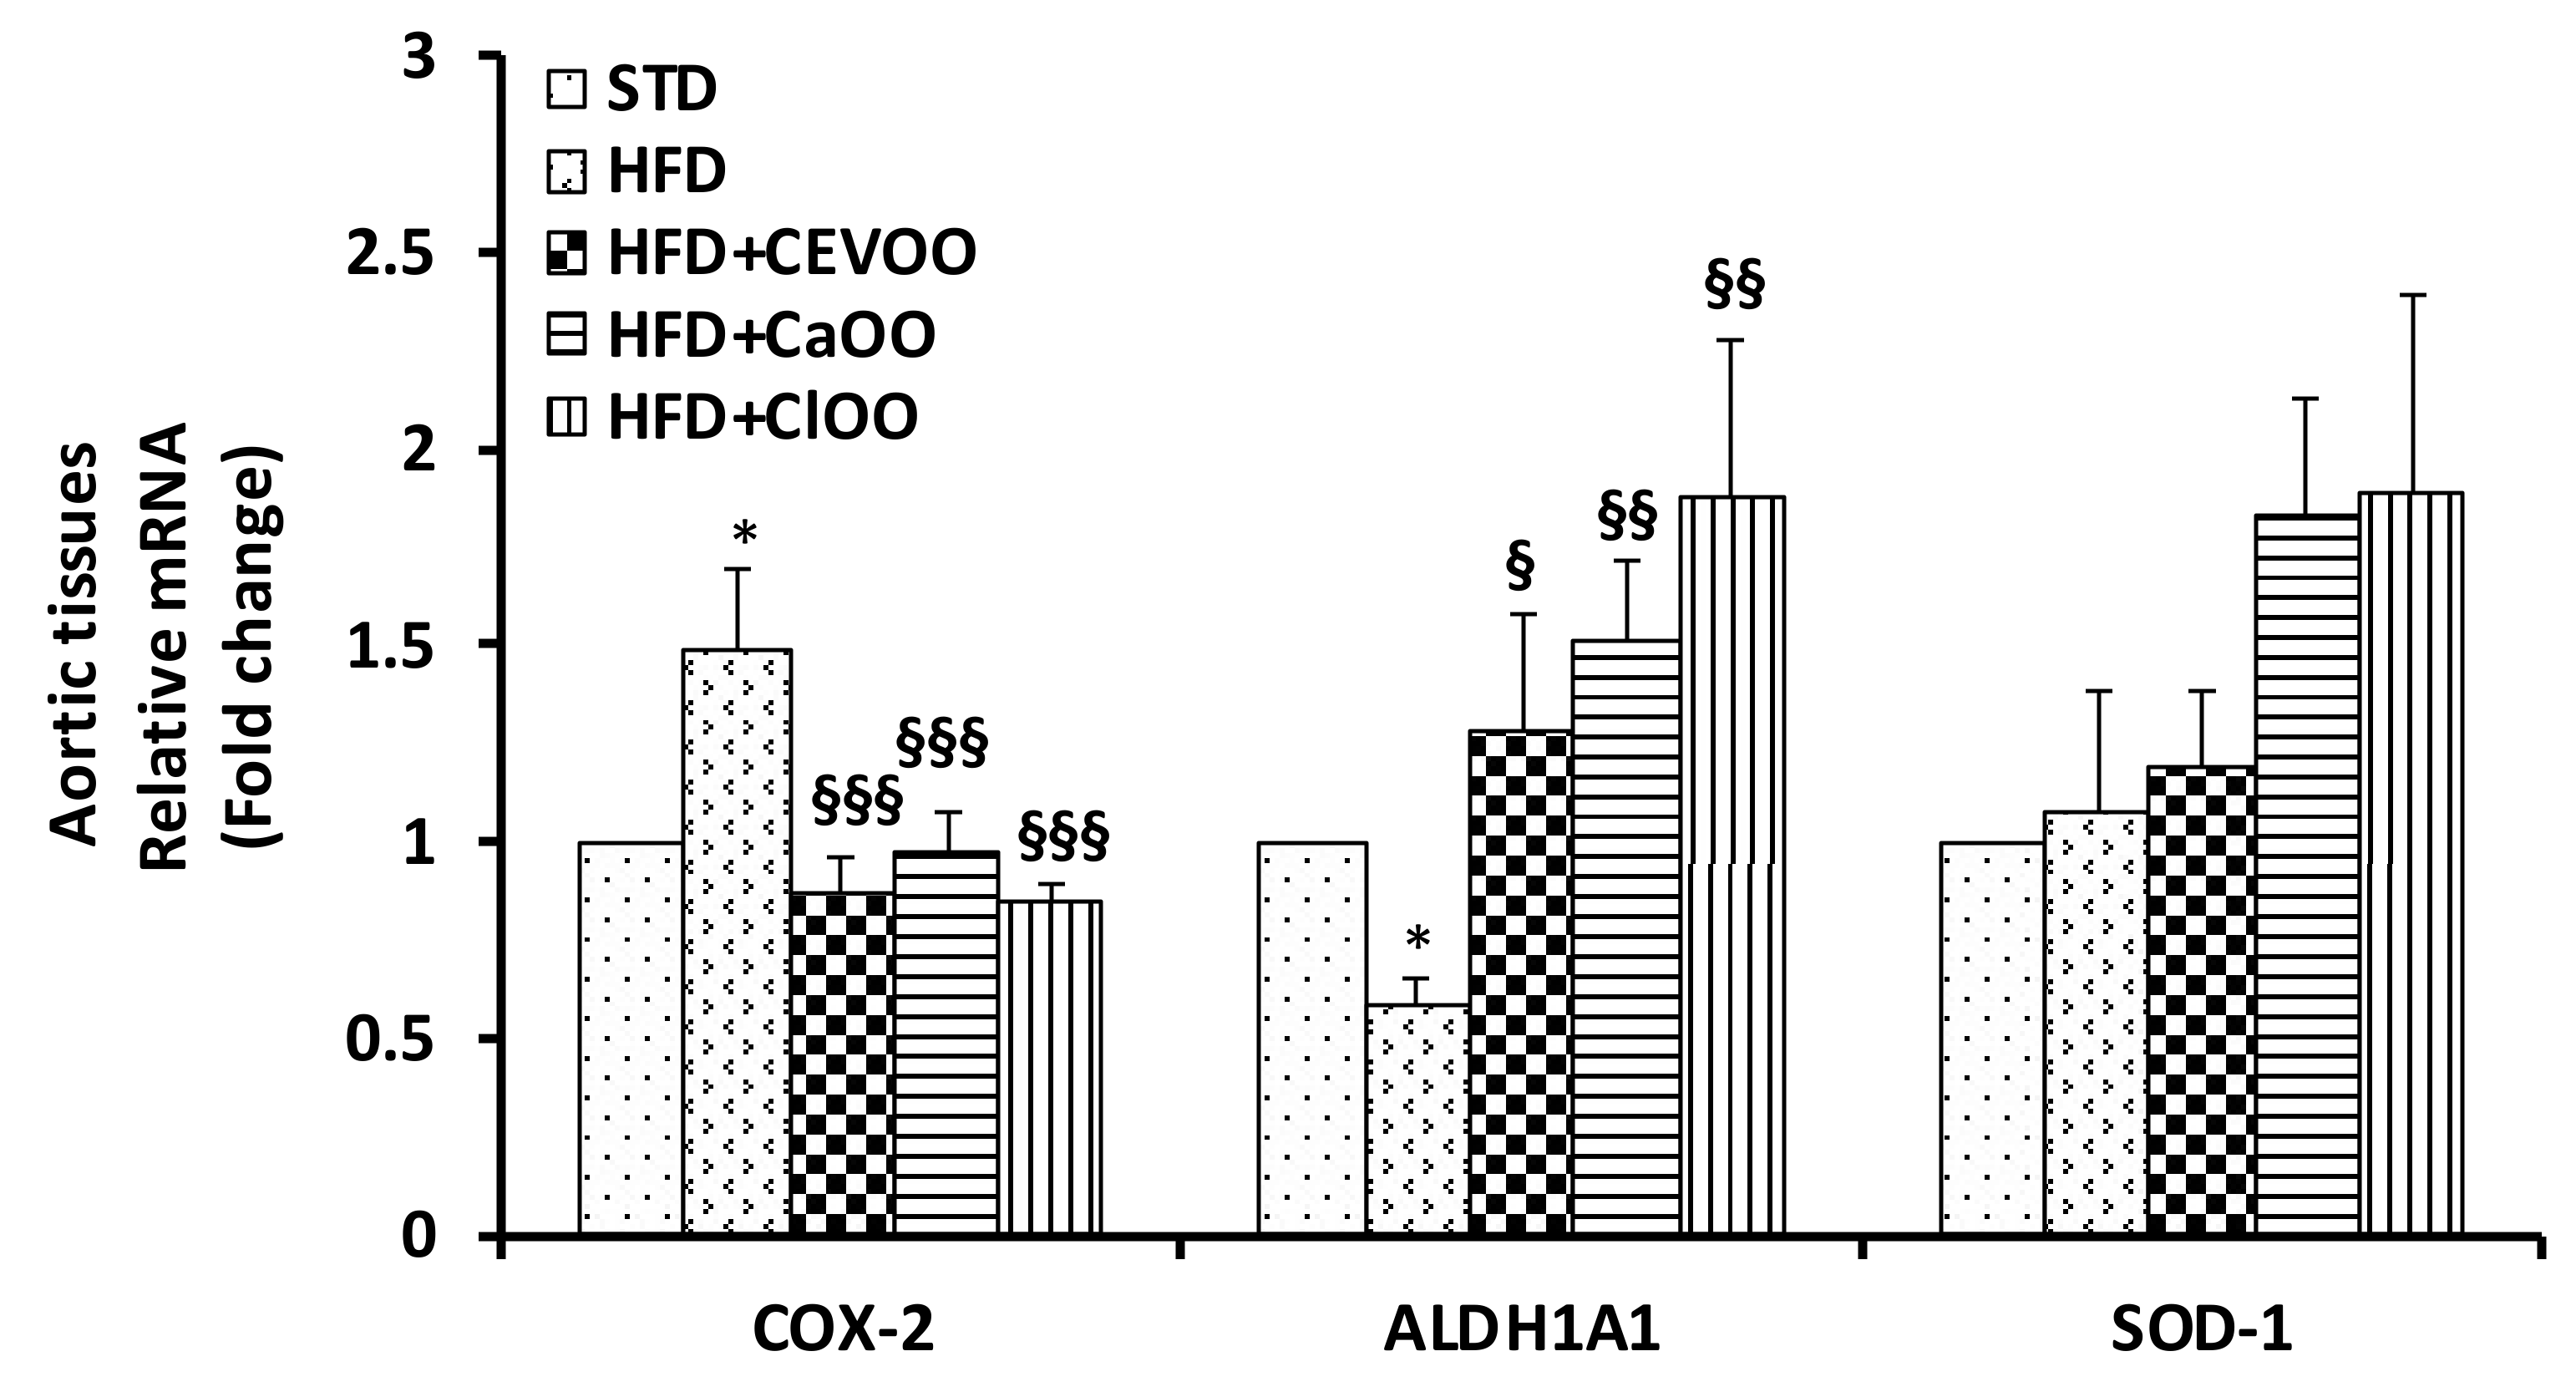
3.2.2. Effects of CEVOO, CaOO and ClOO Supplementation on Aortic Tissue Levels of Oxidative Stress Markers and Endothelial Function
Levels of Inflammatory and Oxidative Stress Markers
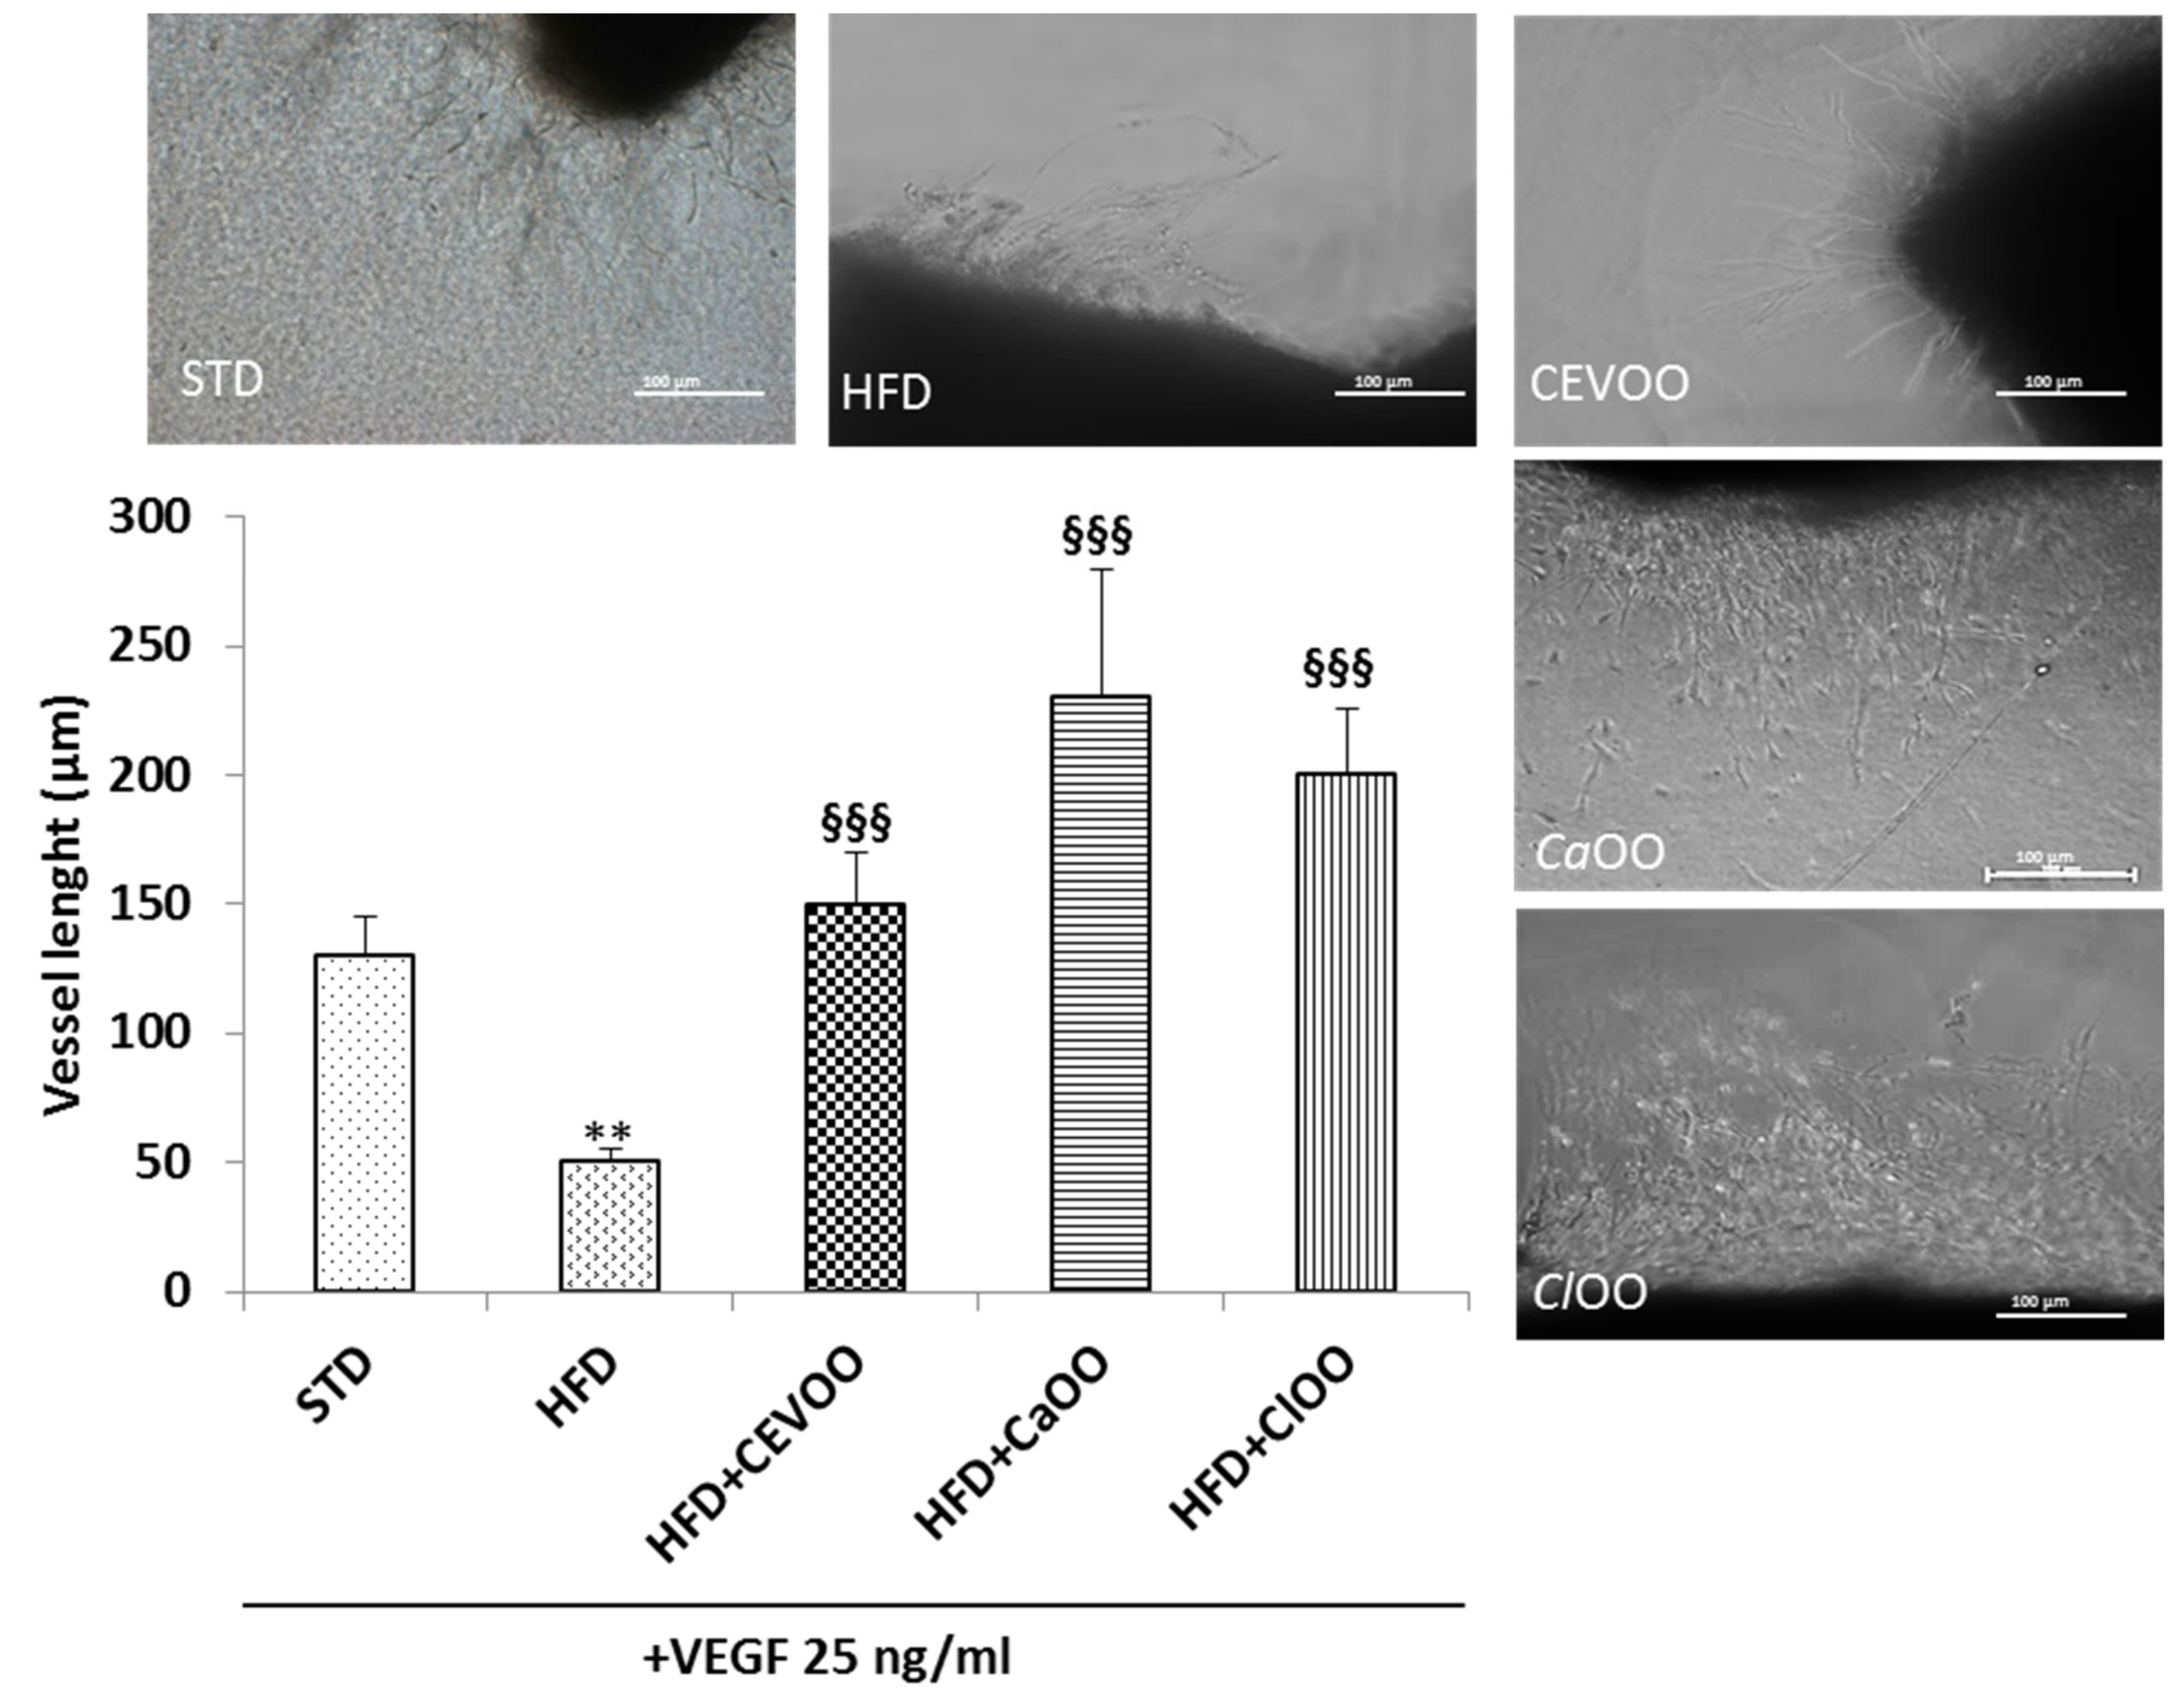
Endothelial Function
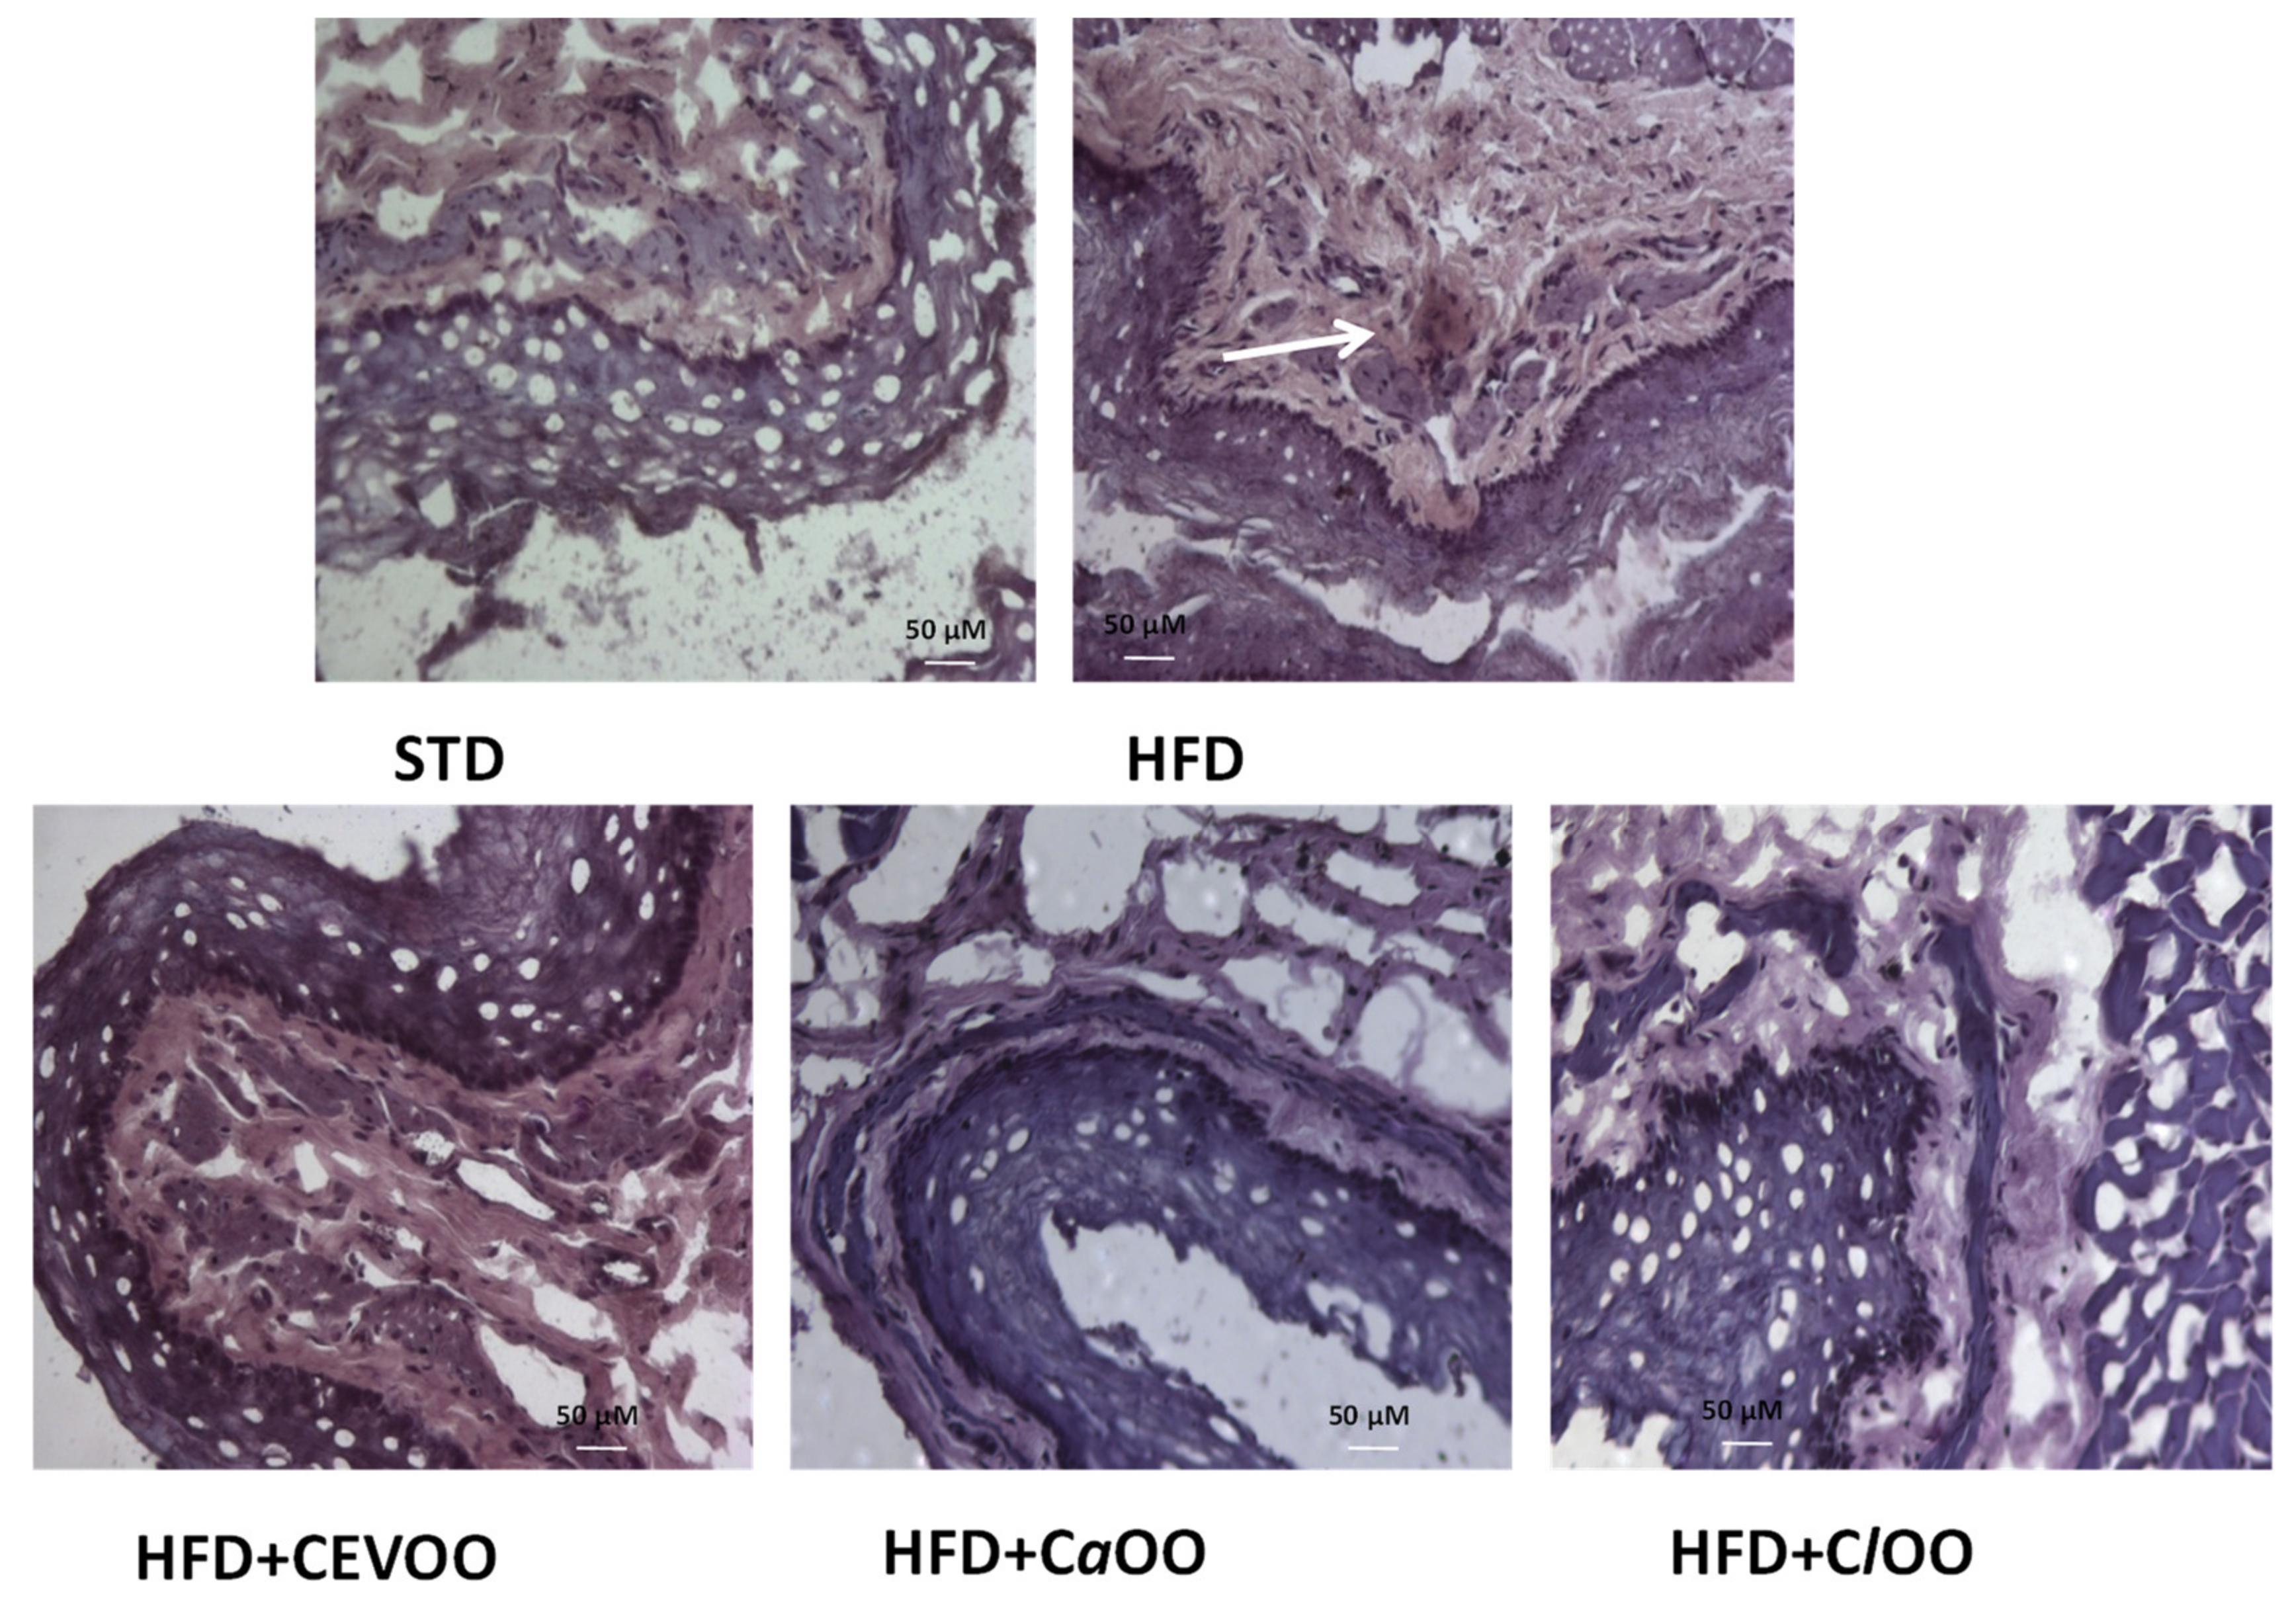
Histological Assessment of CD40 in Aortic Vessel Tissue
4. Discussion
5. Conclusions
Author Contributions
Funding
Conflicts of Interest
References
- Roohbakhsh, A.; Parhiz, H.; Soltani, F.; Rezaee, R.; Iranshahi, M. Molecular mechanisms behind the biological effects of hesperidin and hesperetin for the prevention of cancer and cardiovascular diseases. Life Sci. 2015, 124, 64–74. [Google Scholar] [CrossRef] [PubMed]
- Idoko, A. Exploitative Beneficial Effects of Citrus Fruits. In Citrus—Health Benefits and Production Technology; Peshawar, M.A., Ed.; IntechOpen Limited: London, UK, 2019; pp. 31–55. [Google Scholar]
- Testai, L.; Calderone, V. Nutraceutical Value of Citrus Flavanones and Their Implications in Cardiovascular Disease. Nutrients 2017, 9, 502. [Google Scholar] [CrossRef] [PubMed]
- Testai, L.; Martelli, A.; Marino, A.; D’Antongiovanni, V.; Ciregia, F.; Giusti, L.; Lucacchini, A.; Chericoni, S.; Breschi, M.; Calderone, V. The activation of mitochondrial BK potassium channels contributes to the protective effects of naringenin against myocardial ischemia/reperfusion injury. Biochem. Pharmacol. 2013, 85, 1634–1643. [Google Scholar] [CrossRef]
- Testai, L.; Martelli, A.; Cristofaro, M.; Breschi, M.C.; Calderone, V. Cardioprotective effects of different flavonoids against myocardial ischaemia/reperfusion injury in Langendorff-perfused rat hearts. J. Pharm. Pharmacol. 2013, 65, 750–756. [Google Scholar] [CrossRef] [PubMed]
- Saponara, S.; Testai, L.; Iozzi, D.; Martinotti, E.; Martelli, A.; Chericoni, S.; Sgaragli, G.; Fusi, F.; Calderone, V. (+/-)-naringenin as large conductance Ca 2+-activated K + (BK Ca) channel opener in vascular smooth muscle cells. Br. J. Pharmacol. 2006, 149, 1013–1321. [Google Scholar] [CrossRef] [PubMed]
- Testai, L.; Da Pozzo, E.; Piano, I.; Pistelli, L.; Gargini, C.; Breschi, M.C.; Braca, A.; Martini, C.; Martelli, A.; Calderone, V. The Citrus Flavanone Naringenin Produces Cardioprotective Effects in Hearts from 1 Year Old Rat, through Activation of mitoBK Channels. Front. Pharmacol. 2017, 8, 97. [Google Scholar] [CrossRef] [PubMed]
- Testai, L.; Piragine, E.; Piano, I.; Flori, L.; Da Pozzo, E.; Miragliotta, V.; Pirone, A.; Citi, V.; Mannelli, L.D.C.; Brogi, S.; et al. The Citrus Flavonoid Naringenin Protects the Myocardium from Ageing-Dependent Dysfunction: Potential Role of SIRT1. Oxidative Med. Cell. Longev. 2020, 2020, 4650207. [Google Scholar] [CrossRef]
- Da Pozzo, E.; Costa, B.; Cavallini, C.; Testai, L.; Martelli, A.; Calderone, V.; Martini, C. The Citrus Flavanone Naringenin Protects Myocardial Cells against Age-Associated Damage. Oxidative Med. Cell. Longev. 2017, 2017, 1–12. [Google Scholar] [CrossRef]
- Piano, I.; D’Antongiovanni, V.; Testai, L.; Calderone, V.; Gargini, C. A Nutraceutical Strategy to Slowing Down the Progression of Cone Death in an Animal Model of Retinitis Pigmentosa. Front. Mol. Neurosci. 2019, 13, 461. [Google Scholar] [CrossRef]
- Guo, C.; Zhang, H.; Guan, X.; Zhou, Z. The Anti-Aging Potential of Neohesperidin and Its Synergistic Effects with Other Citrus Flavonoids in Extending Chronological Lifespan of Saccharomyces Cerevisiae BY4742. Molecules 2019, 24, 4093. [Google Scholar] [CrossRef]
- Miler, M.; Živanović, J.; Ajdžanović, V.; Oreščanin-Dušić, Z.; Milenković, D.; Ristić, A.K.; Blagojević, D.; Milošević, V.; Šošić-Jurjević, B. Citrus flavanones naringenin and hesperetin improve antioxidant status and membrane lipid compositions in the liver of old-aged Wistar rats. Exp. Gerontol. 2016, 84, 49–60. [Google Scholar] [CrossRef] [PubMed]
- Shen, C.-Y.; Wan, L.; Wang, T.-X.; Jiang, J.-G. Citrus aurantium L. var. amara Engl. inhibited lipid accumulation in 3T3-L1 cells and Caenorhabditis elegans and prevented obesity in high-fat diet-fed mice. Pharmacol. Res. 2019, 147, 104347. [Google Scholar] [CrossRef] [PubMed]
- De Leo, M.; Piragine, E.; Pirone, A.; Braca, A.; Pistelli, L.; Calderone, V.; Miragliotta, V.; Testai, L. Protective Effects of Bergamot (Citrus bergamia Risso & Poiteau) Juice in Rats Fed with High-Fat Diet. Planta Medica 2019, 86, 180–189. [Google Scholar] [CrossRef] [PubMed]
- Morrow, N.M.; Burke, A.C.; Samsoondar, J.P.; Seigel, K.E.; Wang, A.; Telford, D.E.; Sutherland, B.G.; O’Dwyer, C.; Steinberg, G.R.; Fullerton, M.D.; et al. The citrus flavonoid nobiletin confers protection from metabolic dysregulation in high-fat-fed mice independent of AMPK. J. Lipid Res. 2020, 61, 387–402. [Google Scholar] [CrossRef] [PubMed]
- Janabi, A.H.W.; Kamboh, A.A.; Saeed, M.; Xiaoyu, L.; BiBi, J.; Majeed, F.; Naveed, M.; Mughal, M.J.; Korejo, N.A.; Kamboh, R.; et al. Flavonoid-rich foods (FRF): A promising nutraceutical approach against lifespan-shortening diseases. Iran. J. Basic. Med. Sci. 2020, 23, 140–153. [Google Scholar]
- Alquézar, B.; Rodrigo, M.; Zacarías, L. Carotenoid biosynthesis and their regulation in citrus fruits. Tree For. Sci. Biotechnol. 2008, 2, 23–37. [Google Scholar]
- Johnson, E.J. The role of carotenoids in human health. Nutr. Clin. Care 2002, 5, 56–65. [Google Scholar] [CrossRef]
- Gualdani, R.; Cavalluzzi, M.M.; Lentini, G.; Habtemariam, S. The Chemistry and Pharmacology of Citrus Limonoids. Molecules 2016, 21, 1530. [Google Scholar] [CrossRef]
- Venturi, F.; Sanmartin, C.; Taglieri, I.; Nari, A.; Andrich, G.; Terzuoli, E.; Donnini, S.; Nicolella, C.; Zinnai, A. Development of Phenol-Enriched Olive Oil with Phenolic Compounds Extracted from Wastewater Produced by Physical Refining. Nutrients 2017, 9, 916. [Google Scholar] [CrossRef]
- Sanmartin, C.; Taglieri, I.; Venturi, F.; Macaluso, M.; Zinnai, A.; Tavarini, S.; Botto, A.; Serra, A.; Conte, G.; Flamini, G.; et al. Flaxseed Cake as a Tool for the Improvement of Nutraceutical and Sensorial Features of Sourdough Bread. Foods 2020, 9, 204. [Google Scholar] [CrossRef]
- Allen, L.; De Benoist, B.; Dary, O.; Hurrell, R. (Eds.) Guidelines On Food Fortification With Micronutrients; World Health Organization and Food and Agriculture Organization of the United Nations: Geneva, Switzerland, 2006; p. 341. [Google Scholar]
- Ascrizzi, R.; Taglieri, I.; Sgherri, C.; Flamini, G.; Macaluso, M.; Sanmartin, C.; Venturi, F.; Quartacci, M.F.; Pistelli, L.; Zinnai, A. Nutraceutical Oils Produced by Olives and Citrus Peel of Tuscany Varieties as Sources of Functional Ingredients. Molecules 2018, 24, 65. [Google Scholar] [CrossRef]
- Sanmartin, C.; Taglieri, I.; Macaluso, M.; Sgherri, C.; Ascrizzi, R.; Flamini, G.; Venturi, F.; Quartacci, M.F.; Luro, F.; Curk, F.; et al. Cold-Pressing Olive Oil in the Presence of Cryomacerated Leaves of Olea or Citrus: Nutraceutical and Sensorial Features. Molecules 2019, 24, 2625. [Google Scholar] [CrossRef] [PubMed]
- Venturi, F.; Bartolini, S.; Sanmartin, C.; Orlando, M.; Taglieri, I.; Macaluso, M.; Lucchesini, M.; Trivellini, A.; Zinnai, A.; Mensuali-Sodi, A. Potato Peels as a Source of Novel Green Extracts Suitable as Antioxidant Additives for Fresh-Cut Fruits. Appl. Sci. 2019, 9, 2431. [Google Scholar] [CrossRef]
- European Commission. Commission Implementing Regulation (EU) No 1348/2013 of 16 December 2013 amending Regulation (EEC) No 2568/91 on the characteristics of olive oil and olive-residue oil and on the relevant methods of analysis. Off. J. Eur. Union. 2013, L338, 31–67. [Google Scholar]
- Sanmartin, C.; Venturi, F.; Macaluso, M.; Nari, A.; Quartacci, M.F.; Sgherri, C.; Flamini, G.; Taglieri, I.; Ascrizzi, R.; Andrich, G.; et al. Preliminary Results About the Use of Argon and Carbon Dioxide in the Extra Virgin Olive Oil (EVOO) Storage to Extend Oil Shelf Life: Chemical and Sensorial Point of View. Eur. J. Lipid Sci. Technol. 2018, 120. [Google Scholar] [CrossRef]
- Brand-Williams, W.; Cuvelier, M.; Berset, C. Use of a free radical method to evaluate antioxidant activity. LWT 1995, 28, 25–30. [Google Scholar] [CrossRef]
- Sgherri, C.; Micaelli, F.; Andreoni, N.; Baldanzi, M.; Ranieri, A. Retention of phenolic compounds and antioxidant properties in potato bread obtained from a dough enriched with a powder from the purple cv. Vitelotte. Agrochimica 2016, 60, 312–328. [Google Scholar]
- Fellegrini, N.; Ke, R.; Yang, M.; Rice-Evans, C. Screening of dietary carotenoids and carotenoid-rich fruit extracts for antioxidant activities applying 2,2′-azinobis(3-ethylenebenzothiazoline-6-sulfonic acid radical cation decolorization assay. In Methods in Enzymology; Elsevier: Amsterdam, The Netherlands, 1999; Volume 299, pp. 379–389. [Google Scholar]
- Mínguez-Mosquera, M.I.; Rejano-Navarro, L.; Gandul-Rojas, B.; Gómez, A.H.S.; Garrido-Fernández, J. Color-pigment correlation in virgin olive oil. J. Am. Oil Chem. Soc. 1991, 68, 332–336. [Google Scholar] [CrossRef]
- Sgherri, C.; Kadlecova, Z.; Pardossi, A.; Navari-Izzo, F.; Izzo, R. Irrigation with Diluted Seawater Improves the Nutritional Value of Cherry Tomatoes. J. Agric. Food Chem. 2008, 56, 3391–3397. [Google Scholar] [CrossRef]
- Gimeno, E.; I Castellote, A.; Lamuela-Raventós, R.M.; De La Torre, M.C.; López-Sabater, M.C. Rapid determination of vitamin E in vegetable oils by reversed-phase high-performance liquid chromatography. J. Chromatogr. A 2000, 881, 251–254. [Google Scholar] [CrossRef]
- Tarchoune, I.; Sgherri, C.; Eddouzi, J.; Zinnai, A.; Quartacci, M.F.; Zarrouk, M. Olive Leaf Addition Increases Olive Oil Nutraceutical Properties. Molecules 2019, 24, 545. [Google Scholar] [CrossRef] [PubMed]
- Galatro, A.; Simontacchi, M.; Puntarulo, S. Free radical generation and antioxidant content in chloroplasts from soybean leaves exposed to ultraviolet-B. Physiol. Plant. 2001, 113, 564–570. [Google Scholar] [CrossRef]
- Braca, A.; Sinisgalli, C.; De Leo, M.; Muscatello, B.; Cioni, P.L.; Milella, L.; Ostuni, A.; Giani, S.; Sanogo, R. Phytochemical Profile, Antioxidant and Antidiabetic Activities of Adansonia digitata L. (Baobab) from Mali, as a Source of Health-Promoting Compounds. Molecules 2018, 23, 3104. [Google Scholar] [CrossRef] [PubMed]
- Venturi, F.; Andrich, G.; Sanmartin, C.; Scalabrelli, G.; Ferroni, G.; Zinnai, A. The expression of a full-bodied red wine as a function of the characteristics of the glass utilized for the tasting. CyTA—J. Food 2014, 12, 291–297. [Google Scholar] [CrossRef]
- Leung, V.; Rousseau-Blass, F.; Beauchamp, G.; Pang, D.S.J. ARRIVE has not ARRIVEd: Support for the ARRIVE (Animal Research: Reporting of in vivo Experiments) guidelines does not improve the reporting quality of papers in animal welfare, analgesia or anesthesia. PLoS ONE 2018, 13, e0197882. [Google Scholar] [CrossRef]
- Bellumori, M.; Cecchi, L.; Innocenti, M.; Clodoveo, M.L.; Corbo, F.; Mulinacci, N. The EFSA Health Claim on Olive Oil Polyphenols: Acid Hydrolysis Validation and Total Hydroxytyrosol and Tyrosol Determination in Italian Virgin Olive Oils. Molecules 2019, 24, 2179. [Google Scholar] [CrossRef] [PubMed]
- Ciccone, V.; Terzuoli, E.; Donnini, S.; Giachetti, A.; Morbidelli, L.; Ziche, M. Stemness marker ALDH1A1 promotes tumor angiogenesis via retinoic acid/HIF-1α/VEGF signalling in MCF-7 breast cancer cells. J. Exp. Clin. Cancer Res. 2018, 37, 1–16. [Google Scholar] [CrossRef]
- Finetti, F.; Donnini, S.; Giachetti, A.; Morbidelli, L.; Ziche, M. Prostaglandin E 2 Primes the Angiogenic Switch via a Synergic Interaction With the Fibroblast Growth Factor-2 Pathway. Circ. Res. 2009, 105, 657–666. [Google Scholar] [CrossRef]
- Aparicio, R.; Harwood, J. (Eds.) Handbook of Olive Oil, 2nd ed.; Springer: Boston, MA, USA, 2000. [Google Scholar]
- Tamma, G.; Valenti, G. Evaluating the Oxidative Stress in Renal Diseases: What Is the Role for S-Glutathionylation? Antioxid. Redox Signal. 2016, 25, 147–164. [Google Scholar] [CrossRef]
- Peri, C. (Ed.) The Extra-Virgin Olive Oil Handbook, 1st ed.; John Wiley & Sons, Ltd.: Chichester, UK, 2014; p. 366. [Google Scholar]
- Taamalli, A.; Maqueda, M.; Zarrouk, M.; Segura-Carretero, A.; Gutierrez, A.F. Determination of apolar and minor polar compounds and other chemical parameters for the discrimination of six different varieties of Tunisian extra-virgin olive oil cultivated in their traditional growing area. Eur. Food Res. Technol. 2010, 231, 965–975. [Google Scholar] [CrossRef]
- Condelli, N.; Caruso, M.C.; Galgano, F.; Russo, D.; Milella, L.; Favati, F. Prediction of the antioxidant activity of extra virgin olive oils produced in the Mediterranean area. Food Chem. 2015, 177, 233–239. [Google Scholar] [CrossRef] [PubMed]
- Moyano, M.J.; Heredia, F.J.; Meléndez-Martínez, A.J. The Color of Olive Oils: The Pigments and Their Likely Health Benefits and Visual and Instrumental Methods of Analysis. Compr. Rev. Food Sci. Food Saf. 2010, 9, 278–291. [Google Scholar] [CrossRef]
- Rosales, F.G.; Perdiguero, S.; Gutierrez, R.; Olías, J.M. Evaluation of the bitter taste in virgin olive oil. J. Am. Oil Chem. Soc. 1992, 69, 394–395. [Google Scholar] [CrossRef]
- De La Torre-Carbot, K.; Jáuregui, O.; Gimeno, E.; Castellote-Bargalló, A.I.; Lamuela-Raventós, R.M.; López-Sabater, M.C. Characterization and Quantification of Phenolic Compounds in Olive Oils by Solid-Phase Extraction, HPLC-DAD, and HPLC-MS/MS. J. Agric. Food Chem. 2005, 53, 4331–4340. [Google Scholar] [CrossRef] [PubMed]
- Villalba, R.G.; Pancorbo, A.C.; Oliveras-Ferraros, C.; Vázquez-Martín, A.; Menendez, J.A.; Segura-Carretero, A.; Gutierrez, A.F. Characterization and quantification of phenolic compounds of extra-virgin olive oils with anticancer properties by a rapid and resolutive LC-ESI-TOF MS method. J. Pharm. Biomed. Anal. 2010, 51, 416–429. [Google Scholar] [CrossRef] [PubMed]
- Pérez-Trujillo, M.; Maqueda, M.; Segura-Carretero, A.; Gutierrez, A.F.; Parella, T. Separation and Identification of Phenolic Compounds of Extra Virgin Olive Oil from Olea europaea L. by HPLC-DAD-SPE-NMR/MS. Identification of a New Diastereoisomer of the Aldehydic Form of Oleuropein Aglycone. J. Agric. Food Chem. 2010, 58, 9129–9136. [Google Scholar] [CrossRef]
- Brito, A.; Ramirez, J.E.; Areche, C.; Sepulveda, B.; Simirgiotis, M. HPLC-UV-MS Profiles of Phenolic Compounds and Antioxidant Activity of Fruits from Three Citrus Species Consumed in Northern Chile. Molecules 2014, 19, 17400. [Google Scholar] [CrossRef]
- Da Pozzo, E.; De Leo, M.; Faraone, I.; Milella, L.; Cavallini, C.; Piragine, E.; Testai, L.; Calderone, V.; Pistelli, L.; Braca, A.; et al. Antioxidant and Antisenescence Effects of Bergamot Juice. Oxidative Med. Cell. Longev. 2018, 2018, 1–14. [Google Scholar] [CrossRef]
- Obied, H.K.; Karuso, P.; Prenzler, P.D.; Robards, K. Novel Secoiridoids with Antioxidant Activity from Australian Olive Mill Waste. J. Agric. Food Chem. 2007, 55, 2848–2853. [Google Scholar] [CrossRef]
- Fabre, N.; Rustan, I.; Hoffmann, E.; Leclercq, J.Q. Determination of flavone, flavonol, and flavanone aglycones by negative ion liquid chromatography electrospray ion trap mass spectrometry. J. Am. Soc. Mass Spectrom. 2001, 12, 707–715. [Google Scholar] [CrossRef]
- Rekik, O.; Ben Mansour, A.; Bouaziz, M. Evaluation of phenolic composition and antioxidant activity changes in olive flowers during development using HPLC/DAD and LC-MS/MS. Electrophoresis 2017, 39, 1663–1672. [Google Scholar] [CrossRef] [PubMed]
- Patil, J.R.; Jayaprakasha, G.K.; Murthy, K.C.; Chetti, M.B.; Patil, B.S. Characterization of Citrus aurantifolia bioactive compounds and their inhibition of human pancreatic cancer cells through apoptosis. Microchem. J. 2010, 94, 108–117. [Google Scholar] [CrossRef]
- Moreno-Fernández, S.; Garcés-Rimón, M.; González, C.; Uranga, J.; López-Miranda, V.; Vera, G.; Miguel, M. Pepsin egg white hydrolysate ameliorates metabolic syndrome in high-fat/high-dextrose fed rats. Food Funct. 2018, 9, 78–86. [Google Scholar] [CrossRef] [PubMed]
- Wang, L.; Fan, W.; Zhang, M.; Zhang, Q.; Li, L.; Wang, J.; Zhu, L.; Wei, D.; Peng, W.; Wu, C.-J. Antiobesity, Regulation of Lipid Metabolism, and Attenuation of Liver Oxidative Stress Effects of Hydroxy-α-sanshool Isolated from Zanthoxylum bungeanum on High-Fat Diet-Induced Hyperlipidemic Rats. Oxidative Med. Cell. Longev. 2019, 2019, 5852494. [Google Scholar] [CrossRef]
- Xu, X.; Ying, Z.; Cai, M.; Xu, Z.; Li, Y.; Jiang, S.; Tzan, K.; Wang, A.; Parthasarathy, S.; He, G.; et al. Exercise ameliorates high-fat diet-induced metabolic and vascular dysfunction, and increases adipocyte progenitor cell population in brown adipose tissue. Am. J. Physiol. Integr. Comp. Physiol. 2011, 300, R1115–R1125. [Google Scholar] [CrossRef]
- Covas, M.I. Olive oil and the cardiovascular system. Pharmacol. Res. 2007, 55, 175–186. [Google Scholar] [CrossRef]
- Dow, C.A.; Stauffer, B.L.; Greiner, J.J.; DeSouza, C. Influence of habitual high dietary fat intake on endothelium-dependent vasodilation. Appl. Physiol. Nutr. Metab. 2015, 40, 711–715. [Google Scholar] [CrossRef]
- Aplin, A.C.; Fogel, E.; Zorzi, P.; Nicosia, R.F. Chapter 7 The Aortic Ring Model of Angiogenesis. In Angiogenesis: In Vitro Systems; David, A.C., Ed.; Elsevier: Amsterdam, The Netherlands, 2008; pp. 119–136. [Google Scholar]
- Zinnai, A.; Venturi, F.; Quartacci, M.F.; Sanmartin, C.; Favati, F.; Andrich, G. Solid carbon dioxide to promote the extraction of extra-virgin olive oil. Grasas Aceites 2016, 67, e121. [Google Scholar] [CrossRef]
- Zinnai, A.; Venturi, F.; Sanmartin, C.; Taglieri, I.; Andrich, G. The utilization of solid carbon dioxide in the extraction of extra-virgin olive oil: VOO/EVOO yield and quality as a function of extraction conditions adopted. Agro Food Ind. Hi Tech 2015, 26, 24–26. [Google Scholar]
- Eggersdorfer, M.; Wyss, A. Carotenoids in human nutrition and health. Arch. Biochem. Biophys. 2018, 652, 18–26. [Google Scholar] [CrossRef]
- Concepción, M.R.; Avalos, J.; Bonet, M.L.; Boronat, A.; Gómez-Gómez, L.; Hornero-Méndez, D.; Limón, M.C.; Meléndez-Martínez, A.J.; Olmedilla-Alonso, B.; Palou, A.; et al. A global perspective on carotenoids: Metabolism, biotechnology, and benefits for nutrition and health. Prog. Lipid Res. 2018, 70, 62–93. [Google Scholar] [CrossRef] [PubMed]
- Mencherini, T.; Campone, L.; Piccinelli, A.L.; Mesa, M.G.; Sánchez, D.M.; Aquino, R.P.; Rastrelli, L. HPLC-PDA-MS and NMR Characterization of a Hydroalcoholic Extract of Citrus aurantium L. var. amara Peel with Antiedematogenic Activity. J. Agric. Food Chem. 2012, 61, 1686–1693. [Google Scholar] [CrossRef]
- Kratz, M.; Baars, T.; Guyenet, S. The relationship between high-fat dairy consumption and obesity, cardiovascular, and metabolic disease. Eur. J. Nutr. 2012, 52, 1–24. [Google Scholar] [CrossRef] [PubMed]
- Cercato, C.; Fonseca, F.A.H. Cardiovascular risk and obesity. Diabetol. Metab. Syndr. 2019, 11, 74. [Google Scholar] [CrossRef] [PubMed]
- Flori, L.; Donnini, S.; Calderone, V.; Zinnai, A.; Taglieri, I.; Venturi, F.; Testai, L. The Nutraceutical Value of Olive Oil and Its Bioactive Constituents on the Cardiovascular System. Focusing on Main Strategies to Slow Down Its Quality Decay during Production and Storage. Nutrients 2019, 11, 1962. [Google Scholar] [CrossRef]
- Shankar, K.; Kumar, D.; Gupta, S.; Varshney, S.; Rajan, S.; Srivastava, A.; Gupta, A.; Gupta, A.P.; Vishwakarma, A.L.; Gayen, J.R.; et al. Role of brown adipose tissue in modulating adipose tissue inflammation and insulin resistance in high-fat diet fed mice. Eur. J. Pharmacol. 2019, 854, 354–364. [Google Scholar] [CrossRef]
- Chen, D.; Li, X.; Zhang, L.; Zhu, M.; Gao, L. A high-fat diet impairs mitochondrial biogenesis, mitochondrial dynamics, and the respiratory chain complex in rat myocardial tissues. J. Cell. Biochem. 2018, 119, 9602. [Google Scholar] [CrossRef]
- Taylor, L.E.; Gillis, E.E.; Musall, J.B.; Baban, B.; Sullivan, J. High-fat diet-induced hypertension is associated with a proinflammatory T cell profile in male and female Dahl salt-sensitive rats. Am. J. Physiol. Circ. Physiol. 2018, 315, H1713–H1723. [Google Scholar] [CrossRef]
- De Souza, P.A.L.; Marcadenti, A.; Portal, V.L. Effects of Olive Oil Phenolic Compounds on Inflammation in the Prevention and Treatment of Coronary Artery Disease. Nutrients 2017, 9, 1087. [Google Scholar] [CrossRef]
- Summerhill, V.; Karagodin, V.; Grechko, A.; Myasoedova, V.; Orekhov, A. Vasculoprotective Role of Olive Oil Compounds via Modulation of Oxidative Stress in Atherosclerosis. Front. Cardiovasc. Med. 2018, 5. [Google Scholar] [CrossRef]
- Katsarou, A.I.; Kaliora, A.C.; Papalois, A.; Chiou, A.; Kalogeropoulos, N.; Agrogiannis, G.; Andrikopoulos, N.K. Serum lipid profile and inflammatory markers in the aorta of cholesterol-fed rats supplemented with extra virgin olive oil, sunflower oils and oil-products. Int. J. Food Sci. Nutr. 2015, 66, 766–773. [Google Scholar] [CrossRef] [PubMed]
- Visioli, F.; Franco, M.; Toledo, E.; Luchsinger, J.; Willett, W.C.; Hu, F.B.; A Martínez-González, M. Olive oil and prevention of chronic diseases: Summary of an International conference. Nutr. Metab. Cardiovasc. Dis. 2018, 28, 649–656. [Google Scholar] [CrossRef] [PubMed]
- Davignon, J.; Ganz, P. Role of Endothelial Dysfunction in Atherosclerosis. Circulation 2004, 109. [Google Scholar] [CrossRef] [PubMed]
- Chen, C.; Chai, H.; Wang, X.; Jiang, J.; Jamaluddin, S.; Liao, D.; Zhang, Y.; Wang, H.; Bharadwaj, U.; Zhang, S.; et al. Soluble CD40 ligand induces endothelial dysfunction in human and porcine coronary artery endothelial cells. Blood 2008, 112, 3205–3216. [Google Scholar] [CrossRef]


| Parameter | |
|---|---|
| Maturity index (0:7) | 4.1 ± 0.1 |
| Dry Matter (%) | 51.57 ± 0.03 |
| Oil Content (% d.m.) | 19.70 ± 0.04 |
| Sample Codes | Description |
|---|---|
| CEVOO | Control Extra Virgin Olive Oil |
| CaOO | Olive Oil obtained with 25% w/w of Citrus aurantium peels |
| ClOO | Olive Oil obtained with 25% w/w of Citrus limon peels |
| STD | HFD | |
|---|---|---|
| Protein (%) | 14.3 | 12.9 |
| Fat (%) | 4.0 | 19.2 |
| Carbohydrate (%) | 48.0 | 50.2 |
| Calories from Protein (%) | 20.0 | 12.1 |
| Calories from Fat (%) | 13.0 | 40.7 |
| Calories from Carbohydrate (%) | 67.0 | 47.2 |
| Na (mg/kg) | 1000.0 | 2234.1 |
| K (mg/kg) | 6000.0 | 5284.3 |
| Mg (mg/kg) | 2000.0 | 1294.0 |
| Ca (mg/kg) | 7000.0 | 6312.5 |
| Mn (mg/kg) | 100.0 | 47.7 |
| Fe (mg/kg) | 175.0 | 253.2 |
| Cu (mg/kg) | 15.0 | 18.5 |
| Zn (mg/kg) | 70.0 | 48.7 |
| P (mg/kg) | 6000.0 | 5144.2 |
| Cl (mg/kg) | 3000.0 | 3508.1 |
| Vitamin A (IU/g) | 6.0 | 7.4 |
| Vitamin E (IU/kg) | 120.0 | 29.8 |
| Vitamin D3 (IU/g) | 0.6 | 1.0 |
| Vitamin K3 (mg/kg) | 20.0 | 13.3 |
| Vitamin B1 (mg/kg) | 12.0 | 4.2 |
| Cholesterol (mg/kg) | - | 12488 |
| EVOO [26] | CEVOO | CaOO | ClOO | Significance Level 1 | |
|---|---|---|---|---|---|
| Free acidity (% oleic acid w/w) | ≤0.80 | 0.74 a | 0.60 b | 0.74 a | ** |
| Peroxide index (mEq. O2/kg oil) | ≤20.00 | 8.90 a | 9.60 a | 7.90 b | ** |
| K232 | ≤2.50 | 1.98 c | 2.32 b | 2.39 a | *** |
| K270 | ≤0.22 | 0.14 b | 0.19 a | 0.18 b | ** |
| ≤0.01 | 0.00 | 0.00 | 0.00 | n.s. |
| CEVOO | CaOO | ClOO | Significance Level 1 | |
|---|---|---|---|---|
| Total carotenoid (ppm lutein) | 4.62 b | 8.38 a | 4.09 c | *** |
| Total chlorophylls (ppm pheophytin) | 9.93 a | 6.47 c | 7.06 b | *** |
| α-tocopherol (ppmVitamin E) | 117 | 123 | 110 | n.s. |
| γ-tocopherol (ppmVitamin E) | 3.4 | 3.6 | 2.0 | n.s. |
| δ-tocopherol (ppmVitamin E) | 0.53 | 1.8 | 1.2 | n.s. |
| Total phenols (ppm gallic acid) | 144 | 140 | 139 | n.s. |
| FRSC ABTS (μmol TEAC/mL) | 0.40 a | 0.30 b | 0.30 b | *** |
| FRSC DPPH (μmol TEAC/mL) | 0.34 a | 0.24 b | 0.26 b | *** |
| Hydroxtyrosol (ppm) | 0.06 a | 0.02 c | 0.04 b | *** |
| Tyrosol (ppm) | 2.7 a | 1.6 b | 1.2 c | *** |
| Intensity of Bitterness | 0.85 a | 0.84 a | 0.48 b | *** |
| Peak * | Compound | tR (min) | MW (u) | [M − H]− (m/z) | [M + HCOO]− (m/z) | MS/MS Ions ** | UV | Sample |
|---|---|---|---|---|---|---|---|---|
| Secoiridoids | ||||||||
| 1 | Elenolic acid (EA) | 33.5 | 242 | 241 | 209, 165, 139, 127, 121, 101, 95 | 248 | CEVOO CaOO ClOO | |
| 2 | Hydroxylated elenolic acid | 36.0 | 258 | 257 | 225, 181, 137 | 243 | CaOO ClOO | |
| 4 | Oleacein, isomer I (oleuropein aglycone decarboxymethyl or 3,4-DHPEA-EDA) | 37.9 | 320 | 319 | 365 | 199 | 250 | CEVOO |
| 6 | Hydroxytyrosol acyclodihydroelenolate (HT-ACDE) | 43.0 | 382 | 381 | 363, 349, 335, 303, 285, 245, 151 | 239, 277 | CEVOO CaOO | |
| 8 | Oleacin, isomer II | 44.1 | 320 | 319 | 365 | 199, 181, 153, 111 | 250 | CEVOO CaOO ClOO |
| 9 | Oleuropein aglycone (3,4-DHPEA-EA) | 48.0 | 378 | 377 | 345, 307, 275, 149 | 247, 286 | CEVOO CaOO | |
| 12 | Oleuropein derivative | 52.8 | 378 | 377 | 333, 301, 181, 275, 149 | 249, 277 | CEVOO CaOO ClOO | |
| 13 | Ligstroside aglycone (p-HPEA-EA) | 52.8 | 362 | 361 | 335, 317, 291, 259 | 276 | CEVOO CaOO ClOO | |
| Flavones | ||||||||
| 11 | Luteolin | 51.1 | 286 | 285 | 267, 241, 217, 199, 175, 151 | 267, 352 | CEVOO CaOO ClOO | |
| 14 | Apigenin | 55.0 | 270 | 269 | 241, 225, 201, 183, 181, 151 | 268, 342 | CEVOO | |
| 15 | Diosmetin | 54.9 | 300 | 299 | 284, 271, 227 | 268, 344 | CaOO ClOO | |
| Limonoids | ||||||||
| 3 | Limonexic/isolimonexic acid | 37.7 | 502 | 501 | 457, 413, 371, 279 | 215 | ClOO | |
| 5 | Citrusin (isomer I) | 41.7 | 546 | 545 | 501, 457, 397, 353 | 215 | ClOO | |
| 7 | Citrusin (isomer II) | 43.2 | 546 | 545 | 501, 457, 397, 353 | 215 | ClOO | |
| 10 | Limonin *** | 48.4 | 470 | 469 | 515 | 469, 427, 411 | 210 | ClOO |
| 16 | Nomilinic acid | 58.1 | 532 | 531 | 489, 471, 427, 369, 307 | 210 | ClOO |
| Quantitative Parameter | CEVOO | CaOO | ClOO | Significance Level 1 | |
|---|---|---|---|---|---|
| View | Clarity | 3.80 b | 6.57 a | 6.43 a | *** |
| Green shadows | 2.41 ab | 1.20 b | 3.84 a | ** | |
| Yellow shadows | 3.67 b | 6.10 a | 2.74 c | *** | |
| Smell | Smell intensity | 4.26 | 4.23 | 5.34 | n.s |
| Green fruity | 0.27 | 0.33 | 0.44 | n.s. | |
| Ripe fruity | 3.01 a | 0.64 b | 1.14 ab | ** | |
| Cut grass | 0.40 | 0.56 | 0.00 | n.s | |
| Olive leaf | 0.54 | 0.46 | 0.00 | n.s | |
| Lemon | 0.00 b | 0.00 b | 5.29 a | *** | |
| Orange | 0.21 b | 3.17 a | 0.00 c | *** | |
| Candied fruit | 1.36 | 1.39 | 2.64 | n.s | |
| Other | 1.71 | 0.00 | 0.86 | n.s. | |
| Taste | Bitter | 0.33 c | 3.67 b | 4.66 a | *** |
| Pungent | 0.40 b | 3.29 a | 1.37 ab | ** | |
| Sweet | 3.43 a | 0.27 b | 0.74 b | *** | |
| Aftertaste | 0.49 | 0.00 | 0.93 | n.s. | |
| Persistence | 1.84 b | 4.09 a | 3.70 ab | ** | |
| Defects | Heating | 0.00 | 0.00 | 0.00 | - |
| Mold/humidity | 0.00 | 0.00 | 0.00 | - | |
| Winey/vinegary | 0.00 | 0.00 | 0.00 | - | |
| Sludge | 0.00 | 0.00 | 0.00 | - | |
| Metallic | 0.00 | 0.00 | 0.00 | - | |
| Rancid | 0.00 | 0.00 | 0.00 | - | |
| STD | HFD | HFD + CEVOO | HFD + CaOO | HFD + ClOO | |
|---|---|---|---|---|---|
| Total Cholesterol (mg/dL) | 75.3 ± 3.1 | 111.4 ± 4.1 ** | 94.8 ± 7.1 | 73.5 ± 4.7 §§§ | 81.7 ± 10.7 § |
| Triglycerides (mg/dL) | 77.3 ± 6.3 | 113.4 ± 13.4 * | 64.4 ± 3.2 § | 72.8 ± 14.8 § | 68.7 ± 3.2 § |
| Cholesterol HDL (mg/dL) | 48.7 ± 2.9 | 22.3 ± 1.9 *** | 23.2 ± 3.5 | 22.5 ± 3.1 | 21.3 ± 2.3 |
| Cholesterol LDL (mg/dL) | 31.7 ± 10.0 | 60.4 ± 5.2 * | 57.3 ± 6.7 | 42.6 ± 6.3 | 46.7 ± 12.2 |
| Cholesterol non-LDL (mg/dL) | 26.5 ± 1.2 | 88.8 ± 3.6 *** | 71.5 ± 6.3 § | 51.2 ± 5.2 §§§ | 60.3 ± 12.1 §§ |
| Cardiovascular risk (Total Cholesterol/Cholesterol HDL) | 1.6 ± 0.1 | 5.2 ± 0.4 *** | 4.4 ± 0.6 | 3.4 ± 0.5 | 4.1 ± 1.0 |
| Blood Glucose (mg/dL) | 64.3 ± 4.8 | 79.4 ± 8.9 | 62.8 ± 4.1 | 67.8 ± 10.1 | 52.5 ± 11.5 |
© 2020 by the authors. Licensee MDPI, Basel, Switzerland. This article is an open access article distributed under the terms and conditions of the Creative Commons Attribution (CC BY) license (http://creativecommons.org/licenses/by/4.0/).
Share and Cite
Flori, L.; Macaluso, M.; Taglieri, I.; Sanmartin, C.; Sgherri, C.; De Leo, M.; Ciccone, V.; Donnini, S.; Venturi, F.; Pistelli, L.; et al. Development of Fortified Citrus Olive Oils: From Their Production to Their Nutraceutical Properties on the Cardiovascular System. Nutrients 2020, 12, 1557. https://doi.org/10.3390/nu12061557
Flori L, Macaluso M, Taglieri I, Sanmartin C, Sgherri C, De Leo M, Ciccone V, Donnini S, Venturi F, Pistelli L, et al. Development of Fortified Citrus Olive Oils: From Their Production to Their Nutraceutical Properties on the Cardiovascular System. Nutrients. 2020; 12(6):1557. https://doi.org/10.3390/nu12061557
Chicago/Turabian StyleFlori, Lorenzo, Monica Macaluso, Isabella Taglieri, Chiara Sanmartin, Cristina Sgherri, Marinella De Leo, Valerio Ciccone, Sandra Donnini, Francesca Venturi, Luisa Pistelli, and et al. 2020. "Development of Fortified Citrus Olive Oils: From Their Production to Their Nutraceutical Properties on the Cardiovascular System" Nutrients 12, no. 6: 1557. https://doi.org/10.3390/nu12061557
APA StyleFlori, L., Macaluso, M., Taglieri, I., Sanmartin, C., Sgherri, C., De Leo, M., Ciccone, V., Donnini, S., Venturi, F., Pistelli, L., Martelli, A., Calderone, V., Testai, L., & Zinnai, A. (2020). Development of Fortified Citrus Olive Oils: From Their Production to Their Nutraceutical Properties on the Cardiovascular System. Nutrients, 12(6), 1557. https://doi.org/10.3390/nu12061557