Energy Intake, Macronutrient Profile and Food Sources of Spanish Children Aged One to <10 Years—Results from the EsNuPI Study † †

 ,
,  ,
, 
 , ,
, ,  , , , ,
  ,
, 
Abstract
1. Introduction
2. Materials and Methods
2.1. Study Design and Sample
2.2. Dietary Survey and Data Collection
2.3. Evaluation of Plausible, Under and Over Reporters (Misreporting)
2.4. Statistical Analysis
3. Results
3.1. Description of the Sample
3.2. Total Energy Intake
3.3. Macronutrient Profile and Distribution
3.4. Adequacy to the European Food Safety Authority and the Institute of Medicine Nutrient Recommendations.
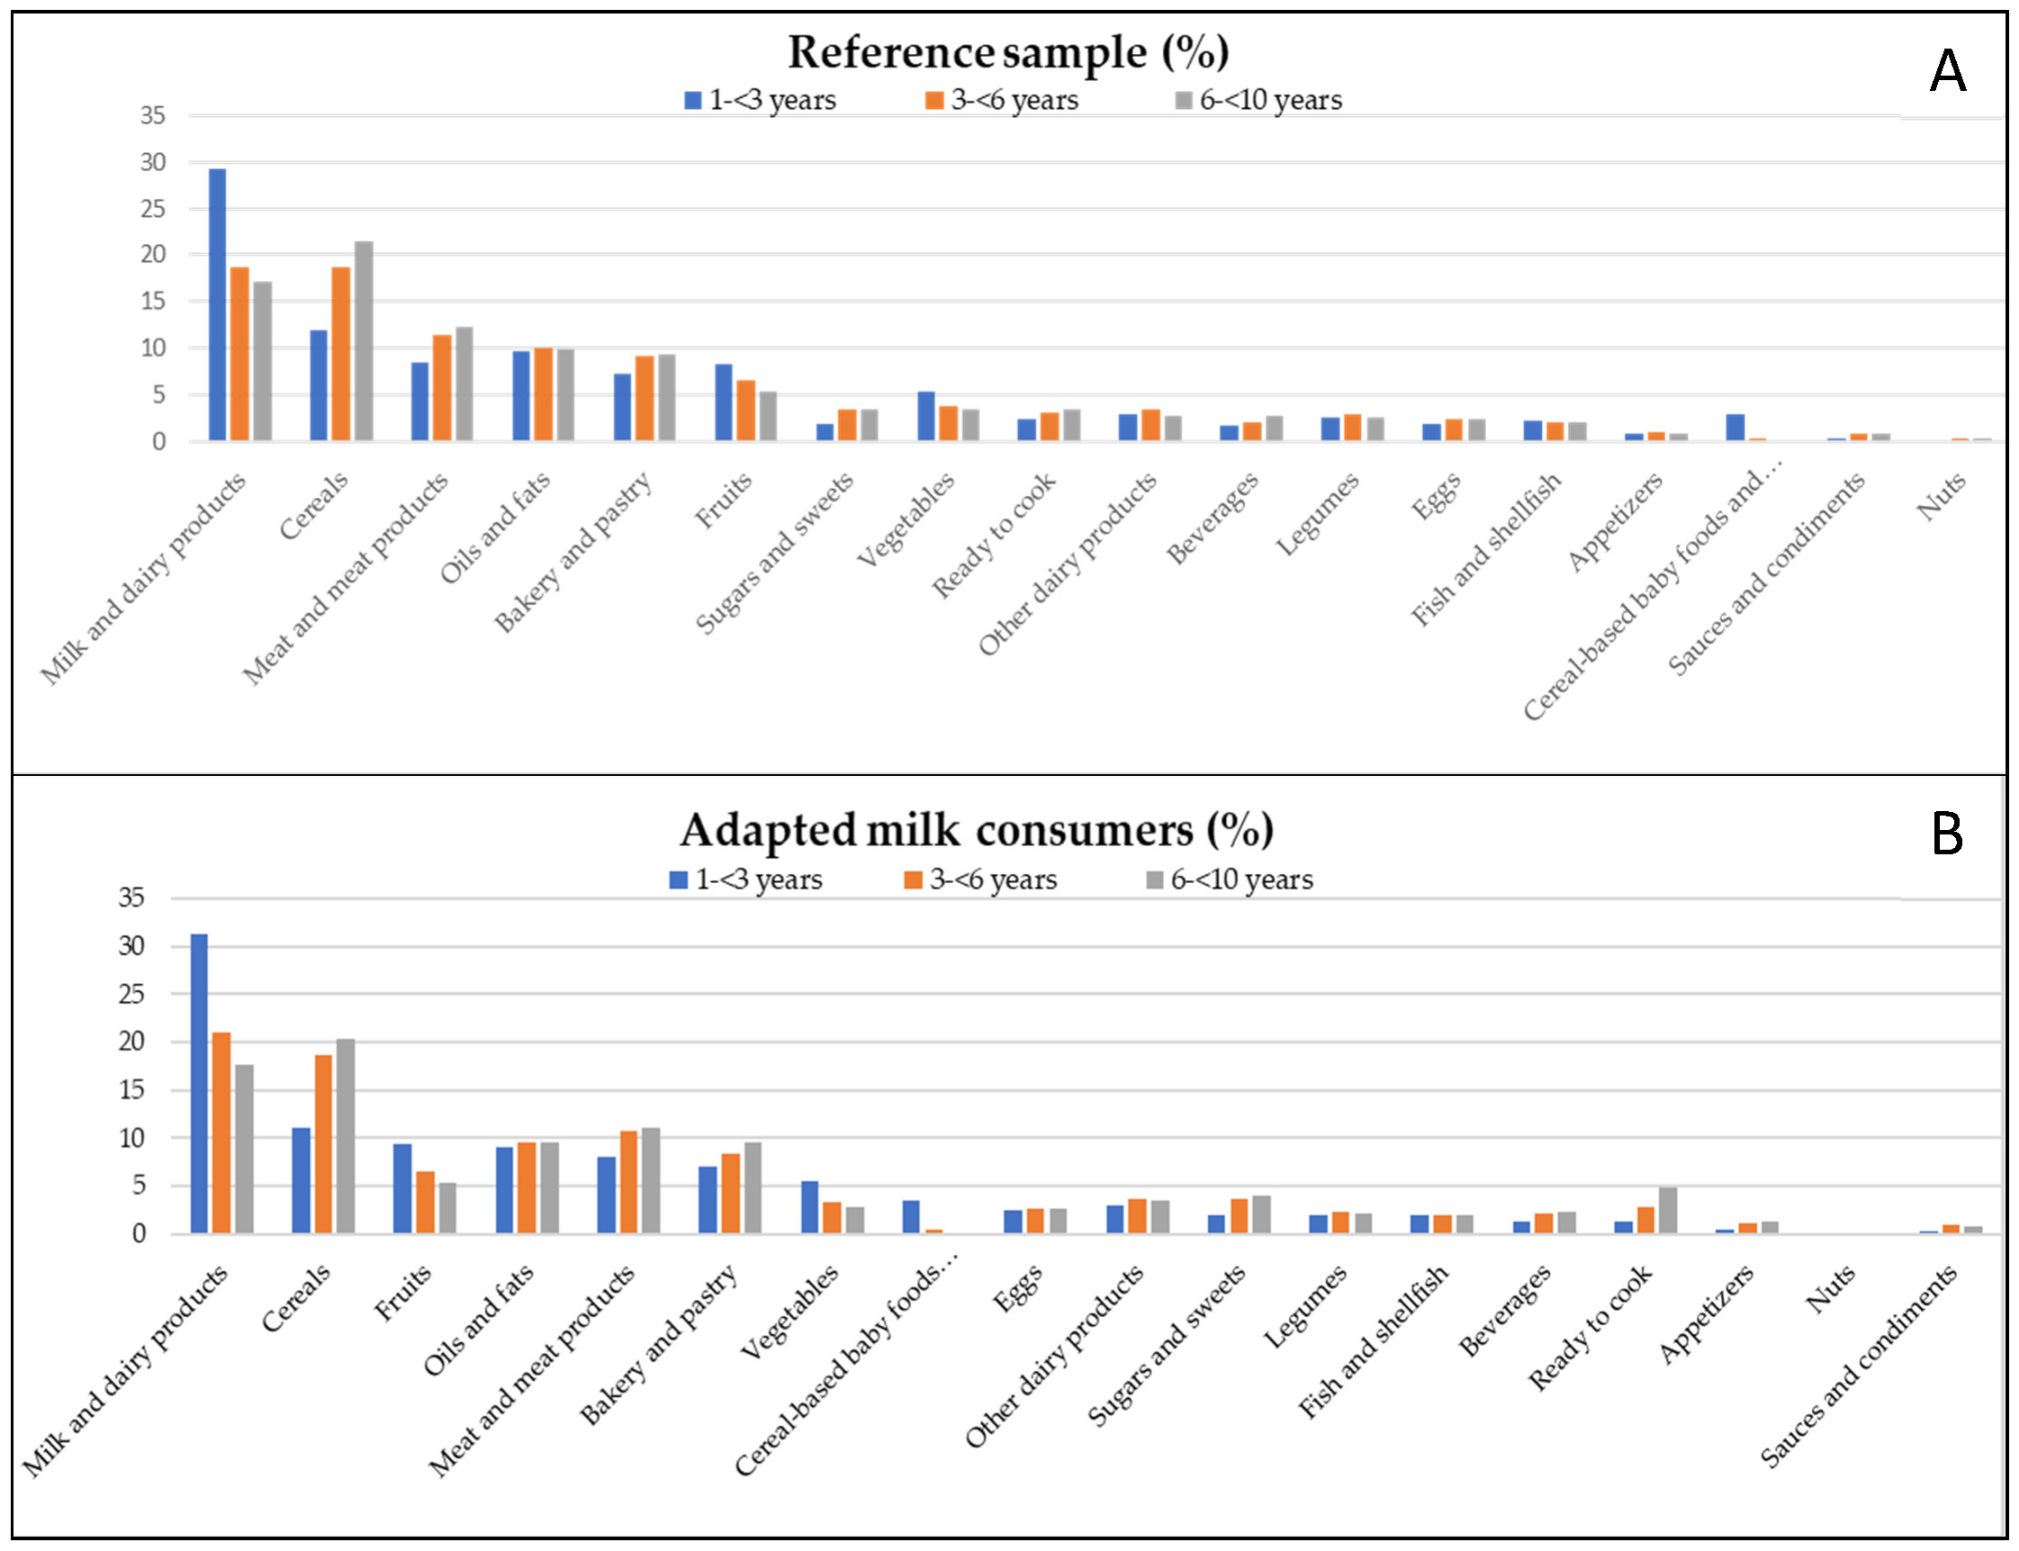
3.5. Contribution of Food Groups to Total Energy Intake
3.6. Misreporting (Under- and Over-reporting of Energy Intake)
4. Discussion
4.1. Total Energy Intake
4.2. Nutrient Profile and Distribution
4.3. Contribution of Food Groups to Energy Intake
4.4. Energy Misreporting
4.5. Strengths and Limitations
5. Conclusions
Supplementary Materials
Author Contributions
Funding
Acknowledgments
Conflicts of Interest
References
- Grimes, C.; Szymlek-Gay, E.; Campbell, K.; Nicklas, T. Food Sources of Total Energy and Nutrients among U.S. Infants and Toddlers: National Health and Nutrition Ecamination Survey 2005–2012. Nutrients 2015, 7, 6797–6836. [Google Scholar] [CrossRef] [PubMed]
- Zhang, J.; Wang, D.; Eldridge, E.; Huang, F.; Ouyang, Y.; Wang, H.; Zhang, B. Urban–Rural Disparities in Energy Intake and Contribution of Fat and Animal Source Foods in Chinese Children Aged 4–17 Years. Nutrients 2017, 9, 526. [Google Scholar] [CrossRef] [PubMed]
- Fernandez, C.; Kasper, N.; Miller, A.; Lumeng, J.; Peterson, K. Association of Dietary Variety and Diversity With Body Mass Index in US Preschool Children. Pediatrics 2016, 137, e20152307. [Google Scholar] [CrossRef] [PubMed]
- Murray, C.J.L. Health effects of dietary risks in 195 countries, 1990–2017: A systematic analysis for the Global Burden of Disease Study 2017. Lancet 2019, 393, 1958–1972. [Google Scholar] [CrossRef]
- Fernández Fernández, E.; Martínez Hernández, J.A.; Martínez Suárez, V.; Moreno Villares, J.M.; Collado Yurrita, L.R.; Hernández Cabria, M.; Morán Rey, F.J. Documento de Consenso: Importancia nutricional y metabólica de la leche. Nutr. Hosp. 2015, 31, 92–101. [Google Scholar]
- Srbely, V.; Janjua, I.; Buchholz, A.; Newton, G. Interventions Aimed at Increasing Dairy and/or Calcium Consumption of Preschool-Aged Children: A Systematic Literature Review. Nutrients 2019, 11, 714. [Google Scholar] [CrossRef]
- Gil, A.; Ortega, R.M. Introduction and Executive Summary of the Supplement, Role of Milk and Dairy Products in Health and Prevention of Noncommunicable Chronic Diseases: A Series of Systematic Reviews. Nutrients 2019, 10 (Suppl. 2), S67–S73. [Google Scholar] [CrossRef]
- Santaliestra-Pasías, A.M.; González-Gil, E.; Pala, V.; Intemann, T.; Hebestreit, S.; Russo, P.; Van Aart, C.; Rise, P.; Veidebaum, T.; Molnar, D.; et al. Predictive associations between lifestyle behaviours and dairy consumption: The IDEFICS study. Nutr. Metab. Cardiovasc. Dis. 2020, 30, 514–522. [Google Scholar] [CrossRef]
- Ortega, R.O.; González-Rodríguez, L.; Jiménez, A.; Perea, J.; Bermejo, L. N°920030, G. de investigación. Implicación del consumo de lácteos en la adecuación de la dieta y de la ingesta de calcio y nutrientes en niños españoles. Nutr. Clin. Diet Hosp. 2012, 32, 28–36. [Google Scholar]
- Chouraqui, J.P.; Turck, D.; Tavoularis, G. The Role of Young Child Formula in Ensuring a Balanced Diet in Young Children (1–3 Years Old). Nutrients 2019, 11, 2213. [Google Scholar] [CrossRef]
- Hojsak, I.; Bronsky, J.; Campoy, C.; Domello, M.; Embleton, N.; Fidler Mis, N.; Hulst, J.; Indrio, F.; Lapillonne, A.; Mølgaard, C.; et al. Young Child Formula: A Position Paper by the ESPGHAN Committee on Nutrition. J. Pediatr. Gastroenterol. Nutr. 2018, 66, 177–185. [Google Scholar] [CrossRef] [PubMed]
- Kantar World Panel. Available online: https://www.kantarworldpanel.com/es (accessed on 13 March 2019).
- Piñana, C.; Aranda Pons, N.; Bedmar Carretero, C.; Arija Val, V. Composición nutricional de las leches infantiles. Nivel de cumplimiento en su fabricación y adecuación a las necesidades nutricionales. An. Pediatr. (Barc.) 2015, 83, 417–429. [Google Scholar] [CrossRef] [PubMed]
- Dalmau Serra, J.; Moreno-Villares, J.M. Leches de crecimiento. ¿Qué pueden aportar en la alimentación del niño pequeño? Acta Pediatr. Esp. 2018, 75, 73–79. [Google Scholar]
- Abdulrazzaq, Y.M.; Nagelkerke, N.; Abdulla, S.; Belhaj, G. Nutrient intake of infants and toddlers in the United Arab Emirates: The Feeding Infants and Toddlers Study. EMHJ 2016, 22, 293–300. [Google Scholar] [CrossRef] [PubMed]
- Agdeppa, A.; Dinney, L.; Capanzana, M. Usual Energy and Nutrient Intakes and Food Sources of Filipino Children Aged 6–12 Years from the 2013 National Nutrition Survey. Nestlè Nutr. Inst. 2019, 91, 111–122. [Google Scholar]
- Rubio-López, N.; Morales-Suárez-Varela, M.; Pico, Y.; Livianos-Aldana, L.; Llopis-González, A. Nutrient Intake and Depression Symptoms in Spanish Children: The ANIVA Study. Nutrients 2016, 13, 352. [Google Scholar] [CrossRef]
- Börnhorst, C.; Huybrechts, I.; Hebestreit, A.; Krogh, V.; De Decker, A.; Barba, G.; Moreno, L.A.; Lissner, L.; Tornaritis, M.; Loit, H.M.; et al. Usual energy and macronutrient intakes in 2–9-year-old European children. Int. J. Obes. 2014, 38, s115–s123. [Google Scholar] [CrossRef]
- Nasreddine, L.M.; Kassis, A.N.; Ayoub, J.J.; Naja, F.A.; Hwalla, N.C. Nutritional status and dietary intakes of children amid the nutrition transition: The case of the Eastern Mediterranean Region. Nutr. Res. 2018, 57, 12–27. [Google Scholar] [CrossRef]
- Aranceta-Bartrina, J.; Pérez-Rodrigo, C. Determinants of childhood obesity: ANIBES study. Nutr. Hosp. 2016, 33, 17–20. [Google Scholar]
- Partearroyo, T.; Samaniego-Vaesken, M.L.; Ruiz, E.; Aranceta-Bartrina, J.; Gil, A.; González-Gross, M.; Ortega, R.M.; Serra-Majem, L.; Varela-Moreiras, G. Current Food Consumption amongst the Spanish ANIBES Study Population. Nutrients 2019, 11, 2663. [Google Scholar] [CrossRef]
- López-Sobaler, A.M.; Aparicio, A.; Rubio, J.; Marcos, V.; Sanchidrián, R.; Santos, S.; Pérez-Farinós, N.; Dal-Re, M.Á.; Villar-Villalba, C.; Yusta-Boyo, M.J.; et al. Adequacy of usual macronutrient intake and macronutrient distribution in children and adolescents in Spain: A National Dietary Survey on the Child and Adolescent Population, ENALIA 2013–2014. Eur. J. Nutr. 2019, 58, 705–719. [Google Scholar] [CrossRef] [PubMed]
- Ruiz, E.; Ávila, J.M.; Valero, T.; del Pozo, S.; Rodriguez, P.; Aranceta-Bartrina, J.; Gil, Á.; González-Gross, M.; Ortega, R.M.; Serra-Majem, L.; et al. Energy Intake, Profile, and Dietary Sources in the Spanish Population: Findings of the ANIBES Study. Nutrients 2015, 7, 4739–4762. [Google Scholar] [CrossRef] [PubMed]
- Dalmau, J.; Peña, L.; Morais, A.; Martínez, V.; Varea, V.; Martínez, M.; Soler, B. Análisis cuantitativo de la ingesta de nutrientes en niños menores de 3 años. An. Pediatr. (Barc.) 2015, 82, 255–266. [Google Scholar] [CrossRef] [PubMed]
- Commission on Ending Childhood Obesity. Report of the Commission on Ending Childhood Obesity. 2016. Available online: https://apps.who.int/iris/handle/10665/259349 (accessed on 10 December 2019).
- Ochola, S.; Kinya, P. Dietary Intake of Schoolchildren and Adolescents in Developing Countries. Ann. Nutr. Metab. 2014, 64, 24–40. [Google Scholar] [CrossRef] [PubMed]
- Brunner, T.; Casetti1, L.; Haueter, P.; Müller, P.; Nydegger, A.; Spalinger, J. Nutrient intake of Swiss toddlers. Eur. J. Nutr. 2017, 5, 2489–2499. [Google Scholar] [CrossRef] [PubMed]
- Gomes, D.; Luqueb, V.; Xhonneuxc, A.; Verducid, E.; Sochae, P.; Koletzkof, B.; Bergerg, U.; Grotef, V. A simple method for identification of misreporting of energy intake from infancy to school age: Results from a longitudinal study. Clin. Nutr 2018, 37, 1053–1060. [Google Scholar] [CrossRef]
- Foster, E.; Bradle, J. Methodological considerations and future insights for twenty-four-hour dietary recall assessment in children. Nutr. Res. 2018, 51, 1–11. [Google Scholar] [CrossRef]
- Castro-Quezada, I.; Ruano, C.; Ribas-Barba, L.; Serra-Majem, L. Misreporting in nutritional surveys: Methodological implications. Nutrients 2015, 31, 119–127. [Google Scholar]
- European Food Safety Authority (EFSA). Example of a Protocol for Identification of Misreporting (Under- and Overreporting of Energy Intake) Based on the PILOT-PANEU Project. Available online: http://www.efsa.europa.eu/sites/default/files/efsa_rep/blobserver_assets/3944A-8-2-1.pdf (accessed on 1 November 2019).
- O’Neil, C.; Nicklas, T.; Fulgoni, V. Food Sources of Energy and Nutrients of Public Health Concern and Nutrients to Limit with a Focus on Milk and other Dairy Foods in Children 2 to 18 Years of Age: National Health and Nutrition Examination Survey, 2011–2014. Nutrients 2018, 10, 1050. [Google Scholar] [CrossRef] [PubMed]
- Madrigal, C.; Soto-Méndez, M.J.; Hernández-Ruiz, A.; Ruiz, E.; Valero, T.; Ávila, J.M.; Lara-Villoslada, F.; Leis, R.; de Martínez Victoria, E.; Moreno, J.M.; et al. Dietary and Lifestyle Patterns in the Spanish Pediatric Population (One to <10 Years Old): Design, Protocol, and Methodology of the EsNuPI Study. Nutrients 2019, 11, 3050. [Google Scholar]
- Moreiras, O.; Carbajal, A.; Cabrera, L. Ingestas Diarias Recomendadas de Energía y Nutrientes para la Población Española. In Tablas de Composición de Alimentos, 19th ed.; Ediciones Pirámide (Grupo Anaya, SA): Madrid, Spain, 2018. [Google Scholar]
- Fundación Española de la Nutrición (FEN) Software VD-FEN 2.1 Programa de Valoración Dietética de la FEN; Fundación Española de la Nutrición (FEN): Madrid, Spain, 2013.
- Ruiz-López, M.D.; de Martínez Victoria, E.; Gil, A. Guía Fotográfica de Porciones de Alimentos Consumidos en España; Fundación Iberoamericana de Nutrición: Granada, Spain, 2019. [Google Scholar]
- Ocké, M.; De Boer, E.; Brants, H.; Van der Laan, J.; Niekerk, M.; Van Rossum, C.; Temme, L.; Freisling, H.; Nicolas, G.; Casagrande, C.; et al. Pancake—Pilot study for the Assessment of Nutrient intake and food Consumption Among Kids in Europe. EFSA J. 2012, 9, 339E. [Google Scholar] [CrossRef]
- European Food Safety Authority (EFSA). Dietary Reference Values for the Eupean Union 2019. Available online: https://www.efsa.europa.eu/en/topics/topic/dietary-reference-values (accessed on 1 November 2019).
- Institute of Medicine (IOM). Dietary Reference Intakes; The National Academies Press: Washington, DC, USA, 2005. [Google Scholar]
- Goldberg, G.R.; Black, A.E.; Jebb, S.A.; Cole, T.J.; Murgatroyd, P.R.; Coward, W.A.; Prentice, A.M. Critical evaluation of energy intake data using fundamental principles of energy physiology: 1. Derivation of cut-off limits to identify under-recording. Eur. J. Clin. Nutr. 1991, 45, 569–581. [Google Scholar] [PubMed]
- Black, A.E. Critical evaluation of energy intake using the Goldberg cut-off for energy intake: Basal metabolic rate. A practical guide to its calculation, use and limitations. Int. J. Obes. 2000, 24, 1119–1130. [Google Scholar] [CrossRef] [PubMed]
- Schofield, W.N. Predicting basal metabolic rate, new standards and review of previous work. Hum. Nutr. Clin. Nutr. 1985, 39, 5–41. [Google Scholar] [PubMed]
- Camargo, D.M.; Santisteban, S.; Paredes, E.; Flórez, M.; Bueno, D.A. Confiabilidad de un cuestionario para medir actividad física y comportamientos sedentarios en niños desde preescolar a cuarto grado de primaria. Biomedica 2015, 35, 347–356. [Google Scholar] [CrossRef] [PubMed]
- European Food Safety Authority (EFSA). Scientific Opinion on Dietary Reference Values for protein. EFSA Panel on Dietetic Products, Nutrition and Allergies (NDA). EFSA J. 2012, 10, 1–66. [Google Scholar]
- World Health Organization; Food and Agriculture Organization of the United Nations; United Nations University. Protein and Amino Acid Requirements in Human Nutrition; Who Technical Report Series: Geneva, Switzerland, 2007; p. 265. [Google Scholar]
- Hornell, A.; Lagstrom, H.; Lande, B.; Thorsdottir, I. Protein intake from 0 to 18 years of age and its relation to health: A systematic literature review for the 5th Nordic Nutrition Recommendations. Food Nutr. Res. 2013, 57, 21083. [Google Scholar] [CrossRef] [PubMed]
- Weber, M.; Grote, V.; Closa-Monasterolo, R.; Escribano, J.; Langhendries, J.P.; Dain, E.; Giovannini, M.; Verduci, E.; Gruszfeld, D.; Socha, P.; et al. Lower protein content in infant formula reduces BMI and obesity risk at school age: Follow-up of a randomized trial. Am. J. Clin. Nutr. 2014, 99, 1041–1051. [Google Scholar] [CrossRef]
- Alexander, D.D.; Yan, J.; Bylsma, L.C.; Northington, R.S.; Grathwohl, D.; Steenhout, P.; Erdmann, P.; Spivey-Krobath, E.; Haschke, F. Growth of infants consuming whey-predominant term infant formulas with a protein content of 1.8 g/100 kcal: A multicenter pooled analysis of individual participant data. Am. J. Clin. Nutr. 2016, 104, 1083–1092. [Google Scholar] [CrossRef]
- Voortman, T.; Braun, K.V.; Kiefte-de Jong, J.C.; Jaddoe, V.W.; Franco, O.H.; Van den Hooven, E.H. Protein intake in early childhood and body composition at the age of 6 years: The Generation R Study. Int. J. Obes. 2016, 40, 1018–1025. [Google Scholar] [CrossRef]
- Rolland-Cachera, M.F.; Deheeger, M.; Akrout, M.; Bellisle, F. Influence of macronutrients on adiposity development: A follow up study of nutrition and growth from 10 months to 8 years of age. Int. J. Obes. Relat. Metab. Disord. 1995, 19, 573–578. [Google Scholar]
- Mennella, J.A.; Ventura, A.K.; Beauchamp, G.K. Differential growth patterns among healthy infants fed protein hydrolysate or cow-milk formulas. Pediatrics 2011, 127, 110–118. [Google Scholar] [CrossRef] [PubMed]
- Ministerio de Sanidad. Servicios Sociales e Igualdad Agencia Española de Consumo. Encuesta Nacional de consumo de Alimentos en población Infantil y Adolescentes (ENALIA) (2012–2014) Ministerio de Sanidad, Consumo, Igualdad y Servicios Sociales; Ministerio de Sanidad, Servicios Sociales e Igualdad: Madrid, Spain, 2013. [Google Scholar]
- Ruiz, E.; Ávila, J.M.; Valero, T.; Pozo, S.; Rodriguez, P.; Aranceta-Bartrina, J.; Gil, A.; González-Gross, M.; Ortega, R.M.; Serra-Majem, L.; et al. Macronutrient Distribution and Dietary Sources in the Spanish Population: Findings from the ANIBES Study. Nutrients 2016, 8, 177. [Google Scholar] [CrossRef]
- Huysentruyt, K.; Laire, D.; Van Avondt, T.; De Schepper, J.; Vandenplas, Y. Energy and macronutrient intakes and adherence to dietary guidelines of infants and toddlers in Belgium. Eur. J. Nutr. 2015, 55, 1595–1604. [Google Scholar] [CrossRef]
- Agostoni, C.; Decsi, T.; Fewtrell, M.; Goulet, O.; Kolacek, S.; Koletzko, B.; Michaelsen, K.F.; Moreno, L.; Puntis, J.; Rigo, J.; et al. Complementary feeding: A commentary by the ESPGHAN Committee on nutrition. J. Pediatr. Gastroenterol. Nutr. 2008, 46, 99–110. [Google Scholar] [CrossRef]
- Zuccotti, G.V.; Cassatella, C.; Morelli, A.; Cucugliato, M.C.; Catinello, G.; Del Balzo, V.; Guidarelli, L.; Aqostoni, C.; Mameli, C.; Troiano, E.; et al. Nutrient intake in Italian infants and toddlers from north and south Italy: The Nutrintake 636 Study. Nutrients 2014, 6, 3169–3186. [Google Scholar] [CrossRef]
- Rêgo, C.; Pinto, E.; Lopes, C.; Nazareth, M.; Graça, P. Feeding and growth during the first years of life: EPACI Portugal 2012. In EPACI Oral Presentation; EPACI: Lisbon, Portugal, 2013. [Google Scholar]
- European Food Safety Authority. Panel on Dietetic Products, Nutrition and Allergies (NDA). EFSA Scientific Opinion on Dietary Reference Values for carbohydrates and dietary fibre. EFSA J. 2010, 8, 1462. [Google Scholar]
- Elmadfa, I.; Meyer, A.; Nowak, V.; Hasenegger, V.; Putz, P.; Verstraeten, R.; Remaut-DeWinter, A.M.; Kolsteren, P.; Dostálová, J.; Dlouhý, P.; et al. European Nutrition and Health Report 2009. Ann. Nutr. Metab. 2009, 55, 1–40. [Google Scholar] [PubMed]
- European Food Safety Authority. Dietary Reference Values for nutrients. Summary report. EFSA J. 2017, 14, e15121. [Google Scholar]
- Manios, Y.; Grammatikaki, E.; Papoutsou, P.; Liarigkovinos, T.; Kondaki, K.; Moschonis, G. Nutrient Intakes of Toddlers and Preschoolers in Greece: The GENESIS Study. J. Am. Diet Assoc. 2008, 108, 357–361. [Google Scholar] [CrossRef] [PubMed]
- Wanden-Bergue, C.; Sanz-Valero, J.; Franco-Perez, A.; Sanz-Lorente, M.; Melian-Fleitas, L.; Lara-Villoslada, F.; Gil, Á. Macronutrients Intake by the Spanish Population: Systematic Review. Clin. Nutr. 2016, 35, s113–s114. [Google Scholar]
- Walton, J.; Flynn, A. Nutritional adequacy of diets containing growing up milks or unfortified cow’s milk in Irish children (aged 12–24 months). Food Nutr. Res. 2013, 57, 21836. [Google Scholar] [CrossRef] [PubMed]
- Kay, M.; Welker, E.; Jacquier, E.; Story, M. Beverage Consumption Patterns among Infants and Young Children (0–47.9 Months): Data from the Feeding Infants and Toddlers Study, 2016. Nutrients 2018, 10, 825. [Google Scholar] [CrossRef] [PubMed]
- Sofi, F.; Dinu, M.; Pagliai, G.; Cei, L.; Sacchi, G.; Benedettelli, S.; Stefani, G.; Gagliardi, E.; Tosi, P.; Bocci, R.; et al. Health and Nutrition Studies Related to Cereal Biodiversity: A Participatory Multi-Actor Literature Review Approach. Nutrients 2018, 10, 1207. [Google Scholar] [CrossRef]
- Yi, L.; Mouratidou, T.; Vereecken, C.; Kersting, M.; Bolca, S.; de Moraes, A.C.F.; Cuenca-García, M.; Moreno, L.; González-Gross, M.; Valtueña, J.; et al. Dietary animal and plant protein intakes and their associations with obesity and cardio-metabolic indicators in European adolescents: The HELENA cross-sectional study. Nutr. J. 2015, 14, 10. [Google Scholar]
- Cocking, C.; Walton, J.; Kehoe, L.; Cashman, K.D.; Flynn, A. The role of meat in the European diet: Current state of knowledge on dietary recommendations, intakes and contribution to energy and nutrient intakes and status. Nutr. Res. Rev. 2020, 10, 1–9. [Google Scholar] [CrossRef]
- Pimpin, L.; Jebb, S.A.; Johnson, L.; Llewellyn, C.; Ambrosini, G.L. Sources and pattern of protein intake and risk of overweight or obesity in young UK twins. Br. J. Nutr. 2018, 120, 820–829. [Google Scholar] [CrossRef]
- Jen, V.; Karagounis, L.G.; Jaddoe, V.W.V.; Franco, O.H.; Voortman, T. Dietary protein intake in school-age children and detailed measures of body composition: The Generation R Study. Int. J. Obes. 2018, 42, 1715–1723. [Google Scholar] [CrossRef]
- Campbell, K.; Abbott, G.; Zheng, M.; McNaughton, S.A. Early Life Protein Intake: Food Sources, Correlates, and Tracking across the First 5 Years of Life. J. Acad. Nutr. Diet 2017, 17, 1188–1197. [Google Scholar] [CrossRef]
- O’Connor, L.; Walton, J.; Flynn, A. Fruit and vegetable intakes, sources and contribution to total diet in very young children (1–4 years): The Irish National Pre-School Nutrition Survey. Br. J. Nutr. 2016, 115, 2196–2202. [Google Scholar] [CrossRef]
- Mytton, O.T.; Nnoaham, K.; Eyles, H.; Scarborough, P.; Mhurchu, C.N. Systematic review and meta-analysis of the effect of increased vegetable and fruit consumption on body weight and energy intake. BMC Public Health 2014, 14, 886. [Google Scholar] [CrossRef] [PubMed]
- World Health Organization. Sugar Intake for Adults and Children. Guideline; World Health Organization: Geneva, Switzerland, 2015. [Google Scholar]
- Fidlerm, M.; Braegger, C.; Bronsky, J.; Campoy, C.; Domellöf, M.; Embleton, N.D.; Hojsak, I.; Hulst, J.; Indrio, F.; Lapillonne, A.; et al. ESPGHAN Committee on Nutrition. Sugar in Infants, Children and Adolescents: A Position Paper of the European Society for Paediatric Gastroenterology, Hepatology and Nutrition Committee on Nutrition. J. Pediatr. Gastroenterol. Nutr. 2017, 65, 681–696. [Google Scholar] [CrossRef] [PubMed]
- Olza, J.; de Martínez Victoria, E.; Aranceta-Bartrina, J.; González-Gross, M.; Ortega, R.M.; Serra-Majem, L.; Varela-Moreiras, G.; Gil, A. Adequacy of Critical Nutrients Affecting the Quality of the Spanish Diet in the ANIBES Study. Nutrients 2019, 11, 2328. [Google Scholar] [CrossRef] [PubMed]
- Hebestreit, A.; Börnhorst, G.; Siani, B.; Huybrechts, I.; Tognon, G.; Eiben, G.; Moreno, L.A.; Fernández Alvira, J.M.; Loit, H.M.; Kovacs, E.; et al. Associations between energy intake, daily food intake and energy density of foods and BMI z-score in 2–9-year-old European children. Eur. J. Nutr. 2014, 53, 673–681. [Google Scholar] [CrossRef]
- Burrows, T.L.; Martin, R.J.; Collins, C.E. A systematic review of the validity of dietary assessment methods in children when compared with the method of doubly labeled water. J. Am. Diet Assoc. 2010, 110, 1501–1510. [Google Scholar] [CrossRef]
- Livingstone, M.B.; Black, A.E. Markers of the Validity of Reported Energy Intake. J. Nutr. 2003, 133, 895S–920S. [Google Scholar] [CrossRef]


| Misreporting Cut-Off | |||||
|---|---|---|---|---|---|
| Group Level | Individual Level | ||||
| PAL | Lower | Upper | Lower | Upper | |
| Reference sample | 1.57 | 1.54 | 1.60 | 0.98 | 2.52 |
| 1 to <3 years | 1.57 | 1.51 | 1.62 | 0.97 | 2.51 |
| 3 to <6 years | 1.56 | 1.51 | 1.61 | 0.97 | 2.50 |
| 6 to <10 years | 1.58 | 1.54 | 1.63 | 0.99 | 2.54 |
| Adapted milk consumers sample | 1.55 | 1.52 | 1.57 | 0.96 | 2.49 |
| 1 to <3 years | 1.54 | 1.50 | 1.58 | 0.96 | 2.47 |
| 3 to <6 years | 1.52 | 1.48 | 1.57 | 0.95 | 2.45 |
| 6 to <10 years | 1.61 | 1.55 | 1.66 | 1.00 | 2.58 |
| Whole Population | Reference Sample | Adapted Milk Consumers | ||
|---|---|---|---|---|
| n = 1448 | n = 707 | n = 741 | ||
| Sex | Boys | 728 | 357 | 371 |
| Girls | 720 | 350 | 370 | |
| Age (years) | 1 to <3 | 456 | 162 | 294 |
| 3 to <6 | 506 | 244 | 262 | |
| 6 to <10 | 486 | 301 | 185 |
| Reference Sample | ||||||||||||||||||||
|---|---|---|---|---|---|---|---|---|---|---|---|---|---|---|---|---|---|---|---|---|
| Energy (kcal/day) | Total | 1–<3 years | 3–<6 years | 6–<10 years | ||||||||||||||||
| n | Mean | SD | Median | IQR | n | Mean | SD | Median | IQR | n | Mean | SD | Median | IQR | n | Mean | SD | Median | IQR | |
| Total | 707 | 1503 | 417 | 1484 | 526 | 162 | 1229 | 347 | 1215a | 485 | 244 | 1492 | 347 | 1497b | 431 | 30 | 1660 | 427 | 1600c | 533 |
| Boys | 357 | 1534 | 427 | 1515 | 491 | 84 | 1238 | 346 | 1202a | 522 | 122 | 1509 | 360 | 1502b | 380 | 151 | 1718 | 423 | 1661c | 562 |
| Girls | 350 | 1472 | 405 | 1461 | 539 | 78 | 1220 | 350 | 1219a | 435 | 122 | 1475 | 333 | 1477b | 515 | 150 | 1601 | 424 | 1538b | 510 |
| Adapted Milk Consumers Sample | ||||||||||||||||||||
| Energy (kcal/day) | Total | 1–<3 years | 3–<6 years | 6–<10 years | ||||||||||||||||
| n | Mean | SD | Median | IQR | n | Mean | SD | Median | IQR | n | Mean | SD | Median | IQR | n | Mean | SD | Median | IQR | |
| Total | 741 | 1404 | 394 | 1375 | 491 | 294 | 1181 | 306 | 1163a | 375 | 262 | 1497 | 371 | 1475b | 456 | 185 | 1626 | 375 | 1577c | 464 |
| Boys | 371 | 1405 | 409 | 1367 | 485 | 144 | 1171 | 305 | 1165a | 402 | 128 | 1478 | 399 | 1473b | 429 | 99 | 1652 | 377 | 1593c | 476 |
| Girls | 370 | 1402 | 379 | 1376 | 500 | 150 | 1191 | 307 | 1162a | 392 | 134 | 1514 | 343 | 1481b | 496 | 86 | 1596 | 373 | 1553b | 456 |
| Reference Sample | Adapted Milk Consumers | |||||||||||||||||
|---|---|---|---|---|---|---|---|---|---|---|---|---|---|---|---|---|---|---|
| Total | 1–<3 years | 3–<6 years | 6–<10 years | Total | 1–<3 years | 3–<6 years | 6–<10 years | |||||||||||
| n | % | n | % | n | % | n | % | p | n | % | n | % | n | % | n | % | p | |
| (%) Proteins | 707 | 16.5 | 162 | 15.9a | 244 | 16.8b | 301 | 16.6 b | 0.009 | 741 | 15.6 | 294 | 15.0a | 262 | 15.9b | 185 | 16.2 b | <0.001 |
| Boys | 357 | 16.4 | 84 | 15.9 | 122 | 16.7 | 151 | 16.5 | 0.104 | 371 | 15.5 | 144 | 14.7 a | 128 | 15.9 b | 99 | 16.3 b | <0.001 |
| Girls | 350 | 16.6 | 78 | 16.0 | 122 | 16.9 | 150 | 16.8 | 0.082 | 370 | 15.7 | 150 | 15.4 | 134 | 15.9 | 86 | 16.1 | 0.143 |
| (%) Carbohydrates | 707 | 45.4 | 162 | 46.2 | 244 | 45.2 | 301 | 45.1 | 0.176 | 741 | 46.7 | 294 | 48.3a | 262 | 45.9 b | 185 | 45.3 b | <0.001 |
| Boys | 357 | 45.6 | 84 | 46.2 | 122 | 45.6 | 151 | 45.1 | 0.40 | 371 | 46.8 | 144 | 48.3 a | 128 | 46.0 b | 99 | 45.4 b | <0.001 |
| Girls | 350 | 45.2 | 78 | 46.2 | 122 | 44.8 | 150 | 45.1 | 0.33 | 370 | 46.7 | 150 | 48.3 a | 134 | 45.8 b | 86 | 45.2 b | <0.001 |
| (%) Fat | 707 | 36.5 | 162 | 36.2 | 244 | 36.4 | 301 | 36.7 | 0.63 | 741 | 35.9 | 294 | 34.6a | 262 | 36.6 b | 185 | 37.0 b | <0.001 |
| Boys | 357 | 36.4 | 84 | 36.2 | 122 | 36.0 | 151 | 36.9 | 0.49 | 371 | 36.0 | 144 | 35.1 | 128 | 36.5 | 99 | 36.8 | 0.056 |
| Girls | 350 | 36.6 | 78 | 36.2 | 122 | 36.8 | 150 | 36.6 | 0.79 | 370 | 35.8 | 150 | 34.2 a | 134 | 36.8 b | 86 | 37.2 b | <0.001 |
| Reference Sample | Adapted Milk Consumers | |||||||||||||||||
|---|---|---|---|---|---|---|---|---|---|---|---|---|---|---|---|---|---|---|
| Total | 1–<3 years | 3–<6 years | 6–<10 years | Total | 1–<3 years | 3–<6 years | 6–<10 years | |||||||||||
| n | % | n | % | N | % | n | % | p | n | % | n | % | n | % | n | % | p | |
| Adequacy to recommendations1 | ||||||||||||||||||
| (%) Energy intake EFSA | 707 | 113 | 162 | 141 a | 244 | 115 b | 301 | 96.8 c | <0.001 | 741 | 120 | 294 | 139 a | 262 | 117 b | 185 | 94.9 c | <0.001 |
| Boys | 357 | 111 | 84 | 133 a | 122 | 113 b | 151 | 97.3 c | <0.001 | 371 | 114 | 144 | 132 a | 128 | 111 b | 99 | 93.2 c | <0.001 |
| Girls | 350 | 116 | 78 | 150 a | 122 | 118 b | 150 | 96.4 c | <0.001 | 370 | 126 | 150 | 145 a | 134 | 123 b | 86 | 96.9 c | <0.001 |
| (%) Energy intake IOM | 707 | 84.0 | 162 | 127 a | 244 | 75.6 b | 301 | 67.6 c | <0.001 | 741 | 93.4 | 294 | 125 a | 262 | 78.0 b | 185 | 67.4 c | <0.001 |
| Boys | 357 | 80.0 | 84 | 122 a | 122 | 70.8 b | 151 | 64.0 c | <0.001 | 371 | 89.2 | 144 | 123 a | 128 | 71.8 b | 99 | 62.8 c | <0.001 |
| Girls | 350 | 88.0 | 78 | 132 a | 122 | 80.3 b | 150 | 71.3 c | <0.001 | 370 | 98.4 | 150 | 126 a | 134 | 83.9 b | 86 | 72.8 c | <0.001 |
| (%) Proteins EFSA | 707 | 353 | 162 | 400a | 244 | 414 a | 301 | 278 b | <0.001 | 741 | 362 | 294 | 371a | 262 | 411 b | 185 | 278 c | <0.001 |
| Boys | 357 | 351 | 84 | 391 a | 122 | 411 a | 151 | 281 b | <0.001 | 371 | 350 | 144 | 358 a | 128 | 400 b | 99 | 275 c | <0.001 |
| Girls | 350 | 355 | 78 | 411 a | 122 | 417 a | 150 | 275 b | <0.001 | 370 | 374 | 150 | 385 a | 134 | 422 b | 86 | 281 c | <0.001 |
| (%) Proteins IOM | 707 | 351 | 162 | 374a | 244 | 385 a | 301 | 312 b | <0.001 | 741 | 342 | 294 | 343a | 262 | 369 b | 185 | 305 c | <0.001 |
| Boys | 357 | 358 | 84 | 377 a | 122 | 388 a | 151 | 324 b | <0.001 | 371 | 335 | 144 | 333 a | 128 | 359 a | 99 | 306 b | <0.001 |
| Girls | 350 | 345 | 78 | 371 a | 122 | 381 a | 150 | 301 b | <0.001 | 370 | 350 | 150 | 352 a | 134 | 378 a | 86 | 303 b | <0.001 |
| Children meeting the recommendations2 | ||||||||||||||||||
| (%) Carbohydrates EFSA | 707 | 51.1 | 162 | 58.0 | 244 | 47.1 | 301 | 50.5 | 0.21 | 741 | 58.6 | 294 | 65.0 a | 262 | 56.5 ab | 185 | 51.4 c | <0.001 |
| Boys | 357 | 51.5 | 84 | 60.7 | 122 | 46.7 | 151 | 50.3 | 0.053 | 371 | 58.5 | 144 | 66.0 a | 128 | 57.0 ab | 99 | 49.5 b | 0.018 |
| Girls | 350 | 50.6 | 78 | 55.1 | 122 | 47.5 | 150 | 50.7 | 0.66 | 370 | 58.6 | 150 | 64.0 | 134 | 56.0 | 86 | 53.5 | 0.098 |
| (%) Carbohydrates IOM | 707 | 51.9 | 162 | 58.6 | 244 | 48.4 | 301 | 51.2 | 0.20 | 741 | 60.6 | 294 | 68.7a | 262 | 57.6 b | 185 | 51.9 b | 0.002 |
| Boys | 357 | 52.1 | 84 | 60.7 | 122 | 48.4 | 151 | 50.3 | 0.27 | 371 | 60.6 | 144 | 70.1 a | 128 | 57.8 ab | 99 | 50.5 a | 0.018 |
| Girls | 350 | 51.7 | 78 | 56.4 | 122 | 48.4 | 150 | 52.0 | 0.29 | 370 | 60.5 | 150 | 67.3 | 134 | 57.5 | 86 | 53.5 | 0.074 |
| (%) Fat EFSA | 707 | 37.1 | 162 | 27.2a | 244 | 39.3 b | 301 | 40.5 b | <0.001 | 741 | 34.0 | 294 | 29.9 | 262 | 36.6 | 185 | 63.2 | <0.001 |
| Boys | 357 | 37.3 | 84 | 27.4 | 122 | 41.0 | 151 | 60.3 | <0.001 | 371 | 38.0 | 144 | 34.0 | 128 | 39.1 | 99 | 57.6 | <0.001 |
| Girls | 350 | 36.9 | 78 | 26.9 | 122 | 37.7 | 150 | 41.3 | <0.001 | 370 | 30.0 | 150 | 26.0 | 134 | 34.3 | 86 | 30.2 | <0.001 |
| (%) Fat IOM | 707 | 45.4 | 162 | 53.1a | 244 | 48.0 ab | 301 | 39.2 b | <0.001 | 741 | 49.1 | 294 | 58.8a | 262 | 47.7 b | 185 | 35.7 c | <0.001 |
| Boys | 357 | 46.2 | 84 | 52.4 | 122 | 50.8 | 151 | 39.1 | <0.001 | 371 | 50.9 | 144 | 58.3 a | 128 | 50.0 ab | 99 | 41.4 b | <0.001 |
| Girls | 350 | 44.6 | 78 | 53.8 | 122 | 45.1 | 150 | 39.3 | <0.001 | 370 | 47.3 | 150 | 59.3 a | 134 | 45.5 a | 86 | 29.1 b | <0.001 |
| Reference Sample (n = 706) | Adapted Milk Consumers (n = 740) | |||||||||||||||||
|---|---|---|---|---|---|---|---|---|---|---|---|---|---|---|---|---|---|---|
| Total | 1–<3 years | 3–<6 years | 6–<10 years | Total | 1–<3 years | 3–<6 years | 6–<10 years | |||||||||||
| n | % | n | % | n | % | n | % | p | n | % | n | % | n | % | n | % | p | |
| Plausible reporters | 598 | 84.7 | 120 | 74.5 | 211 | 86.5 | 267 | 88.7 | <0.001 | 618 | 83.5 | 236 | 80.5 | 224 | 85.5 | 158 | 85.4 | <0.001 |
| Non-Plausible reporters | 108 | 15.3 | 41 | 25.5 | 33 | 13.5 | 34 | 11.3 | <0.001 | 122 | 16.4 | 57 | 19.5 | 38 | 14.5 | 27 | 14.6 | <0.001 |
| Under-reporters | 43 | 6.1 | 8 | 5.0 | 12 | 4.9 | 23 | 7.6 | 0.015 | 44 | 5.9 | 14 | 4.8 | 10 | 3.8 | 20 | 10.8 | 0.178 |
| Over-reporters | 65 | 9.2 | 33 | 20.5 | 21 | 8.6 | 11 | 3.7 | 0.004 | 78 | 10.5 | 43 | 14.7 | 28 | 10.7 | 7 | 3.8 | <0.001 |
© 2020 by the authors. Licensee MDPI, Basel, Switzerland. This article is an open access article distributed under the terms and conditions of the Creative Commons Attribution (CC BY) license (http://creativecommons.org/licenses/by/4.0/).
Share and Cite
Madrigal, C.; Soto-Méndez, M.J.; Hernández-Ruiz, Á.; Valero, T.; Ávila, J.M.; Ruiz, E.; Lara Villoslada, F.; Leis, R.; Martínez de Victoria, E.; Moreno, J.M.; et al. Energy Intake, Macronutrient Profile and Food Sources of Spanish Children Aged One to <10 Years—Results from the EsNuPI Study †. Nutrients 2020, 12, 893. https://doi.org/10.3390/nu12040893
Madrigal C, Soto-Méndez MJ, Hernández-Ruiz Á, Valero T, Ávila JM, Ruiz E, Lara Villoslada F, Leis R, Martínez de Victoria E, Moreno JM, et al. Energy Intake, Macronutrient Profile and Food Sources of Spanish Children Aged One to <10 Years—Results from the EsNuPI Study †. Nutrients. 2020; 12(4):893. https://doi.org/10.3390/nu12040893
Chicago/Turabian StyleMadrigal, Casandra, María José Soto-Méndez, Ángela Hernández-Ruiz, Teresa Valero, José Manuel Ávila, Emma Ruiz, Federico Lara Villoslada, Rosaura Leis, Emilio Martínez de Victoria, José Manuel Moreno, and et al. 2020. "Energy Intake, Macronutrient Profile and Food Sources of Spanish Children Aged One to <10 Years—Results from the EsNuPI Study †" Nutrients 12, no. 4: 893. https://doi.org/10.3390/nu12040893
APA StyleMadrigal, C., Soto-Méndez, M. J., Hernández-Ruiz, Á., Valero, T., Ávila, J. M., Ruiz, E., Lara Villoslada, F., Leis, R., Martínez de Victoria, E., Moreno, J. M., M. Ortega, R., Ruiz-López, M. D., Varela-Moreiras, G., & Gil, Á. (2020). Energy Intake, Macronutrient Profile and Food Sources of Spanish Children Aged One to <10 Years—Results from the EsNuPI Study †. Nutrients, 12(4), 893. https://doi.org/10.3390/nu12040893