Effect of a 12-Week Almond-Enriched Diet on Biomarkers of Cognitive Performance, Mood, and Cardiometabolic Health in Older Overweight Adults

 ,
,  ,
,  ,
,
Abstract
1. Introduction
2. Materials and Methods
2.1. Study Design
2.2. Participants
2.3. Group Allocation and Blinding
2.4. Study Intervention
2.4.1. Study Foods
2.4.2. Dietary Intervention
2.5. Procedure
2.5.1. Energy Intake and Dietary Assessment Via Quantitative Food Diaries
2.5.2. Estimated Energy Expenditure
2.6. Clinical Assessments
2.6.1. Demographic and Morphometric Measures
2.6.2. Cognitive Function and Mood Battery
- 1Composite score for Attention-Reaction Time (RT) = (zSimple RT + zChoice RT + zFour Choice RT + zRapid Visual Information Processing)/4
- 2Composite score for Attention-Accuracy = (zFour Choice RT + zRapid Visual Information Processing + zSerial subtraction 3 + zSerial subtraction 7)/4
- 3Composite score for Working Memory-RT = (zNumeric Working Memory + zN-back + zCorsi blocks + zRapid Visual Information Processing)/4
- 4Composite score for Working Memory-Accuracy = (zNumeric Working Memory + zN-back + zCorsi blocks + zSerial subtraction 3 + zSerial subtraction 7 + zRapid Visual Information Processing)/6
- 5Composite score for Long Term Memory = (zDelayed Word Recall + zDelayed Word Recognition + zDelayed Picture Recognition + zVerbal Fluency + zVerbal Fluency Exclusion)/5
- 6Composite score for Executive Function = (zStroop Congruent correct + zStroop Incongruent correct + zVerbal Fluency + zVerbal Fluency Exclusion + zSerial subtraction 3 + zSerial subtraction 7 + zPeg and Ball (accuracy = negatively scored errors))/7
2.6.3. Resting Blood Pressure and Arterial Compliance
2.6.4. Biochemical Analyses
2.7. Sample Size
2.8. Statistical Analysis
3. Results
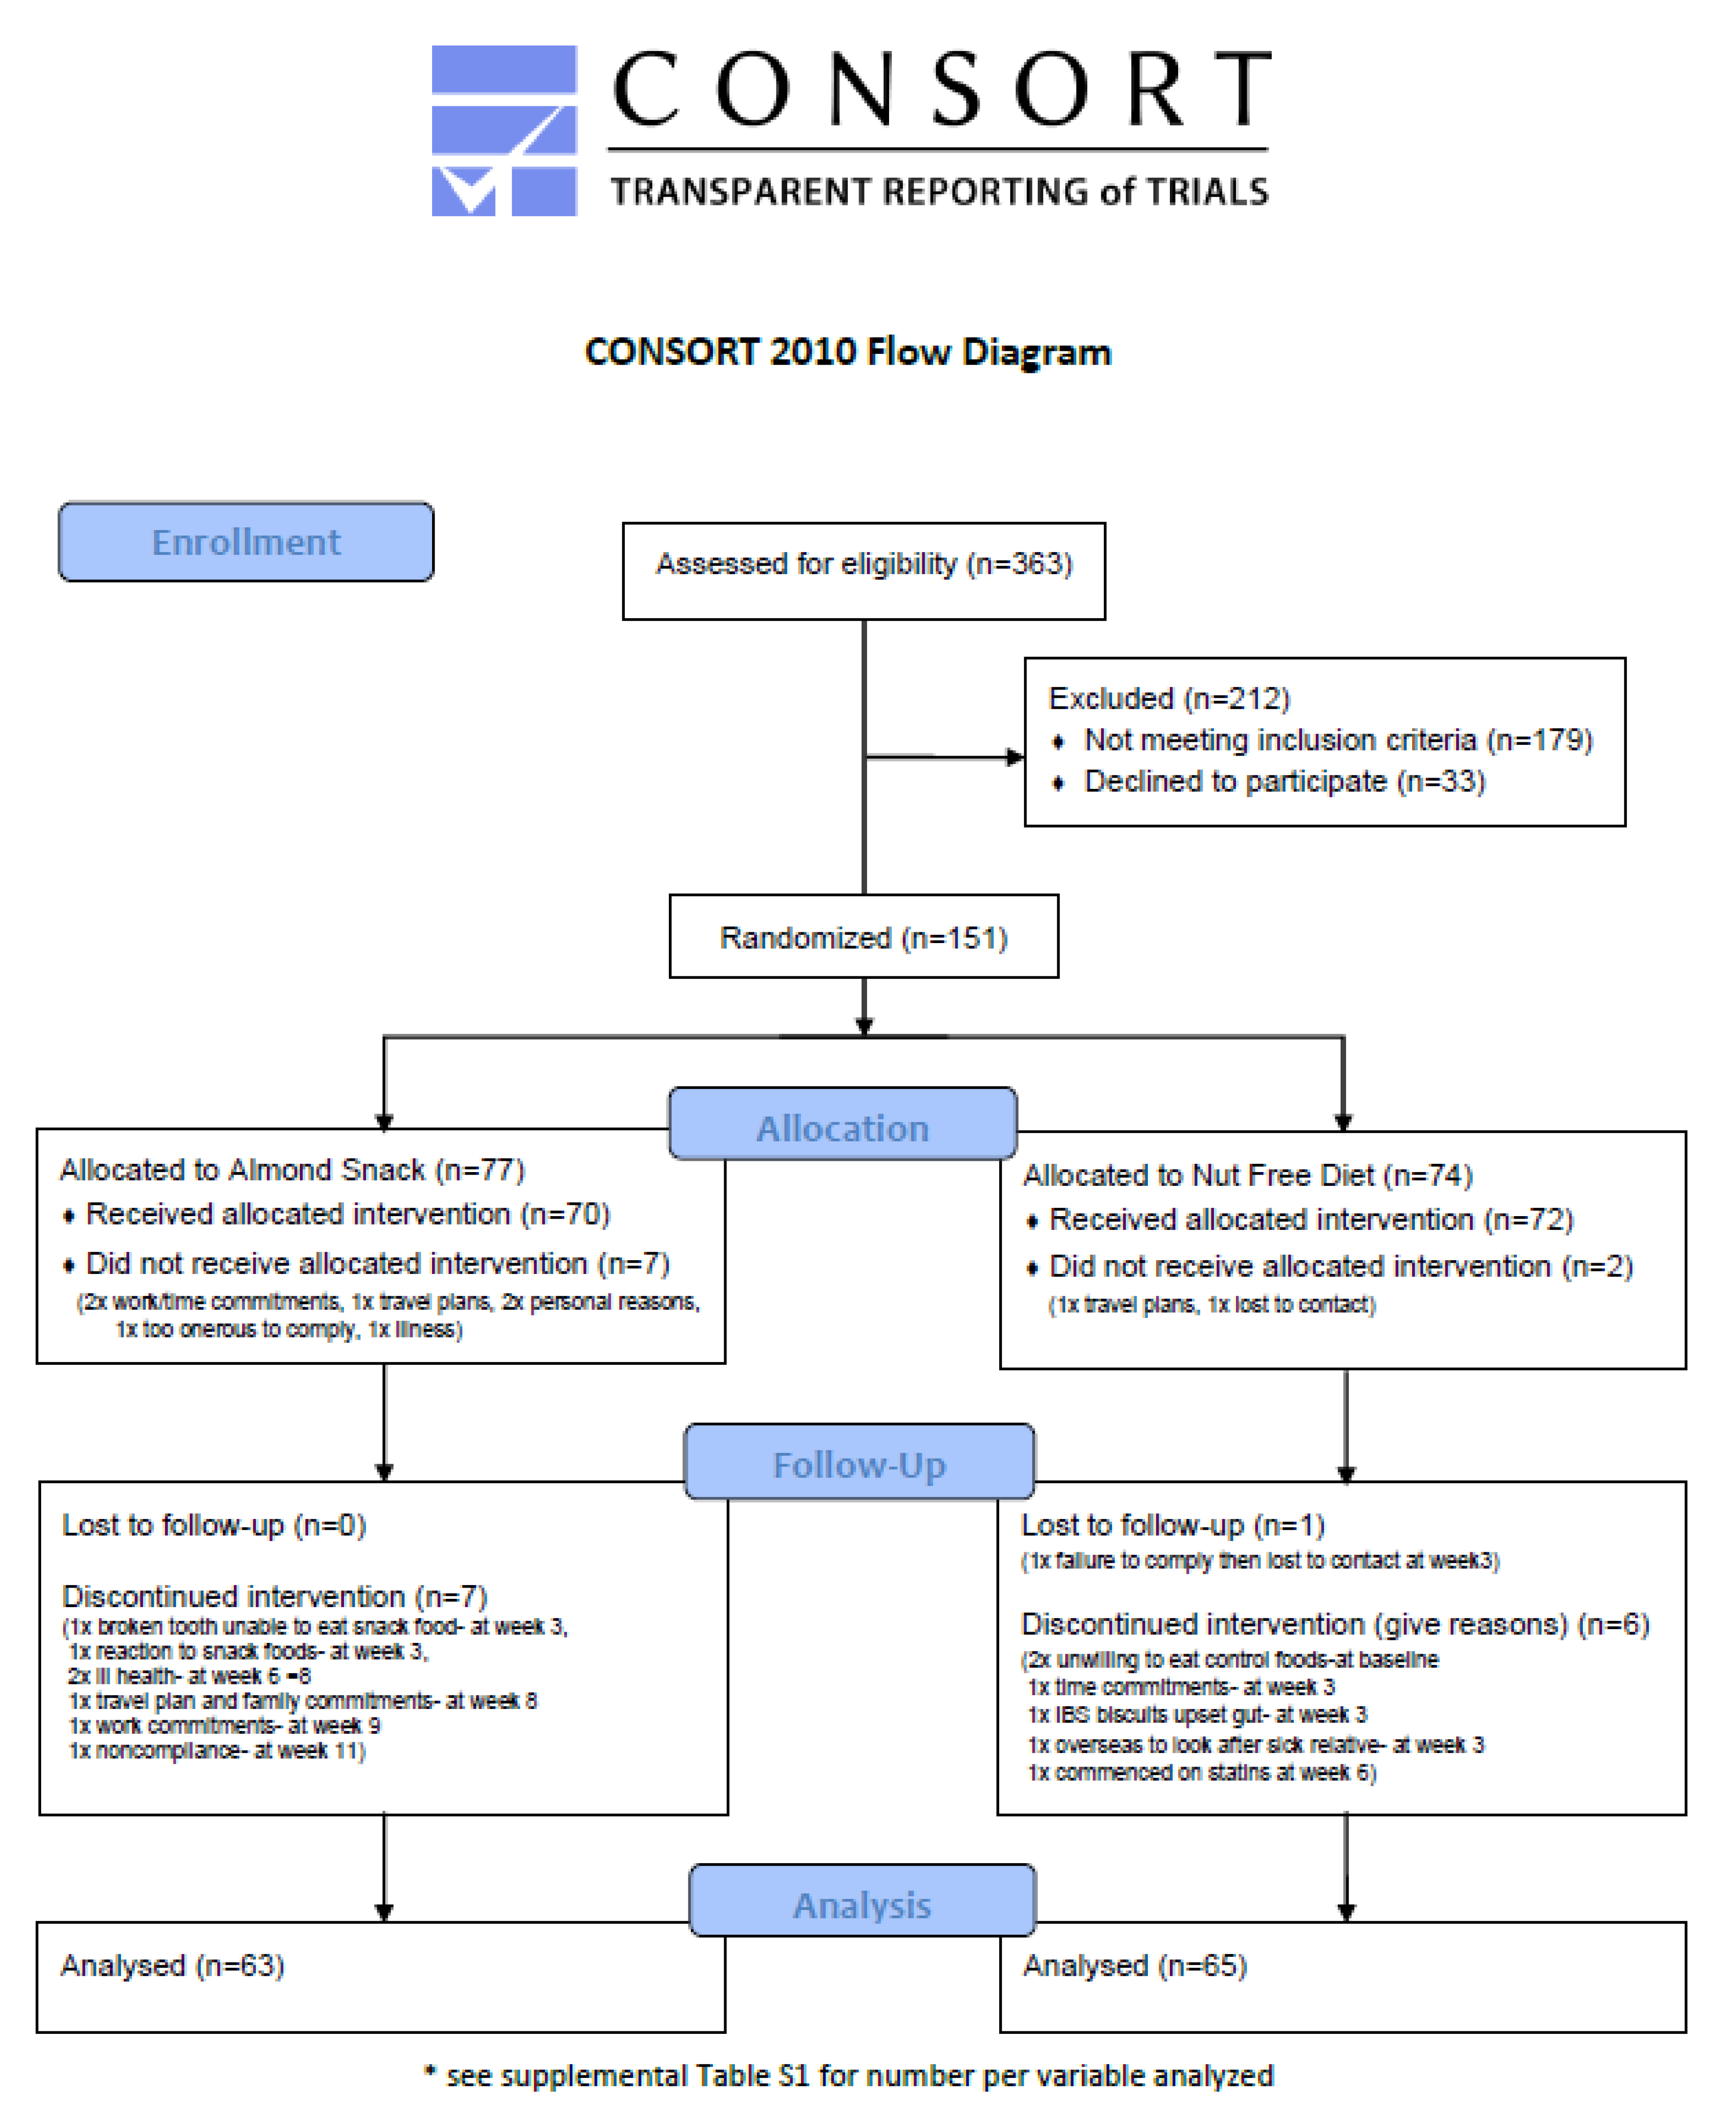
3.1. Participants
3.2. Nutrient Intake and Energy Balance
3.3. Cognition and Self Report Measures of Mood
3.4. Cardiometabolic Biomarkers
4. Discussion
5. Conclusions
Supplementary Materials
Author Contributions
Funding
Acknowledgments
Conflicts of Interest
References
- Becerra-Tomás, N.; Graniel, I.P.; Kendall, C.W.; Kahleova, H.; Rahelić, D.; Sievenpiper, J.L.; Salas-Salvadó, J. Nut consumption and incidence of cardiovascular diseases and cardiovascular disease mortality: A meta-analysis of prospective cohort studies. Nutr. Rev. 2019, 77, 691–709. [Google Scholar] [CrossRef]
- Zhang, Y.; Zhang, D.-Z. Relationship Between Nut Consumption and Metabolic Syndrome: A Meta-Analysis of Observational Studies. J. Am. Coll. Nutr. 2019, 38, 499–505. [Google Scholar] [CrossRef]
- Viguiliouk, E.; Kendall, C.W.C.; Mejia, S.B.; Cozma, A.I.; Ha, V.; Mirrahimi, A.; Jayalath, V.H.; Augustin, L.S.A.; Chiavaroli, L.; Leiter, L.A.; et al. Effect of Tree Nuts on Glycemic Control in Diabetes: A Systematic Review and Meta-Analysis of Randomized Controlled Dietary Trials. PLoS ONE 2014, 9, e103376. [Google Scholar] [CrossRef]
- Rusu, M.E.; Mocan, A.; Ferreira, I.C.F.R.; Popa, D.-S. Health Benefits of Nut Consumption in Middle-Aged and Elderly Population. Antioxidants 2019, 8, 302. [Google Scholar] [CrossRef] [PubMed]
- Taylor, V.H.; MacQueen, G.M. Cognitive dysfunction associated with metabolic syndrome. Obes. Rev. 2007, 8, 409–418. [Google Scholar] [CrossRef] [PubMed]
- Farruggia, M.C.; Small, D.M. Effects of adiposity and metabolic dysfunction on cognition: A review. Physiol. Behav. 2019, 208, 112578. [Google Scholar] [CrossRef]
- Nilsson, A.C.; Tovar, J.; Johansson, M.; Radeborg, K.; Björck, I. A diet based on multiple functional concepts improves cognitive performance in healthy subjects. Nutr. Metab. 2013, 10, 49. [Google Scholar] [CrossRef]
- Casas, R.; Sacanella, E.; Estruch, R. The immune protective effect of the Mediterranean diet against chronic low-grade inflammatory diseases. Endocrine Metab. Immune Disord. Drug Targets 2014, 14, 245–254. [Google Scholar] [CrossRef]
- Neale, E.P.; Tapsell, L.C.; Guan, V.; Batterham, M.J. The effect of nut consumption on markers of inflammation and endothelial function: A systematic review and meta-analysis of randomised controlled trials. BMJ Open 2017, 7, e016863. [Google Scholar] [CrossRef]
- Morgillo, S.; Hill, A.M.; Coates, A. The Effects of Nut Consumption on Vascular Function. Nutrients 2019, 11, 116. [Google Scholar] [CrossRef]
- Barbour, J.; Howe, P.R.C.; Buckley, J.D.; Bryan, J.; Coates, A. Nut consumption for vascular health and cognitive function. Nutr. Res. Rev. 2014, 27, 131–158. [Google Scholar] [CrossRef] [PubMed]
- Katz, D.L.; Davidhi, A.; Ma, Y.; Kavak, Y.; Bifulco, L.; Njike, V.Y. Effects of walnuts on endothelial function in overweight adults with visceral obesity: A randomized, controlled, crossover trial. J. Am. Coll. Nutr. 2012, 31, 415–423. [Google Scholar] [CrossRef] [PubMed]
- Örem, A.; Yucesan, F.B.; Örem, C.; Akcan, B.; Kural, B.V.; Alasalvar, C.; Shahidi, F. Hazelnut-enriched diet improves cardiovascular risk biomarkers beyond a lipid-lowering effect in hypercholesterolemic subjects. J. Clin. Lipidol. 2013, 7, 123–131. [Google Scholar] [CrossRef]
- Choudhury, K.; Clark, J.; Griffiths, H.R. An almond-enriched diet increases plasma α-tocopherol and improves vascular function but does not affect oxidative stress markers or lipid levels. Free. Radic. Res. 2014, 48, 599–606. [Google Scholar] [CrossRef]
- Carey, A.N.; Fisher, D.R.; Joseph, J.A.; Shukitt-Hale, B. The ability of walnut extract and fatty acids to protect against the deleterious effects of oxidative stress and inflammation in hippocampal cells. Nutr. Neurosci. 2013, 16, 13–20. [Google Scholar] [CrossRef]
- Pribis, P.; Shukitt-Hale, B. Cognition: The new frontier for nuts and berries. Am. J. Clin. Nutr. 2014, 100, 347S–352S. [Google Scholar] [CrossRef]
- Naqvi, A.Z.; Harty, B.; Mukamal, K.J.; Stoddard, A.M.; Vitolins, M.; Dunn, J.E. Monounsaturated, trans, and saturated Fatty acids and cognitive decline in women. J. Am. Geriatr. Soc. 2011, 59, 837–843. [Google Scholar] [CrossRef]
- Morris, M.C.; Evans, D.A.; Bienias, J.L.; Tangney, C.C.; Wilson, R.S. Vitamin E and cognitive decline in older persons. Arch. Neurol. 2002, 59, 1125–1132. [Google Scholar] [CrossRef]
- Miller, M.; Thangthaeng, N.; Poulose, S.M.; Shukitt-Hale, B. Role of fruits, nuts, and vegetables in maintaining cognitive health. Exp. Gerontol. 2017, 94, 24–28. [Google Scholar] [CrossRef]
- Martinez-Lapiscina, E.H.; Clavero, P.; Toledo, E.; Estruch, R.; Salas-Salvadó, J.; Julián, B.S.; Sanchez-Tainta, A.; Ros, E.; Valls-Pedret, C.; Martínez-González, M. Ángel Mediterranean diet improves cognition: The PREDIMED-NAVARRA randomised trial. J. Neurol. Neurosurg. Psychiatry 2013, 84, 1318–1325. [Google Scholar] [CrossRef]
- Nooyens, A.C.; Bueno-De-Mesquita, H.B.; Van Boxtel, M.P.J.; Van Gelder, B.M.; Verhagen, H.; Verschuren, W.M.M. Fruit and vegetable intake and cognitive decline in middle-aged men and women: The Doetinchem Cohort Study. Br. J. Nutr. 2011, 106, 752–761. [Google Scholar] [CrossRef]
- O’Brien, J.; Okereke, O.; Devore, E.; Rosner, B.; Breteler, M.; Grodstein, F. Long-term intake of nuts in relation to cognitive function in older women. J. Nutr. Heal. Aging 2014, 18, 496–502. [Google Scholar] [CrossRef] [PubMed]
- Lourida, I.; Soni, M.; Thompson-Coon, J.; Purandare, N.; Lang, I.; Ukoumunne, O.C.; Llewellyn, D.J. Mediterranean Diet, Cognitive Function, and Dementia. Epidemiology 2013, 24, 479–489. [Google Scholar] [CrossRef] [PubMed]
- Tsivgoulis, G.; Judd, S.; Letter, A.; Alexandrov, A.V.; Howard, G.; Nahab, F.; Unverzagt, F.W.; Moy, C.; Howard, V.J.; Kissela, B.; et al. Adherence to a Mediterranean diet and risk of incident cognitive impairment. Neurology 2013, 80, 1684–1692. [Google Scholar] [CrossRef] [PubMed]
- Dhillon, J.; Tan, S.-Y.; Mattes, R. Effects of almond consumption on the post-lunch dip and long-term cognitive function in energy-restricted overweight and obese adults. Br. J. Nutr. 2017, 117, 395–402. [Google Scholar] [CrossRef]
- Pribis, P.; Bailey, R.N.; Russell, A.A.; Kilsby, M.A.; Hernandez, M.; Craig, W.J.; Grajales, T.; Shavlik, D.; Sabaté, J. Effects of walnut consumption on cognitive performance in young adults. Br. J. Nutr. 2011, 107, 1393–1401. [Google Scholar] [CrossRef]
- Cardoso, B.R.; Apolinario, D.; Bandeira, V.D.S.; Busse, A.L.; Magaldi, R.M.; Jacob-Filho, W.; Cozzolino, S. Effects of Brazil nut consumption on selenium status and cognitive performance in older adults with mild cognitive impairment: A randomized controlled pilot trial. Eur. J. Nutr. 2015, 55, 107–116. [Google Scholar] [CrossRef]
- Arab, L.; Guo, R.; Elashoff, D.A. Lower Depression Scores among Walnut Consumers in NHANES. Nutrients 2019, 11, 275. [Google Scholar] [CrossRef]
- Su, Q.; Yu, B.; He, H.; Zhang, Q.; Meng, G.; Wu, H.; Du, H.; Liu, L.; Shi, H.; Xia, Y.; et al. NUT CONSUMPTION IS ASSOCIATED WITH DEPRESSIVE SYMPTOMS AMONG CHINESE ADULTS. Depress. Anxiety 2016, 33, 1065–1072. [Google Scholar] [CrossRef]
- Pribis, P. Effects of Walnut Consumption on Mood in Young Adults—A Randomized Controlled Trial. Nutrients 2016, 8, 668. [Google Scholar] [CrossRef]
- Nasreddine, Z.S.; Phillips, N.A.; Bédirian, V.; Charbonneau, S.; Whitehead, V.; Collin, I.; Cummings, J.L.; Chertkow, H. The Montreal Cognitive Assessment, MoCA: A Brief Screening Tool For Mild Cognitive Impairment. J. Am. Geriatr. Soc. 2005, 53, 695–699. [Google Scholar] [CrossRef] [PubMed]
- Stunkard, A.J.; Messick, S. The three-factor eating questionnaire to measure dietary restraint, disinhibition and hunger. J. Psychosom. Res. 1985, 29, 71–83. [Google Scholar] [CrossRef]
- Altman, D.G.; Bland, J.M. Treatment allocation by minimisation. BMJ 2005, 330, 843. [Google Scholar] [CrossRef]
- Gebauer, S.K.; Novotny, J.A.; Bornhorst, G.M.; Baer, D.J. Food processing and structure impact the metabolizable energy of almonds. Food Funct. 2016, 7, 4231–4238. [Google Scholar] [CrossRef]
- Bowen, J.; Luscombe-Marsh, N.D.; Stonehouse, W.; Tran, C.; Rogers, G.B.; Johnson, N.; Thompson, C.H.; Brinkworth, G.D. Effects of almond consumption on metabolic function and liver fat in overweight and obese adults with elevated fasting blood glucose: A randomised controlled trial. Clin. Nutr. ESPEN 2019, 30, 10–18. [Google Scholar] [CrossRef] [PubMed]
- Roza, A.M.; Shizgal, H.M. The Harris Benedict equation reevaluated. Am. J. Clin. Nutr. 1984, 40, 168–182. [Google Scholar] [CrossRef] [PubMed]
- Ludlow, K.; Guston, D. Food Standards Australia New Zealand. Encycl. Nanosci. Soc. 2012. [Google Scholar]
- Willett, W.C. Overview of Nutritional Epidemiology; Oxford University Press (OUP): Oxford, UK, 1998; pp. 3–17. [Google Scholar]
- Bouchard, C.; Tremblay, A.; Leblanc, C.; Lortie, G.; Savard, R.; Theriault, G. A method to assess energy expenditure in children and adults. Am. J. Clin. Nutr. 1983, 37, 461–467. [Google Scholar] [CrossRef]
- Barbour, J.; Howe, P.R.C.; Buckley, J.D.; Bryan, J.; Coates, A. Effect of 12 Weeks High Oleic Peanut Consumption on Cardio-Metabolic Risk Factors and Body Composition. Nutrients 2015, 7, 7381–7398. [Google Scholar] [CrossRef]
- Garrow, J.S.; Webster, J. Quetelet’s index (W/H2) as a measure of fatness. Int. J. Obes. 1985, 9, 147–153. [Google Scholar]
- Kennedy, D.O.; Veasey, R.; Watson, A.W.; Dodd, F.; Jones, E.; Maggini, S.; Haskell, C.F. Effects of high-dose B vitamin complex with vitamin C and minerals on subjective mood and performance in healthy males. Psychopharmacol 2010, 211, 55–68. [Google Scholar] [CrossRef] [PubMed]
- Haskell-Ramsay, C.F.; Jackson, P.; Forster, J.; Dodd, F.L.; Bowerbank, S.; Kennedy, D.O. The Acute Effects of Caffeinated Black Coffee on Cognition and Mood in Healthy Young and Older Adults. Nutrients 2018, 10, 1386. [Google Scholar] [CrossRef] [PubMed]
- Bond, A.; Lader, M. The use of analogue scales in rating subjective feelings. Br. J. Med Psychol. 1974, 47, 211–218. [Google Scholar] [CrossRef]
- McNair, D.M.; Lorr, M.; Droppleman, L.F. Manual for the Profile of Mood States; Educational and Industrial Testing Services: San Diego, CA, USA, 1971. [Google Scholar]
- Prisant, L.M.; Pasi, M.; Jupin, D.; Prisant, M.E. Assessment of repeatability and correlates of arterial compliance. Blood Press. Monit. 2002, 7, 231–235. [Google Scholar] [CrossRef]
- Tao, Q.; Ang, T.F.A.; DeCarli, C.; Auerbach, S.H.; Devine, S.; Stein, T.D.; Zhang, X.; Massaro, J.; Au, R.; Qiu, W.Q. Association of Chronic Low-grade Inflammation With Risk of Alzheimer Disease in ApoE4 Carriers. JAMA Netw. Open 2018, 1, e183597. [Google Scholar] [CrossRef]
- Friedewald, W.T.; I Levy, R.; Fredrickson, D.S. Estimation of the Concentration of Low-Density Lipoprotein Cholesterol in Plasma, Without Use of the Preparative Ultracentrifuge. Clin. Chem. 1972, 18, 499–502. [Google Scholar] [CrossRef]
- Diabetes Trial Unit [Internet]. Oxford: University of Oxford. Available online: https://www.dtu.ox.ac.uk/ (accessed on 3 March 2018).
- Turner, T.; Burri, B.J. Rapid Isocratic HPLC Method and Sample Extraction Procedures for Measuring Carotenoid, Retinoid, and Tocopherol Concentrations in Human Blood and Breast Milk for Intervention Studies. Chromatogr. 2012, 75, 241–252. [Google Scholar] [CrossRef]
- Mejia, S.B.; Kendall, C.W.C.; Viguiliouk, E.; Augustin, L.S.; Ha, V.; I Cozma, A.; Mirrahimi, A.; Maroleanu, A.; Chiavaroli, L.; A Leiter, L.; et al. Effect of tree nuts on metabolic syndrome criteria: A systematic review and meta-analysis of randomised controlled trials. BMJ Open 2014, 4, e004660. [Google Scholar] [CrossRef]
- A Lee-Bravatti, M.; Wang, J.; E Avendano, E.; King, L.; Johnson, E.J.; Raman, G. Almond Consumption and Risk Factors for Cardiovascular Disease: A Systematic Review and Meta-analysis of Randomized Controlled Trials. Adv. Nutr. 2019, 10, 1076–1088. [Google Scholar] [CrossRef]
- Musa-Veloso, K.; Paulionis, L.; Poon, T.; Lee, H.Y. The effects of almond consumption on fasting blood lipid levels: A systematic review and meta-analysis of randomised controlled trials. J. Nutr. Sci. 2016, 5, 34. [Google Scholar] [CrossRef]
- Del Gobbo, L.C.; Falk, M.C.; Feldman, R.; Lewis, K.; Mozaffarian, D. Effects of tree nuts on blood lipids, apolipoproteins, and blood pressure: Systematic review, meta-analysis, and dose-response of 61 controlled intervention trials. Am. J. Clin. Nutr. 2015, 102, 1347–1356. [Google Scholar] [CrossRef] [PubMed]
- Tindall, A.M.; Johnston, E.A.; Kris-Etherton, P.M.; Petersen, K.S. The effect of nuts on markers of glycemic control: A systematic review and meta-analysis of randomized controlled trials. Am. J. Clin. Nutr. 2019, 109, 297–314. [Google Scholar] [CrossRef] [PubMed]
- Mazidi, M.; Rezaie, P.; Ferns, G.A.; Gao, H.-K. Impact of different types of tree nut, peanut, and soy nut consumption on serum C-reactive protein (CRP). Med. 2016, 95, e5165. [Google Scholar] [CrossRef]
- Mohammadifard, N.; Salehi-Abargouei, A.; Salas-Salvadó, J.; Guasch-Ferré, M.; Humphries, K.; Sarrafzadegan, N.; Salehi-Abarghouei, A. The effect of tree nut, peanut, and soy nut consumption on blood pressure: A systematic review and meta-analysis of randomized controlled clinical trials. Am. J. Clin. Nutr. 2015, 101, 966–982. [Google Scholar] [CrossRef]
- Barbour, J.; Howe, P.R.C.; Buckley, J.D.; Bryan, J.; Coates, A. Cerebrovascular and cognitive benefits of high-oleic peanut consumption in healthy overweight middle-aged adults. Nutr. Neurosci. 2016, 20, 555–562. [Google Scholar] [CrossRef]
- Lee, J.; Pase, M.; Pipingas, A.; Raubenheimer, J.; Thurgood, M.; Villalon, L.; MacPherson, H.; Gibbs, A.; Scholey, A. Switching to a 10-day Mediterranean-style diet improves mood and cardiovascular function in a controlled crossover study. Nutrients 2015, 31, 647–652. [Google Scholar] [CrossRef]
- Eby, G.A.; Eby, K.L. Magnesium for treatment-resistant depression: A review and hypothesis. Med Hypotheses 2010, 74, 649–660. [Google Scholar] [CrossRef]
- Murphy, K.J.; Parker, B.; Dyer, K.A.; Davis, C.; Coates, A.; Buckley, J.D.; Howe, P.R.C. A Comparison of Regular Consumption of Fresh Lean Pork, Beef and Chicken on Body Composition: A Randomized Cross-Over Trial. Nutrients 2014, 6, 682–696. [Google Scholar] [CrossRef]
- E Wickel, E.; Eisenmann, J.C. Within- and between-individual variability in estimated energy expenditure and habitual physical activity among young adults. Eur. J. Clin. Nutr. 2005, 60, 538–544. [Google Scholar] [CrossRef]
- The National Health and Medical Research Council. Med. J. Aust. 1979, 1.
- Makki, K.; Deehan, E.C.; Walter, J.; Bäckhed, F. The Impact of Dietary Fiber on Gut Microbiota in Host Health and Disease. Cell Host Microbe 2018, 23, 705–715. [Google Scholar] [CrossRef] [PubMed]
- Komanduri, M.; Gondalia, S.V.; Scholey, A.; Stough, C. The microbiome and cognitive aging: A review of mechanisms. Psychopharmacol. 2019, 236, 1559–1571. [Google Scholar] [CrossRef] [PubMed]
- Yang, Y.; Shields, G.S.; Guo, C.; Liu, Y. Executive function performance in obesity and overweight individuals: A meta-analysis and review. Neurosci. Biobehav. Rev. 2018, 84, 225–244. [Google Scholar] [CrossRef] [PubMed]


| All (n = 151) | Almond Diet (n = 77) | Nut-Free Diet (n = 74) | |
|---|---|---|---|
| Age (years) | 65 ± 8 | 64 ± 8 | 65 ± 8 |
| Height (m) | 1.67 ± 0.10 | 1.67 ± 0.09 | 1.67 ± 0.11 |
| Weight (kg) | 84.9 ± 13.0 | 84.4 ± 12.0 | 85.4 ± 14.0 |
| BMI (kg/m2) | 30.4 ± 3.7 | 30.3 ± 3.6 | 30.5 ± 3.8 |
| WC (cm) | 101.8 ± 10.5 | 101.2 ± 9.9 | 102.5 ± 11.0 |
| Body fat (%) | 35.6 ± 8.3 | 35.8 ± 8.5 | 35.3 ± 8.2 |
| Ethnicity 1 (count) | |||
| 1 Oceanian | 89 | 45 | 44 |
| 2 North-West European | 28 | 12 | 16 |
| 3 Southern and Eastern European | 12 | 8 | 4 |
| 4 North African and Middle Eastern | 1 | 1 | 0 |
| 5 South-East Asian | 2 | 1 | 1 |
| 6 North-East Asian | 0 | 0 | 0 |
| 7 Southern and Central Asian | 1 | 1 | 0 |
| 8 Peoples of the Americas | 5 | 1 | 4 |
| 9 Sub-Saharan African | 2 | 1 | 1 |
| Medications | |||
| % of population takingCholesterol lowering medication | 18.4 | 14.3 | 22.5 |
| Blood pressure lowering medication | 31.9 | 25.7 | 38.0 |
| Almond Diet | Nut-Free Diet | P Value | P Value | P Value | |||
|---|---|---|---|---|---|---|---|
| Pre-Treatment | Post-Treatment | Pre-Treatment | Post-Treatment | Group | Time | Group × Time | |
| Energy (kJ) | 9118 ± 647 | 9624 ± 659 | 8975 ± 644 | 8782 ± 659 | 0.133 | 0.385 | 0.053 |
| Carbohydrate (g) | 228 ± 24 | 211 ± 24 | 227 ± 23 | 226 ± 24 | 0.456 | 0.086 | 0.153 |
| Carbohydrate (%en) | 41 ± 3 | 36 ± 3 | 41 ± 3 | 42 ± 3 | 0.001 | <0.0001 | <0.0001 |
| Sugars (g) | 109 ± 5 | 99 ± 5 | 110 ± 5 | 93 ± 5 | 0.679 | <0.0001 | 0.300 |
| Protein (g) | 95 ± 3 | 99 ± 3 | 94 ± 3 | 88 ± 3 | 0.125 | 0.670 | 0.008 |
| Protein (%en) | 18 ± 5 | 18 ± 5 | 18 ± 5 | 17 ± 5 | 0.706 | 0.029 | 0.163 |
| Fat (g) | 87 ± 9 | 106 ± 9 | 82 ± 9 | 80 ± 9 | <0.0001 | 0.001 | <0.0001 |
| Fat (%en) | 35 ± 1 | 41 ± 1 | 34 ± 1 | 34 ± 1 | <0.0001 | <0.0001 | <0.0001 |
| Monounsaturated fat (g) | 32 ± 12 | 47 ± 12 | 31 ± 12 | 29 ± 12 | <0.0001 | <0.0001 | <0.0001 |
| Monounsaturated fat (%en) | 13 ± 2 | 19 ± 2 | 13 ± 2 | 12 ± 2 | <0.0001 | <0.0001 | <0.0001 |
| Polyunsaturated fat (g) | 13 ± 5 | 19 ± 5 | 12 ± 5 | 10 ± 5 | <0.0001 | <0.0001 | <0.0001 |
| Polyunsaturated fat (%en) | 5 ± 0 | 7 ± 0 | 5 ± 0 | 4 ± 0 | <0.0001 | <0.0001 | <0.0001 |
| Saturated fat (g) | 34 ± 1 | 31 ± 1 | 32 ± 1 | 34 ± 1 | 0.885 | 0.828 | 0.050 |
| Saturated fat (%en) | 14 ± 1 | 12 ± 1 | 13 ± 1 | 14 ± 1 | 0.038 | 0.620 | <0.0001 |
| Alcohol (g) | 8 ± 2 | 8 ± 2 | 10 ± 2 | 11 ± 2 | 0.258 | 0.646 | 0392 |
| Fibre (g) | 28 ± 1 | 29 ± 1 | 27 ± 1 | 24 ± 1 | 0.030 | 0.564 | 0.002 |
| Alpha tocopherol (mg) | 12 ± 4 | 26 ± 4 | 11 ± 4 | 10 ± 4 | <0.0001 | <0.0001 | <0.0001 |
| Sodium (mg) | 2451 ± 113 | 2397 ± 145 | 2498 ± 110 | 2687 ± 143 | 0.230 | 0.563 | 0.298 |
| Potassium (mg) | 3463 ± 117 | 3601 ± 122 | 3451 ± 116 | 3182 ± 121 | 0.120 | 0.378 | 0.007 |
| Magnesium (mg) | 397 ± 12 | 487 ± 13 | 389 ± 12 | 330 ± 12 | <0.0001 | 0.071 | <0.0001 |
| Calcium (mg) | 1065 ± 68 | 1094 ± 67 | 1020 ± 67 | 911 ± 67 | 0.057 | 0.208 | 0.031 |
| Iron (mg) | 12 ± 0 | 14 ± 1 | 13 ± 0 | 11 ± 1 | 0.248 | 0.620 | <0.0001 |
| Niacin (mg) | 25 ± 6 | 25 ± 6 | 25 ± 6 | 23 ± 6 | 0.530 | 0.341 | 0.355 |
| Niacin Equivalents (mg) | 43 ± 3 | 44 ± 3 | 43 ± 3 | 40 ± 3 | 0.205 | 0.475 | 0.099 |
| Riboflavin (mg) | 2.2 ± 0.1 | 2.9 ± 0.1 | 2.3 ± 0.1 | 2.0 ± 0.1 | 0.002 | 0.025 | <0.0001 |
| Caffeine (mg) | 222 ± 18 | 209 ± 14 | 204 ± 17 | 195 ± 14 | 0.393 | 0.414 | 0.854 |
| Energy Expenditure (kJ) | 14463 ± 270 | 14505 ± 266 | 14694 ± 280 | 14280 ± 273 | 0.580 | 0.989 | 0.234 |
| Almond Diet | Nut-Free Diet | ||||||
|---|---|---|---|---|---|---|---|
| Pre-Treatment | Post-Treatment | Pre-Treatment | Post-Treatment | Group (p) | Time (p) | Group × Time Interaction (p) | |
| Attention RT (composite Z-score)1 | −0.006 ± 0.081 | −0.006 ± 0.079 | 0.019 ± 0.081 | −0.067 ± 0.078 | 0.861 | 0.340 | 0.347 |
| Attention Accuracy (composite Z-score)2 | −0.087 ± 0.067 | −0.040 ± 0.071 | 0.064 ± 0.066 | 0.036 ± 0.070 | 0.217 | 0.769 | 0.264 |
| Working Memory RT (composite Z-score)3 | 0.030 ± 0.065 | −0.030 ±0.070 | 0.027 ± 0.066 | −0.065 ± 0.069 | 0.818 | 0.094 | 0.725 |
| Working Memory Accuracy (composite Z-score)4 | −0.122 ± 0.080 | −0.065 ± 0.087 | 0.090 ± 0.077 | 0.061 ± 0.085 | 0.138 | 0.627 | 0.148 |
| Long Term Memory Accuracy (composite Z-score)5 | −0.079 ± 0.066 | 0.020 ± 0.074 | −0.082 ± 0.065 | 0.100 ± 0.073 | 0.672 | 0.001 | 0.318 |
| Executive Function Accuracy (composite Z-score)6 | −0.151 ± 0.069 | −0.078 ± 0.075 | 0.074 ± 0.067 | 0.120 ± 0.074 | 0.028 | 0.084 | 0.693 |
| Simple RT (ms) | 345 ± 13 | 350 ± 12 | 354 ± 12 | 346 ± 12 | 0.861 | 0.836 | 0.523 |
| Choice RT -correct responses (%) | 94.82 ± 0.71 | 94.84 ± 0.58 | 94.43 ± 0.70 | 94.78 ± 0.57 | 0.771 | 0.707 | 0.741 |
| Choice RT (ms) | 490 ± 10 | 502 ± 11 | 495 ± 10 | 485 ± 11 | 0.611 | 0.919 | 0.161 |
| Four choice RT- correct responses (%) | 99.64 ± 0.10 | 99.72 ± 0.13 | 99.75 ± 0.10 | 99.50 ± 0.13 | 0.688 | 0.392 | 0.085 |
| Four choice RT (ms) | 690 ± 15 | 681 ± 16 | 713 ± 15 | 678 ± 16 | 0.624 | 0.008 | 0.108 |
| Rapid visual information processing -correct responses (%) | 33.1 ± 2.4 | 36.4 ± 2.3 | 35.1 ± 2.3 | 38.2 ± 2.6 | 0.560 | 0.015 | 0.924 |
| Rapid visual information processing RT (ms) | 539 ± 8 | 537 ± 8 | 540 ± 8 | 540 ± 8 | 0.809 | 0.823 | 0.795 |
| Rapid visual information processing (false alarms) | 10.1 ± 1.8 | 11.8 ± 1.8 | 12.6 ± 1.8 | 12.9 ± 1.8 | 0.459 | 0.182 | 0.363 |
| Numeric working memory accuracy (%) | 89.16 ± 1.12 | 89.70 ± 1.17 | 91.86 ± 1.11 | 92.65 ± 1.16 | 0.056 | 0.330 | 0.861 |
| Numeric working memory RT (ms) | 1301 ± 39 | 1291 ± 39 | 1245 ± 39 | 1183 ± 39 | 0.121 | 0.047 | 0.155 |
| N-Back correct Reponses (%) | 73.59 ± 2.49 | 73.60 ± 2.87 | 75.83 ± 2.46 | 74.09 ± 2.82 | 0.791 | 0.845 | 0.844 |
| N-Back RT (ms) | 868 ± 33 | 890 ± 39 | 912 ± 32 | 886 ± 38 | 0.640 | 0.950 | 0.361 |
| Corsi Blocks -span (score) | 5.07 ± 0.12 | 5.16 ± 0.13 | 5.23 ± 0.11 | 5.04 ± 0.13 | 0.889 | 0.551 | 0.132 |
| Corsi Blocks RT (ms) | 8320 ± 344 | 7722 ± 293 | 8670 ± 340 | 8257 ± 289 | 0.242 | 0.042 | 0.707 |
| Peg and Ball planning time (before responding) (ms) | 6399 ± 293 | 6032 ± 279 | 6098 ± 289 | 5669 ± 275 | 0.368 | 0.017 | 0.852 |
| Peg and Ball execution time (ms) | 16918 ± 614 | 15943 ± 546 | 16045 ± 607 | 14671 ± 539 | 0.169 | 0.000 | 0.444 |
| Peg and Ball Errors (score) | 4.66 ± 0.46 | 4.02 ± 0.48 | 4.02 ± 0.45 | 3.16 ± 0.47 | 0.141 | 0.074 | 0.786 |
| Immediate Word Recall- correct responses(score) | 5.36 ± 0.24 | 5.61 ± 0.25 | 5.55 ± 0.24 | 6.38 ± 0.24 | 0.105 | 0.002 | 0.094 |
| Delayed Word Recall- correct responses (score) | 3.61 ± 0.24 | 4.02 ± 0.26 | 3.88 ± 0.24 | 4.30 ± 0.26 | 0.383 | 0.019 | 0.983 |
| Word Recognition- correct responses (%) | 80.26 ± 1.17 | 81.71 ± 1.12 | 77.43 ± 1.15 | 81.44 ± 1.10 | 0.253 | 0.002 | 0.147 |
| Word Recognition RT (ms) | 1265 ± 38 | 1277 ± 42 | 1330 ± 38 | 1348 ± 42 | 0.177 | 0.560 | 0.917 |
| Picture Recognition- correct responses (%) | 96.94 ± 0.51 | 96.46 ± 0.52 | 96.05 ± 0.50 | 96.52 ± 0.51 | 0.518 | 0.975 | 0.170 |
| Picture Recognition RT (ms) | 957 ± 26 | 946 ± 26 | 1000 ± 26 | 991 ± 26 | 0.210 | 0.442 | 0.966 |
| Stroop Congruent accuracy (%) | 99.08 ± 0.31 | 99.02 ± 0.29 | 99.22 ± 0.30 | 98.81 ± 0.28 | 0.915 | 0.395 | 0.515 |
| Stroop Incongruent accuracy (%) | 95.08 ± 0.89 | 95.26 ± 0.91 | 97.23 ± 0.87 | 97.80 ± 0.90 | 0.041 | 0.496 | 0.729 |
| Stroop Congruent RT (ms) | 1163 ± 38 | 1115 ± 37 | 1130 ± 37 | 1084 ± 36 | 0.492 | 0.063 | 0.957 |
| Stroop Incongruent RT (ms) | 1245 ± 42 | 1262 ± 41 | 1262 ± 41 | 1230 ± 40 | 0.905 | 0.700 | 0.290 |
| Serial 3 (number of responses) | 20.7 ± 1.3 | 20.4 ± 1.3 | 23.7 ± 1.2 | 23.7 ± 1.3 | 0.071 | 0.813 | 0.772 |
| Serial 3 accuracy (%) | 18.27 ± 1.29 | 17.71 ± 1.36 | 21.39 ± 1.27 | 20.72 ± 1.35 | 0.089 | 0.248 | 0.917 |
| Serial 7 (number of responses) | 14.8 ± 1.1 | 15.3 ± 1.2 | 18.3 ± 1.1 | 18.1 ± 1.1 | 0.041 | 0.653 | 0.333 |
| Serial 7 accuracy (%) | 11.46 ± 1.13 | 12.01 ± 1.20 | 15.13 ± 1.11 | 14.72 ± 1.19 | 0.046 | 0.875 | 0.279 |
| Almond Diet | Nut-Free Diet | ||||||
|---|---|---|---|---|---|---|---|
| Pre-Treatment | Post-Treatment | Pre-Treatment | Post-Treatment | Group (p) | Time (p) | Group × Time Interaction (p) | |
| Profile of Mood States | |||||||
| Total mood disturbance | 0.89 ± 1.90 | 1.11 ± 2.20 | −3.74 ± 1.88 | −2.22 ± 2.17 | 0.117 | 0.538 | 0.644 |
| Tension | 4.63 ± 0.53 | 4.28 ± 0.43 | 3.93 ± 0.52 | 3.56 ± 0.43 | 0.222 | 0.305 | 0.991 |
| Depression | 2.04 ± 0.41 | 2.43 ± 0.51 | 1.23 ± 0.41 | 1.45 ± 0.50 | 0.093 | 0.413 | 0.827 |
| Anger | 1.36 ± 0.34 | 1.00 ± 0.33 | 1.02 ± 0.33 | 1.02 ± 0.33 | 0.663 | 0.536 | 0.543 |
| Fatigue | 4.35 ± 0.43 | 4.86 ± 0.57 | 3.38 ± 0.43 | 3.72 ± 0.56 | 0.079 | 0.268 | 0.826 |
| Confusion | 5.21 ± 0.40 | 5.09 ± 0.42 | 4.35 ± 0.40 | 4.14 ± 0.41 | 0.078 | 0.543 | 0.869 |
| Vigour | 16.70 ± 0.70 | 16.40 ± 0.77 | 17.68 ± 0.70 | 16.06 ± 0.76 | 0.733 | 0.042 | 0.163 |
| Bond-Lader Visual Analogue Scale | |||||||
| Alert | 55.92 ± 1.88 | 59.67 ± 1.99 | 61.37 ± 1.86 | 61.00 ± 1.96 | 0.173 | 0.133 | 0.067 |
| Content | 67.62 ± 1.78 | 70.38 ± 2.01 | 71.81 ± 1.77 | 71.74 ± 1.98 | 0.255 | 0.233 | 0.207 |
| Calm | 51.71 ± 2.22 | 55.12 ± 2.13 | 54.54 ± 2.20 | 57.34 ± 2.10 | 0.353 | 0.031 | 0.832 |
| Karolinska Sleepiness Score | 4.13 ± 0.18 | 4.18 ± 0.19 | 4.06 ± 0.18 | 4.14 ± 0.19 | 0.809 | 0.531 | 0.892 |
| Almond Diet | Nut-Free Diet | ||||||
|---|---|---|---|---|---|---|---|
| Pre-Treatment | Post-Treatment | Pre-Treatment | Post-Treatment | Group (p) | Time (p) | Group × Time Interaction (p) | |
| Total cholesterol (mmol/L) | 5.10 ± 0.13 | 4.91 ± 0.11 | 5.25 ± 0.12 | 5.21 ± 0.11 | 0.150 | 0.031 | 0.159 |
| HDL cholesterol (mmol/L) | 1.23 ± 0.04 | 1.44 ± 0.04 | 1.46 ± 0.04 | 1.47 ± 0.04 | 0.571 | 0.302 | 0.993 |
| LDL cholesterol (mmol/L) | 3.08 ± 0.12 | 2.94 ± 0.10 | 3.27 ± 0.11 | 3.19 ± 0.10 | 0.130 | 0.027 | 0.491 |
| Triglycerides (mmol/L) | 1.29 ± 0.07 | 1.15 ± 0.06 | 1.16 ± 0.07 | 1.18 ± 0.06 | 0.548 | 0.078 | 0.008 |
| Ratio Total chol:HDL | 3.86 ± 0.14 | 3.58 ± 0.12 | 3.78 ± 0.14 | 3.67 ± 0.12 | 0.969 | 0.000 | 0.102 |
| Systolic Blood Pressure (mm/Hg) | 133 ± 1 | 128 ± 2 | 132 ± 1 | 131 ± 2 | 0.550 | 0.002 | 0.044 |
| Diastolic Blood Pressure (mm/Hg) | 77 ± 1 | 75 ± 1 | 76 ± 1 | 76 ± 1 | 0.965 | 0.018 | 0.148 |
| Glucose (mmol/L) | 5.6 ± 0.1 | 5.6 ± 0.1 | 5.6 ± 0.1 | 5.5 ± 0.1 | 0.958 | 0.388 | 0.292 |
| Insulin (mU) | 7.17 ± 0.48 | 7.42 ± 0.48 | 7.51 ± 0.47 | 7.18 ± 0.47 | 0.934 | 0.859 | 0.213 |
| Small Arterial Compliance (ml/mmHg × 100) | 5.2 ± 0.3 | 5.3 ± 0.4 | 4.9 ± 0.3 | 5.2 ± 0.4 | 0.699 | 0.312 | 0.711 |
| Large Arterial Compliance (ml/mmHg × 10) | 15.2 ± 0.4 | 16.2 ± 0.5 | 16.2 ± 0.4 | 16.4 ± 0.5 | 0.335 | 0.070 | 0.227 |
| Intracellular Adhesion Molecule (ng) | 172 ± 10 | 188 ± 19 | 170 ± 10 | 154 ± 19 | 0.327 | 0.983 | 0.162 |
| Vascular Cell Adhesion Molecule (ng) | 1123 ± 29 | 1148 ± 32 | 1056 ± 29 | 1050 ± 31 | 0.057 | 0.400 | 0.228 |
| HOMA2-IR | 0.96 ± 0.06 | 0.99 ± 0.06 | 1.0 ± 0.06 | 0.95 ± 0.06 | 0.963 | 0.830 | 0.191 |
| HOMA2-%B | 73.5 ± 3.5 | 74.0 ± 3.3 | 72.0 ± 3.4 | 71.7 ± 3.2 | 0.666 | 0.936 | 0.813 |
| HOMA2-%S | 134.4 ± 9.0 | 132.7 ± 8.1 | 139.1 ± 8.8 | 136.5 ± 8.0 | 0.694 | 0.680 | 0.930 |
| Alpha tocopherol (µg/mL) | 4.85 ± 0.26 | 4.86 ± 0.21 | 4.69 ± 0.25 | 4.53 ± 0.21 | 0.435 | 0.526 | 0.481 |
| logCRP | 0.33 ± 0.051 | 0.344 ± 0.057 | 0.352 ± 0.050 | 0.300 ± 0.056 | 0.919 | 0.639 | 0.257 |
| Weight (kg) * | 84.52 ± 1.40 | 84.80 ± 1.38 | 85.15 ± 1.38 | 85.06 ± 1.36 | 0.819 | 0.418 | 0.141 |
| BMI (kg/m2) * | 30.23 ± 0.44 | 30.45 ± 0.44 | 30.56 ± 0.43 | 30.38 ± 0.43 | 0.791 | 0.297 | 0.125 |
| Waist Circumference (cm) * | 101.2 ± 1.1 | 101.4 ± 1.1 | 102.3 ± 1.1 | 102.0 ± 1.1 | 0.594 | 0.738 | 0.311 |
| Body fat (%) * | 35.8 ± 0.6 | 35.7 ± 0.6 | 35.5 ± 0.6 | 35.4 ± 0.6 | 0.747 | 0.464 | 0.839 |
© 2020 by the authors. Licensee MDPI, Basel, Switzerland. This article is an open access article distributed under the terms and conditions of the Creative Commons Attribution (CC BY) license (http://creativecommons.org/licenses/by/4.0/).
Share and Cite
Coates, A.M.; Morgillo, S.; Yandell, C.; Scholey, A.; Buckley, J.D.; Dyer, K.A.; Hill, A.M. Effect of a 12-Week Almond-Enriched Diet on Biomarkers of Cognitive Performance, Mood, and Cardiometabolic Health in Older Overweight Adults. Nutrients 2020, 12, 1180. https://doi.org/10.3390/nu12041180
Coates AM, Morgillo S, Yandell C, Scholey A, Buckley JD, Dyer KA, Hill AM. Effect of a 12-Week Almond-Enriched Diet on Biomarkers of Cognitive Performance, Mood, and Cardiometabolic Health in Older Overweight Adults. Nutrients. 2020; 12(4):1180. https://doi.org/10.3390/nu12041180
Chicago/Turabian StyleCoates, Alison Mary, Samantha Morgillo, Catherine Yandell, Andrew Scholey, Jonathan David Buckley, Kathryn Ann Dyer, and Alison Marie Hill. 2020. "Effect of a 12-Week Almond-Enriched Diet on Biomarkers of Cognitive Performance, Mood, and Cardiometabolic Health in Older Overweight Adults" Nutrients 12, no. 4: 1180. https://doi.org/10.3390/nu12041180
APA StyleCoates, A. M., Morgillo, S., Yandell, C., Scholey, A., Buckley, J. D., Dyer, K. A., & Hill, A. M. (2020). Effect of a 12-Week Almond-Enriched Diet on Biomarkers of Cognitive Performance, Mood, and Cardiometabolic Health in Older Overweight Adults. Nutrients, 12(4), 1180. https://doi.org/10.3390/nu12041180