2′-Fucosyllactose Supplementation Improves Gut-Brain Signaling and Diet-Induced Obese Phenotype and Changes the Gut Microbiota in High Fat-Fed Mice

 , ,
, ,  and
and 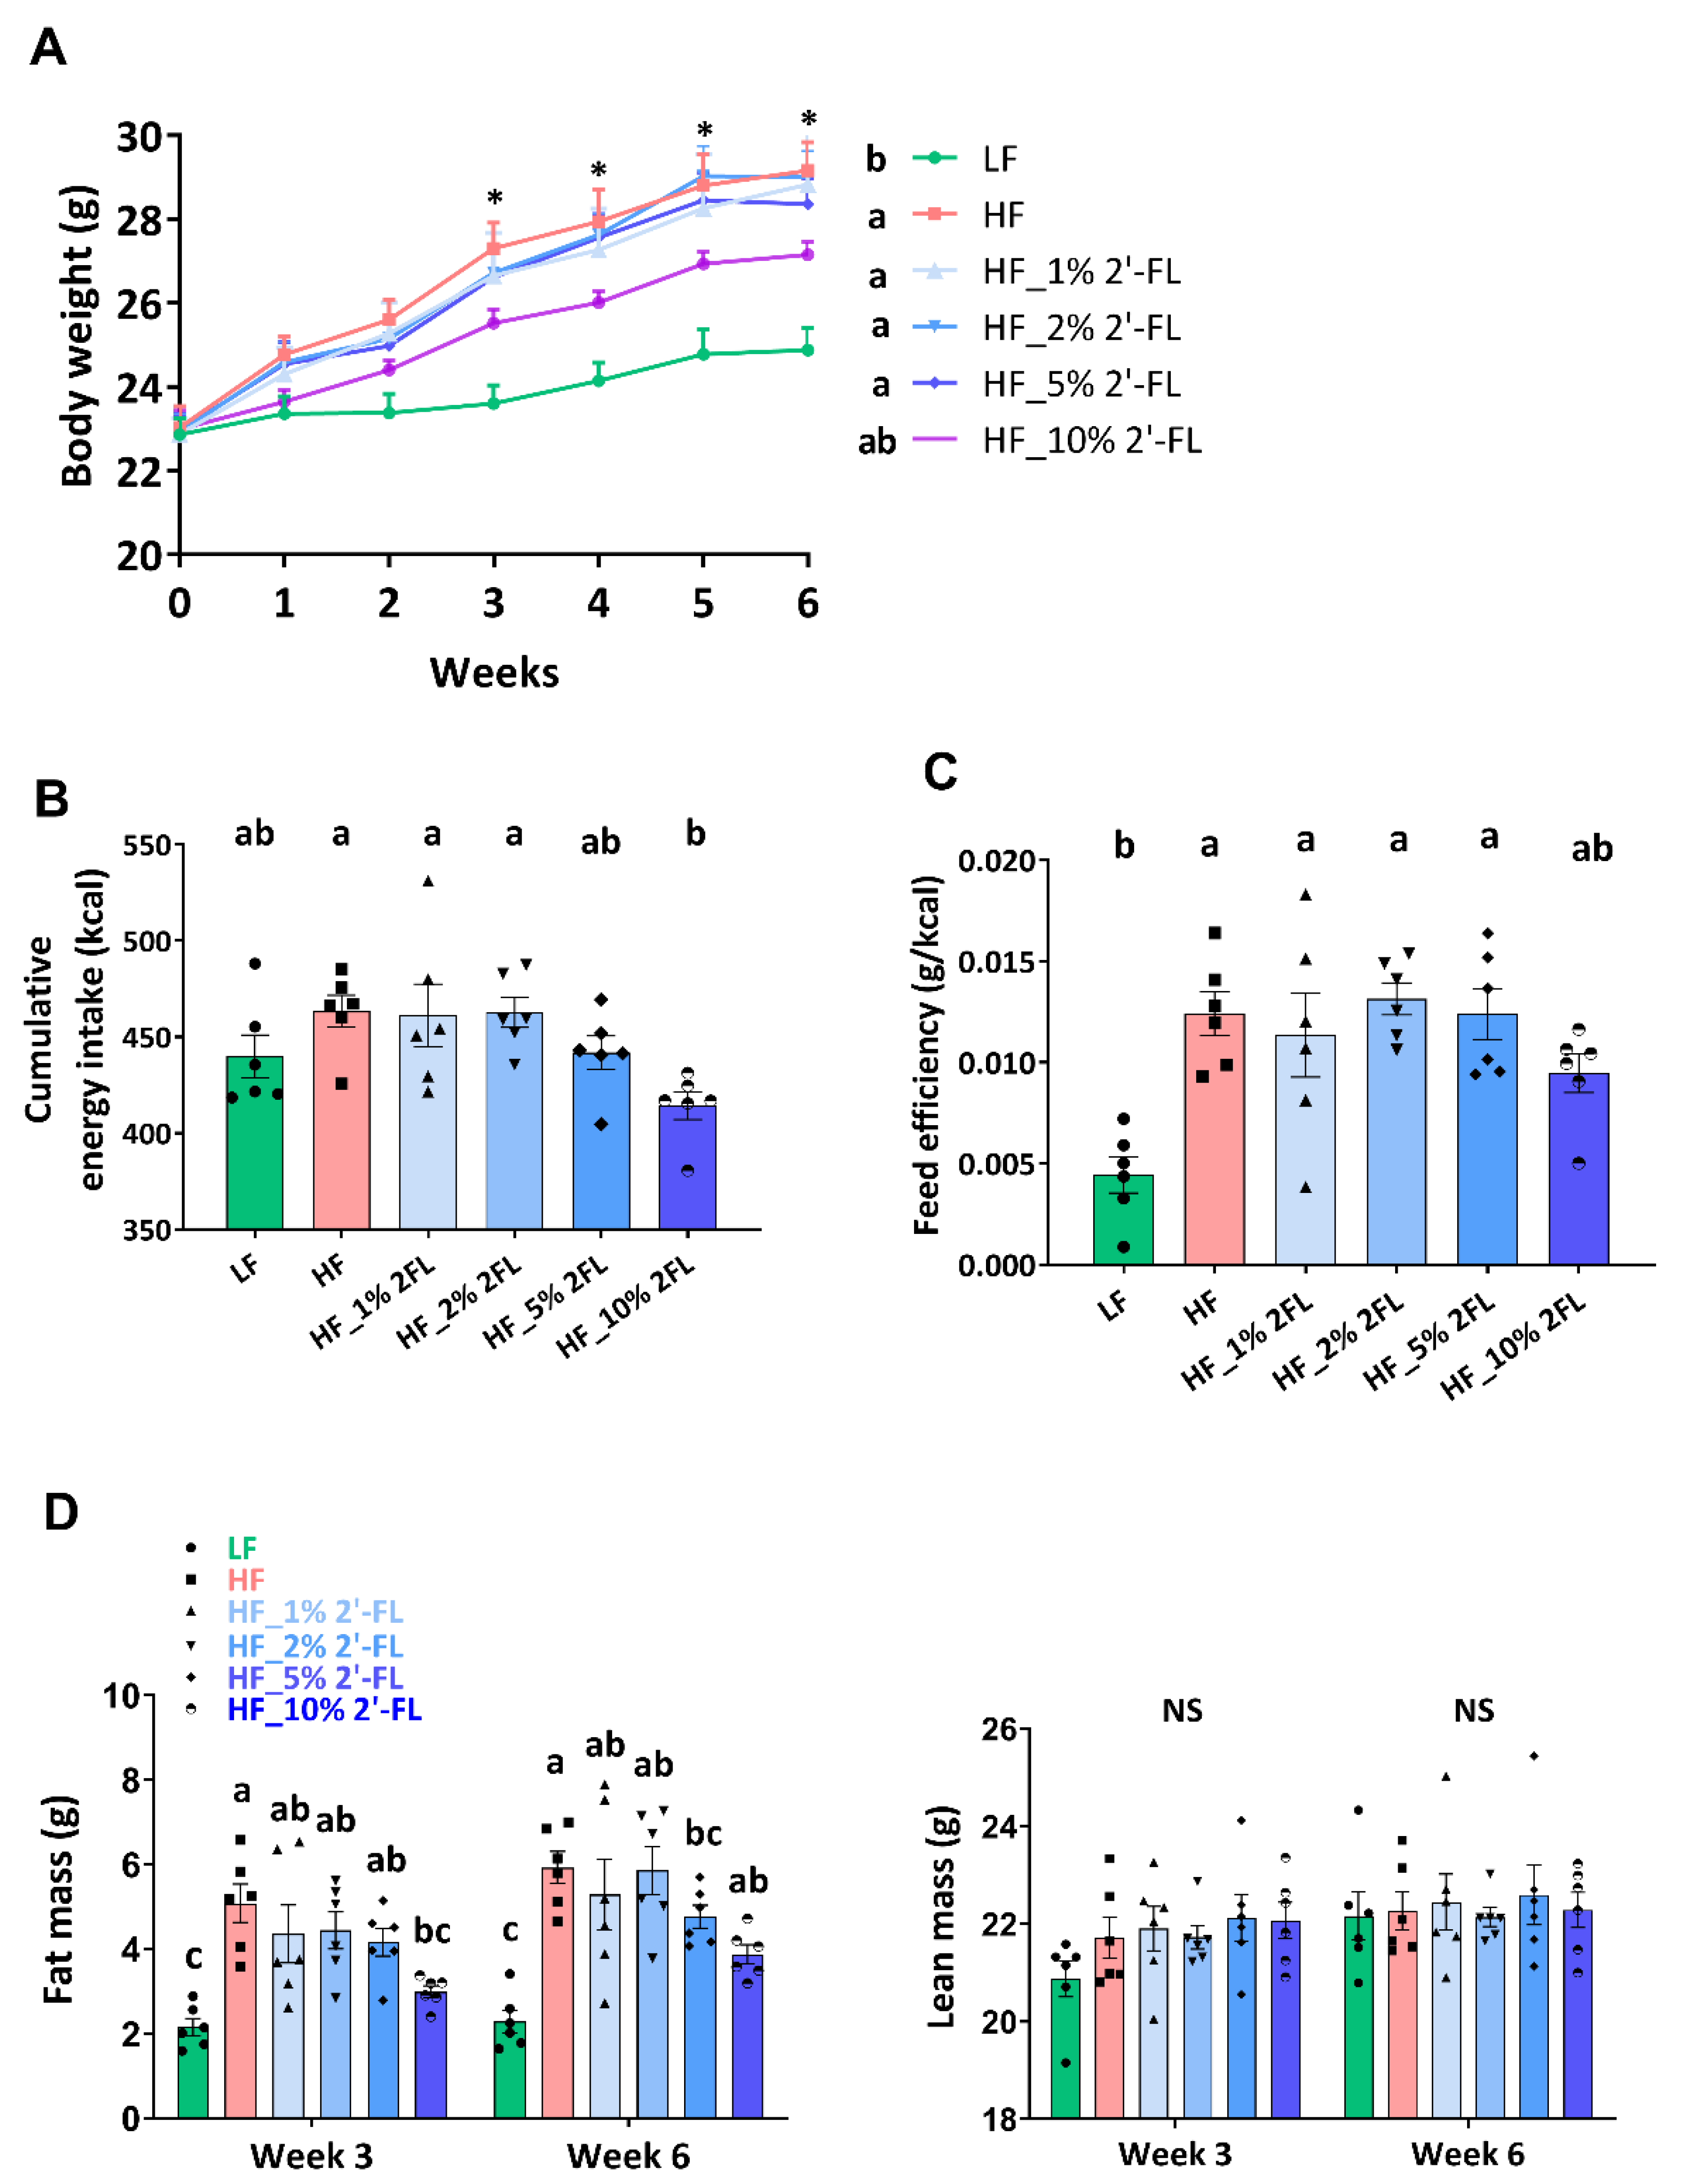
Abstract
1. Introduction
2. Methods and Materials
2.1. Animals and Diets
2.2. CCK Sensitivity Assessment
2.3. Oral Glucose Tolerance Test (OGTT)
2.4. RNA Extraction and Quantitative RT-PCR
2.5. Immunofluorescence
2.6. Histology
2.7. Hepatic Lipid Accumulation
2.8. Blood Analysis
2.9. Microbiota DNA Sequencing
2.10. Metabolomic Analysis
2.11. Statistical Analysis
3. Results
3.1. Supplementation of 2′-FL Improves Hyperphagic Phenotypes
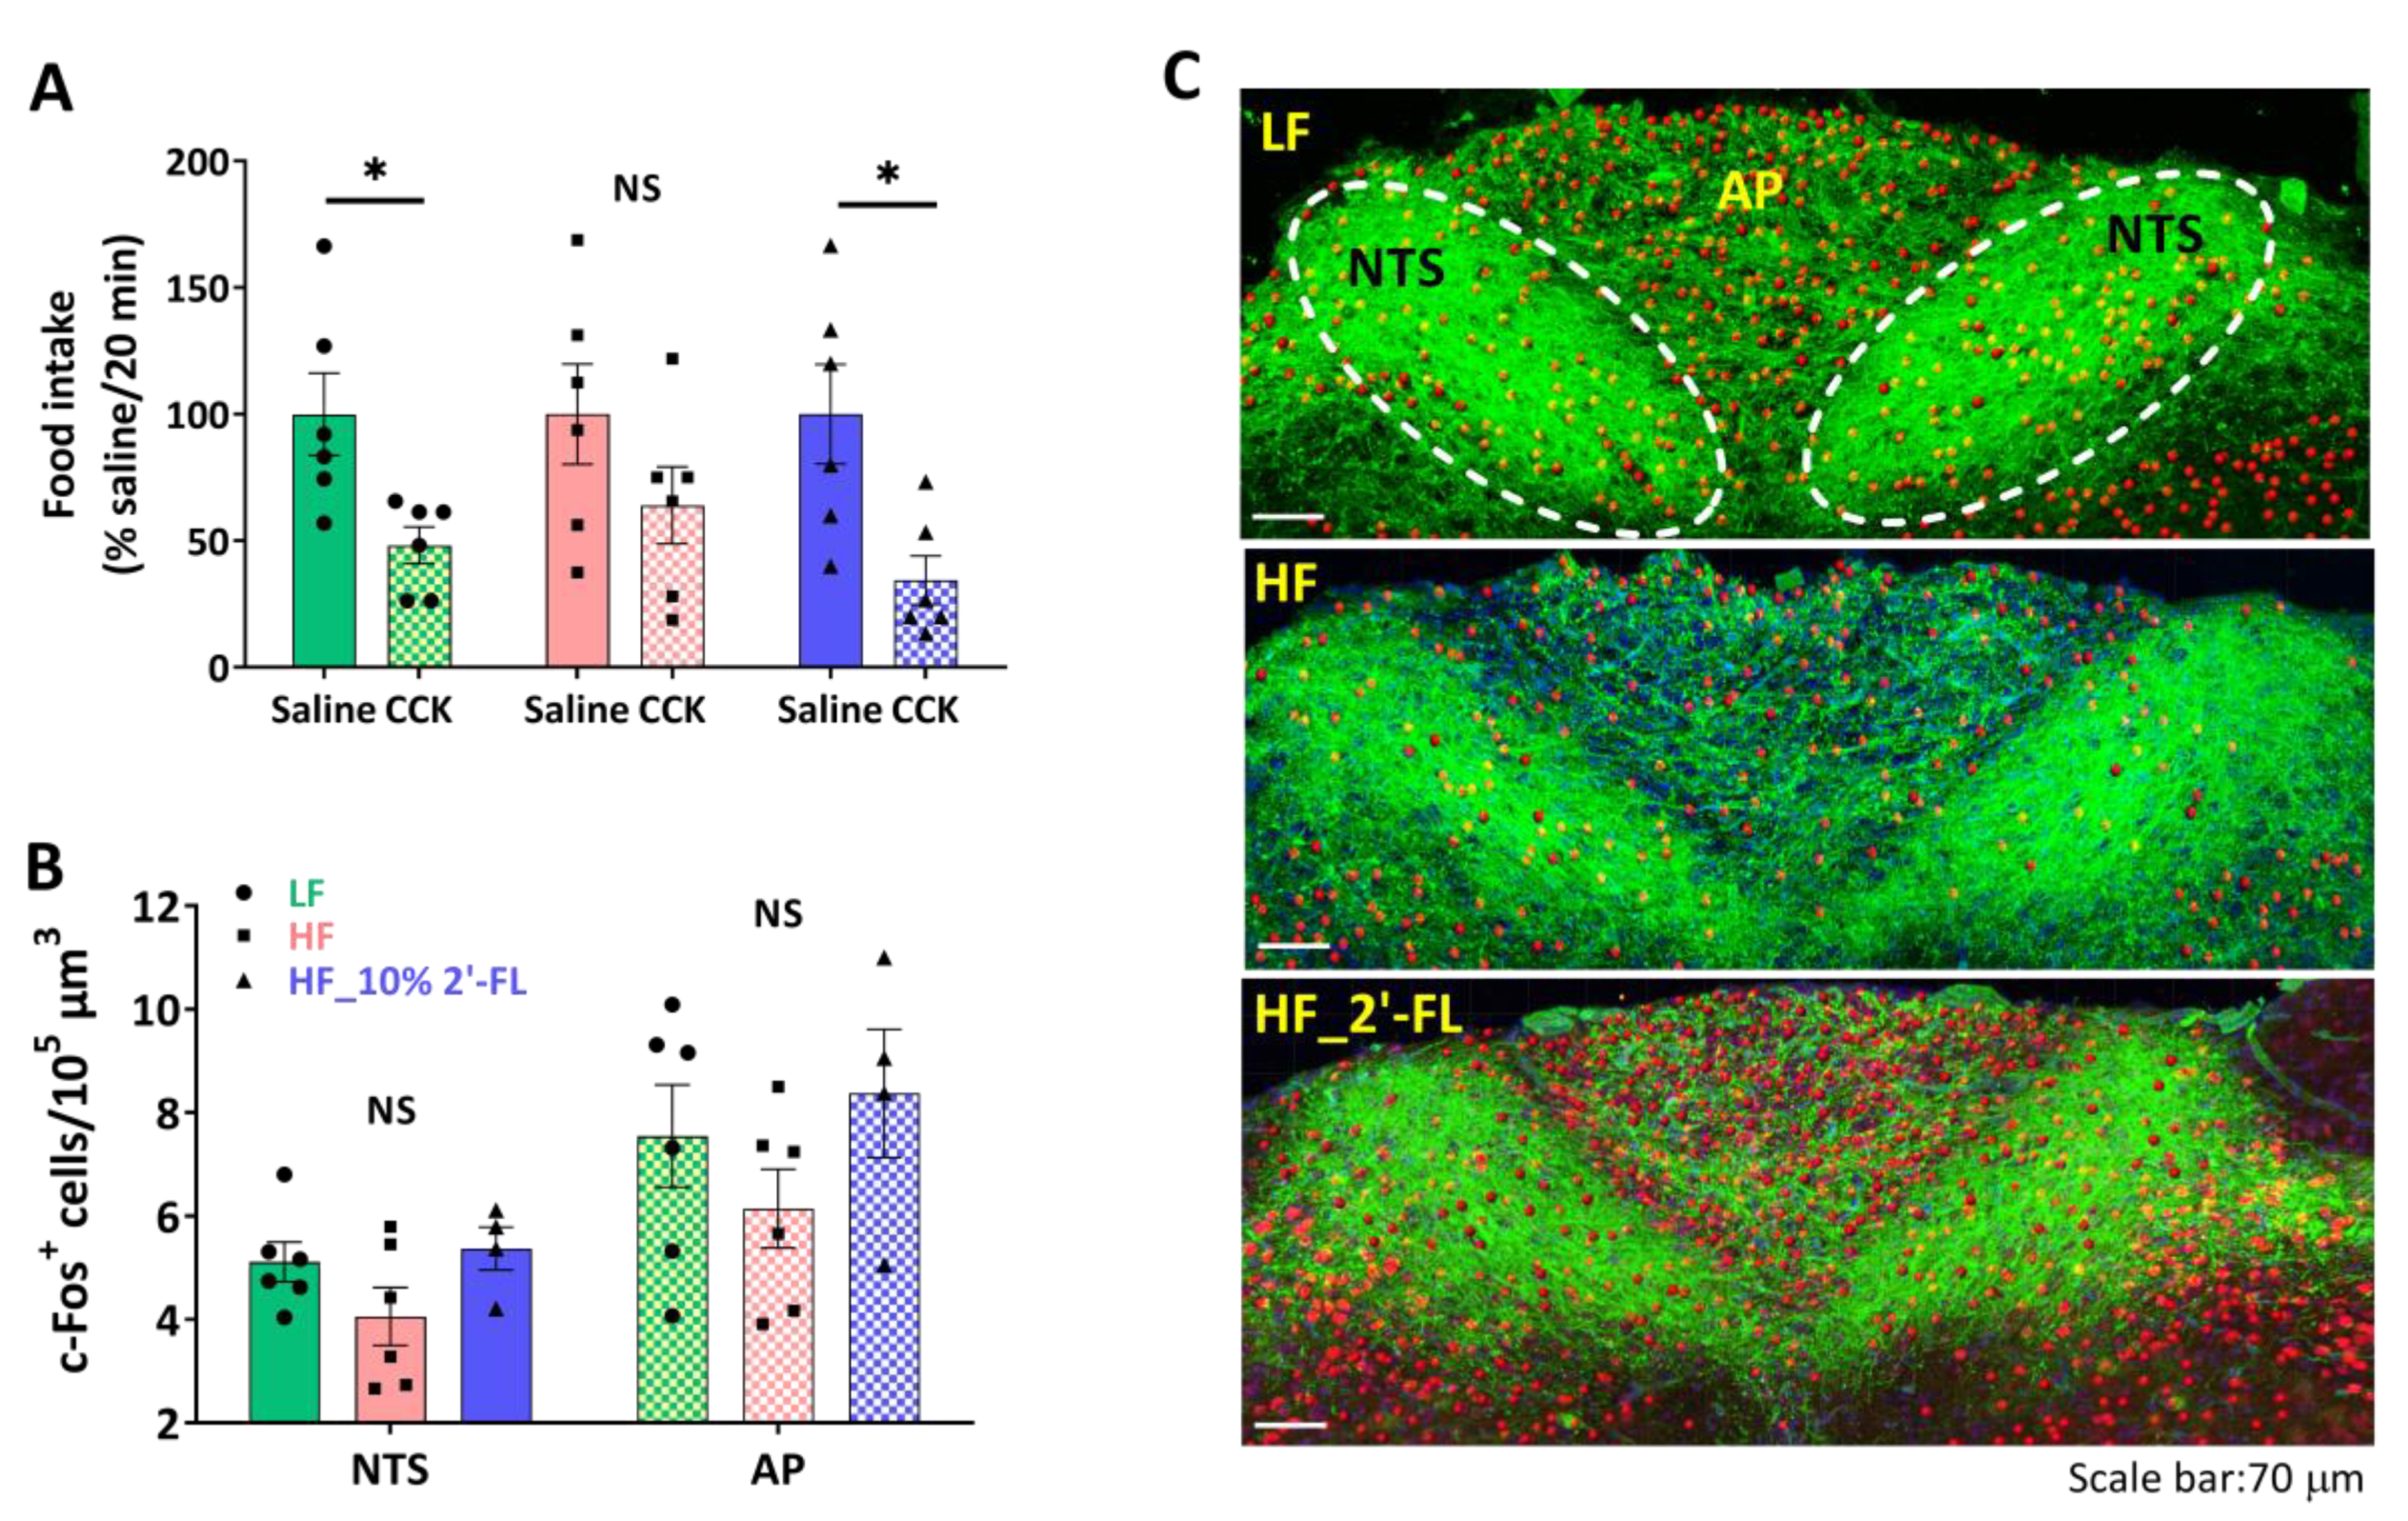
3.2. Supplementation of 10% 2′-FL Preserves the Integrity of Vagally-Mediated Gut-Brain Signaling
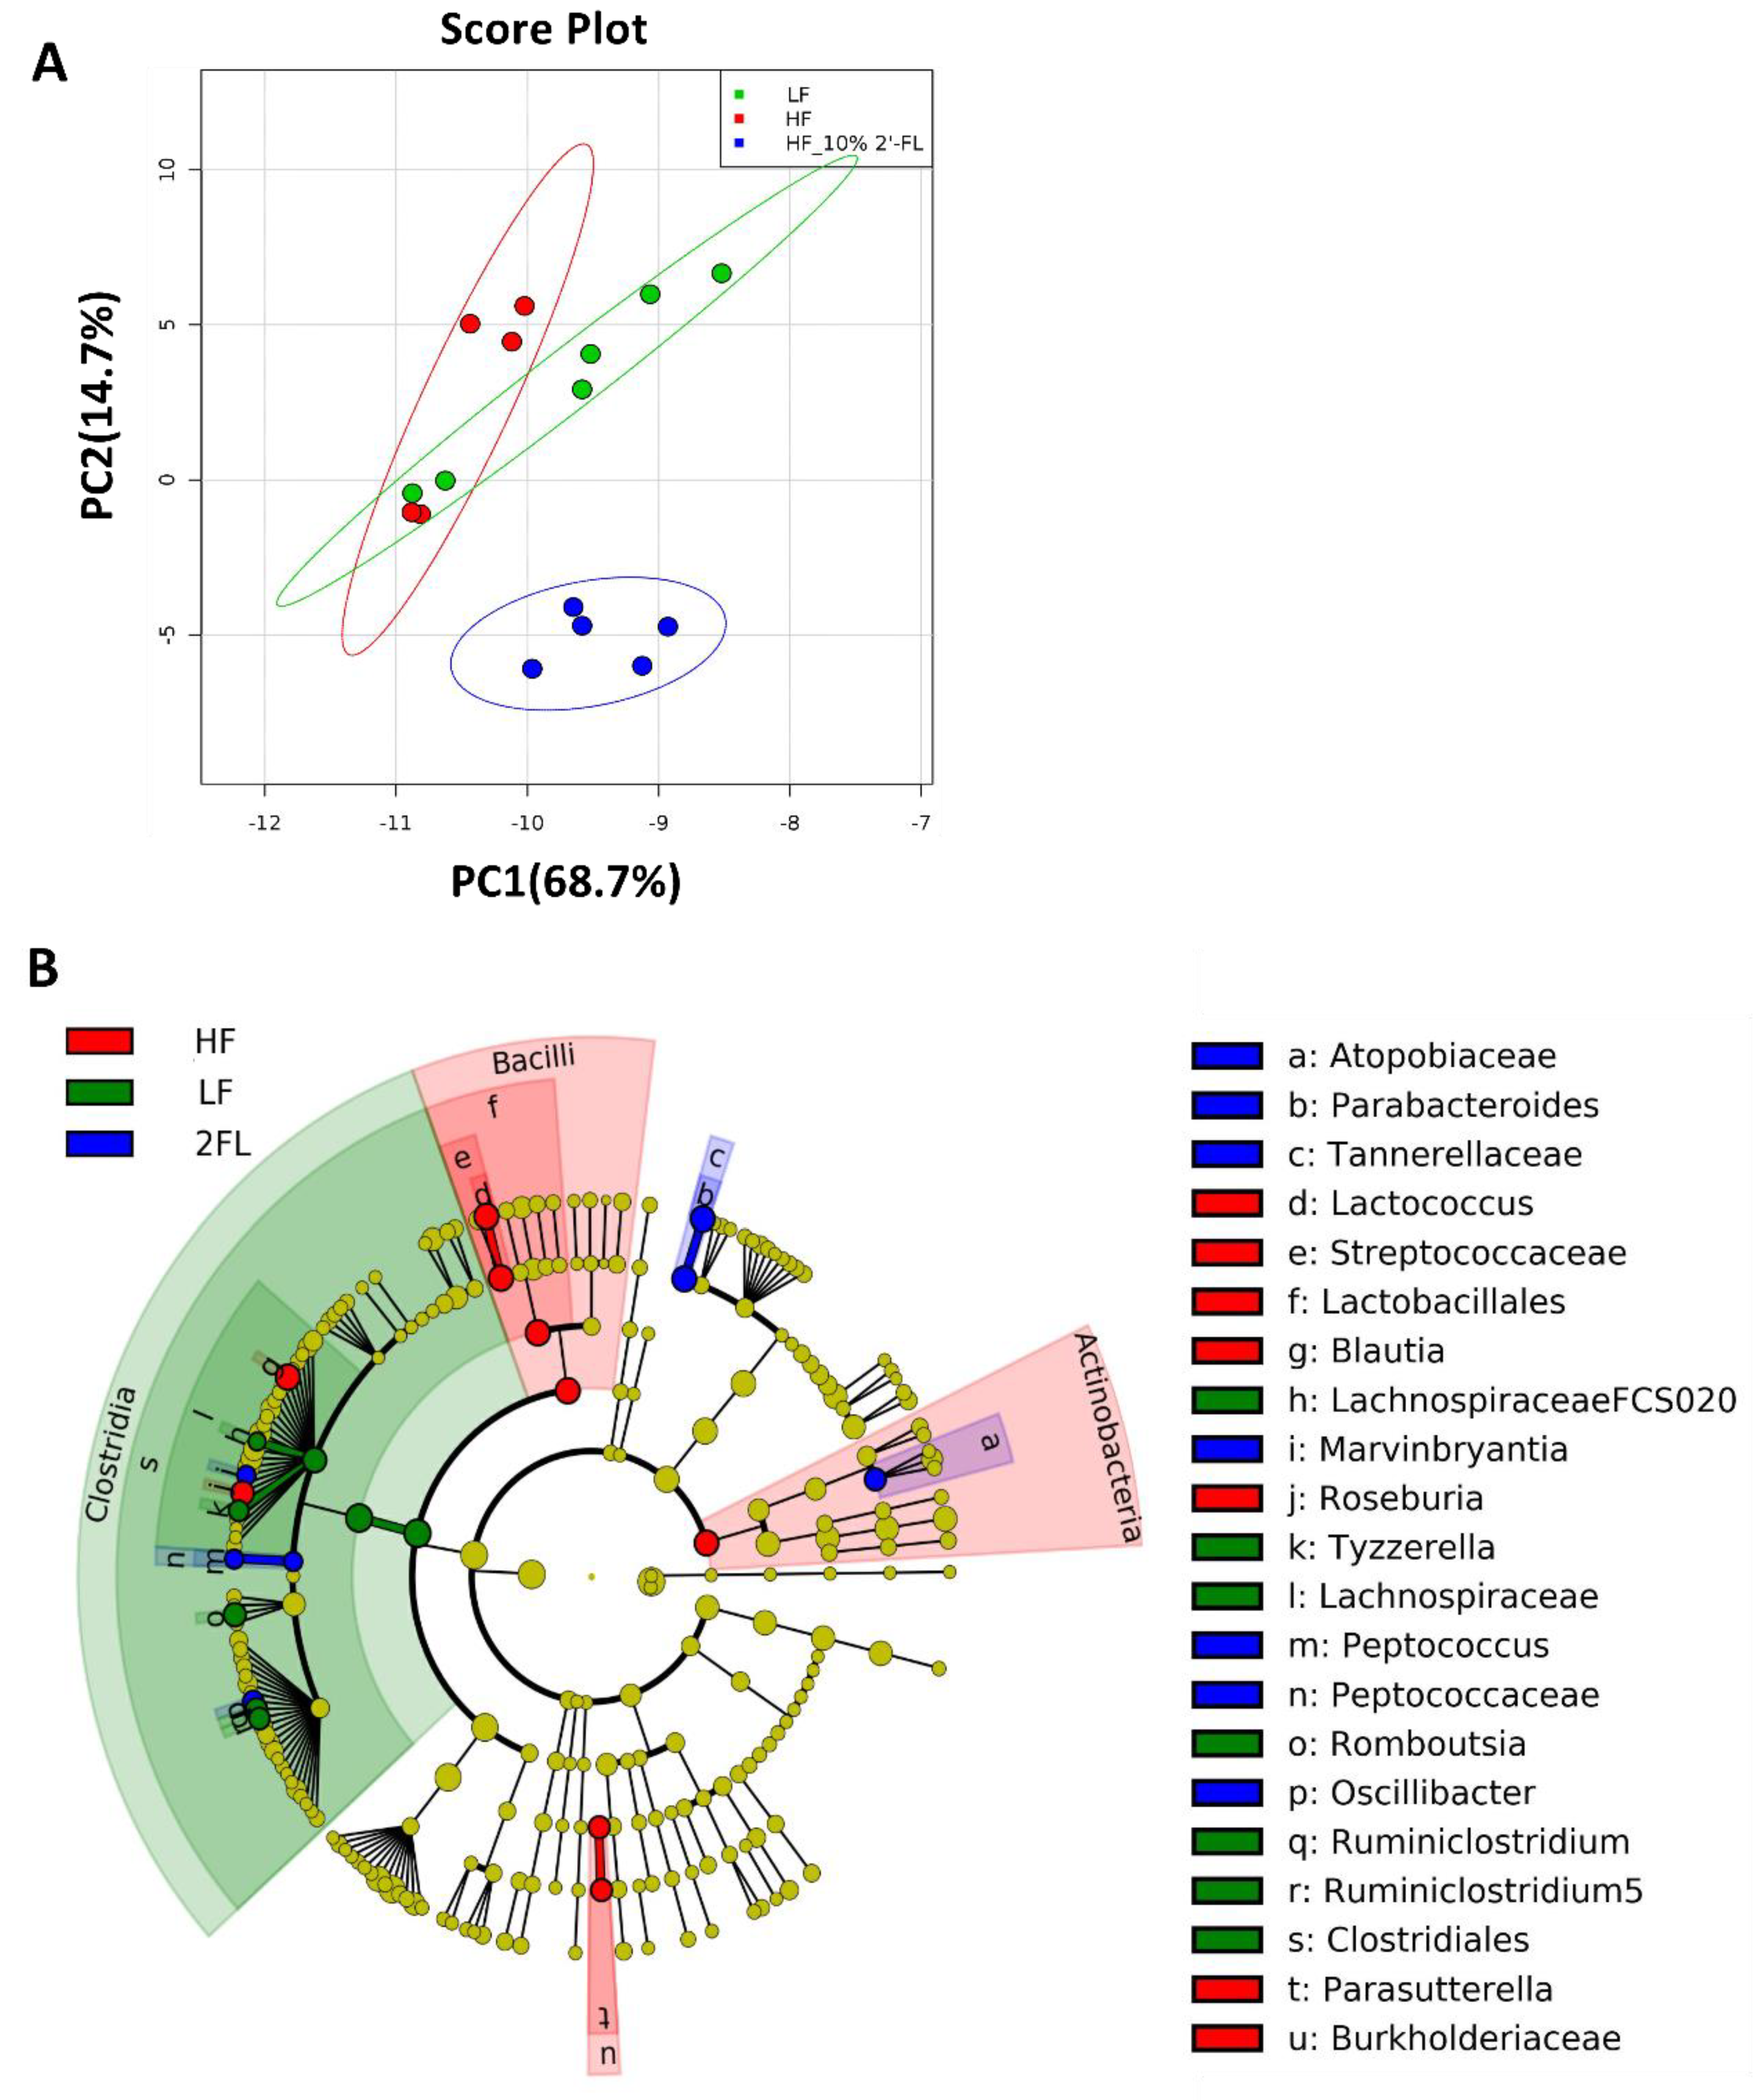
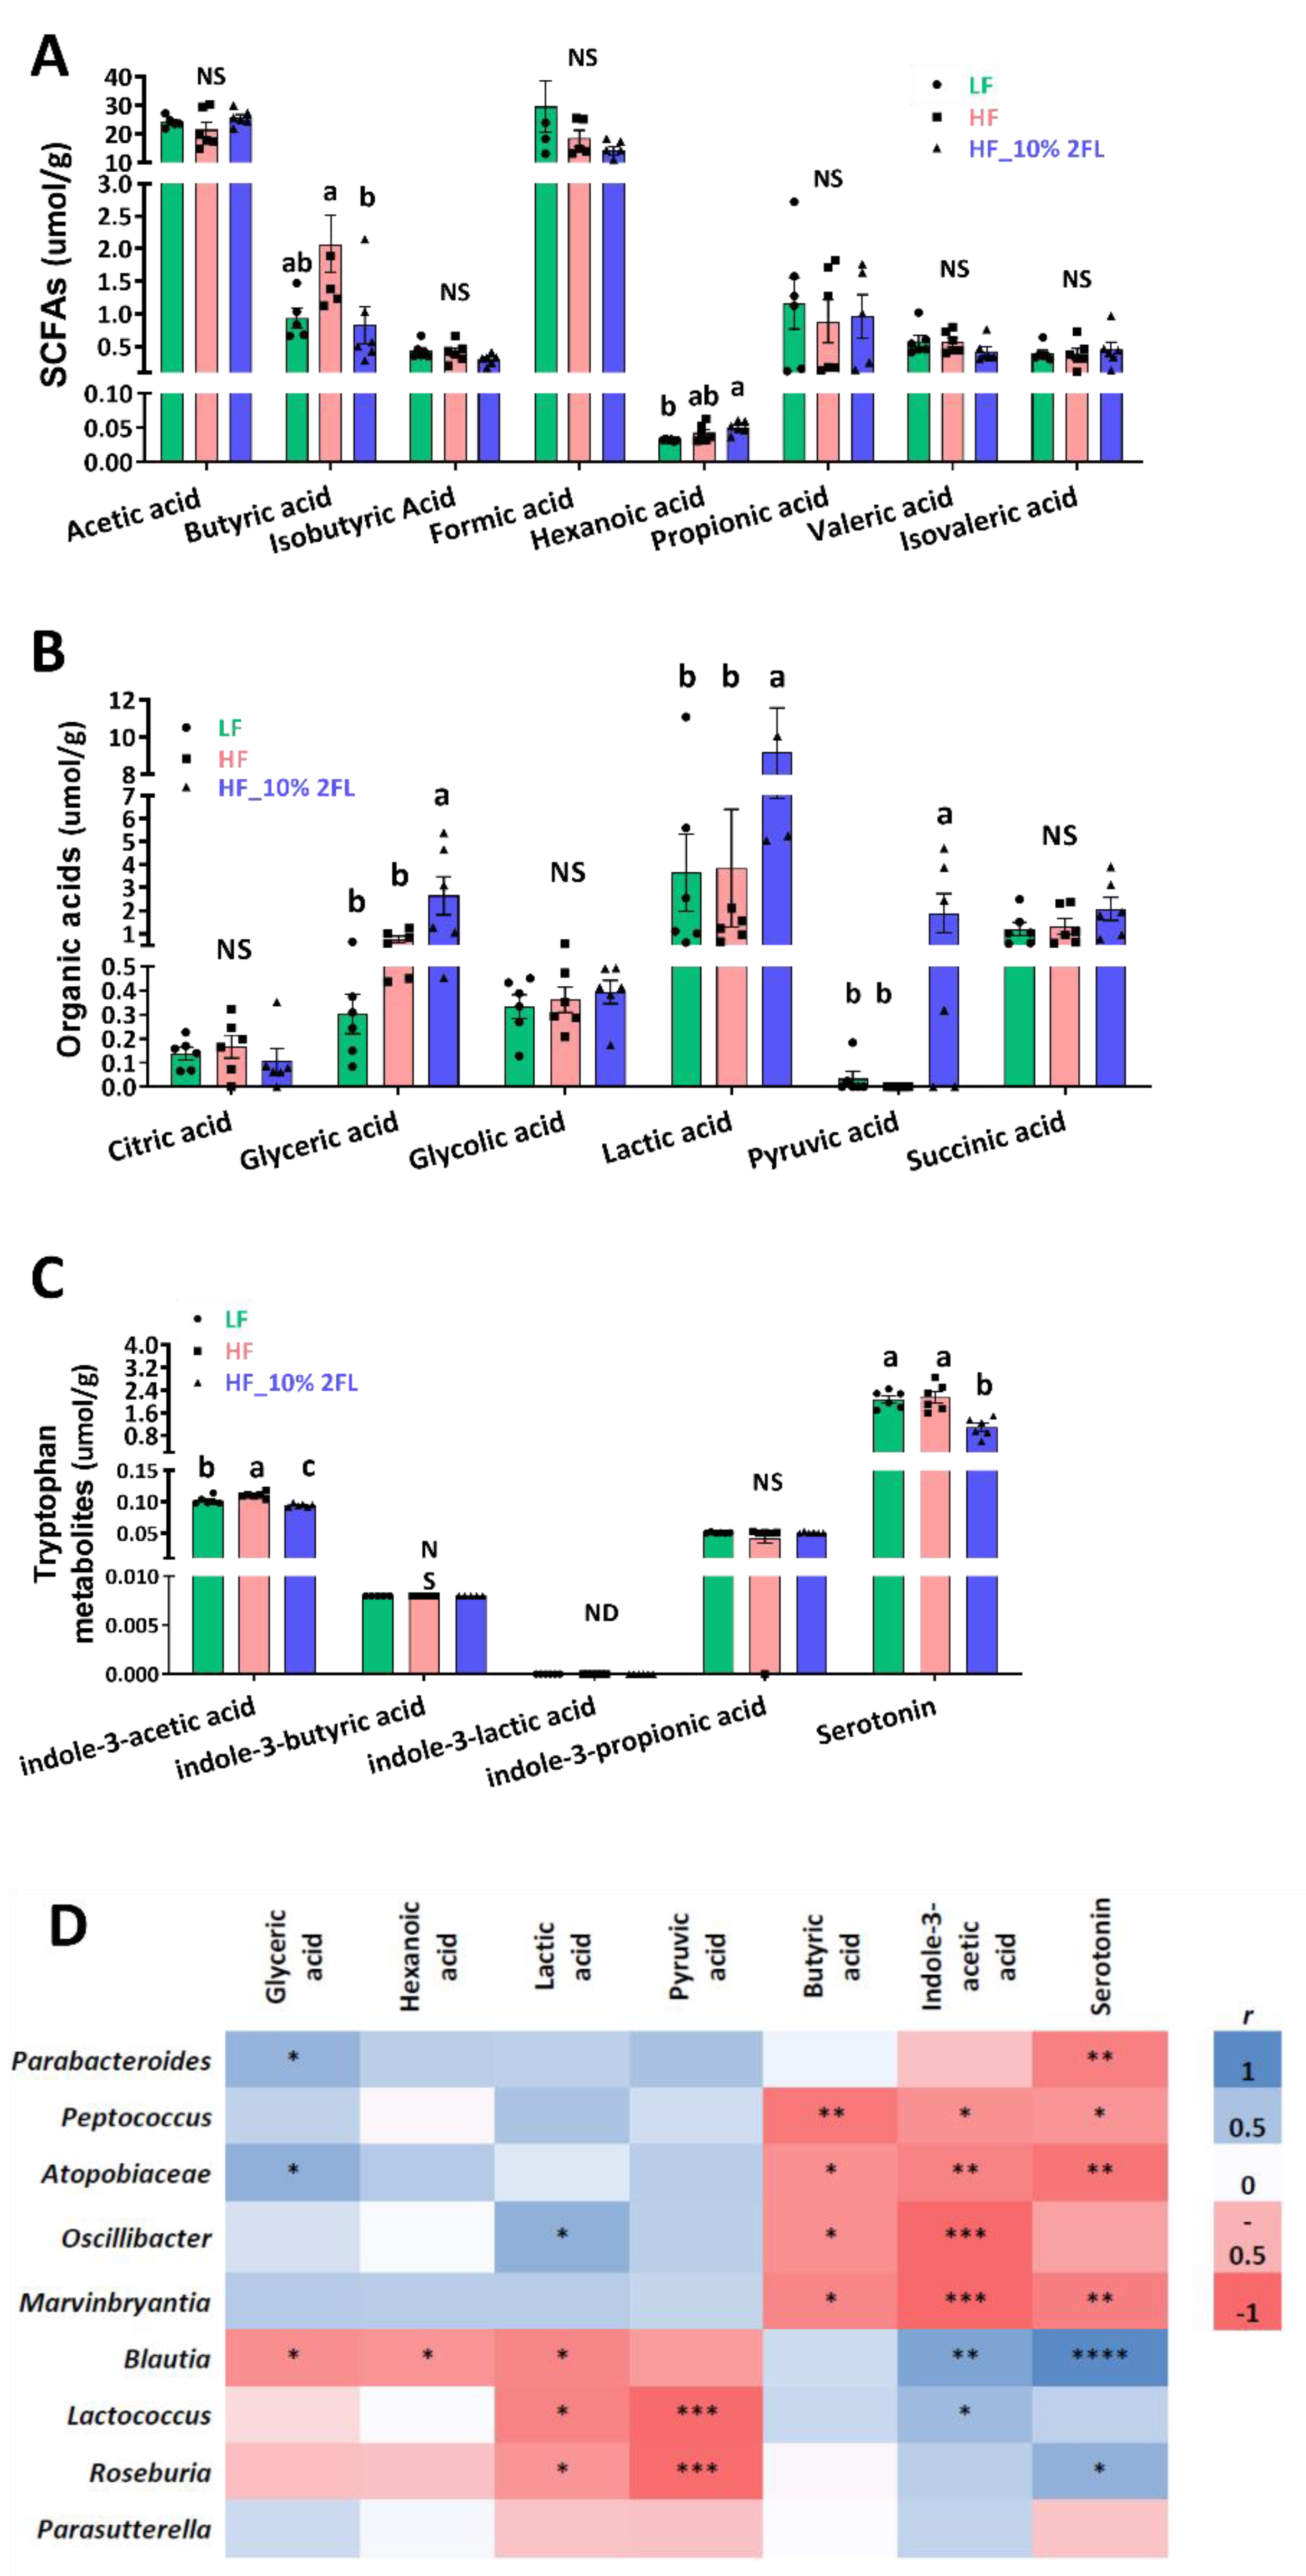
3.3. Compositional Changes in the Gut Microbiota and Metabolites by 10% 2′-FL Supplementation
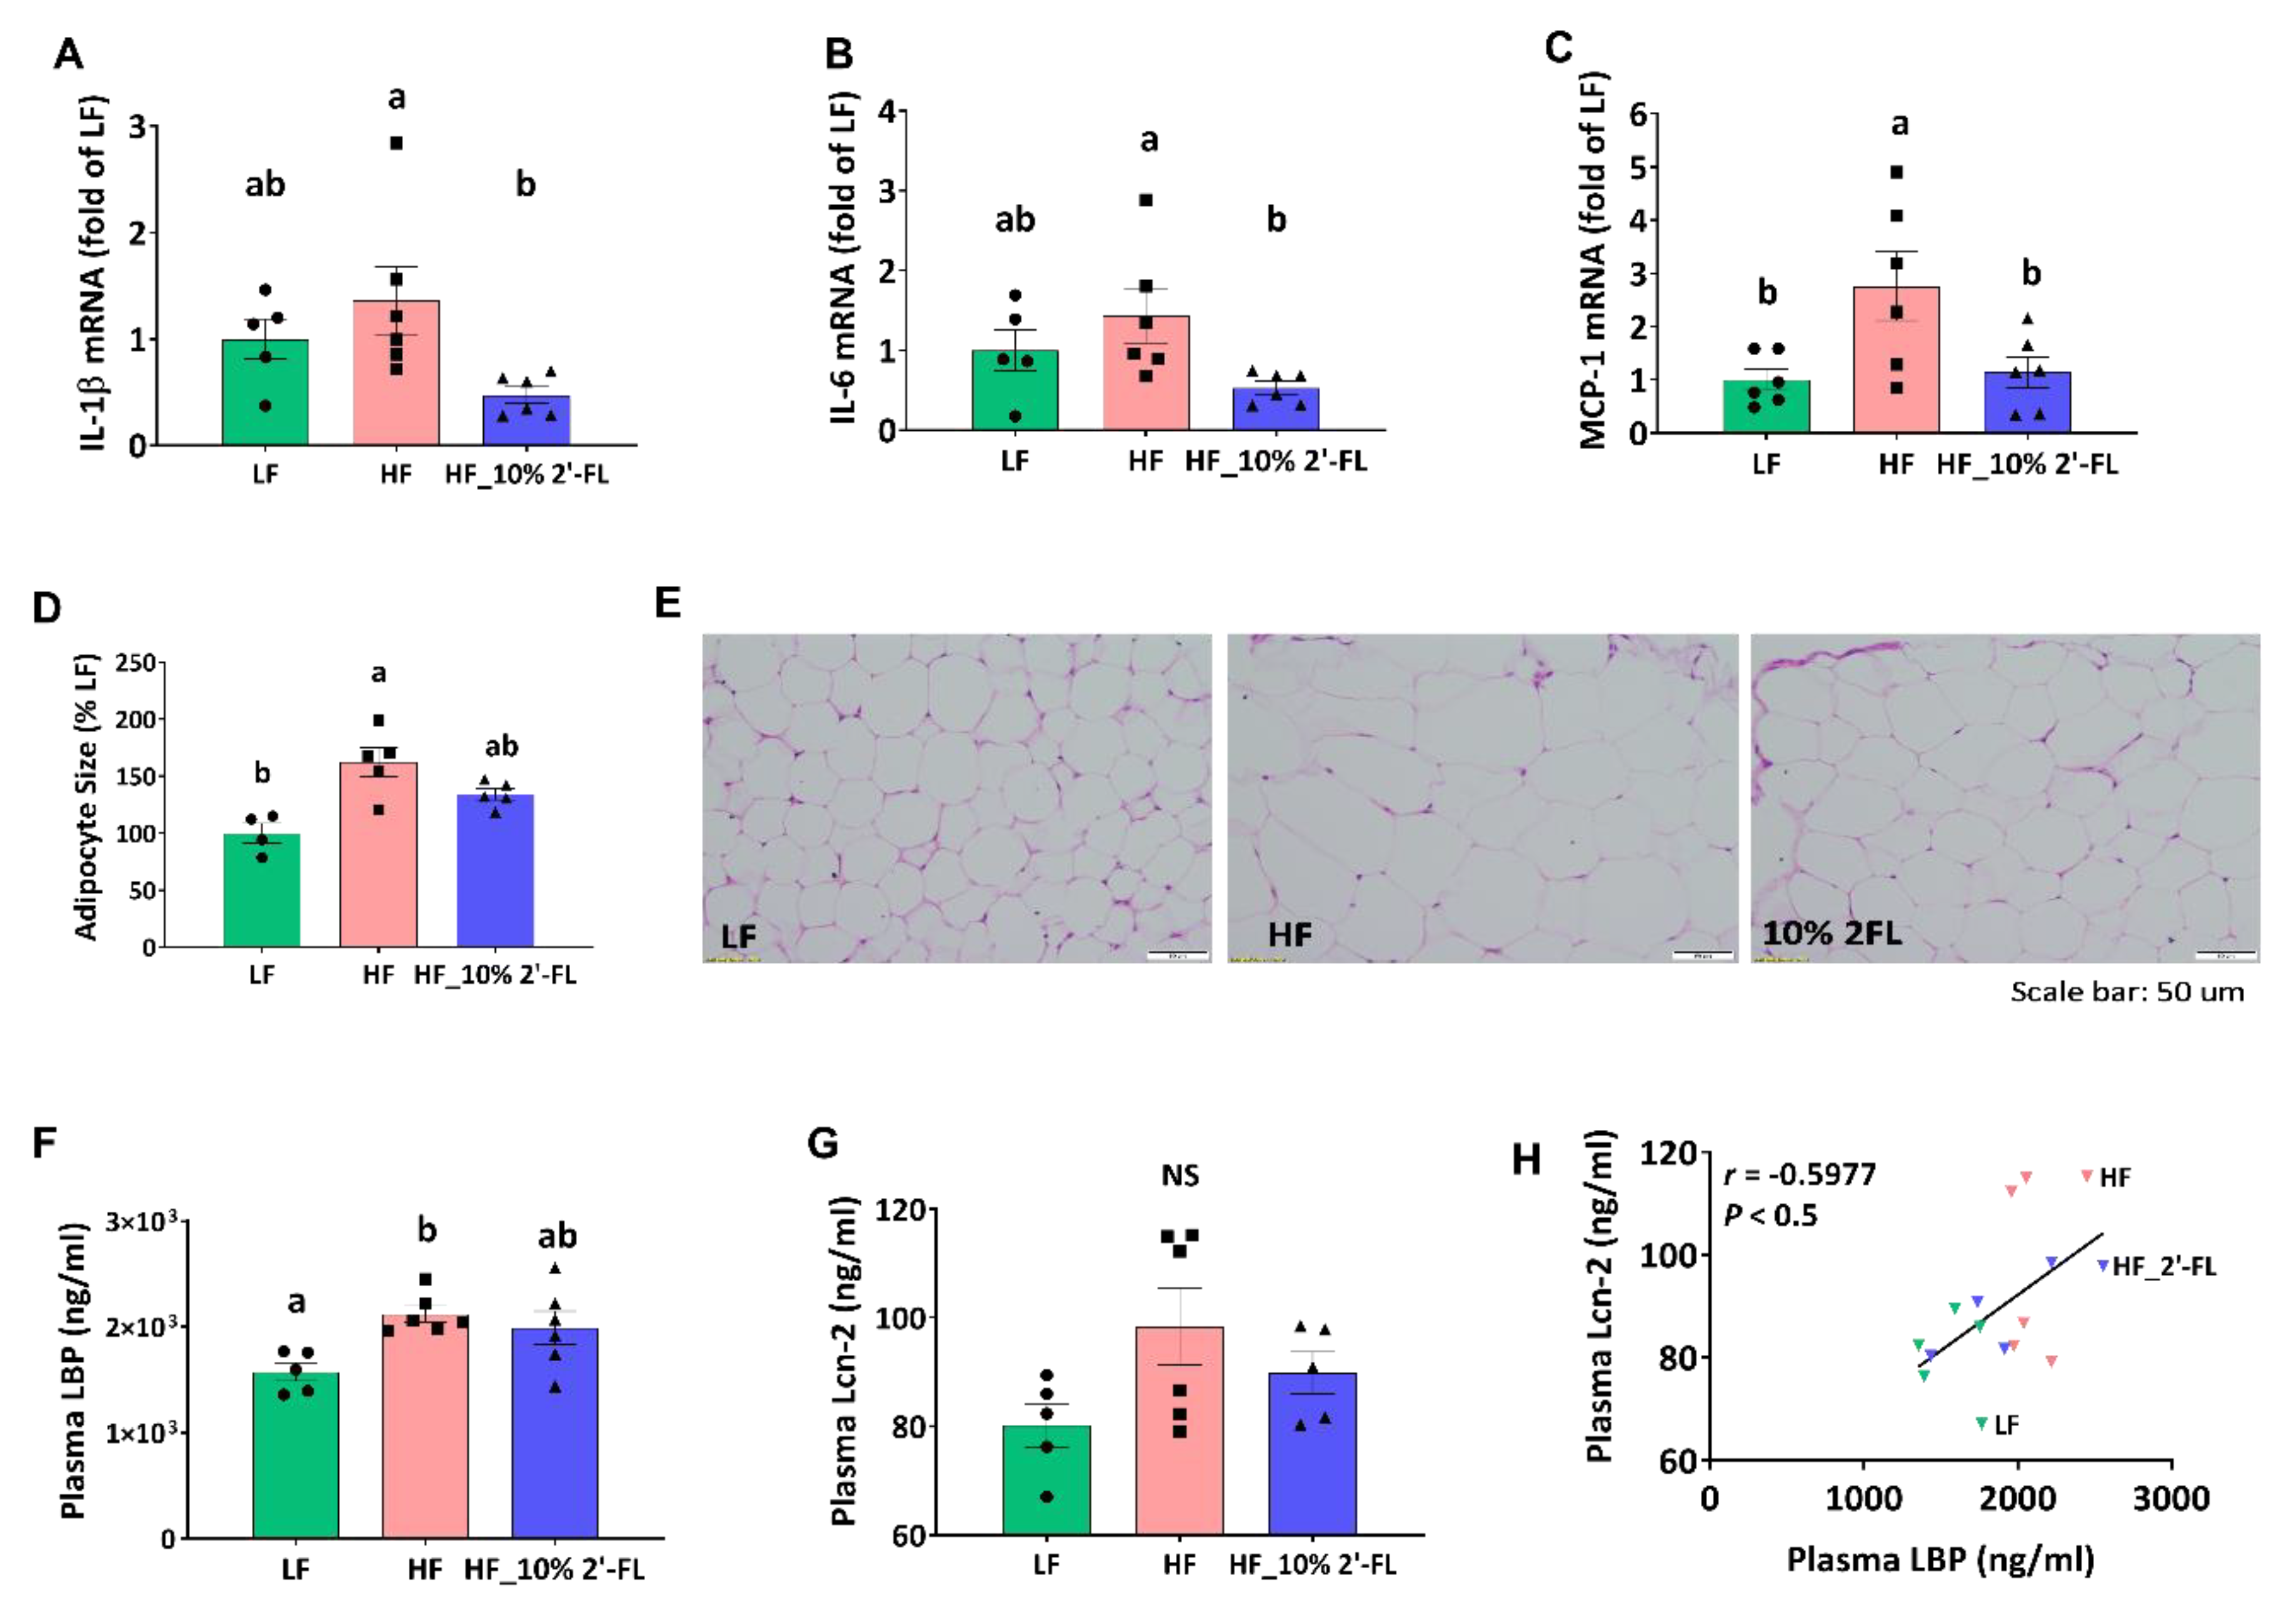
3.4. Supplementation of 10% 2′-FL Attenuates HF-Induced Inflammation at the Local and Systemic Levels
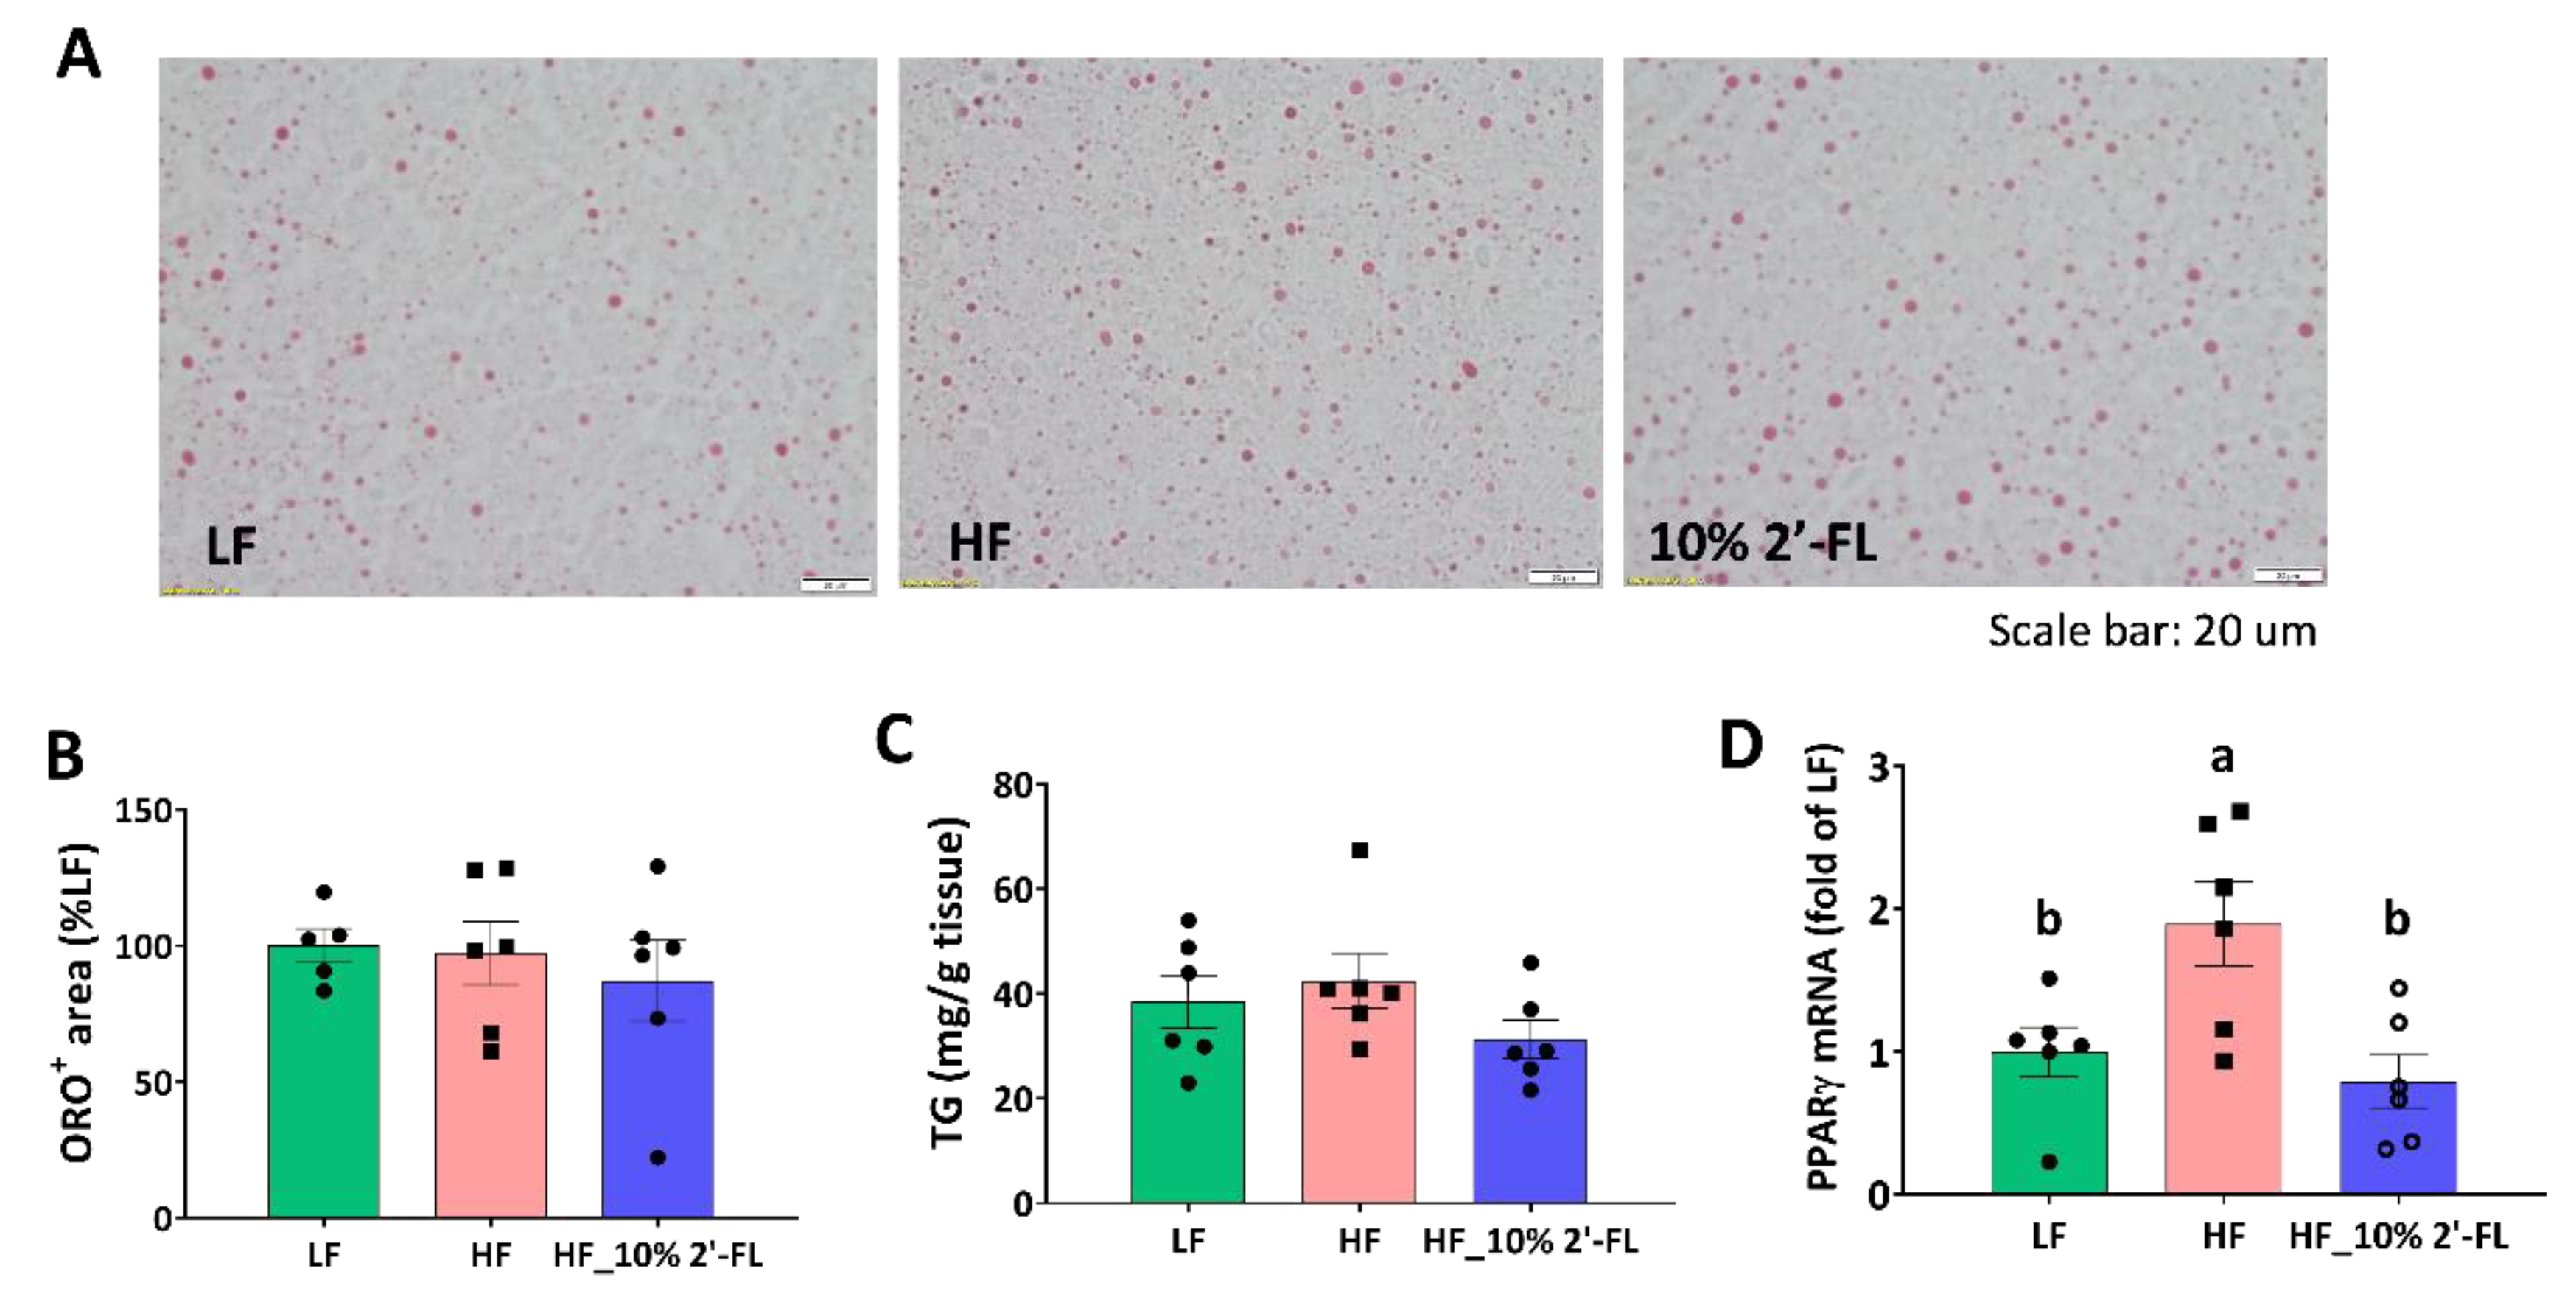
3.5. Supplementation of 10% 2′-FL Iimproves Lipid Metabolism in the Liver
4. Discussion
5. Conclusions
Supplementary Materials
Author Contributions
Funding
Acknowledgments
Conflicts of Interest
References
- World Health Organization. Obesity [Internet]. The World Health Organization. Available online: http://www.who.int/topics/obesity/en/ (accessed on 4 April 2020).
- Hales, C.M.; Carroll, M.D.; Fryar, C.D.; Ogden, C.L. Prevalence of Obesity Among Adults and Youth: United States, 2015–2016. NCHS Data Brief 2017, 288, 1–8. [Google Scholar]
- Pedersen, S.D. Metabolic complications of obesity. Best Pract. Res. Clin. Endocrinol. Metab. 2013, 27, 179–193. [Google Scholar] [CrossRef]
- Cani, P.D.; Osto, M.; Geurts, L.; Everard, A. Involvement of gut microbiota in the development of low-grade inflammation and type 2 diabetes associated with obesity. Gut Microbes. 2012, 3, 279–288. [Google Scholar] [CrossRef]
- Lee, S.H.; Claire, B. Gut microbiome-brain communications regulate host physiology and behavior. J. Nutr. 2015, 2. [Google Scholar] [CrossRef][Green Version]
- Carding, S.R.; Verbeke, K.; Vipond, D.T.; Corfe, B.M.; Owen, L. Dysbiosis of the gut microbiota in disease. Microb. Ecol. Health Dis. 2015, 26, 3854. [Google Scholar] [CrossRef]
- Turnbaugh, P.J.; Hamady, M.; Yatsunenko, T.; Cantarel, B.L.; Duncan, A.; Ley, R.E.; Sogin, M.L.; Jones, W.J.; Roe, B.A.; Affourtit, J.P.; et al. A core gut microbiome in obese and lean twins. Nature 2009, 457, 480–484. [Google Scholar] [CrossRef]
- Ley, R.E.; Turnbaugh, P.J.; Klein, S.; Gordon, J.I. Microbial ecology: Human gut microbes associated with obesity. Nature 2006, 444, 1022–1023. [Google Scholar] [CrossRef]
- Cani, P.D.; Bibiloni, R.; Knauf, C.; Waget, A.; Neyrinck, A.M.; Delzenne, N.M.; Burcelin, R. Changes in gut microbiota control metabolic endotoxemia-induced inflammation in high-fat diet-induced obesity and diabetes in mice. Diabetes 2008, 57, 1470–1481. [Google Scholar] [CrossRef]
- Turnbaugh, P.J.; Ley, R.E.; Mahowald, M.A.; Magrini, V.; Mardis, E.R.; Gordon, J.I. An obesity-associated gut microbiome with increased capacity for energy harvest. Nature 2006, 444, 1027–1031. [Google Scholar] [CrossRef]
- Ding, S.; Chi, M.M.; Scull, B.P.; Rigby, R.; Schwerbrock, N.M.; Magness, S.; Jobin, C.; Lund, P.K. High-fat diet: Bacteria interactions promote intestinal inflammation which precedes and correlates with obesity and insulin resistance in mouse. PLoS ONE 2010, 5, e12191. [Google Scholar] [CrossRef]
- Hamilton, M.K.; Boudry, G.; Lemay, D.G.; Raybould, H.E. Changes in intestinal barrier function and gut microbiota in high-fat diet-fed rats are dynamic and region dependent. Am. J. Physiol. Gastrointest. Liver Physiol. 2015, 308, G840–G851. [Google Scholar] [CrossRef] [PubMed]
- Cani, P.D.; Amar, J.; Iglesias, M.A.; Poggi, M.; Knauf, C.; Bastelica, D.; Neyrinck, A.M.; Fava, F.; Tuohy, K.M.; Chabo, C.; et al. Metabolic endotoxemia initiates obesity and insulin resistance. Diabetes 2007, 56, 1761–1772. [Google Scholar] [CrossRef]
- De La Serre, C.B.; de Lartigue, G.; Raybould, H.E. Chronic exposure to low dose bacterial lipopolysaccharide inhibits leptin signaling in vagal afferent neurons. Physiol. Behav. 2015, 139, 188–194. [Google Scholar] [CrossRef]
- Bauer, P.V.; Hamr, S.C.; Duca, F.A. Regulation of energy balance by a gut–brain axis and involvement of the gut microbiota. Cell. Mol. Life Sci. 2015, 73, 737–755. [Google Scholar] [CrossRef]
- Han, W.; Tellez, L.A.; Perkins, M.H.; Perez, I.O.; Qu, T.; Ferreira, J.; Kaelberer, M.M. A neural circuit for gut-Induced reward. Yearb. Paediatr. Endocrinol. 2019, 175, 665–678. [Google Scholar]
- De Araujo, I.E.; Ferreira, J.; Tellez, L.A.; Ren, X.; Yeckel, C.W. The gut–brain dopamine axis: A regulatory system for caloric intake. Physiol. Behav. 2012, 106, 394–399. [Google Scholar] [CrossRef]
- Sam, A.H.; Troke, R.C.; Tan, T.M.; Bewick, G.A. The role of the gut/brain axis in modulating food intake. Neuropharmacology 2012, 63, 46–56. [Google Scholar] [CrossRef]
- Daly, D.M.; Park, S.J.; Valinsky, C.; Beyak, M.J. Impaired intestinal afferent nerve satiety signalling and vagal afferent excitability in diet induced obesity in the mouse. J. Physiol. 2011, 589, 2857–2870. [Google Scholar] [CrossRef]
- Covasa, M.; Grahn, J.; Ritter, R.C. High fat maintenance diet attenuates hindbrain neuronal response to CCK. Regul. Pept. 2000, 86, 83–88. [Google Scholar] [CrossRef]
- De Lartigue, G.; de La Serre, C.B.; Raybould, H.E. Vagal afferent neurons in high fat diet-induced obesity; intestinal microflora, gut inflammation and cholecystokinin. Physiol. Behav. 2011, 105, 100–105. [Google Scholar] [CrossRef]
- Vaughn, A.C.; Cooper, E.M.; DiLorenzo, P.M.; O’Loughlin, L.J.; Konkel, M.E.; Peters, J.H.; Hajnal, A.; Sen, T.; Lee, S.H.; de La Serre, C.B.; et al. Energy-dense diet triggers changes in gut microbiota, reorganization of gutbrain vagal communication and increases body fat accumulation. Acta Neurobiol. Exp. 2017, 77, 18–30. [Google Scholar]
- Lee, S.; Keirsey, K.I.; Kirkland, R.; Grunewald, Z.I.; Fischer, J.G.; de La Serre, C.B. Blueberry Supplementation Influences the Gut Microbiota, Inflammation, and Insulin Resistance in High-Fat-Diet-Fed Rats. J. Nutr. 2018, 148, 209–219. [Google Scholar] [CrossRef] [PubMed]
- Lee, S.; Kirkland, R.; Grunewald, Z.I.; Sun, Q.; Wicker, L.; de La Serre, C.B. Beneficial Effects of Non-Encapsulated or Encapsulated Probiotic Supplementation on Microbiota Composition, Intestinal Barrier Functions, Inflammatory Profiles, and Glucose Tolerance in High Fat Fed Rats. Nutrients 2019, 11, 975. [Google Scholar] [CrossRef]
- Albenberg, L.G.; Wu, G.D. Diet and the intestinal microbiome: Associations, functions, and implications for health and disease. Gastroenterology 2014, 146, 1564–1572. [Google Scholar] [CrossRef]
- Hamilton, M.K.; Ronveaux, C.C.; Rust, B.M.; Newman, J.W.; Hawley, M.; Barile, D.; Mills, D.A.; Raybould, H.E. Prebiotic milk oligosaccharides prevent development of obese phenotype, impairment of gut permeability, and microbial dysbiosis in high fat-fed mice. Am. J. Physiol. Gastrointest. Liver Physiol. 2017, 312, G474–G487. [Google Scholar] [CrossRef] [PubMed]
- Klingbeil, E.; Cawthon, C.; Kirkland, R.; De La Serre, C.B. Potato-Resistant Starch Supplementation Improves Microbiota Dysbiosis, Inflammation, and Gut-Brain Signaling in High Fat-Fed Rats. Nutrients 2019, 11, 2710. [Google Scholar] [CrossRef]
- De Vadder, F.; Kovatcheva-Datchary, P.; Goncalves, D.; Vinera, J.; Zitoun, C.; Duchampt, A.; Backhed, F.; Mithieux, G. Microbiota-generated metabolites promote metabolic benefits via gut-brain neural circuits. Cell 2014, 156, 84–96. [Google Scholar] [CrossRef]
- Ridlon, J.M.; Kang, D.-J.; Hylemon, P.B. Bile salt biotransformations by human intestinal bacteria. J. Lipid Res. 2005, 47, 241–259. [Google Scholar] [CrossRef]
- Agus, A.; Planchais, J.; Sokol, H. Gut Microbiota Regulation of Tryptophan Metabolism in Health and Disease. Cell Host Microbe 2018, 23, 716–724. [Google Scholar] [CrossRef]
- Erney, R.M.; Malone, W.T.; Skelding, M.B.; Marcon, A.A.; Kleman–Leyer, K.M.; O’Ryan, M.; Ruiz–Palacios, G.; Hilty, M.D.; Pickering, L.K.; Prieto, P. Variability of Human Milk Neutral Oligosaccharides in a Diverse Population. J. Pediatr. Gastroenterol. Nutr. 2000, 30, 181–192. [Google Scholar] [CrossRef]
- Vazquez, E.; Barranco, A.; Ramirez, M.; Gruart, A.; Delgado-Garcia, J.M.; Jimenez, M.L.; Buck, R.; Rueda, R.J. Dietary 2′-fucosyllactose enhances operant conditioning and long-term potentiation via gut-brain communication through the vagus nerve in rodents. PLoS ONE 2016, 11, e0166070. [Google Scholar] [CrossRef] [PubMed]
- Grabinger, T.; Garzon, J.F.G.; Hausmann, M.; Geirnaert, A.; Lacroix, C.; Hennet, T. Alleviation of Intestinal Inflammation by Oral Supplementation With 2-Fucosyllactose in Mice. Front. Microbiol. 2019, 10, 1385. [Google Scholar] [CrossRef] [PubMed]
- He, Y.; Liu, S.; Kling, D.E.; Leone, S.; Lawlor, N.T.; Huang, Y.; Feinberg, S.B.; Hill, D.R.; Newburg, D.S.J. The human milk oligosaccharide 2′-fucosyllactose modulates CD14 expression in human enterocytes, thereby attenuating LPS-induced inflammation. Gut 2016, 65, 33–46. [Google Scholar] [CrossRef] [PubMed]
- Garrido, D.; Ruiz-Moyano, S.; Kirmiz, N.; Davis, J.C.; Totten, S.M.; Lemay, D.G.; Ugalde, J.A.; German, J.B.; Lebrilla, C.B.; Mills, D.A. A novel gene cluster allows preferential utilization of fucosylated milk oligosaccharides in Bifidobacterium longum subsp. longum SC596. Sci. Rep. 2016, 6, 35045. [Google Scholar] [CrossRef] [PubMed]
- Good, M.; Sodhi, C.P.; Yamaguchi, Y.; Jia, H.; Lu, P.; Fulton, W.B.; Martin, L.Y.; Prindle, T.; Nino, D.F.; Zhou, Q. The human milk oligosaccharide 2′-fucosyllactose attenuates the severity of experimental necrotising enterocolitis by enhancing mesenteric perfusion in the neonatal intestine. Br. J. Nutr. 2016, 116, 1175–1187. [Google Scholar] [CrossRef] [PubMed]
- Coulet, M.; Phothirath, P.; Allais, L.; Schilter, B. Pre-clinical safety evaluation of the synthetic human milk, nature-identical, oligosaccharide 2′-O-Fucosyllactose (2′FL). Regul. Toxicol. Pharmacol. 2014, 68, 59–69. [Google Scholar] [CrossRef]
- Hariri, N.; Thibault, L. High-fat diet-induced obesity in animal models. Nutr. Res. Rev. 2010, 23, 270–299. [Google Scholar] [CrossRef]
- Livak, K.J.; Schmittgen, T.D. Analysis of relative gene expression data using real-time quantitative PCR and the 2(-Delta Delta C(T)) Method. Methods 2001, 25, 402–408. [Google Scholar] [CrossRef]
- Frese, S.A.; Parker, K.; Calvert, C.C.; Mills, D.A. Diet shapes the gut microbiome of pigs during nursing and weaning. Microbiome 2015, 3, 28. [Google Scholar] [CrossRef]
- Joshi, N. Sabre: A Barcode Demultiplexing and Trimming Tool for FastQ Files; GitHub: San Francisco, CA, USA, 2011. [Google Scholar]
- Bolyen, E.; Rideout, J.R.; Dillon, M.R.; Bokulich, N.A.; Abnet, C.C.; Al-Ghalith, G.A.; Alexander, H.; Alm, E.J.; Arumugam, M.; Asnicar, F.; et al. Reproducible, interactive, scalable and extensible microbiome data science using QIIME 2. Nat. Biotechnol. 2019, 37, 852–857. [Google Scholar] [CrossRef]
- Callahan, B.J.; McMurdie, P.; Rosen, M.J.; Han, A.W.; A Johnson, A.J.; Holmes, S. DADA2: High-resolution sample inference from Illumina amplicon data. Nat. Methods 2016, 13, 581–583. [Google Scholar] [CrossRef]
- Segata, N.; Izard, J.; Waldron, L.; Gevers, D.; Miropolsky, L.; Garrett, W.S.; Huttenhower, C. Metagenomic biomarker discovery and explanation. Genome Biol. 2011, 12, R60. [Google Scholar] [CrossRef]
- Arndt, D.; Xia, J.; Liu, Y.; Zhou, Y.; Guo, A.C.; Cruz, J.A.; Sinelnikov, I.; Budwill, K.; Nesbo, C.L.; Wishart, D.S. METAGENassist: A comprehensive web server for comparative metagenomics. Nucleic Acids Res. 2012, 40, W88–W95. [Google Scholar] [CrossRef]
- Wu, T.-R.; Lin, C.-S.; Chang, C.-J.; Lin, T.-L.; Martel, J.; Ko, Y.-F.; Ojcius, D.M.; Lu, C.-C.; Young, J.D.; Lai, H.-C. Gut commensal Parabacteroides goldsteinii plays a predominant role in the anti-obesity effects of polysaccharides isolated from Hirsutella sinensis. Gut 2018, 68, 248–262. [Google Scholar] [CrossRef]
- Langhans, W.; Damaske, U.; Scharrer, E. Different metabolites might reduce food intake by the mitochondrial generation of reducing equivalents. Appetite 1985, 6, 143–152. [Google Scholar] [CrossRef]
- Nagase, H.; Bray, G.A.; York, D.A. Effects of pyruvate and lactate on food intake in rat strains sensitive and resistant to dietary obesity. Physiol. Behav. 1996, 59, 555–560. [Google Scholar] [CrossRef]
- Gibson, G.R.; Probert, H.M.; Loo, J.V.; Rastall, R.A.; Roberfroid, M.B. Dietary modulation of the human colonic microbiota: Updating the concept of prebiotics. Nutr. Res. Rev. 2004, 17, 259–275. [Google Scholar] [CrossRef] [PubMed]
- Ley, R.E.; Bäckhed, F.; Turnbaugh, P.J.; Lozupone, C.A.; Knight, R.; Gordon, J.I. Obesity alters gut microbial ecology. Proc. Natl. Acad. Sci. USA 2005, 102, 11070–11075. [Google Scholar] [CrossRef]
- Morrison, K.E.; Jašarević, E.; Howard, C.D.; Bale, T.L. It’s the fiber, not the fat: Significant effects of dietary challenge on the gut microbiome. Microbiome 2020, 8, 15. [Google Scholar] [CrossRef] [PubMed]
- Liu, S.; Qin, P.; Wang, J. High-Fat Diet Alters the Intestinal Microbiota in Streptozotocin-Induced Type 2 Diabetic Mice. Microorganisms 2019, 7, 176. [Google Scholar] [CrossRef] [PubMed]
- Ozato, N.; Saito, S.; Yamaguchi, T.; Katashima, M.; Tokuda, I.; Sawada, K.; Katsuragi, Y.; Kakuta, M.; Imoto, S.; Ihara, K.; et al. Blautia genus associated with visceral fat accumulation in adults 20-76 years of age. NPJ Biofilms Microbiomes 2019, 5, 28. [Google Scholar] [CrossRef] [PubMed]
- Mezoff, E.A.; Hawkins, J.A.; Ollberding, N.J.; Karns, R.; Morrow, A.L.; Helmrath, M.A. The human milk oligosaccharide 2′-fucosyllactose augments the adaptive response to extensive intestinal. Am. J. Physiol. Gastrointest. Liver Physiol. 2016, 310, G427–G438. [Google Scholar] [CrossRef] [PubMed]
- Nicholson, J.K.; Holmes, E.; Kinross, J.; Burcelin, R.; Gibson, G.; Jia, W.; Pettersson, S. Host-gut microbiota metabolic interactions. Science 2012, 336, 1262–1267. [Google Scholar] [CrossRef]
- Kwon, Y.H.; Wang, H.; Denou, E.; Ghia, J.-E.; Rossi, L.; Fontes, M.E.; Bernier, S.P.; Shajib, S.; Banskota, S.; Collins, S.M.; et al. Modulation of Gut Microbiota Composition by Serotonin Signaling Influences Intestinal Immune Response and Susceptibility to Colitis. Cell. Mol. Gastroenterol. Hepatol. 2019, 7, 709–728. [Google Scholar] [CrossRef] [PubMed]
- Kim, D.-Y.; Camilleri, M. Serotonin: A mediator of the brain–gut connection. Am. J. Gastroenterol. 2000, 95, 2698–2709. [Google Scholar] [PubMed]
- Manocha, M.; I Khan, W. Serotonin and GI Disorders: An Update on Clinical and Experimental Studies. Clin. Transl. Gastroenterol. 2012, 3, e13. [Google Scholar] [CrossRef] [PubMed]
- Spohn, S.N.; Bianco, F.; Scott, R.B.; Keenan, C.M.; Linton, A.A.; O’Neill, C.H.; Bonora, E.; Dicay, M.; Lavoie, B.; Wilcox, R.L.; et al. Protective Actions of Epithelial 5-Hydroxytryptamine 4 Receptors in Normal and Inflamed Colon. Gastroenterol. 2016, 151, 933–944. [Google Scholar] [CrossRef]
- De La Serre, C.B.; Ellis, C.L.; Lee, J.; Hartman, A.L.; Rutledge, J.C.; Raybould, H.E. Propensity to high-fat diet-induced obesity in rats is associated with changes in the gut microbiota and gut inflammation. Am. J. Physiol. Gastrointest. Liver Physiol. 2010, 299, G440–G448. [Google Scholar] [CrossRef]
- Wang, Y.; Lam, K.S.; Kraegen, E.W.; Sweeney, G.; Zhang, J.; Tso, A.W.; Chow, W.-S.; Wat, N.M.; Xu, J.Y.; Hoo, R.L.-C.; et al. Lipocalin-2 Is an Inflammatory Marker Closely Associated with Obesity, Insulin Resistance, and Hyperglycemia in Humans. Clin. Chem. 2007, 53, 34–41. [Google Scholar] [CrossRef]
- Kanda, H.; Tateya, S.; Tamori, Y.; Kotani, K.; Hiasa, K.; Kitazawa, R.; Kitazawa, S.; Miyachi, H.; Maeda, S.; Egashira, K.; et al. MCP-1 contributes to macrophage infiltration into adipose tissue, insulin resistance, and hepatic steatosis in obesity. J. Clin. Investig. 2006, 116, 1494–1505. [Google Scholar] [CrossRef]
- Surmi, B.K.; Hasty, A.M. Macrophage infiltration into adipose tissue: Initiation, propagation and remodeling. Future Lipidol. 2008, 3, 545–556. [Google Scholar] [CrossRef] [PubMed]
- Garrote, G.L.; Abraham, A.G.; Rumbo, M. Is lactate an undervalued functional component of fermented food products? Front. Microbiol. 2015, 6, 629. [Google Scholar] [CrossRef] [PubMed]
- Tripathi, A.; Debelius, J.; Brenner, D.A.; Karin, M.; Loomba, R.; Schnabl, B.; Knight, R. The gut-liver axis and the intersection with the microbiome. Nat. Rev. Gastroenterol. Hepatol. 2018, 15, 397–411. [Google Scholar] [CrossRef] [PubMed]
- Longo, M.; Zatterale, F.; Naderi, J.; Parrillo, L.; Formisano, P.; Raciti, G.A.; Beguinot, F.; Miele, C. Adipose Tissue Dysfunction as Determinant of Obesity-Associated Metabolic Complications. Int. J. Mol. Sci. 2019, 20, 58. [Google Scholar] [CrossRef]
- Gao, M.; Ma, Y.; Liu, D. High-fat diet-induced adiposity, adipose inflammation, hepatic steatosis and hyperinsulinemia in outbred CD-1 mice. PLoS ONE 2015, 10, e0119784. [Google Scholar] [CrossRef]
- Yu, S.; Matsusue, K.; Kashireddy, P.; Cao, W.Q.; Yeldandi, V.; Yeldandi, A.V.; Rao, M.S.; Gonzalez, F.J.; Reddy, J.K. Adipocyte-specific gene expression and adipogenic steatosis in the mouse liver due to peroxisome proliferator-activated receptor gamma1 (PPARgamma1) overexpression. J. Biol. Chem. 2003, 278, 498–505. [Google Scholar] [CrossRef]
- Moran-Salvador, E.; Lopez-Parra, M.; Garcia-Alonso, V.; Titos, E.; Martinez-Clemente, M.; Gonzalez-Periz, A.; Lopez-Vicario, C.; Barak, Y.; Arroyo, V.; Claria, J. Role for PPARgamma in obesity-induced hepatic steatosis as determined by hepatocyte- and macrophage-specific conditional knockouts. FASEB J. 2011, 25, 2538–2550. [Google Scholar] [CrossRef]


© 2020 by the authors. Licensee MDPI, Basel, Switzerland. This article is an open access article distributed under the terms and conditions of the Creative Commons Attribution (CC BY) license (http://creativecommons.org/licenses/by/4.0/).
Share and Cite
Lee, S.; Goodson, M.; Vang, W.; Kalanetra, K.; Barile, D.; Raybould, H. 2′-Fucosyllactose Supplementation Improves Gut-Brain Signaling and Diet-Induced Obese Phenotype and Changes the Gut Microbiota in High Fat-Fed Mice. Nutrients 2020, 12, 1003. https://doi.org/10.3390/nu12041003
Lee S, Goodson M, Vang W, Kalanetra K, Barile D, Raybould H. 2′-Fucosyllactose Supplementation Improves Gut-Brain Signaling and Diet-Induced Obese Phenotype and Changes the Gut Microbiota in High Fat-Fed Mice. Nutrients. 2020; 12(4):1003. https://doi.org/10.3390/nu12041003
Chicago/Turabian StyleLee, Sunhye, Michael Goodson, Wendie Vang, Karen Kalanetra, Daniela Barile, and Helen Raybould. 2020. "2′-Fucosyllactose Supplementation Improves Gut-Brain Signaling and Diet-Induced Obese Phenotype and Changes the Gut Microbiota in High Fat-Fed Mice" Nutrients 12, no. 4: 1003. https://doi.org/10.3390/nu12041003
APA StyleLee, S., Goodson, M., Vang, W., Kalanetra, K., Barile, D., & Raybould, H. (2020). 2′-Fucosyllactose Supplementation Improves Gut-Brain Signaling and Diet-Induced Obese Phenotype and Changes the Gut Microbiota in High Fat-Fed Mice. Nutrients, 12(4), 1003. https://doi.org/10.3390/nu12041003