The Relationship between Body Composition and Muscle Tone in Children with Cerebral Palsy: A Case-Control Study

 ,
,  , ,
, ,
Abstract
1. Introduction
2. Materials and Methods
2.1. Ethics
2.2. Subjects
2.3. Assessments
2.4. Statistical Analysis
3. Results
4. Discussion
5. Conclusions
Supplementary Materials
Author Contributions
Funding
Acknowledgments
Conflicts of Interest
References
- Verschuren, O.; Smorenburg, A.R.P.; Luiking, Y.; Bell, K.; Barber, L.; Peterson, M.D. Determinants of muscle preservation in individuals with cerebral palsy across the lifespan: A narrative review of the literature. J. Cachexia Sarcopenia Muscle 2018, 9, 453–464. [Google Scholar] [CrossRef] [PubMed]
- Bar-On, L.; Molenaers, G.; Aertbeliën, E.; Van Campenhout, A.; Feys, H.; Nuttin, B.; Desloovere, K. Spasticity and its contribution to hypertonia in cerebral palsy. BioMed Res. Int. 2015, 2015, 317047. [Google Scholar] [CrossRef] [PubMed]
- Zhou, J.; Butler, E.E.; Rose, J. Neurologic Correlates of Gait Abnormalities in Cerebral Palsy: Implications for Treatment. Front. Hum. Neurosci. 2017, 11, 103. [Google Scholar] [CrossRef] [PubMed]
- Graham, H.K.; Rosenbaum, P.; Paneth, N.; Dan, B.; Lin, J.P.; Damiano, D.L.; Becher, J.G.; Gaebler-Spira, D.; Colver, A.; Reddihough, D.S.; et al. Cerebral palsy. Nat. Rev. Dis. Primers 2016, 7, 15082. [Google Scholar] [CrossRef]
- Dziuba, A.K.; Tylkowska, M.; Jaroszczuk, S. Index of mechanical work in gait of children with cerebral palsy. Acta Bioeng. Biomech. 2014, 16, 77–87. [Google Scholar]
- Türkoğlu, G.; Türkoğlu, S.; Çelik, C.; Uçan, H. Intelligence, Functioning, and Related Factors in Children with Cerebral Palsy. Noro Psikiyatr. Ars. 2017, 54, 33–37. [Google Scholar] [CrossRef]
- Rosińczuk, J.; Lach, K.; Kołtuniuk, A. Daily Functioning Problems in Children with Cerebral Palsy (CP) Aged 5 and More. J. Neurol. Neurosurg. Nurs. 2014, 3, 52–57. [Google Scholar] [CrossRef]
- Jesus, A.O.; Stevenson, R.D. Optimizing Nutrition and Bone Health in Children with Cerebral Palsy. Phys. Med. Rehabil. Clin. N. Am. 2020, 31, 25–37. [Google Scholar] [CrossRef]
- Kuperminc, M.N.; Gottrand, F.; Samson-Fang, L.; Ardvedson, J.; Bell, K.; Craig, G.M.; Sullivan, P.B. Nutritional management of children with cerebral palsy: A practical guide. Eur. J. Clin. Nutr. 2013, 67, S21–S23. [Google Scholar] [CrossRef]
- Brooks, J.; Day, S.; Shavelle, R.; Strauss, D. Low Weight, Morbidity, and Mortality in Children with Cerebral Palsy: New Clinical Growth Charts. Pediatrics 2011, 128, e299–e307. [Google Scholar] [CrossRef]
- Penagini, F.; Mameli, C.; Fabiano, V.; Brunetti., D.; Dilillo, D.; Zuccotti, G.V. Dietary Intakes and Nutritional Issues in Neurologically Impaired Children. Nutrients 2015, 13, 9400–9415. [Google Scholar] [CrossRef] [PubMed]
- Tomoum, H.Y.; Badawy, N.B.; Hassan, N.E.; Alian, K.M. Anthropometry and body composition analysis in children with cerebral palsy. Clin. Nutr. 2010, 29, 477–481. [Google Scholar] [CrossRef] [PubMed]
- Dionyssiotis, Y.; Samlidi, E.; Kapsokoulou, A.; Michalakopoulou, M.; Iatridou, G.; Papathanasiou, J. Assessment of Fitness in Cerebral Palsy: Focus in Body Composition and Balance. Rem. Open Access 2016, 1, 1014. [Google Scholar]
- Veugelers, R.; Penning, C.; van Gulik, M.E.; Tibboel, D.; Evenhuis, H.M. Feasibility of bioelectrical impedance analysis in children with a severe generalized cerebral palsy. Nutrition 2006, 22, 16–22. [Google Scholar] [CrossRef] [PubMed]
- Whitney, D.G.; Gross-Richmond, P.; Hurvitz, E.A.; Peterson, M.D. Total and regional body fat status among children and young people with cerebral palsy: A scoping review. Clin. Obes. 2019, 9, e12327. [Google Scholar] [CrossRef]
- Garcia Iniguez, J.A.; Vasquez Garibay, E.M.; Garcia Contreras, A.A.; Romero Velarde, E.; Troyo Sanroman, R.; Hernandez Rocha, J.; Rea Rosas, A.; Rodriguez Leon, M.; Uribe Martinez, E. Energy expenditure is associated with age, anthropometric indicators and body composition in children with spastic cerebral palsy. Nutr. Hosp. 2018, 35, 909–913. [Google Scholar] [CrossRef]
- Liu, L.F.; Moyer-Mileur, L.; Gooch, J.; Samson-Fang, L. The contribution of tone to resting energy expenditure in children with moderate to severe cerebral palsy: Evaluation utilizing intrathecal baclofen injection. J. Pediatr. Rehabil. Med. 2008, 1, 163–167. [Google Scholar]
- Eileen Hogan, S. Energy Requirements of Children with Cerebral Palsy. Can. J. Diet. Pract. Res. 2004, 65, 124–130. [Google Scholar] [CrossRef]
- Bell, K.L.; Davies, P.S.W. Energy expenditure and physical activity of ambulatory children with cerebral palsy and of typically developing children. Am. J. Clin. Nutr. 2010, 92, 313–319. [Google Scholar] [CrossRef]
- Lindén, O.; Hägglund, G.; Rodby-Bousquet, E.; Wagner, F. The development of spasticity with age in 4,162 children with cerebral palsy: A register-based prospective cohort study. Acta Orthop. 2019, 90, 286–291. [Google Scholar] [CrossRef]
- World Health Organization. International Statistical Classification of Diseases and Related Health Problems ICD-10, 5th ed.; World Health Organization: Geneva, Switzerland, 2016; Available online: https://apps.who.int/iris/bitstream/handle/10665/246208/9789241549165-V3-eng.pdf?sequence=3&isAllowed=y (accessed on 3 December 2019).
- Palisano, R.; Rosenbaum, P.; Walter, S.; Russell, D.; Wood, E.; Galuppi, B. Development and reliability of a system to classify gross motor function in children with Cerebral Palsy. Dev. Med. Child Neurol. 1997, 39, 214–223. [Google Scholar] [CrossRef] [PubMed]
- Rethlefsen, S.A.; Ryan, D.D.; Kay, R.M. Classification systems in cerebral palsy. Orthop. Clin. N. Am. 2010, 41, 457–467. [Google Scholar] [CrossRef] [PubMed]
- Bohannon, R.W.; Smith, M.B. Interrater reliability of a modified Ashworth scale of muscle spasticity. Phys. Ther. 1987, 67, 206–207. [Google Scholar] [CrossRef] [PubMed]
- Johnson, G.R. Measurement of spasticity. In Upper Motor Neurone Syndrome and Spasticity, 2nd ed.; Johnson, G.R., Barnes, M.P., Eds.; Cambridge University Press: Cambridge, UK, 2001; pp. 79–95. [Google Scholar]
- Palisano, R.; Hanna, S.E.; Rosenbaum, P.; Russell, D.; Walter, S.D.; Wood, E.P.; Galuppi, B.E. Validation of a model of gross motor function for children with cerebral palsy. Phys. Ther. 2000, 80, 974–985. [Google Scholar] [CrossRef] [PubMed]
- Rosenbaum, P.L.; Palisano, R.J.; Bartlett, D.J.; Galuppi, B.E.; Russel, D.J. Development of the gross motor function classification system for cerebral palsy. Dev. Med. Child Neurol. 2008, 50, 249–253. [Google Scholar] [CrossRef] [PubMed]
- Sun, S.S.; Chumlea, W.C.; Heymsfield, S.B.; Lukaski, H.C.; Schoeller, D.; Friedl, K.; Kuczmarski, R.J.; Flegal, K.M.; Johnson, C.L.; Hubbard, V.S. Development of bioelectrical impedance analysis prediction equations for body composition with the use of a multicomponent model for use in epidemiologic surveys. Am. J. Clin. Nutr. 2003, 77, 331–340. [Google Scholar] [CrossRef]
- Kyle, U.G.; Bosaeus, I.; de Lorenzo, A.D.; Deurenberg, P.; Elia, M.; Manuel Gómez, J.; Heitmann, B.L.; Kent-Smith, L.; Melchior, J.C.; Pirlich, M.; et al. Bioelectrical impedance analysis—Part II: Utilization in clinical practice. Clin. Nutr. 2004, 23, 1430–1453. [Google Scholar] [CrossRef]
- Yanovski, S.Z.; Hubbard, V.S.; Heymsfield, S.B.; Lukaski, H.C. Bioelectrical impedance analysis in body composition measurement: National institutes of health technology assessment conference statement. Am. J. Clin. Nutr. 1996, 64, 524S–532S. [Google Scholar]
- Kushner, R.F. Bioelectrical impedance analysis: A review of principles and applications. J. Am. Coll. Nutr. 1992, 11, 199–209. [Google Scholar]
- Lukaski, H.C.; Bolonchuk, W.W.; Hall, C.B.; Siders, W.A. Validation of tetrapolar bioelectrical impedance method to assess human body composition. J. Appl. Physiol. 1986, 60, 1327–1332. [Google Scholar] [CrossRef]
- Norman, K.; Stobäus, N.; Pirlich, M.; Bosy-Westphal, A. Bioelectrical phase angle and impedance vector analysis-clinical relevance and applicability of impedance parameters. Clin. Nutr. 2012, 31, 854–861. [Google Scholar] [CrossRef] [PubMed]
- Martínez de Zabarte Fernández, J.M.; Ros Arnal, I.; Peña Segura, J.L.; García Romero, R.; Rodríguez Martínez, G. Nutritional status of a population with moderate-severe cerebral palsy: Beyond the weight. An. Pediatr. (Barc) 2019. [Google Scholar] [CrossRef]
- Jahan, I.; Muhit, M.; Karim, T.; Smithers-Sheedy, H.; Novak, I.; Jones, C.; Badawi, N.; Khandaker, G. What makes children with cerebral palsy vulnerable to malnutrition? Findings from the Bangladesh cerebral palsy register (BCPR). Disabil. Rehabil. 2019, 41, 2247–2254. [Google Scholar] [CrossRef] [PubMed]
- Adamu, A.S.; Sabo, U.A.; Gwarzo, G.D.; Belonwu, R.O. Nutritional status in cerebral palsy: A Cross-sectional comparative survey of children in Kano, Nigeria. Niger. Postgrad. Med. J. 2018, 25, 156–160. [Google Scholar] [CrossRef] [PubMed]
- Aydin, K.; Turkish Cerebral Palsy Study Group. A multicenter cross-sectional study to evaluate the clinical characteristics and nutritional status of children with cerebral palsy. Clin. Nutr. ESPEN 2018, 26, 27–34. [Google Scholar] [CrossRef] [PubMed]
- Kim, H.J.; Choi, H.N.; Yim, J.E. Food Habits, Dietary Intake, and Body Composition in Children with Cerebral Palsy. Clin. Nutr. Res. 2018, 7, 266–275. [Google Scholar] [CrossRef]
- Snik, D.A.C.; de Roos, N.M. Criterion validity of assessment methods to estimate body composition in children with cerebral palsy: A systematic review. Ann. Phys. Rehabil. Med. 2019. [Google Scholar] [CrossRef]
- García-Contreras, A.A.; Vásquez-Garibay, E.M.; Romero-Velarde, E.; Ibarra-Gutierrez, A.I.; Troyo-Sanroman, R. Energy expenditure in children with cerebral palsy and moderate/severe malnutrition during nutritional recovery. Nutr. Hosp. 2015, 31, 2062–2069. [Google Scholar]
- Stallings, V.A.; Zemel, B.S.; Davies, J.C.; Cronk, C.E.; Charney, E.B. Energy expenditure of children and adolescents with severe disabilities: A cerebral palsy model. Am. J. Clin. Nutr. 1996, 64, 627–634. [Google Scholar] [CrossRef]
- Penagini, F.; Borsani, B.; Bosetti, A.; Mameli, C.; Dilillo, D.; Ramponi, G.; Motta, F.; Bedogni, G.; Zuccotti, G.V. Resting energy expenditure in children with cerebral palsy: Accuracy of available prediction formulae and development of a population-specific formula. Clin. Nutr. ESPEN 2018, 25, 44–49. [Google Scholar] [CrossRef]
- Whitney, D.G.; Hurvitz, E.A.; Ryan, J.M.; Devlin, M.J.; Caird, M.S.; French, Z.P.; Ellenberg, E.C.; Peterson, M.D. Noncommunicable disease and multimorbidity in young adults with cerebral palsy. Clin. Epidemiol. 2018, 10, 511–519. [Google Scholar] [CrossRef] [PubMed]
- Cremer, N.; Hurvitz, E.A.; Peterson, M.D. Multimorbidity in Middle-Aged Adults with Cerebral Palsy. Am. J. Med. 2017, 130, 744.e9–744.e15. [Google Scholar] [CrossRef]
- Whitney, D.G.; Miller, F.; Pohlig, R.T.; Modlesky, C.M. BMI does not capture the high fat mass index and low fat-free mass index in children with cerebral palsy and proposed statistical models that improve this accuracy. Int. J. Obes. 2019, 43, 82–90. [Google Scholar] [CrossRef] [PubMed]
- Duran, I.; Schulze, J.; Martakis, K.; Stark, C.; Schoenau, E. Diagnostic performance of body mass index to identify excess body fat in children with cerebral palsy. Dev. Med. Child Neurol. 2018, 60, 680–686. [Google Scholar] [CrossRef]
- Oftedal, S.; Davies, P.S.; Boyd, R.N.; Stevenson, R.D.; Ware, R.S.; Keawutan, P.; Benfer, K.A.; Bell, K.L. Body composition, diet, and physical activity: A longitudinal cohort study in preschoolers with cerebral palsy. Am. J. Clin. Nutr. 2017, 105, 369–378. [Google Scholar] [CrossRef]
- Patrick, J.; Boland, M.; Stoski, D.; Murray, G.E. Rapid correction of wasting in children with cerebral palsy. Dev. Med. Child Neurol. 1986, 28, 734–739. [Google Scholar] [CrossRef]
- Henderson, R.C.; Lark, R.K.; Gurka, M.J.; Worley, G.; Fung, E.B.; Conaway, M.; Stallings, V.A.; Stevenson, R.D. Bone density and metabolism in children and adolescents with moderate to severe cerebral palsy. Pediatrics 2002, 110, e5. [Google Scholar] [CrossRef]
- Sung, K.H.; Chung, C.Y.; Lee, K.M.; Cho, B.C.; Moon, S.J.; Kim, J.; Park, M.S. Differences in Body Composition According to Gross Motor Function in Children With Cerebral Palsy. Arch. Phys. Med. Rehabil. 2017, 98, 2295–2300. [Google Scholar] [CrossRef]
- Oeffinger, D.J.; Gurka, M.J.; Kuperminc, M.; Hassani, S.; Buhr, N.; Tylkowski, C. Accuracy of skinfold and bioelectrical impedance assessments of body fat percentage in ambulatory individuals with cerebral palsy. Dev. Med. Child Neurol. 2014, 56, 475–481. [Google Scholar] [CrossRef]


| Parameter | CP vs. Controls | |||||
|---|---|---|---|---|---|---|
| Boys | Girls | |||||
| Effect Size (95% CI) | F(1, 149) | p Value | Effect Size (95% CI) | F(1, 81) | p Value | |
| Weight (kg) | −6.6 (−9.9; −3.2) | 16.25 | 0.0002 *** | −5.8 (−9.7; −1.8) | 7.99 | 0.0059 ** |
| Height (cm) | −5.8 (−8.7; −3.0) | 14.87 | 0.0001 *** | −7.0 (−10.3; −3.7) | 17.32 | 0.0001 *** |
| BMI (kg/m2) | −1.6 (−2.6; −0.6) | 10.16 | 0.0017 ** | −0.8 (−2.4; 0.7) | 1.08 | 0.3022 |
| R-resistance | 83.7 (54.7; 112.7) | 31.99 | <0.0001 *** | 41.4 (−2.0; 84.7) | 3.49 | 0.0652 |
| Xc-reactance | 4.3 (1.0; 7.6) | 6.44 | 0.0122 * | 0.4 (−3.1; 4.0) | 0.06 | 0.8075 |
| BMR | −452 (−621; −283) | 27.45 | <0.0001 *** | −306 (−494; −118) | 10.21 | 0.0020 ** |
| Parameter | CP vs. Controls | ||
|---|---|---|---|
| Effect Size (95% CI) | F(1, 233) | p Value | |
| FM (kg) | −0.9 (−2.4; 0.5) | 1.57 | 0.2109 |
| FMpct (%) | −0.4 (−2.9; 2.0) | 0.12 | 0.7314 |
| FFM (kg) | −5.3 (−7.0; −3.5) | 34.87 | <0.0001 *** |
| FFMpct (%) | 0.3 (−2.1; 2.7) | 0.06 | 0.8135 |
| MM (kg) | −4.0 (−5.4; −2.6) | 32.49 | <0.0001 *** |
| MMpct (%) | −1.4 (−3.3; 0.5) | 1.99 | 0.1602 |
| BCM (kg) | −3.3 (−4.4; −2.1) | 31.58 | <0.0001 *** |
| BCMpct (%) | −1.9 (−3.1; −0.8) | 10.45 | 0.0014 ** |
| BCMI (kg/m2) | −0.8 (−1.2; −0.5) | 20.24 | <0.0001 *** |
| TBW (l) | −3.6 (−4.9; −2.3) | 30.70 | <0.0001 *** |
| TBWpct (%) | 1.2 (−1.2; 3.6) | 0.93 | 0.3366 |
| PA (°) | −0.3 (−0.5; −0.1) | 6.35 | 0.0124 * |
| Parameter | CP vs. Controls | |||||
|---|---|---|---|---|---|---|
| Boys | Girls | |||||
| Effect Size (95% CI) | F(1, 149) | p Value | Effect Size (95% CI) | F(1, 81) | p Value | |
| FM (kg) | −0.5 (−2.3; 1.3) | 0.35 | 0.5542 | −1.7 (−4.1; 0.8) | 1.74 | 0.1908 |
| FMpct (%) | −0.3 (−3.4; 2.8) | 0.04 | 0.8427 | −0.6 (−4.3; 3.0) | 0.12 | 0.7330 |
| FFM (kg) | −5.9 (−8.1; −3.7) | 27.22 | <0.0001 *** | −4.1 (−6.2; −2.0) | 14.18 | 0.0003 *** |
| FFMpct (%) | 0.1 (−2.9; 3.1) | 0.00 | 0.9486 | 0.6 (−3.0; 4.3) | 0.12 | 0.7330 |
| MM (kg) | −4.5 (−6.2; −2.8) | 27.85 | <0.0001 *** | −3.0 (−4.9; −1.2) | 10.55 | 0.0017 ** |
| MMpct (%) | −1.8 (−4.1; 0.5) | 2.24 | 0.1364 | −0.7 (−3.9; 2.4) | 0.21 | 0.6502 |
| BCM (kg) | −3.7 (−5.1; −2.3) | 26.94 | <0.0001 *** | −2.5 (−4.1; −1.0) | 10.27 | 0.0019 ** |
| BCMpct (%) | −2.1 (−3.5; −0.7) | 8.29 | 0.0046 ** | −1.6 (−3.5; 0.4) | 2.55 | 0.1145 |
| BCMI (kg/m2) | −1.0 (−1.5; −0.6) | 24.95 | <0.0001 *** | −0.4 (−1.1; 0.2) | 1.69 | 0.1976 |
| TBW (l) | −4.2 (−5.8; −2.6) | 27.00 | <0.0001 *** | −2.6 (−4.0; −1.2) | 12.69 | 0.0006 *** |
| TBWpct (%) | 1.1 (−1.9; 4.1) | 0.48 | 0.4900 | 1.4 (−2.1; 4.8) | 0.62 | 0.4345 |
| PA (°) | −0.3 (−0.6; −0.1) | 6.96 | 0.0092 ** | −0.2 (−0.6; 0.2) | 0.79 | 0.3752 |
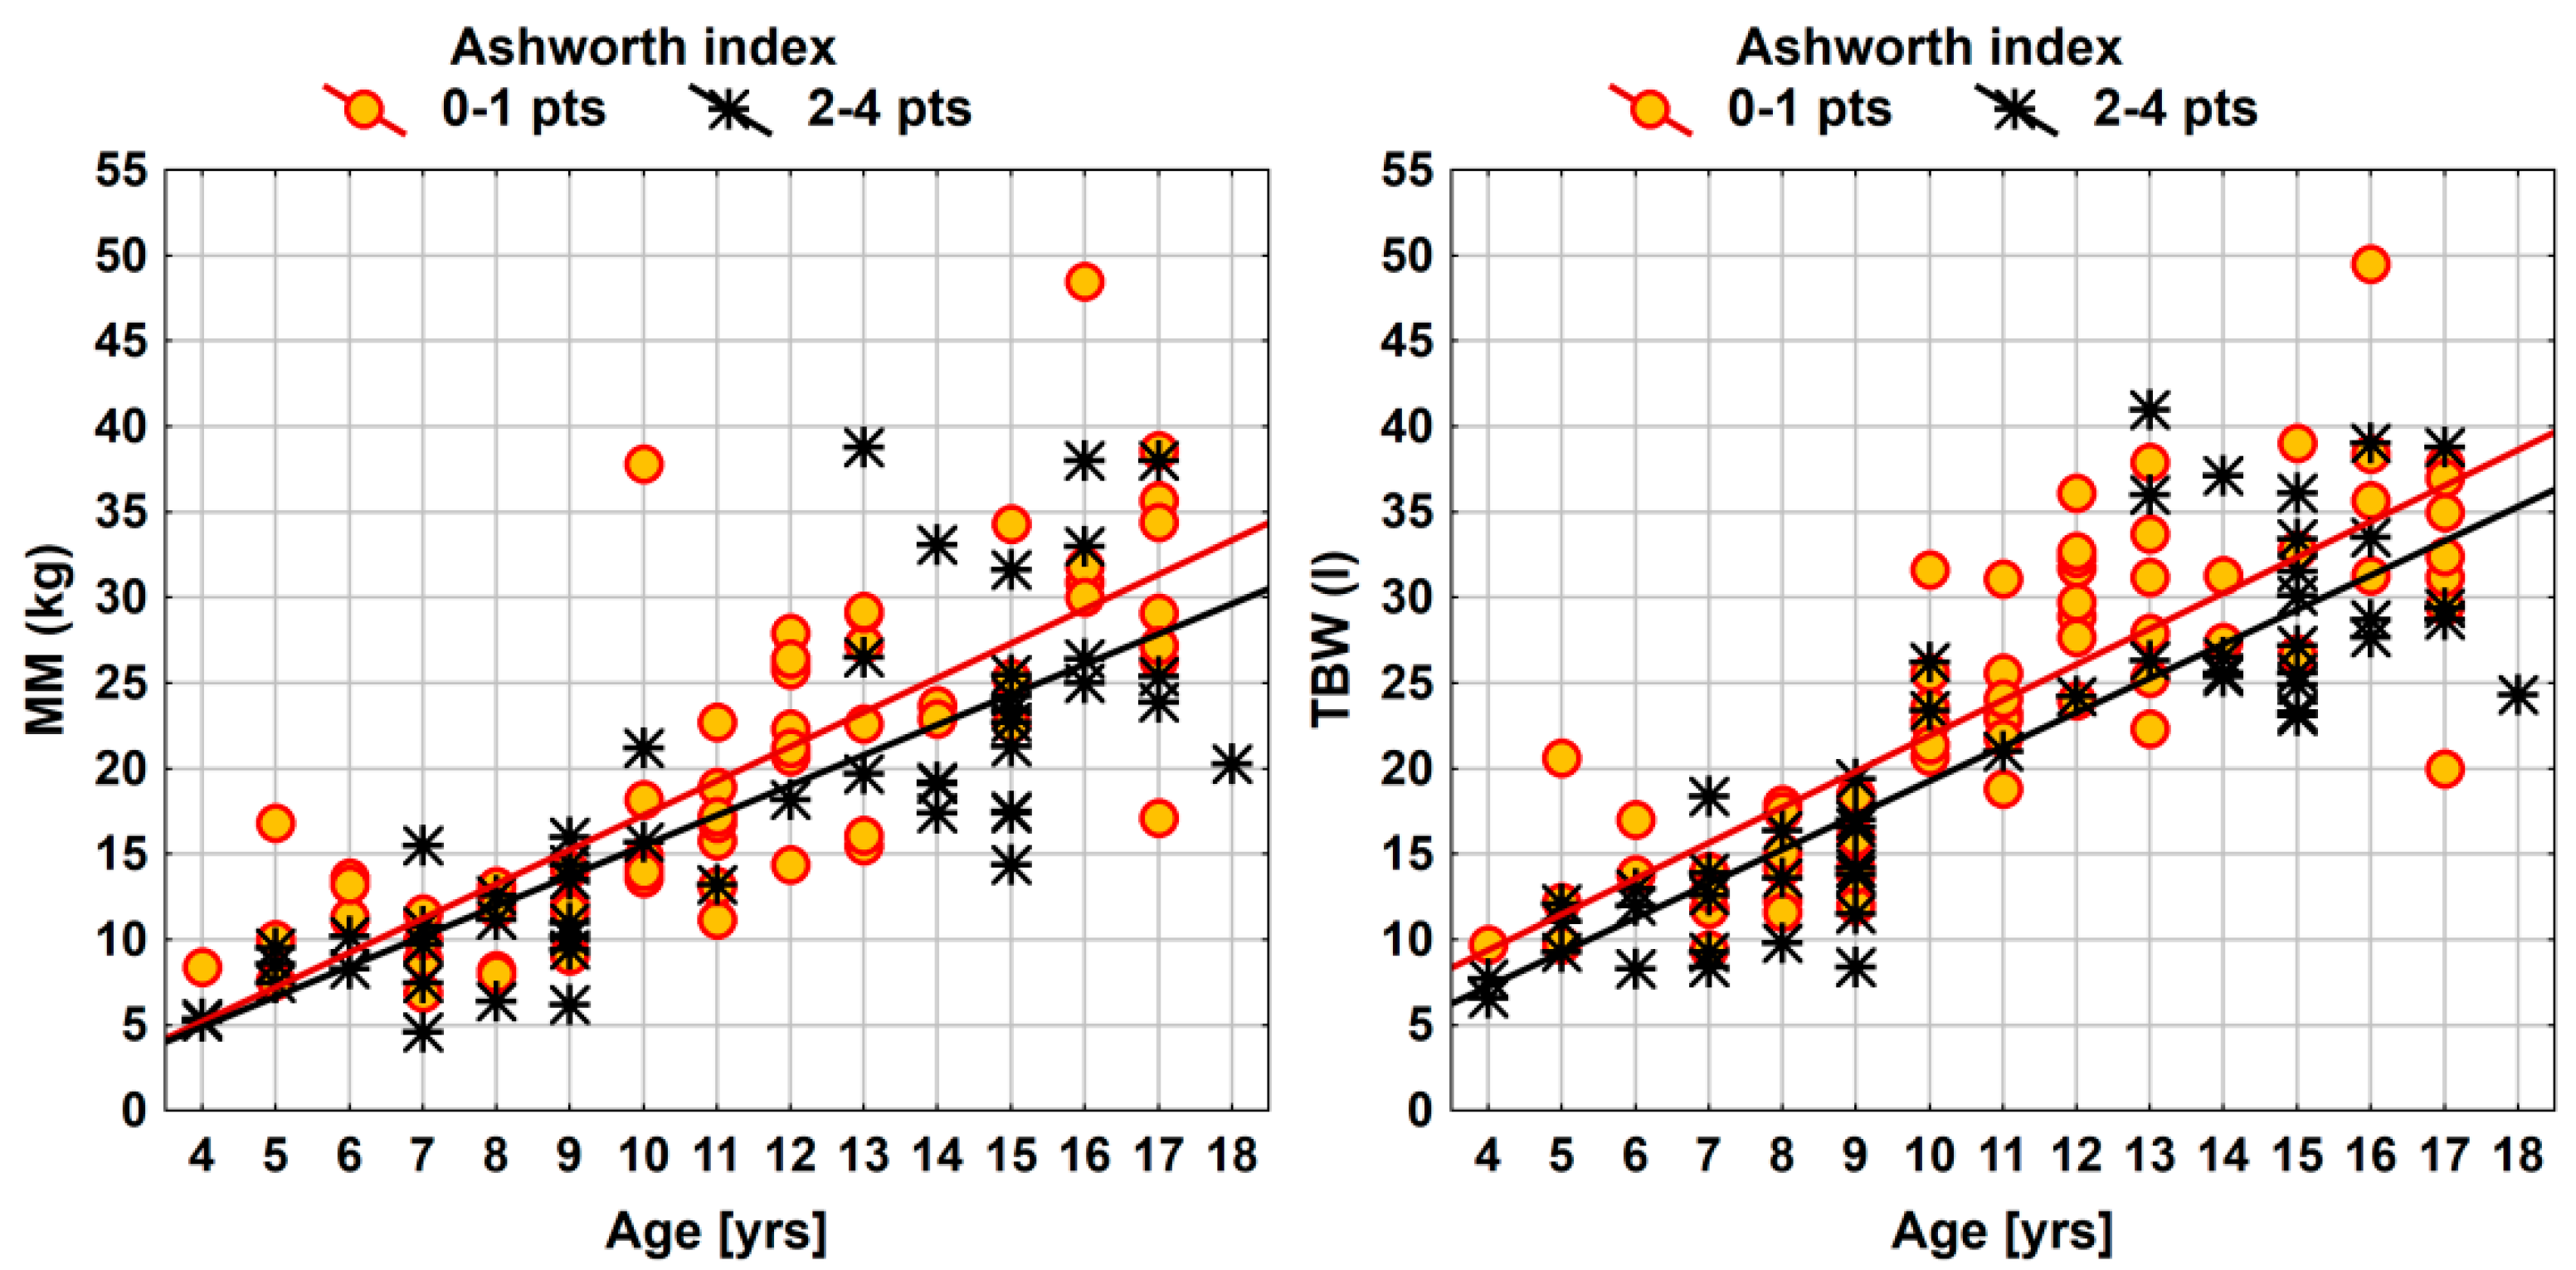
| Parameter | Ashworth Index (2–4 vs. 0–1 pts) | ||
|---|---|---|---|
| Effect Size (95% CI) | F(1, 115) | p Value | |
| FM (kg) | −2.7 (−4.8; −0.5) | 5.88 | 0.0168 * |
| FMpct (%) | −0.9 (−4.7; 3.0) | 0.18 | 0.6680 |
| FFM (kg) | −3.3 (−5.8; −0.9) | 6.96 | 0.0095 ** |
| FFMpct (%) | 1.1 (−2.8; 4.9) | 0.31 | 0.5793 |
| MM (kg) | −2.1 (−4.1; 0.0) | 3.97 | 0.0488 * |
| MMpct (%) | 0.8 (−2.4; 4.0) | 0.25 | 0.6178 |
| BCM (kg) | −1.7 (−3.4; 0.0) | 3.97 | 0.0486 * |
| BCMpct (%) | −0.1 (−2.2; 1.9) | 0.01 | 0.9046 |
| BCMI (kg/m2) | −0.4 (−1.0; 0.2) | 1.63 | 0.2049 |
| TBW (l) | −2.7 (−4.6; −0.9) | 8.34 | 0.0046 ** |
| TBWpct (%) | 0.1 (−3.8; 3.9) | 0.00 | 0.9790 |
| PA (°) | 0.0 (−0.4; 0.4) | 0.04 | 0.8477 |
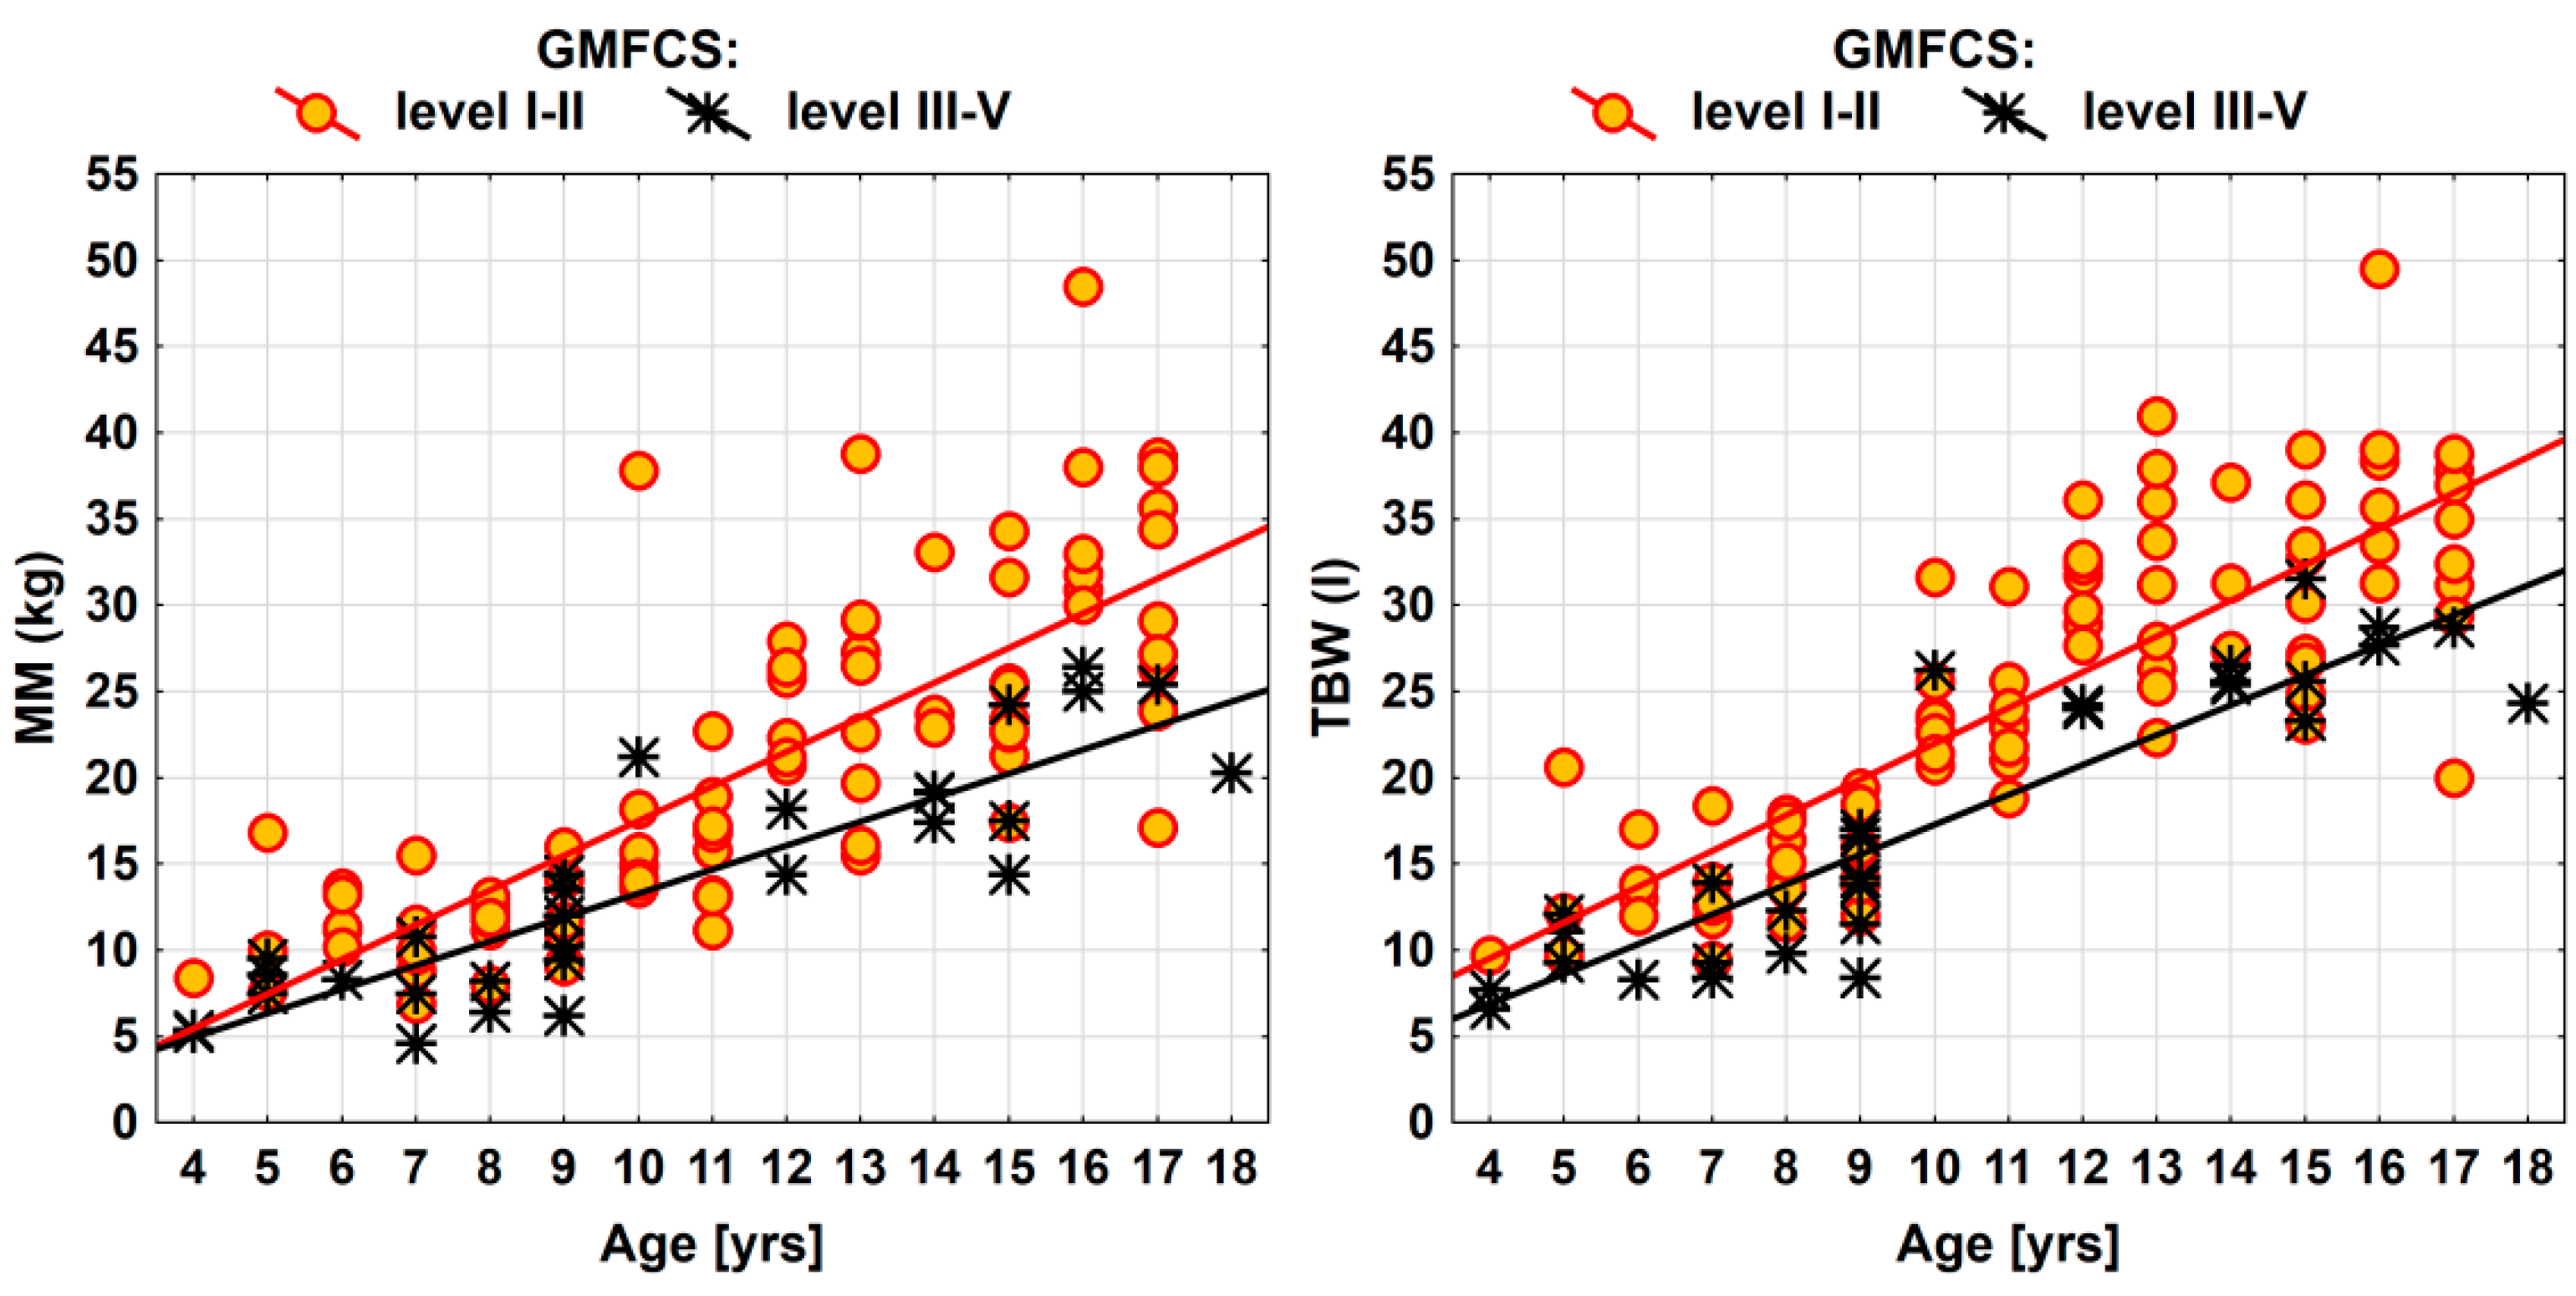
| Parameter | GMFCS (level III-V vs. I-II) | ||
|---|---|---|---|
| Effect Size (95% CI) | F(1, 115) | p Value | |
| FM (kg) | −1.2 (−3.8; 1.3) | 0.90 | 0.3453 |
| FMpct (%) | 2.7 (−1.8; 7.1) | 1.38 | 0.2430 |
| FFM (kg) | −6.2 (−8.9; −3.5) | 20.26 | <0.0001 *** |
| FFMpct (%) | −2.5 (−6.8; 1.9) | 1.20 | 0.2749 |
| MM (kg) | −4.6 (−6.8; −2.3) | 16.27 | 0.0001 *** |
| MMpct (%) | −3.3 (−6.9; 0.3) | 3.14 | 0.0790 |
| BCM (kg) | −3.8 (−5.6; −1.9) | 16.05 | 0.0001 *** |
| BCMpct (%) | −2.4 (−4.7; 0.0) | 3.92 | 0.0501 |
| BCMI (kg) | −0.9 (−1.5; −0.2) | 7.01 | 0.0092 ** |
| TBW (l) | −4.9 (−6.9; −2.9) | 22.77 | <0.0001 *** |
| TBWpct (%) | −2.6 (−7.0; 1.8) | 1.39 | 0.2407 |
| PA (kg) | −0.4 (−0.9; 0.0) | 3.12 | 0.0801 |
© 2020 by the authors. Licensee MDPI, Basel, Switzerland. This article is an open access article distributed under the terms and conditions of the Creative Commons Attribution (CC BY) license (http://creativecommons.org/licenses/by/4.0/).
Share and Cite
Więch, P.; Ćwirlej-Sozańska, A.; Wiśniowska-Szurlej, A.; Kilian, J.; Lenart-Domka, E.; Bejer, A.; Domka-Jopek, E.; Sozański, B.; Korczowski, B. The Relationship between Body Composition and Muscle Tone in Children with Cerebral Palsy: A Case-Control Study. Nutrients 2020, 12, 864. https://doi.org/10.3390/nu12030864
Więch P, Ćwirlej-Sozańska A, Wiśniowska-Szurlej A, Kilian J, Lenart-Domka E, Bejer A, Domka-Jopek E, Sozański B, Korczowski B. The Relationship between Body Composition and Muscle Tone in Children with Cerebral Palsy: A Case-Control Study. Nutrients. 2020; 12(3):864. https://doi.org/10.3390/nu12030864
Chicago/Turabian StyleWięch, Paweł, Agnieszka Ćwirlej-Sozańska, Agnieszka Wiśniowska-Szurlej, Justyna Kilian, Ewa Lenart-Domka, Agnieszka Bejer, Elżbieta Domka-Jopek, Bernard Sozański, and Bartosz Korczowski. 2020. "The Relationship between Body Composition and Muscle Tone in Children with Cerebral Palsy: A Case-Control Study" Nutrients 12, no. 3: 864. https://doi.org/10.3390/nu12030864
APA StyleWięch, P., Ćwirlej-Sozańska, A., Wiśniowska-Szurlej, A., Kilian, J., Lenart-Domka, E., Bejer, A., Domka-Jopek, E., Sozański, B., & Korczowski, B. (2020). The Relationship between Body Composition and Muscle Tone in Children with Cerebral Palsy: A Case-Control Study. Nutrients, 12(3), 864. https://doi.org/10.3390/nu12030864