Effect of Exercise Duration on Postprandial Glycaemic and Insulinaemic Responses in Adolescents


 and
and
Abstract
1. Introduction
2. Methodology
2.1. Participant Characteristics
2.2. Study Design
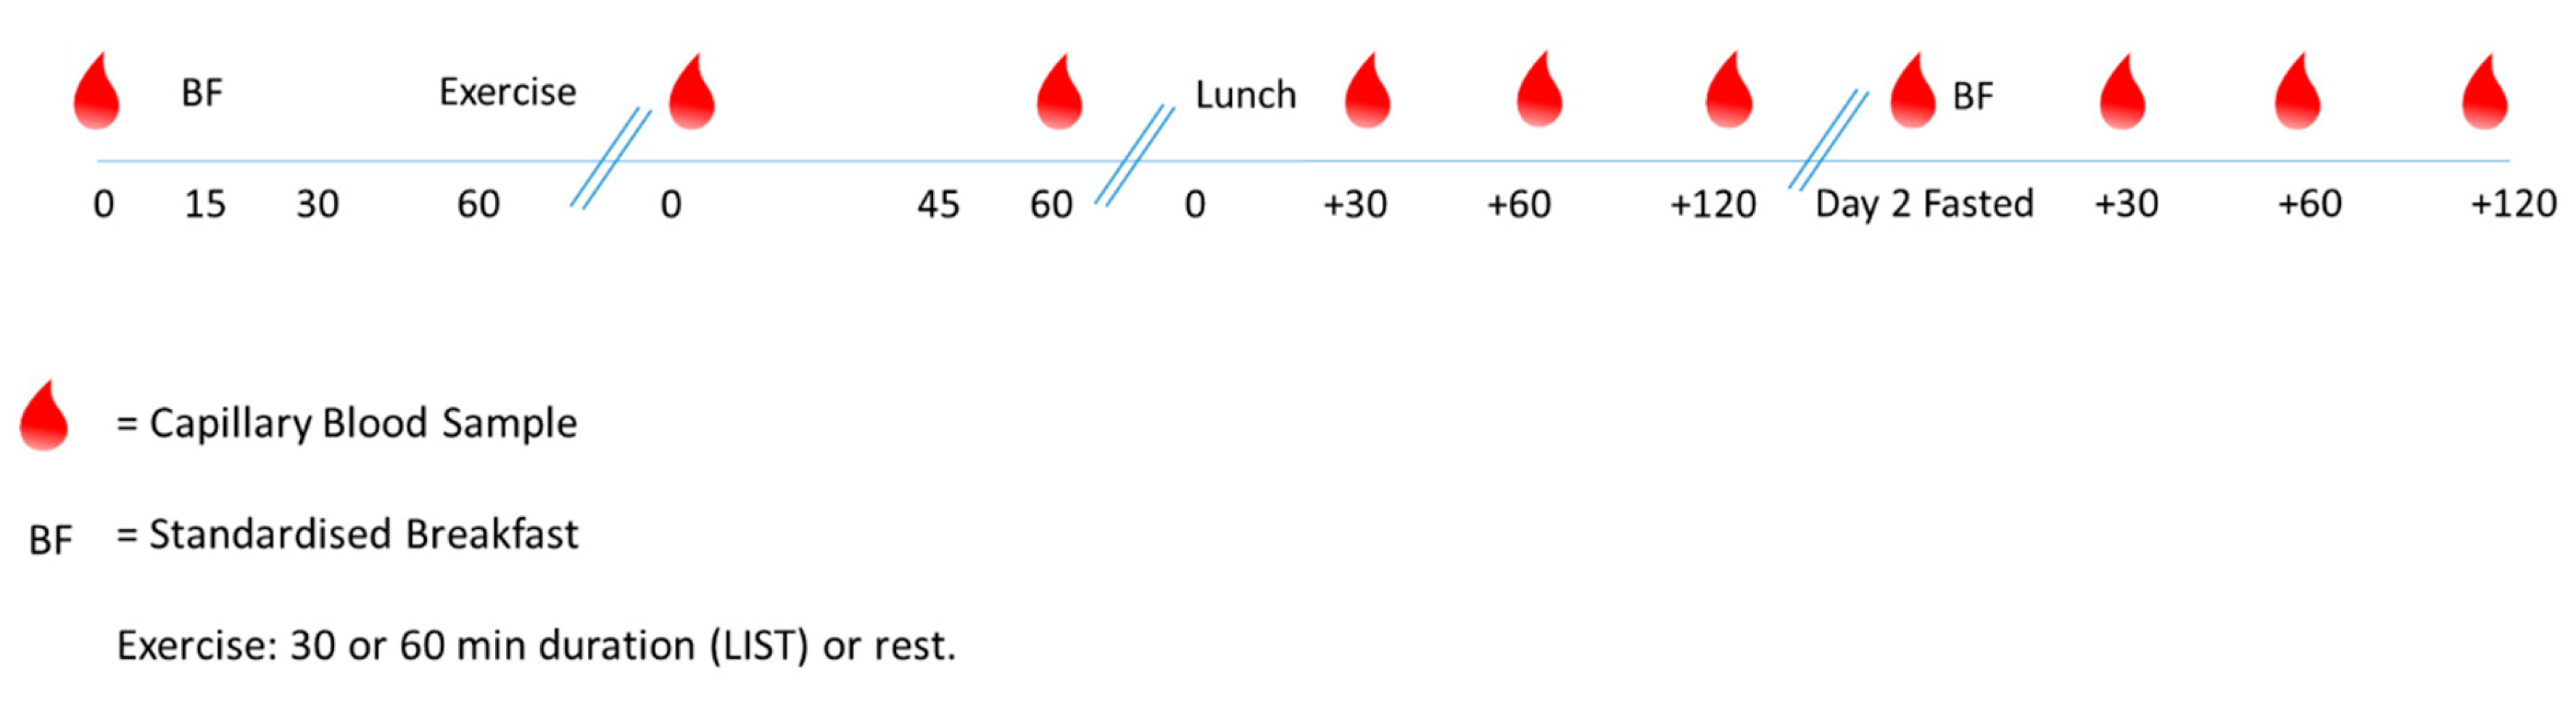
2.3. Main Trials
2.3.1. Capillary Blood Samples
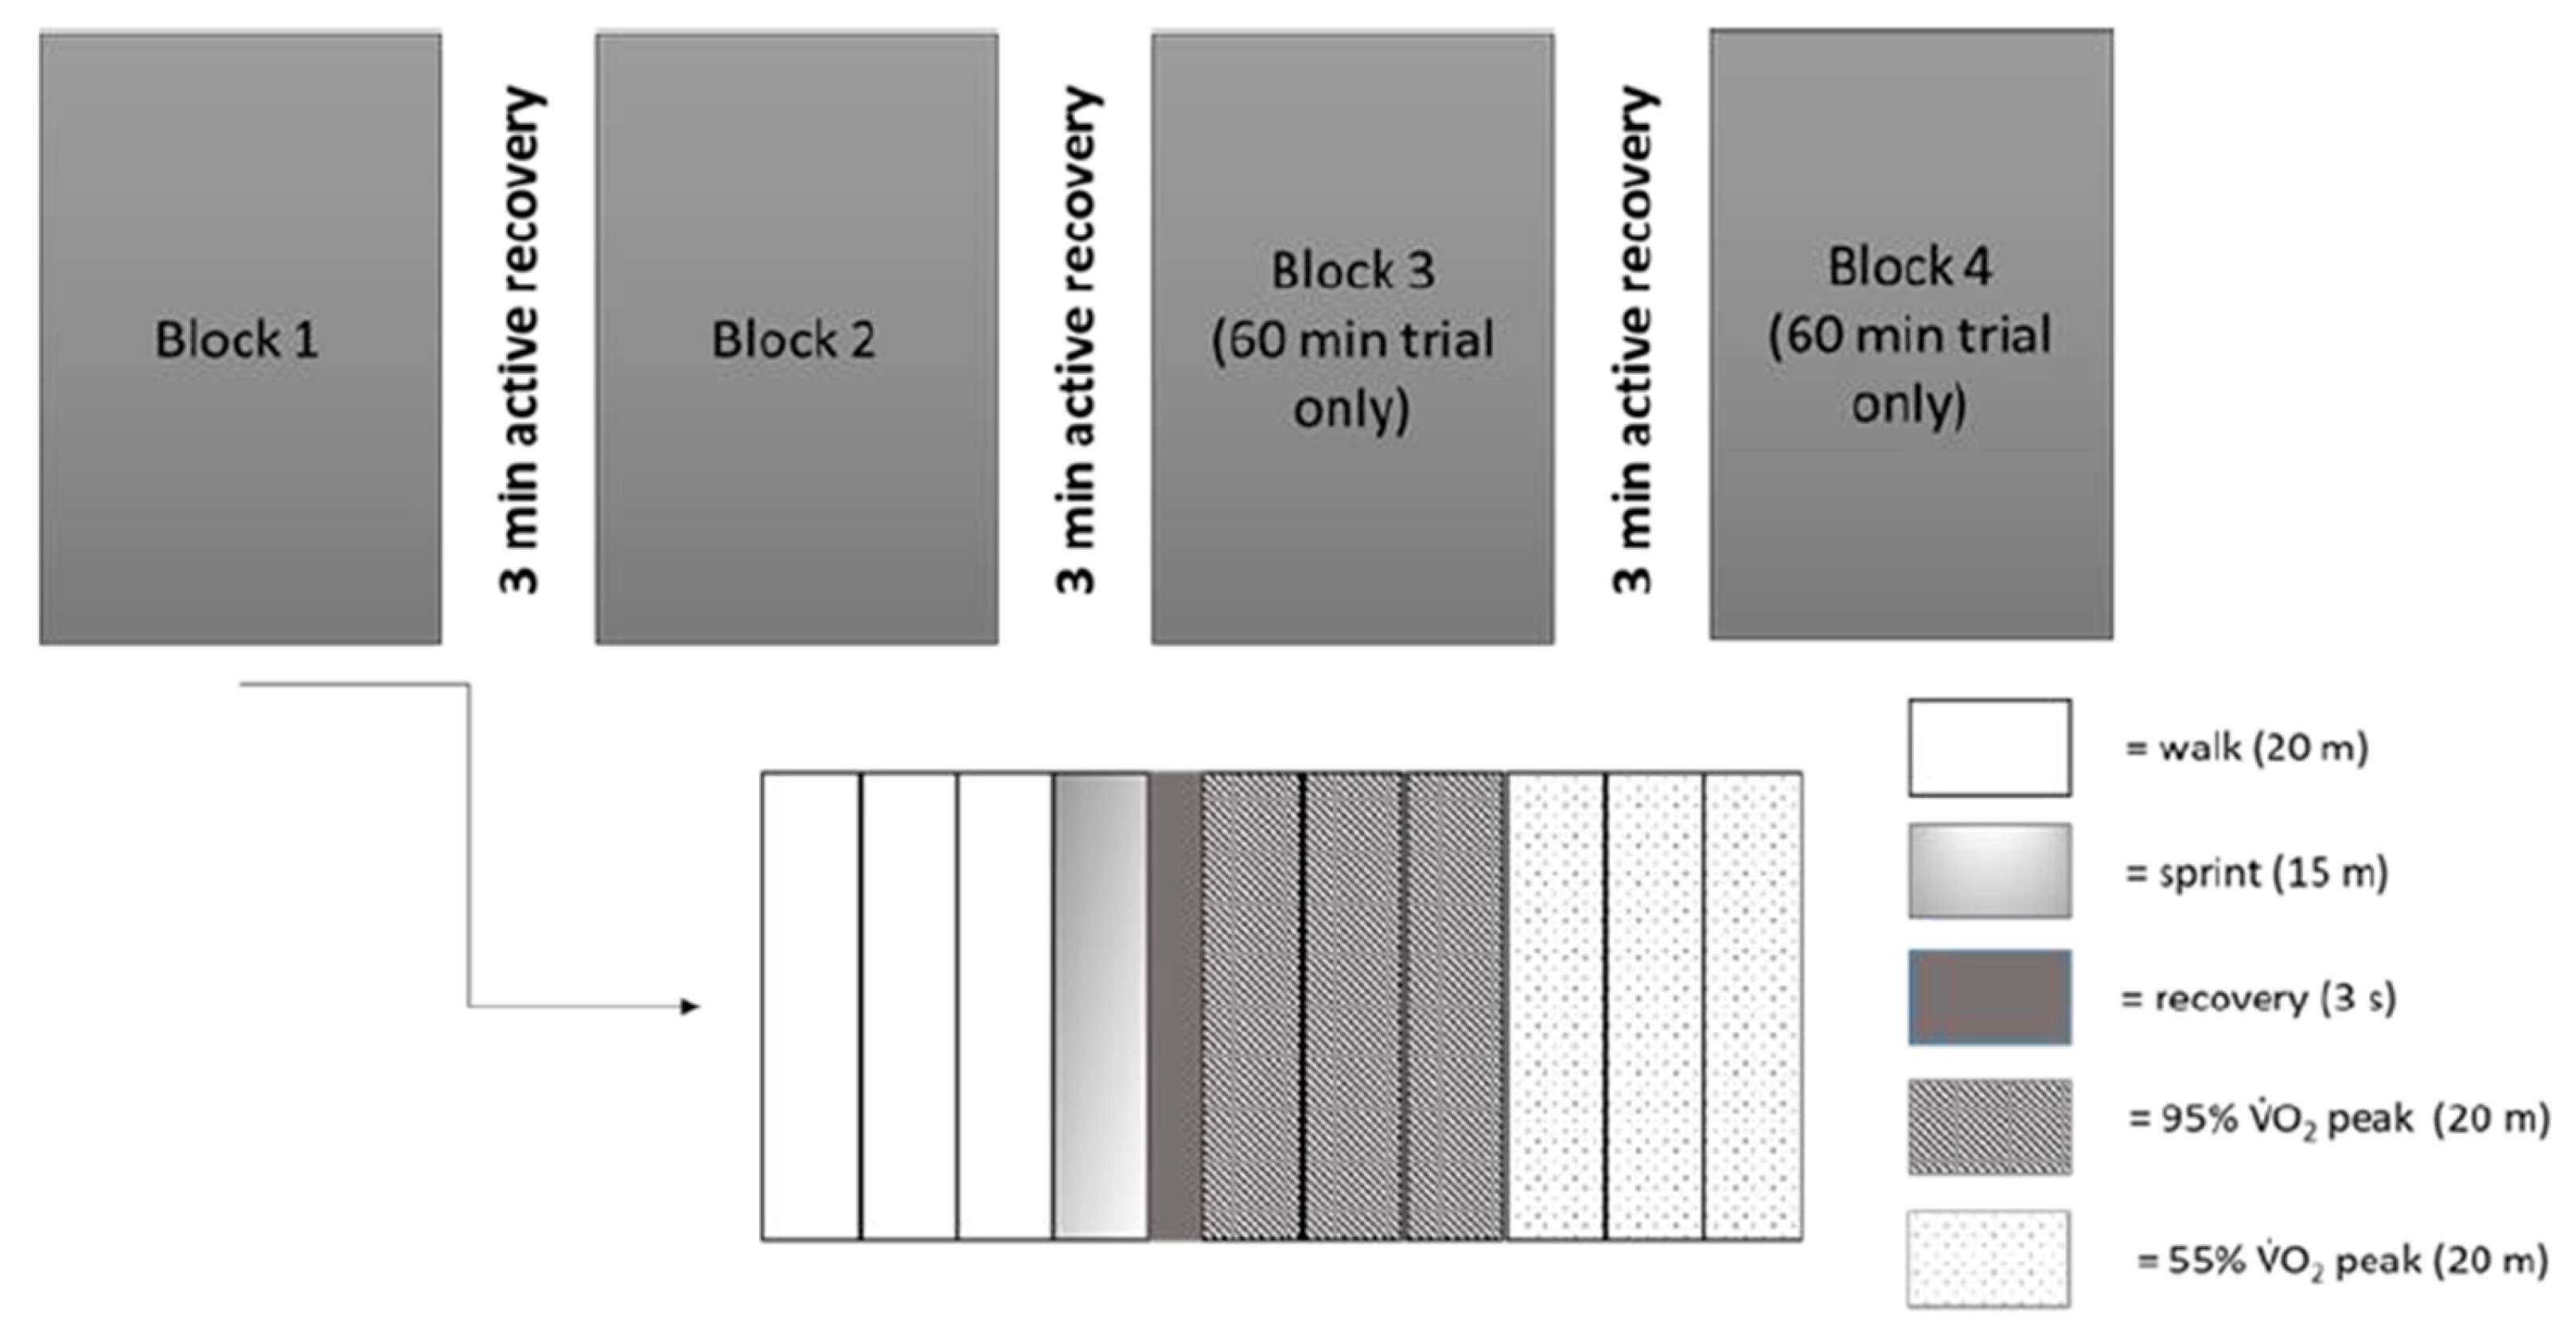
2.3.2. Exercise Protocol
2.3.3. Statistical Analysis
3. Results
3.1. Performance Variables
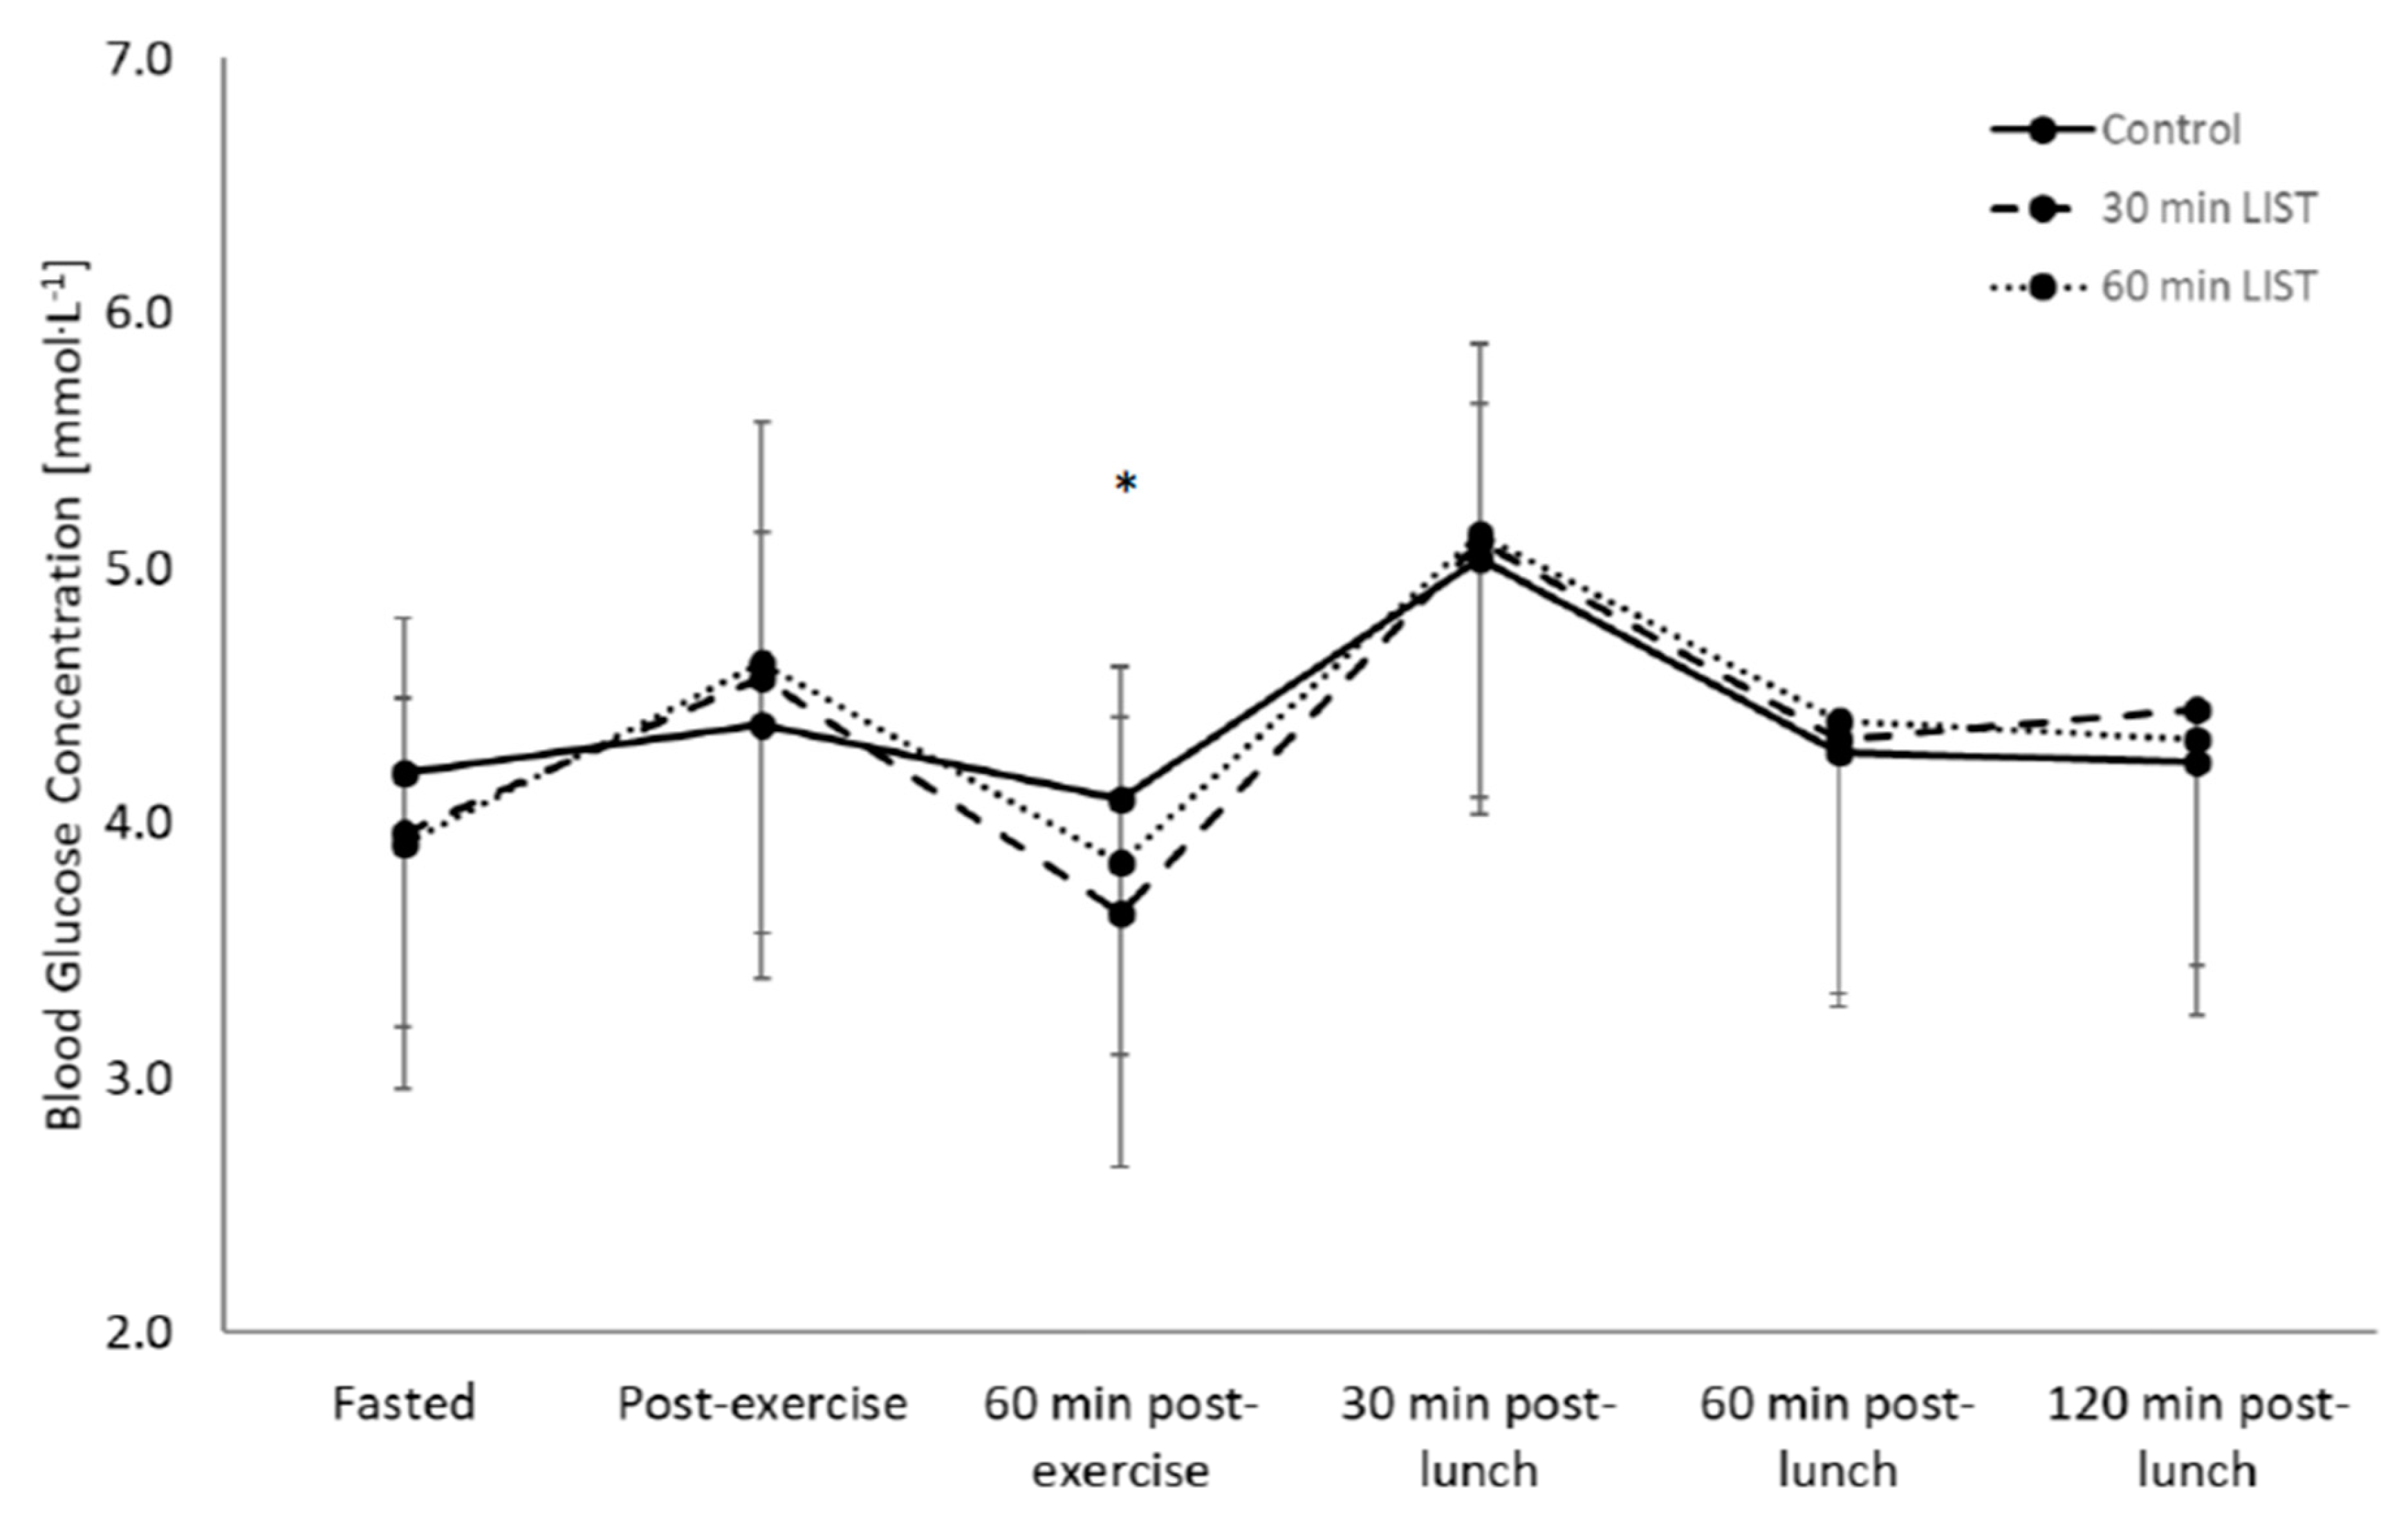
3.2. Glycaemic Response
3.2.1. Day One
3.2.2. Day Two
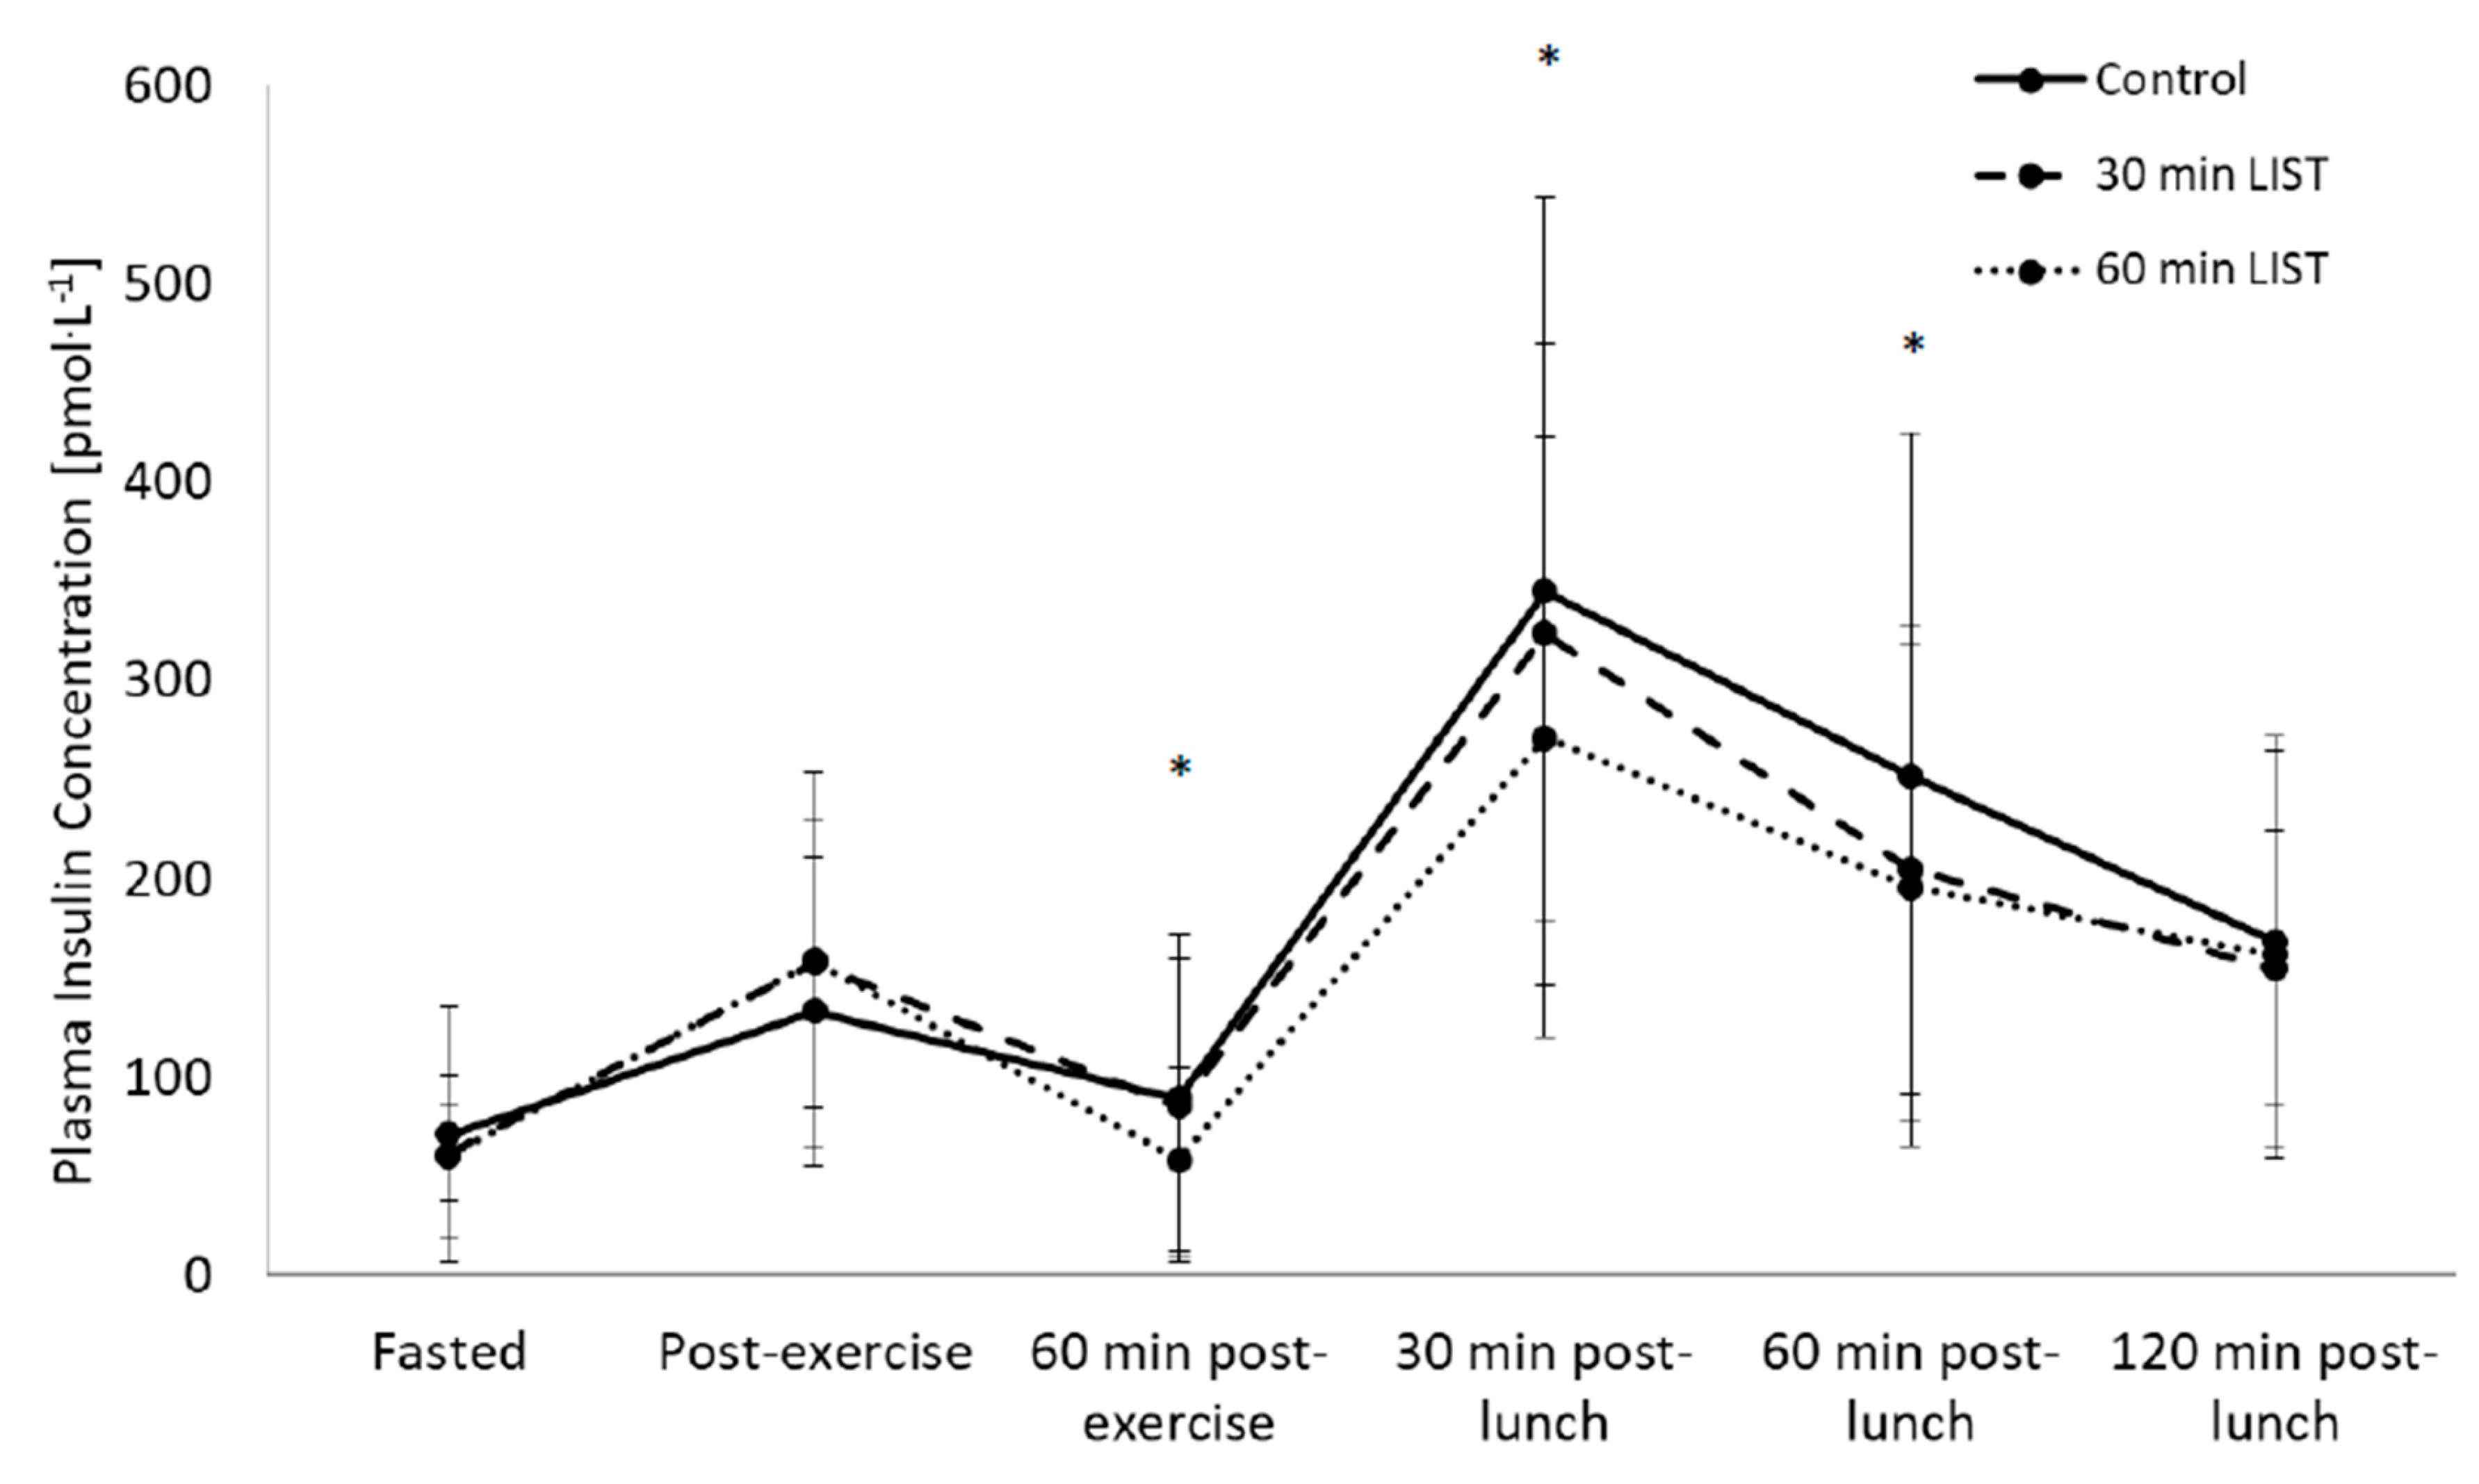
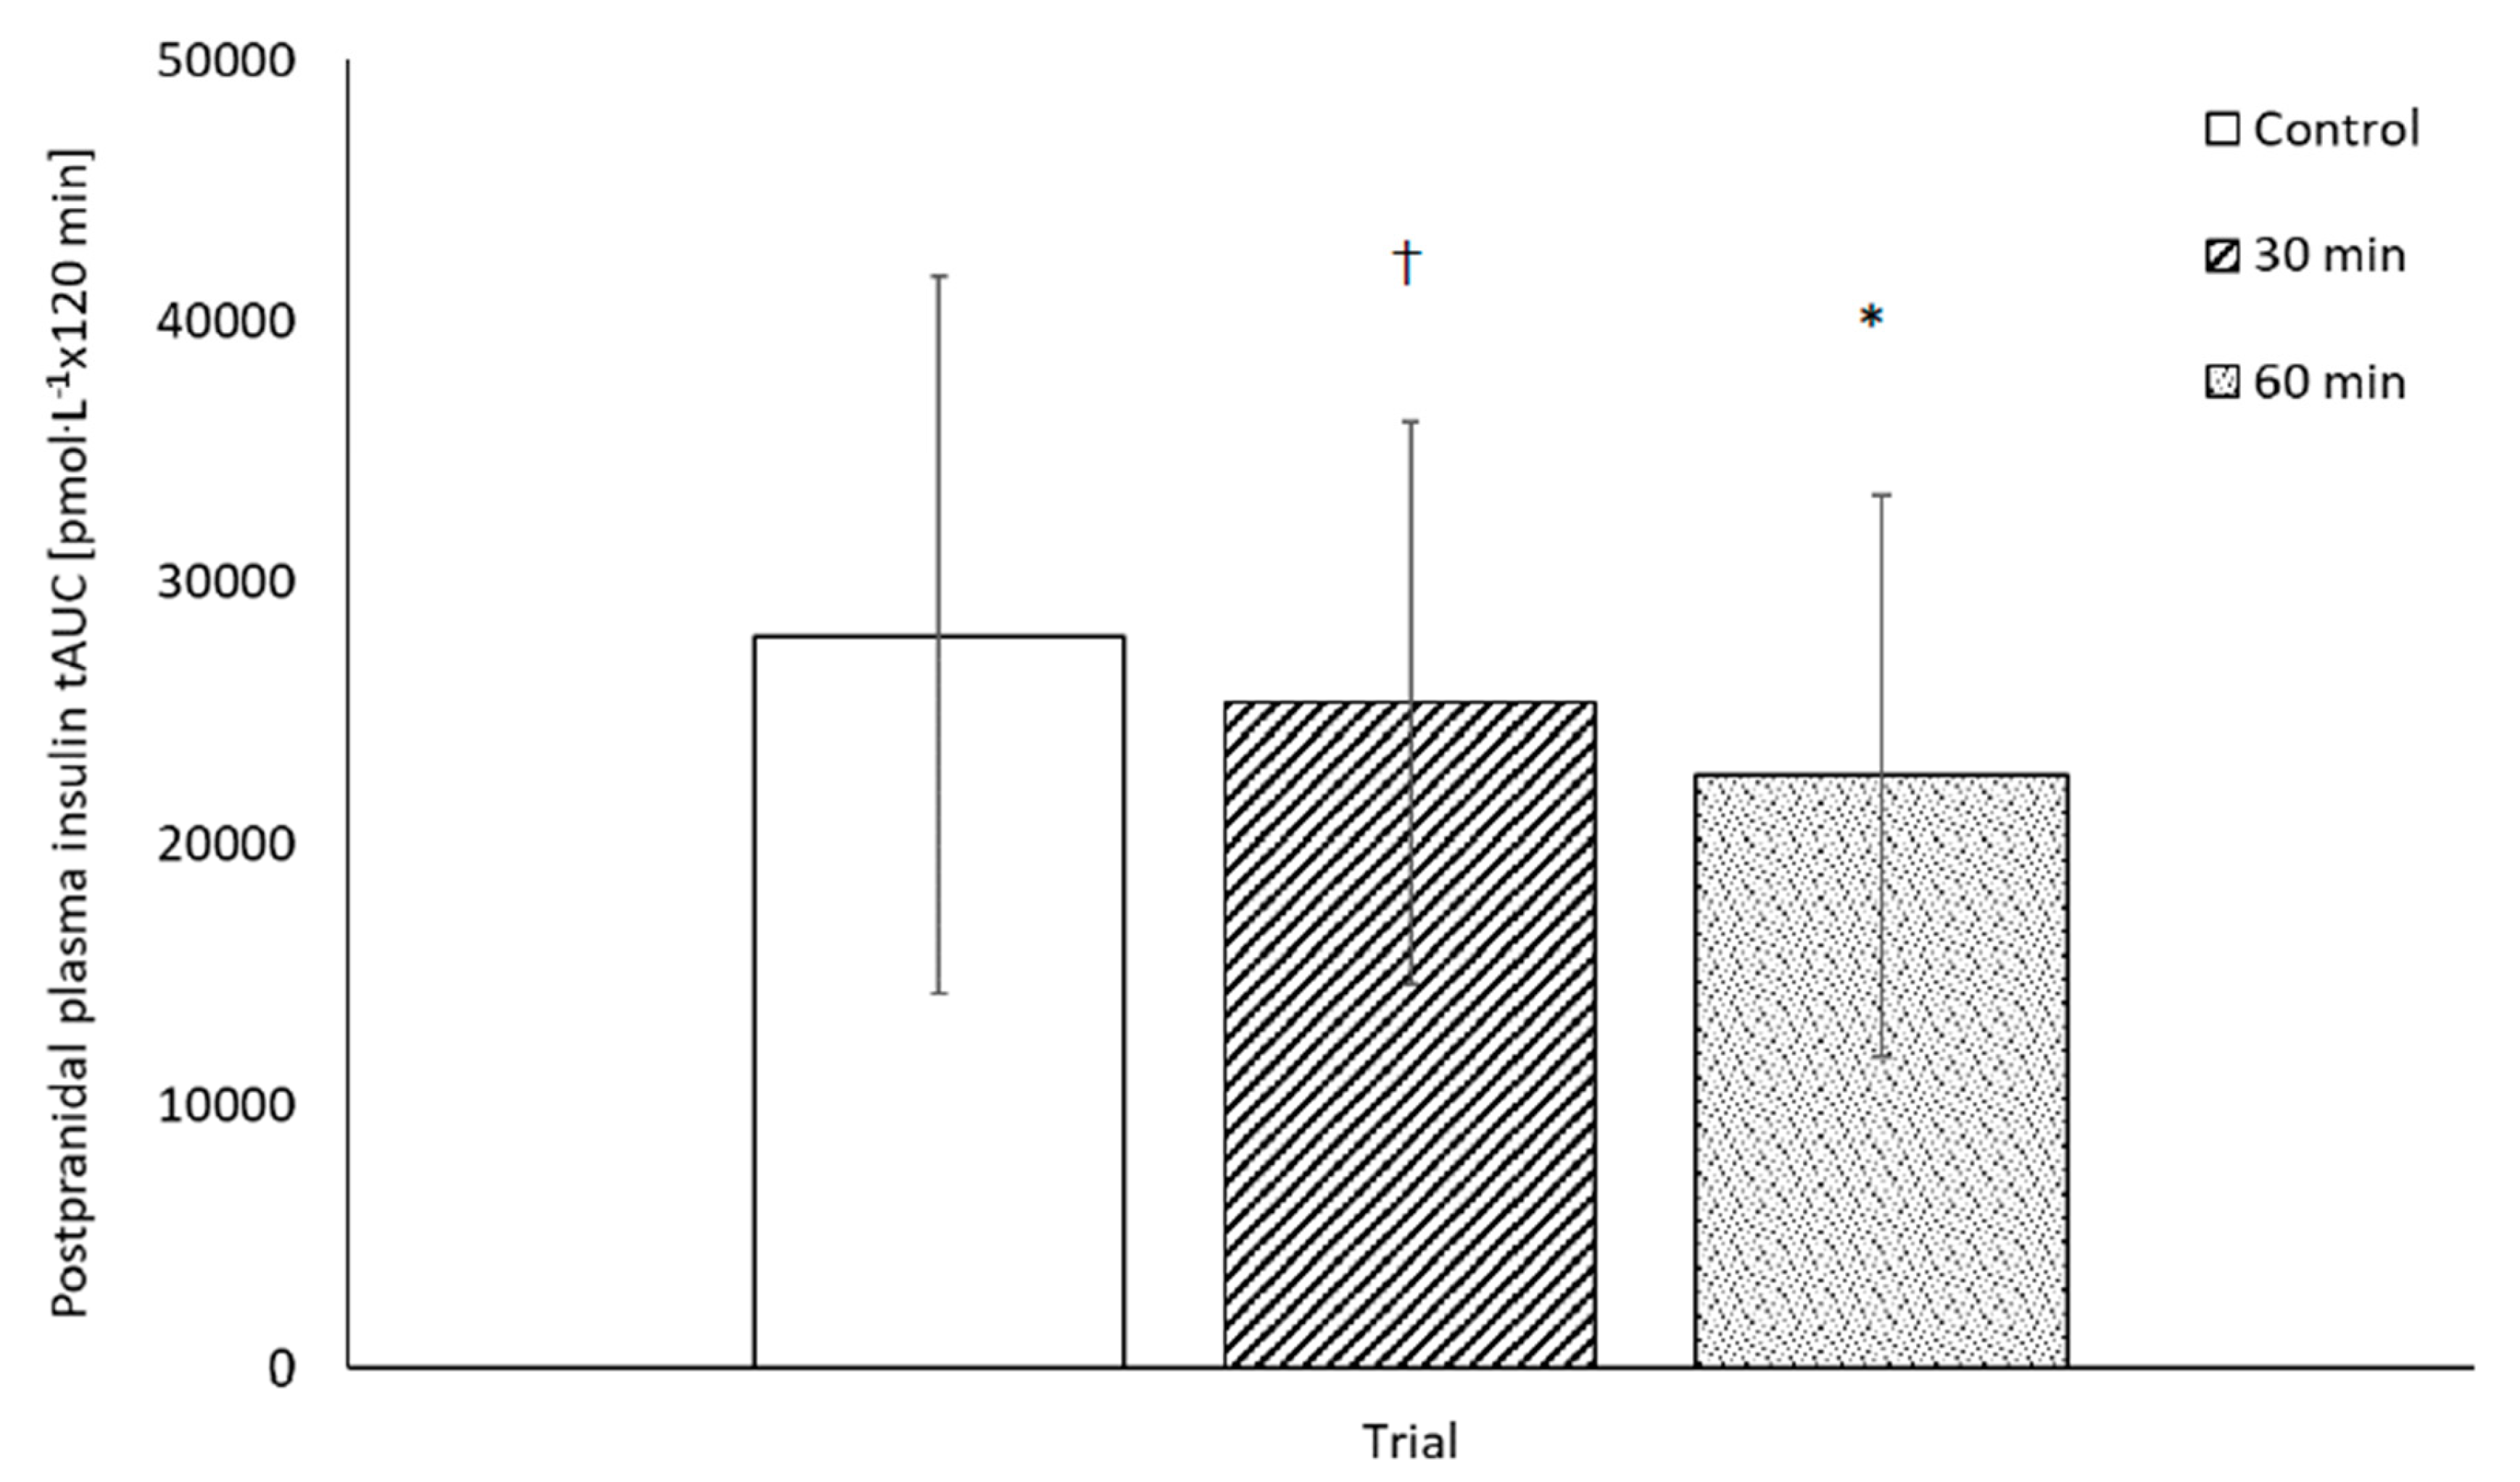
3.3. Insulinaemic Response
3.3.1. Day One
3.3.2. Day Two
3.4. HOMA-IR
4. Discussion
5. Conclusions
Supplementary Materials
Author Contributions
Funding
Acknowledgments
Conflicts of Interest
References
- Diabetes UK. 2016. Available online: https://diabetes-resources-production.s3-eu-west-1.amazonaws.com/diabetes-storage/migration/pdf/DiabetesUK_Facts_Stats_Oct16.pdf (accessed on 17 February 2020).
- Holman, R.R.; Paul, S.K.; Bethel, M.A.; Matthews, D.R.; Neil, H.A.W. 10-year follow-up of intensive glucose control in type 2 diabetes. N. Eng. J. Med. 2008, 359, 1577–1589. [Google Scholar] [CrossRef] [PubMed]
- Reinehr, T. Type 2 diabetes mellitus in children and adolescents. World J. Diabetes 2013, 4, 270. [Google Scholar] [CrossRef] [PubMed]
- Gleeson, M.; Bishop, N.C.; Stensel, D.J.; Lindley, M.R.; Mastana, S.S.; Nimmo, M.A. The anti-inflammatory effects of exercise: Mechanisms and implications for the prevention and treatment of disease. Nat. Rev. Immunol. 2011, 11, 607–615. [Google Scholar] [CrossRef] [PubMed]
- Public Health England Priorities 2013–2014. Available online: https://www.gov.uk/government/publications/public-health-englands-priorities-for-2013-to-2014 (accessed on 17 February 2020).
- Sandercock, G.R.H.; Cohen, D.D. The spectrum of the dyslipidemia in Columbia: The PURE study. J. Sci. Med. Sport 2018, 22, 201. [Google Scholar] [CrossRef] [PubMed]
- UK Chief Medical Officers’ Physical Activity Guidelines. Available online: https://assets.publishing.service.gov.uk/government/uploads/system/uploads/attachment_data/file/832868/uk-chief-medical-officers-physical-activity-guidelines.pdf (accessed on 17 February 2020).
- Cockcroft, E.J.; Williams, C.A.; Tomlinson, O.W.; Vlachopoulos, D.; Jackman, S.R.; Armstrong, N.; Barker, A.R. High-intensity interval exercise is an effective alternative to moderate intensity exercise for improving glucose tolerance and insulin sensitivity in adolescent boys. J. Sci. Med. Sport 2015, 18, 720–724. [Google Scholar] [CrossRef] [PubMed]
- Short, K.R.; Pratt, L.V.; Teague, A.M.; Man, C.D.; Cobelli, C. Postprandial improvement in insulin sensitivity after a single exercise session in adolescents with low aerobic fitness and physical activity. Pediatric Diabetes 2013, 14, 129–137. [Google Scholar] [CrossRef] [PubMed]
- Howe, C.A.; Freedson, P.S.; Feldman, H.A.; Osganian, S.K. Energy expenditure and enjoyment of common children’s games in a simulated free-play environment. J. Pediatric 2010, 157, 936–942. [Google Scholar] [CrossRef]
- Bailey, D.P.; Boddy, L.M.; Savory, L.A.; Denton, S.J.; Kerr, C.J. Associations between cardiorespiratory fitness, physical activity and clustered cardiometabolic risk in children and adolescents: The HAPPY study. Eur. J. Pediatric 2012, 171, 1317–1323. [Google Scholar] [CrossRef]
- Cockcroft, E.J.; Williams, C.A.; Jackman, S.R.; Bassi, S.; Armstrong, A.R.; Barker, A.R. A single bout of high-intensity interval exercise and work-matched moderate intensity exercise has minimal effect on glucose tolerance and insulin sensitivity in 7- to 10- year old boys. J. Sport Sci. 2018, 36, 149–155. [Google Scholar] [CrossRef]
- Dring, K.J.; Cooper, S.B.; Morris, J.G.; Sunderland, C.; Foulds, G.A.; Pockley, A.G.; Nevill, M.E. Cytokine, glycemic, and insulinemic responses to an acute bout of games-based activity in adolescents. Scand. J. Med. Sci. Sports 2019, 29, 597–605. [Google Scholar] [CrossRef]
- Rowlands, A.V.; Pilgrim, E.L.; Eston, R.G. Patterns of habitual activity across weekdays and weekend days in 9–11-year-old children. Prev. Med. 2008, 46, 317–324. [Google Scholar] [CrossRef] [PubMed]
- Cooper, S.B.; Dring, K.J.; Morris, J.G.; Cousins, B.E.W.; Nute, M.L.; Nevill, M.E. Sex differences in adolescents’ glycaemic and insulinaemic responses to high and low glycaemic index breakfasts: A randomised control trial. Br. J. Nutr. 2017, 117, 541–547. [Google Scholar] [CrossRef] [PubMed]
- Moore, S.A.; McKay, H.A.; Macdonald, H.; Nettlefold, L. Enhancing a somatic maturity prediction model. Med. Sci. Sports Exerc. 2015, 47, 1755–1764. [Google Scholar] [CrossRef] [PubMed]
- Barnett, A.; Chan, L.Y.; Bruce, L.C. A preliminary study of the 20-m multistage shuttle run as a predictor of peak VO2 in Hong Kong Chinese students. Pediatric Exerc. Sci. 1993, 5, 42–50. [Google Scholar] [CrossRef]
- Cooper, S.B.; Bandelow, S.; Nute, M.L.; Morris, J.G.; Nevill, M.E. Breakfast glycaemic index and cognitive function in adolescent schoolchildren. Br. J. Nutr. 2012, 107, 1823–1832. [Google Scholar] [CrossRef] [PubMed]
- Wolever, T.M.; Jenkins, D.J. The use of the glycémie index in predicting the blood glucose response to mixed meals. Am. J. Clin. Nutr. 1986, 43, 167–172. [Google Scholar] [CrossRef]
- Salgado, A.L.F.D.A.; Carvalho, L.D.; Oliveira, A.C.; Santos, V.N.D.; Vieira, J.G.; Parise, E.R. Insulin resistance index (HOMA-IR) in the differentiation of patients with non-alcoholic fatty liver disease and healthy individuals. Arq. gastroenterol. 2010, 47, 165–169. [Google Scholar] [CrossRef]
- Nicholas, C.W.; Nuttall, F.E.; Williams, C. The Loughborough Intermittent Shuttle Test: A field test that simulates the activity pattern of soccer. J. Sport Sci. 2000, 18, 97–104. [Google Scholar] [CrossRef]
- Eddolls, W.T.; McNarry, M.A.; Stratton, G.; Winn, C.O.; Mackintosh, K.A. High-intensity interval training interventions in children and adolescents: A systematic review. Sports Med. 2017, 47, 2363–2374. [Google Scholar] [CrossRef]
- Shrestha, R.; Copenhaver, M. Long-term effects of childhood risk factors on cardiovascular health during adulthood. Clin. Med. Rev. Vasc. Health 2015, 7, 1. [Google Scholar]
- Eisenmann, J.J.; Laurson, K.R.; Welk, G.J. Aerobic Fitness Percentiles for U.S. Adolescents. Am. J. Prev. Med. 2011, 41, 106–110. [Google Scholar] [CrossRef] [PubMed]


| Overall (n = 39) | Boys (n = 16) | Girls (n = 23) | p Value a | |
|---|---|---|---|---|
| Age (year) | 12.4 ± 0.4 | 12.0 ± 0.3 | 12.3 ± 0.4 | 0.510 |
| Height (cm) | 157.8 ± 7.5 | 157.0 ± 9.9 | 159.3 ± 5.5 | 0.281 |
| Body Mass (kg) | 45.1 ± 7.1 | 43.7 ± 7.9 | 46.3 ± 7.2 | 0.660 |
| Maturity Offset (year) b | −1.4 ± 0.6 | −1.7 ± 0.4 | −1.2 ± 0.6 | 0.359 |
| Waist Circumference (cm) | 65.0 ± 4.8 | 64.6 ± 4.1 | 65.4 ± 5.4 | 0.202 |
| Sum of Skinfolds (mm) | 45.0 ± 14.0 | 41.6 ± 11.3 | 65.4 ± 5.4 | 0.605 |
© 2020 by the authors. Licensee MDPI, Basel, Switzerland. This article is an open access article distributed under the terms and conditions of the Creative Commons Attribution (CC BY) license (http://creativecommons.org/licenses/by/4.0/).
Share and Cite
Dring, K.J.; Cooper, S.B.; Williams, R.A.; Morris, J.G.; Sunderland, C.; Nevill, M.E. Effect of Exercise Duration on Postprandial Glycaemic and Insulinaemic Responses in Adolescents. Nutrients 2020, 12, 754. https://doi.org/10.3390/nu12030754
Dring KJ, Cooper SB, Williams RA, Morris JG, Sunderland C, Nevill ME. Effect of Exercise Duration on Postprandial Glycaemic and Insulinaemic Responses in Adolescents. Nutrients. 2020; 12(3):754. https://doi.org/10.3390/nu12030754
Chicago/Turabian StyleDring, Karah J., Simon B. Cooper, Ryan A. Williams, John G. Morris, Caroline Sunderland, and Mary E. Nevill. 2020. "Effect of Exercise Duration on Postprandial Glycaemic and Insulinaemic Responses in Adolescents" Nutrients 12, no. 3: 754. https://doi.org/10.3390/nu12030754
APA StyleDring, K. J., Cooper, S. B., Williams, R. A., Morris, J. G., Sunderland, C., & Nevill, M. E. (2020). Effect of Exercise Duration on Postprandial Glycaemic and Insulinaemic Responses in Adolescents. Nutrients, 12(3), 754. https://doi.org/10.3390/nu12030754