Vitamin D Deficient Older Adults Are More Prone to Have Metabolic Syndrome, but Not to a Greater Number of Metabolic Syndrome Parameters

 , , ,
, , , 
Abstract
1. Introduction
2. Materials and Methods
2.1. Study Population
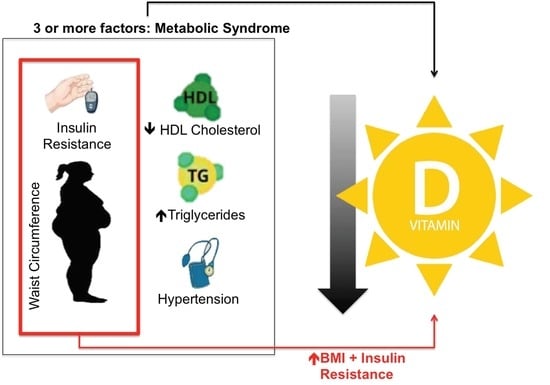
General Obesity, Abdominal Obesity and Metabolic Syndrome
2.2. Biochemical Parameters
2.3. Statistical Analysis
3. Results
4. Discussion
Author Contributions
Funding
Conflicts of Interest
References
- Szymczak-Pajor, I.; Śliwińska, A. Analysis of Association between Vitamin D Deficiency and Insulin Resistance. Nutrients 2019, 11, 794. [Google Scholar] [CrossRef]
- Al-khalidi, B.; Kimball, S.M.; Kuk, J.L.; Ardern, C.I. Metabolically healthy obesity, vitamin D, and all-cause and cardiometabolic mortality risk in NHANES III. Clin. Nutr. 2019, 38, 820–828. [Google Scholar] [CrossRef]
- Pramono, A.; Jocken, J.W.E.; Blaak, E.E. Vitamin D deficiency in the aetiology of obesity-related insulin resistance. Diabetes Metab. Res. Rev. 2019, 35, e3146. [Google Scholar] [CrossRef]
- Arnett, D.K.; Blumenthal, R.S.; Albert, M.A.; Buroker, A.B.; Goldberger, Z.D.; Hahn, E.J.; Himmelfarb, C.D.; Khera, A.; Lloyd-Jones, D.; McEvoy, J.W.; et al. 2019 ACC/AHA Guideline on the Primary Prevention of Cardiovascular Disease. Circulation 2019, 74, e177–e232. [Google Scholar]
- Brøndum-Jacobsen, P.; Benn, M.; Jensen, G.B.; Nordestgaard, B.G. 25-Hydroxyvitamin D Levels and Risk of Ischemic Heart Disease, Myocardial Infarction, and Early Death. Arterioscler. Thromb. Vasc. Biol. 2012, 32, 2794–2802. [Google Scholar] [CrossRef]
- Giovannucci, E. 25-Hydroxyvitamin D and Risk of Myocardial Infarction in Men: A Prospective Study. Arch. Intern. Med. 2008, 168, 1174–1180. [Google Scholar] [CrossRef]
- van Ballegooijen, A.J.; Snijder, M.B.; Visser, M.; van den Hurk, K.; Kamp, O.; Dekker, J.M.; Nijpels, G.; Stehouwer, C.D.A.; Henry, R.M.A.; Paulus, W.J.; et al. Vitamin D in Relation to Myocardial Structure and Function after Eight Years of Follow-Up: The Hoorn Study. Ann. Nutr. Metab. 2012, 60, 69–77. [Google Scholar] [CrossRef]
- Bansal, N.; Zelnick, L.; Robinson-Cohen, C.; Hoofnagle, A.N.; Ix, J.H.; Lima, J.A.; Shoben, A.B.; Peralta, C.A.; Siscovick, D.S.; Kestenbaum, B.; et al. Serum Parathyroid Hormone and 25-Hydroxyvitamin D Concentrations and Risk of Incident Heart Failure: The Multi-Ethnic Study of Atherosclerosis. J. Am. Heart Assoc. 2014, 3, e001278. [Google Scholar] [CrossRef]
- van Ballegooijen, A.J.; Visser, M.; Kestenbaum, B.; Siscovick, D.S.; de Boer, I.H.; Gottdiener, J.S.; DeFilippi, C.R.; Brouwer, I.A. Relation of Vitamin D and Parathyroid Hormone to Cardiac Biomarkers and to Left Ventricular Mass (from the Cardiovascular Health Study). Am. J. Cardiol. 2013, 111, 418–424. [Google Scholar] [CrossRef]
- Nsengiyumva, V.; Fernando, M.E.; Moxon, J.V.; Krishna, S.M.; Pinchbeck, J.; Omer, S.M.; Morris, D.R.; Jones, R.E.; Moran, C.S.; Seto, S.W.; et al. The association of circulating 25-hydroxyvitamin D concentration with peripheral arterial disease: A meta-analysis of observational studies. Atherosclerosis 2015, 243, 645–651. [Google Scholar] [CrossRef]
- Brøndum-Jacobsen, P.; Nordestgaard, B.G.; Schnohr, P.; Benn, M. 25-Hydroxyvitamin D and symptomatic ischemic stroke: An Original Study and Meta-Analysis. Ann. Neurol. 2013, 73, 38–47. [Google Scholar] [CrossRef]
- Sun, Q.; Pan, A.; Hu, F.B.; Manson, J.E.; Rexrode, K.M. 25-Hydroxyvitamin D Levels and the Risk of Stroke. Stroke 2012, 43, 1470–1477. [Google Scholar] [CrossRef]
- Grundy, S.M.; Cleeman, J.I.; Daniels, S.R.; Donato, K.A.; Eckel, R.H.; Franklin, B.A.; Gordon, D.J.; Krauss, R.M.; Savage, P.J.; Smith, S.C.; et al. Diagnosis and Management of the Metabolic Syndrome. Circulation 2005, 112, 2735–2752. [Google Scholar] [CrossRef]
- Matthews, D.R.; Hosker, J.P.; Rudenski, A.S.; Naylor, B.A.; Treacher, D.F.; Turner, R.C. Homeostasis model assessment: Insulin resistance and β-cell function from fasting plasma glucose and insulin concentrations in man. Diabetologia 1985, 28, 412–419. [Google Scholar] [CrossRef]
- Holick, M.F.; Binkley, N.C.; Bischoff-Ferrari, H.A.; Gordon, C.M.; Hanley, D.A.; Heaney, R.P.; Murad, M.H.; Weaver, C.M. Evaluation, Treatment, and Prevention of Vitamin D Deficiency: An Endocrine Society Clinical Practice Guideline. J. Clin. Endocrinol. Metab. 2011, 96, 1911–1930. [Google Scholar] [CrossRef]
- Barbalho, S.M.; Tofano, R.J.; de Campos, A.L.; Rodrigues, A.S.; Quesada, K.; Bechara, M.D.; de Alvares Goulart, R.; Oshiiwa, M. Association between vitamin D status and metabolic syndrome risk factors. Diabetes Metab. Syndr. Clin. Res. Rev. 2018, 12, 501–507. [Google Scholar] [CrossRef]
- Scragg, R.; Camargo, C.A. Frequency of Leisure-Time Physical Activity and Serum 25-Hydroxyvitamin D Levels in the US Population: Results from the Third National Health and Nutrition Examination Survey. Am. J. Epidemiol. 2008, 168, 577–586. [Google Scholar] [CrossRef]
- Brock, K.; Huang, W.-Y.; Fraser, D.R.; Ke, L.; Tseng, M.; Stolzenberg-Solomon, R.; Peters, U.; Ahn, J.; Purdue, M.; Mason, R.S.; et al. Low vitamin D status is associated with physical inactivity, obesity and low vitamin D intake in a large US sample of healthy middle-aged men and women. J. Steroid Biochem. Mol. Biol. 2010, 121, 462–466. [Google Scholar] [CrossRef]
- Wortsman, J.; Matsuoka, L.Y.; Chen, T.C.; Lu, Z.; Holick, M.F. Decreased bioavailability of vitamin D in obesity. Am. J. Clin. Nutr. 2000, 72, 690–693. [Google Scholar] [CrossRef]
- Compston, J.E.; Vedi, S.; Ledger, J.E.; Webb, A.; Gazet, J.C.; Pilkington, T.R. Vitamin D status and bone histomorphometry in gross obesity. Am. J. Clin. Nutr. 1981, 34, 2359–2363. [Google Scholar] [CrossRef]
- Kamycheva, E.; Joakimsen, R.M.; Jorde, R. Intakes of Calcium and Vitamin D Predict Body Mass Index in the Population of Northern Norway. J. Nutr. 2003, 133, 102–106. [Google Scholar] [CrossRef] [PubMed]
- Ju, S.Y.; Jeong, H.S.; Kim, D.H. Blood Vitamin D Status and Metabolic Syndrome in the General Adult Population: A Dose-Response Meta-Analysis. J. Clin. Endocrinol. Metab. 2014, 99, 1053–1063. [Google Scholar] [CrossRef] [PubMed]
- Pradhan, A.D. Sex Differences in the Metabolic Syndrome: Implications for Cardiovascular Health in Women. Clin. Chem. 2014, 60, 44–52. [Google Scholar] [CrossRef] [PubMed]
- Pucci, G.; Alcidi, R.; Tap, L.; Battista, F.; Mattace-Raso, F.; Schillaci, G. Sex- and gender-related prevalence, cardiovascular risk and therapeutic approach in metabolic syndrome: A review of the literature. Pharmacol. Res. 2017, 120, 34–42. [Google Scholar] [CrossRef] [PubMed]
- Gerdts, E.; Regitz-Zagrosek, V. Sex differences in cardiometabolic disorders. Nat Med. 2019, 25, 1657–1666. [Google Scholar] [CrossRef] [PubMed]
- Faulkner, J.L.; Belin de Chantemèle, E.J. Sex hormones, aging and cardiometabolic syndrome. Biol Sex Differ. 2019, 10, 30. [Google Scholar] [CrossRef] [PubMed]

| Variable | 25(OH)D ≥ 50 nmol/L (n = 181) | 25(OH)D < 50 nmol/L (n = 84) | p |
|---|---|---|---|
| Age, years | 68.00 [64.00, 74.00] | 68.00 [64.00, 75.00] | 0.8 |
| Female sex | 98 (54.1) | 58 (69.0) | 0.03 |
| Current cigarette smoking | 111 (61.3) | 43 (51.2) | 0.1 |
| Anthropometric assessments | |||
| Weight, kg | 66.00 [58.00, 75.00] | 73.00 [64.00, 82.00] | 0.001 |
| Height, m | 1.56 (0.09) | 1.56 (0.08) | 0.7 |
| BMI, kg/m2 | 27.41 [23.53, 30.86] | 30.01 [26.31, 33.63] | <0.001 |
| Waist circumference, cm | 93.50 [83.00, 103.00] | 100.00 [91.38, 107.62] | <0.001 |
| Laboratory results | |||
| Hemoglobin A1C, % | 5.80 [5.40, 6.40] | 5.80 [5.57, 6.73] | 0.1 |
| Total cholesterol, mg/dL | 194.07 (43.67) | 197.32 (37.05) | 0.7 |
| HDL-C, mg/dL | 47.00 [40.00, 55.00] | 45.50 [40.00, 52.25] | 0.3 |
| LDL-C, mg/dL | 118.48 (34.31) | 117.57 (33.73) | 0.6 |
| Triglycerides, mg/dL | 125.00 [89.00, 172.00] | 141.50 [99.75, 184.75] | 0.02 |
| HOMA-IR | 1.16 [0.62, 2.25] | 1.80 [1.12, 3.33] | <0.001 |
| 25(OH)D, nmol/L | 62.50 [55.00, 77.50] | 40.00 [32.50, 45.00] | <0.001 |
| IL-10, pg/mL | 0.60 [0.30, 1.70] | 0.71 [0.40, 1.83] | 0.2 |
| IL-1α, pg/mL | 1.40 [0.50, 7.70] | 2.00 [0.50, 8.85] | 0.2 |
| IL-1β, pg/mL | 1.30 [0.80, 3.10] | 1.07 [0.69, 2.82] | 0.2 |
| IL-6, pg/mL | 2.10 [1.40, 3.00] | 1.80 [1.20, 3.71] | 0.3 |
| TNF-α, pg/mL | 1.70 [0.78, 4.09] | 2.25 [1.28, 4.49] | 0.03 |
| TNF-β, pg/mL | 0.50 [0.20, 1.00] | 0.50 [0.20, 1.41] | 0.9 |
| Metabolic Syndrome parameters | |||
| Any three of the five criteria below | 66 (36.5) | 51 (60.7) | < 0.001 |
| Hypertension a | 115 (63.5) | 67 (79.8) | 0.01 |
| Abdominal obesity b | 89 (49.2) | 60 (71.4) | 0.001 |
| Hyperglycemia c | 49 (27.1) | 31 (36.9) | 0.1 |
| Dyslipidemia d | 59 (32.6) | 37 (44.0) | 0.09 |
| Dyslipidemia e | 72 (39.8) | 46 (54.8) | 0.03 |
| Variable | Metabolic Syndrome | No Metabolic Syndrome | ||||
|---|---|---|---|---|---|---|
| 25(OH)D ≥ 50 nmol/L (n = 66) | 25(OH)D < 50 nmol/L (n = 51) | p | 25(OH)D ≥ 50 nmol/L (n = 115) | 25(OH)D < 50 nmol/L (n = 33) | p | |
| Age, years | 68.00 [65.00, 72.00] | 68.00 [64.00, 73.50] | 0.7 | 68.00 [63.50, 76.00] | 70.00 [63.00, 75.00] | 0.8 |
| Female sex | 43 (65.2) | 39 (76.5) | 0.2 | 55 (47.8) | 19 (57.6) | 0.4 |
| Current cigarette smoking | 37 (56.1) | 24 (47.1) | 0.4 | 74 (64.3) | 19 (57.6) | 0.6 |
| Anthropometric assessments | ||||||
| Weight, kg | 73.50 [66.25, 85.00] | 77.00 [65.50, 85.00] | 0.6 | 60.00 [54.00, 70.00] | 66.00 [61.00, 75.00] | 0.02 |
| Height, m | 1.56 (0.10) | 1.56 (0.08) | 0.9 | 1.57 (0.09) | 1.57 (0.09) | 0.9 |
| BMI, kg/m2 | 30.68 [28.01, 33.26] | 31.35 [28.61, 34.76] | 0.3 | 24.88 [21.78, 28.23] | 27.01 [24.17, 30.02] | 0.03 |
| Waist, cm | 102.00 [95.00, 107.00] | 104.00 [98.50, 109.00] | 0.3 | 87.00 [78.00, 95.50] | 94.50 [86.00, 102.00] | 0.02 |
| Laboratory results | ||||||
| Hemoglobin A1C, % | 6.40 [5.62, 6.80] | 6.20 [5.65, 7.30] | 0.8 | 5.60 [5.20, 6.20] | 5.70 [5.30, 6.20] | 0.4 |
| Total cholesterol, mg/dL | 197.70 (50.81) | 195.86 (30.74) | 1.0 | 191.99 (39.09) | 199.58 (45.56) | 0.7 |
| HDL-C, mg/dL | 45.00 [38.00, 49.00] | 43.00 [38.00, 47.50] | 0.8 | 50.00 [43.00, 58.00] | 51.00 [45.00, 56.00] | 0.7 |
| LDL-C, mg/dL | 118.61 (41.16) | 112.55 (28.46) | 0.6 | 118.40 (29.88) | 125.33 (39.78) | 0.7 |
| Triglycerides, mg/dL | 174.00 [141.00, 208.75] | 166.00 [136.50, 240.50] | 0.7 | 109.00 [83.00, 132.00] | 102.00 [89.00, 134.00] | 0.9 |
| HOMA-IR | 2.26 [1.33, 3.93] | 2.41 [1.69, 4.34] | 0.2 | 0.81 [0.54, 1.38] | 1.07 [0.81, 1.35] | 0.06 |
| IL-10, pg/mL | 0.45 [0.30, 1.46] | 0.75 [0.35, 1.94] | 0.09 | 0.72 [0.35, 1.73] | 0.70 [0.40, 1.38] | 0.7 |
| IL-1α, pg/mL | 0.85 [0.40, 2.75] | 2.00 [0.55, 7.55] | 0.06 | 1.70 [0.50, 9.85] | 2.00 [0.50, 9.90] | 0.7 |
| IL-1β, pg/mL | 1.20 [0.70, 2.62] | 1.00 [0.80, 2.67] | 0.7 | 1.60 [0.80, 3.95] | 1.08 [0.60, 2.90] | 0.1 |
| IL-6, pg/mL | 2.15 [1.52, 2.70] | 1.80 [1.38, 3.87] | 0.8 | 2.10 [1.30, 3.30] | 1.68 [0.87, 2.80] | 0.1 |
| TNF-α, pg/mL | 1.50 [0.69, 3.74] | 2.27 [1.25, 4.21] | 0.07 | 1.70 [0.80, 4.33] | 2.09 [1.40, 4.71] | 0.1 |
| TNF-β, pg/mL | 0.50 [0.20, 0.88] | 0.90 [0.20, 1.58] | 0.3 | 0.50 [0.24, 1.15] | 0.34 [0.12, 1.00] | 0.2 |
| Dependent Variable | R2 | Adjusted R2 | p | |
|---|---|---|---|---|
| HOMA-IR | 0.25 | 0.23 | <0.001 | |
| Independent variables | β Coefficient | Standard error | 95% CI | p |
| Female sex | +0.46 | 0.27 | −0.08–0.99 | 0.09 |
| Weight, kg | +0.03 | 0.01 | 0.01–0.05 | 0.01 |
| Waist, cm | +0.03 | 0.01 | 0.01–0.05 | 0.01 |
| Triglycerides, mg/dL | +0.01 | 0.00 | 0.00–0.01 | <0.001 |
| 25(OH)D, nmol/L | −0.02 | 0.01 | −0.03–0.00 | 0.03 |
| Variable | Crude Analysis | Adjusted Analysis | ||
|---|---|---|---|---|
| PR (95% CI) | p | aPR (95% CI) | p | |
| Sex | ||||
| Male | Reference | - | Reference | - |
| Female | 1.41 (1.20–1.67) | <0.001 | 1.37 (1.13–1.65) | 0.001 |
| Hypertension 1 | 2.16 (1.76–2.67) | <0.001 | 1.75 (1.41–2.19) | <0.001 |
| BMI, kg/m2 | 1.04 (1.03–1.06) | <0.001 | 1.00 (0.98–1.02) | 0.7 |
| Waist, cm | 1.02 (1.02–1.03) | <0.001 | 1.01 (1.00–1.02) | 0.007 |
| Hemoglobin A1C, % | 1.08 (1.04–1.11) | <0.001 | 1.04 (1.00–1.08) | 0.04 |
| Total cholesterol, mg/dL | 1.00 (1.00–1.00) | 0.1 | 1.00 (1.00–1.00) | 0.8 |
| HDL-C, mg/dL | 0.98 (0.98–0.99) | <0.001 | 0.99 (0.98–0.99) | <0.001 |
| LDL-C, mg/dL | 1.00 (1.00–1.00) | 0.9 | ||
| Triglycerides, mg/dL | 1.00 (1.00–1.00) | <0.001 | 1.00 (1.00–1.00) | <0.001 |
| HOMA-IR | 1.09 (1.07–1.12) | <0.001 | 1.01 (0.98–1.05) | 0.4 |
| 25(OH)D, nmol/L | 0.99 (0.99–1.00) | <0.001 | 1.00 (1.00–1.01) | 0.8 |
| IL-10, pg/mL | 0.99 (0.96–1.02) | 0.6 | ||
| IL-1α, pg/mL | 1.00 (1.00–1.01) | 0.4 | ||
| IL-1β, pg/mL | 0.99 (0.97–1.01) | 0.4 | ||
| IL-6, pg/mL | 1.00 (0.97–1.03) | 0.8 | ||
| TNF-α, pg/mL | 1.00 (0.99–1.01) | 0.8 | ||
| TNF-β, pg/mL | 1.00 (0.99–1.01) | 0.9 | ||
© 2020 by the authors. Licensee MDPI, Basel, Switzerland. This article is an open access article distributed under the terms and conditions of the Creative Commons Attribution (CC BY) license (http://creativecommons.org/licenses/by/4.0/).
Share and Cite
Pott-Junior, H.; Nascimento, C.M.C.; Costa-Guarisco, L.P.; Gomes, G.A.d.O.; Gramani-Say, K.; Orlandi, F.d.S.; Gratão, A.C.M.; Orlandi, A.A.d.S.; Pavarini, S.C.I.; Vasilceac, F.A.; et al. Vitamin D Deficient Older Adults Are More Prone to Have Metabolic Syndrome, but Not to a Greater Number of Metabolic Syndrome Parameters. Nutrients 2020, 12, 748. https://doi.org/10.3390/nu12030748
Pott-Junior H, Nascimento CMC, Costa-Guarisco LP, Gomes GAdO, Gramani-Say K, Orlandi FdS, Gratão ACM, Orlandi AAdS, Pavarini SCI, Vasilceac FA, et al. Vitamin D Deficient Older Adults Are More Prone to Have Metabolic Syndrome, but Not to a Greater Number of Metabolic Syndrome Parameters. Nutrients. 2020; 12(3):748. https://doi.org/10.3390/nu12030748
Chicago/Turabian StylePott-Junior, Henrique, Carla Manuela Crispim Nascimento, Letícia Pimenta Costa-Guarisco, Grace Angelica de Oliveira Gomes, Karina Gramani-Say, Fabiana de Souza Orlandi, Aline Cristina Martins Gratão, Ariene Angelini dos Santos Orlandi, Sofia Cristina Iost Pavarini, Fernando Augusto Vasilceac, and et al. 2020. "Vitamin D Deficient Older Adults Are More Prone to Have Metabolic Syndrome, but Not to a Greater Number of Metabolic Syndrome Parameters" Nutrients 12, no. 3: 748. https://doi.org/10.3390/nu12030748
APA StylePott-Junior, H., Nascimento, C. M. C., Costa-Guarisco, L. P., Gomes, G. A. d. O., Gramani-Say, K., Orlandi, F. d. S., Gratão, A. C. M., Orlandi, A. A. d. S., Pavarini, S. C. I., Vasilceac, F. A., Zazzetta, M. S., & Cominetti, M. R. (2020). Vitamin D Deficient Older Adults Are More Prone to Have Metabolic Syndrome, but Not to a Greater Number of Metabolic Syndrome Parameters. Nutrients, 12(3), 748. https://doi.org/10.3390/nu12030748