Article

Glycolate is a Novel Marker of Vitamin B2 Deficiency Involved in Gut Microbe Metabolism in Mice

1
Department of Preventive Environment and Nutrition, Institute of Biomedical Sciences, Tokushima University Graduate School, 3-18-15, Kuramoto, Tokushima 770-8503, Japan
2
Department of Nutrition, Faculty of Health Science, Hyogo University, 2301, Hiraokacho, Shinzaike, Kakogawa 675-0195, Japan
*
Author to whom correspondence should be addressed.
Authors contributed equally this work and the author order is interchangeable.
Nutrients 2020, 12(3), 736; https://doi.org/10.3390/nu12030736
Submission received: 12 February 2020 / Revised: 7 March 2020 / Accepted: 8 March 2020 / Published: 11 March 2020
(This article belongs to the Section Nutrition and Metabolism)

Abstract

:
Microbes in the human gut play a role in the production of bioactive compounds, including some vitamins. Although several studies attempted to identify definitive markers for certain vitamin deficiencies, the role of gut microbiota in these deficiencies is unclear. To investigate the role of gut microbiota in deficiencies of four vitamins, B2, B6, folate, and B12, we conducted a comprehensive analysis of metabolites in mice treated and untreated with antibiotics. We identified glycolate (GA) as a novel marker of vitamin B2 (VB2) deficiency, and show that gut microbiota sense dietary VB2 deficiency and accumulate GA in response. The plasma GA concentration responded to reduced VB2 supply from both the gut microbiota and the diet. These results suggest that GA is a novel marker that can be used to assess whether or not the net supply of VB2 from dietary sources and gut microbiota is sufficient. We also found that gut microbiota can provide short-term compensation for host VB2 deficiency when dietary VB2 is withheld.

Graphical Abstract

1. Introduction

Recent studies have highlighted the presence of trillions of microbes in the human gut and their role in host health and disease [1,2,3,4]. Dietary nutrients and other environmental factors are key components that regulate gut microbe populations, and these bacteria produce several metabolites that are fundamental for biological processes in the host, including absorption, metabolism, and storage of ingested nutrients [5,6,7,8]. Studies in both mice and humans have shown the effects that gut microbiota have on host metabolism. For example, fermentation of polysaccharides by gut microbiota produces a range of short-chain fatty acids (SCFAs), including acetate, butyrate, and propionate [6]. SCFAs are substrates for energy production (lipogenesis and gluconeogenesis) and also affect various cellular processes (e.g., proliferation, differentiation, and modulation of gene expression) [9]. Gut bacteria in the ileum modulate the transformation of primary and conjugated bile acids into secondary bile acids [6]. Primary bile acids are important for absorption of dietary fat and fat-soluble vitamins from entero-hepatic circulation. Bile acids also function as signaling molecules and regulate cellular processes, such as those mediated by the farnesoid X receptor (FXR) and the G-protein coupled receptor TGR5 [10,11,12].
Gut microbes have long been known to contribute to supplies of bioactive compounds, particularly vitamins [13,14]. Administration of folate-producing Bifidobacteria enhances folate status in rats and humans [15,16]. In mice, deficiencies in biotin, also known as vitamin B7, induce alopecia that can be exacerbated by overgrowth of the biotin-consuming bacteria Lactobacillus murinus [17]. Other B vitamins, such as vitamin B6 and B12, could regulate bacterial toxicity by interacting with host and gut commensal bacteria, as well as with enteropathogenic bacteria [18,19]. Thus, gut microbiota both produce and use vitamins to provide functional metabolites for the host and other bacteria.
Vitamins are critical nutrients that support metabolic processes needed to sustain homeostasis in mammals. In particular, one-carbon (1C) metabolism supports multiple physiological processes, wherein 1C is transferred through processes associated with folate and methionine metabolism [20,21]. These processes include purine and thymidylate biosynthesis, amino acid metabolism, epigenetic maintenance, and redox responses. Intracellular folate and methionine metabolism are crucial components of these metabolic pathways. Vitamin B2 (riboflavin), B6 (pyridoxine, pyridoxal, and pyridoxamine), and B12 act as cofactors of 1C metabolism to sustain the folate cycle coupled with the methionine cycle (Supplementary Figure S1).
Although several attempts have been made to reveal definitive markers of vitamin deficiency, the role of gut microbiota in these deficiencies is unclear. Several methods that combine separation methods with mass spectrometry (MS) were recently developed that allow comprehensive analysis of metabolites, called the metabolome. In the present study, we used MS methods to examine the role of gut microbiota in mice fed a diet deficient in B2, B6, folate, and B12 by evaluating gut luminal content, as well as performing analyses of tissues and the plasma metabolome. We found that GA is a novel marker of VB2 deficiency, and that the gut microbiota can also sense VB2 deficiency. This novel marker responds to reductions in VB2 supply from both the gut microbiota and the diet. Moreover, these results suggest that GA could be valuable to assess the net supply of VB2 from the gut microbiota and the diet.

2. Materials and Methods

2.1. Animals

Nine-week-old female C57Bl/6J mice were purchased from a local breeding colony (Charles River Japan, Yokohama, Japan) and acclimatized for 1 week prior to use in Experiments 1–7. Mice were housed in cages maintained at a constant temperature (23 °C ± 2 °C) and humidity (65%–75%) with a 12 h light–dark cycle (8:00 a.m. to 20:00 p.m.). For urine collection, mice were placed in metabolic cages for 14 h (18:00 p.m. to 8:00 a.m.). AIN93G was used as the control diet (Oriental Yeast, Osaka Japan). A vitamin B-deficient (VB-) diet, lacking vitamin B2, B6, B12, and folic acid (B9); a vitamin B2 (VB2)-deficient (VB2-) diet; and a vitamin B6 (VB6)-deficient (VB6-) diet were also used. For VB6 or VB2 supplementation, 6 μg/mL pyridoxine hydrochloride (Tokyo Kasei, Tokyo, Japan) or flavin mononucleotide sodium salt (Wako, Osaka, Japan) in distilled water was used to adjust the dietary intake of these nutrients in AIN93G-fed mice. To disrupt the gut microbiota, a mixture of four antibiotics (Ab): penicillin V (Tokyo Kasei), ampicillin (Sigma, St. Louis MO, USA), metronidazole (Tokyo Kasei), each at 150 mg/mouse/day; and vancomycin (WAKO) at 75 mg/mouse/day were administered. Animals were allowed food and water ad libitum throughout the experimental period. At the end of the experimental period, all mice were euthanized at noon for collection of blood, cecum, luminal content, feces, and liver tissue. The University of Tokushima Animal Use Committee approved the study (T14010 and T28-84), and mice were maintained according to the National Institutes of Health guidelines for care and use of laboratory animals.

2.2. Vitamin Measurement

Plasma, blood, and urine VB6 and/or VB2 levels were measured using VitaFast Vitamin B6 and B2 kits (Azmax, Chiba, Japan) according to the manufacturer’s instructions.

2.3. Glycolate Oxidase Activity Assay

Hepatic glycolate oxidase (GO) activity was measured as reported [22,23]. Briefly, hepatic proteins were extracted in 10 volumes of assay buffer (My Bioscience M1358243218). Protein sample solutions were homogenized, sonicated, and centrifuged for 15 min at 12,000× g and 4 °C. Protein concentrations of the supernatants were measured by the bicinchoninic acid method (Thermo Fisher Scientific, Bremen, Germany) and used as samples. GO converts GA to glyoxylate with concomitant H2O2 production that promotes oxidation of o-Dianisidine (Tokyo Kasei) by horse radish peroxidase (Tokyo Kasei). The absorbance at 415 nm was measured by spectrophotometry and the relative activity was calculated with respect to the amount of protein in the sample.

2.4. Metabolome Analysis by Capillary Electrophoresis Electrospray Ionization Time-of-Flight Mass Spectrometry

All samples were prepared according to methods described by Human Metabolome Technologies, Inc. (HMT) (HMT, Tsuruoka, Japan) and in previous reports [24,25,26]. Briefly, the cecum luminal content, stool, cecum, liver, urine, and plasma were immediately frozen in liquid nitrogen and stored at −80 °C until metabolite extraction. Samples were weighed and completely homogenized in ice-cold methanol containing internal standards. All samples were analyzed by capillary electrophoresis electrospray ionization time-of-flight mass spectrometry (CE-TOFMS) on an Agilent CE system combined with a TOFMS (Agilent Technologies, Palo Alto, CA, USA), as reported previously [27,28]. Each metabolite was identified and quantified based on the peak information, including m/z, migration time, and peak area.

2.5. Statistical Analyses

All values are expressed as mean ± S.E. The significance of differences between two groups was assessed using an unpaired two-tailed t test. Analysis of variance (ANOVA) or the Kruskal–Wallis test was used to make comparisons between more than two groups. When a significant difference was found by the ANOVA or Kruskal–Wallis test, post hoc analyses were performed using the Tukey–Kramer protected least significant difference test. Two-way ANOVA was used to determine the effect of two factors and their interaction. Repeated measures ANOVA was used to estimate time-dependent effects. Spearman’s rank correlation coefficient was used to calculate correlation coefficients between selected variables. Differences were considered significant at p < 0.05. Statistical analyses were performed using Mass profiler Professional (MPP) and Excel-Toukei 2006 (SSRI).

3. Results

To address how the vitamin B2, B6, folic acid (B9), and B12-deficient diet (VB-) alters the plasma metabolome in mice, we conducted a CE-TOFMS analysis to examine specific changes after feeding for 2 and 4 weeks (Figure 1A). We identified 77 metabolites in plasma from a metabolite list provided by HMT. A volcano plot indicated that levels of glycolate (Glycolic acid: GA) were increased in both the 2- and 4-week VB- feeding group (Figure 1B,C), and the relative concentration of the other 76 metabolites did not differ among each group (Supplementary Figure S2). The increase in the GA concentration in plasma was larger for the 4-week feeding group (VB-4w) than the 2-week feeding group (VB-2w, Figure 1D). The luminal content and cecum from the 2- and 4-week VB- diet groups both had higher GA concentrations than the respective control groups (Figure 1E,F). Accumulation of GA in the luminal content and cecum suggests that gut microbiota may contribute to GA metabolism.
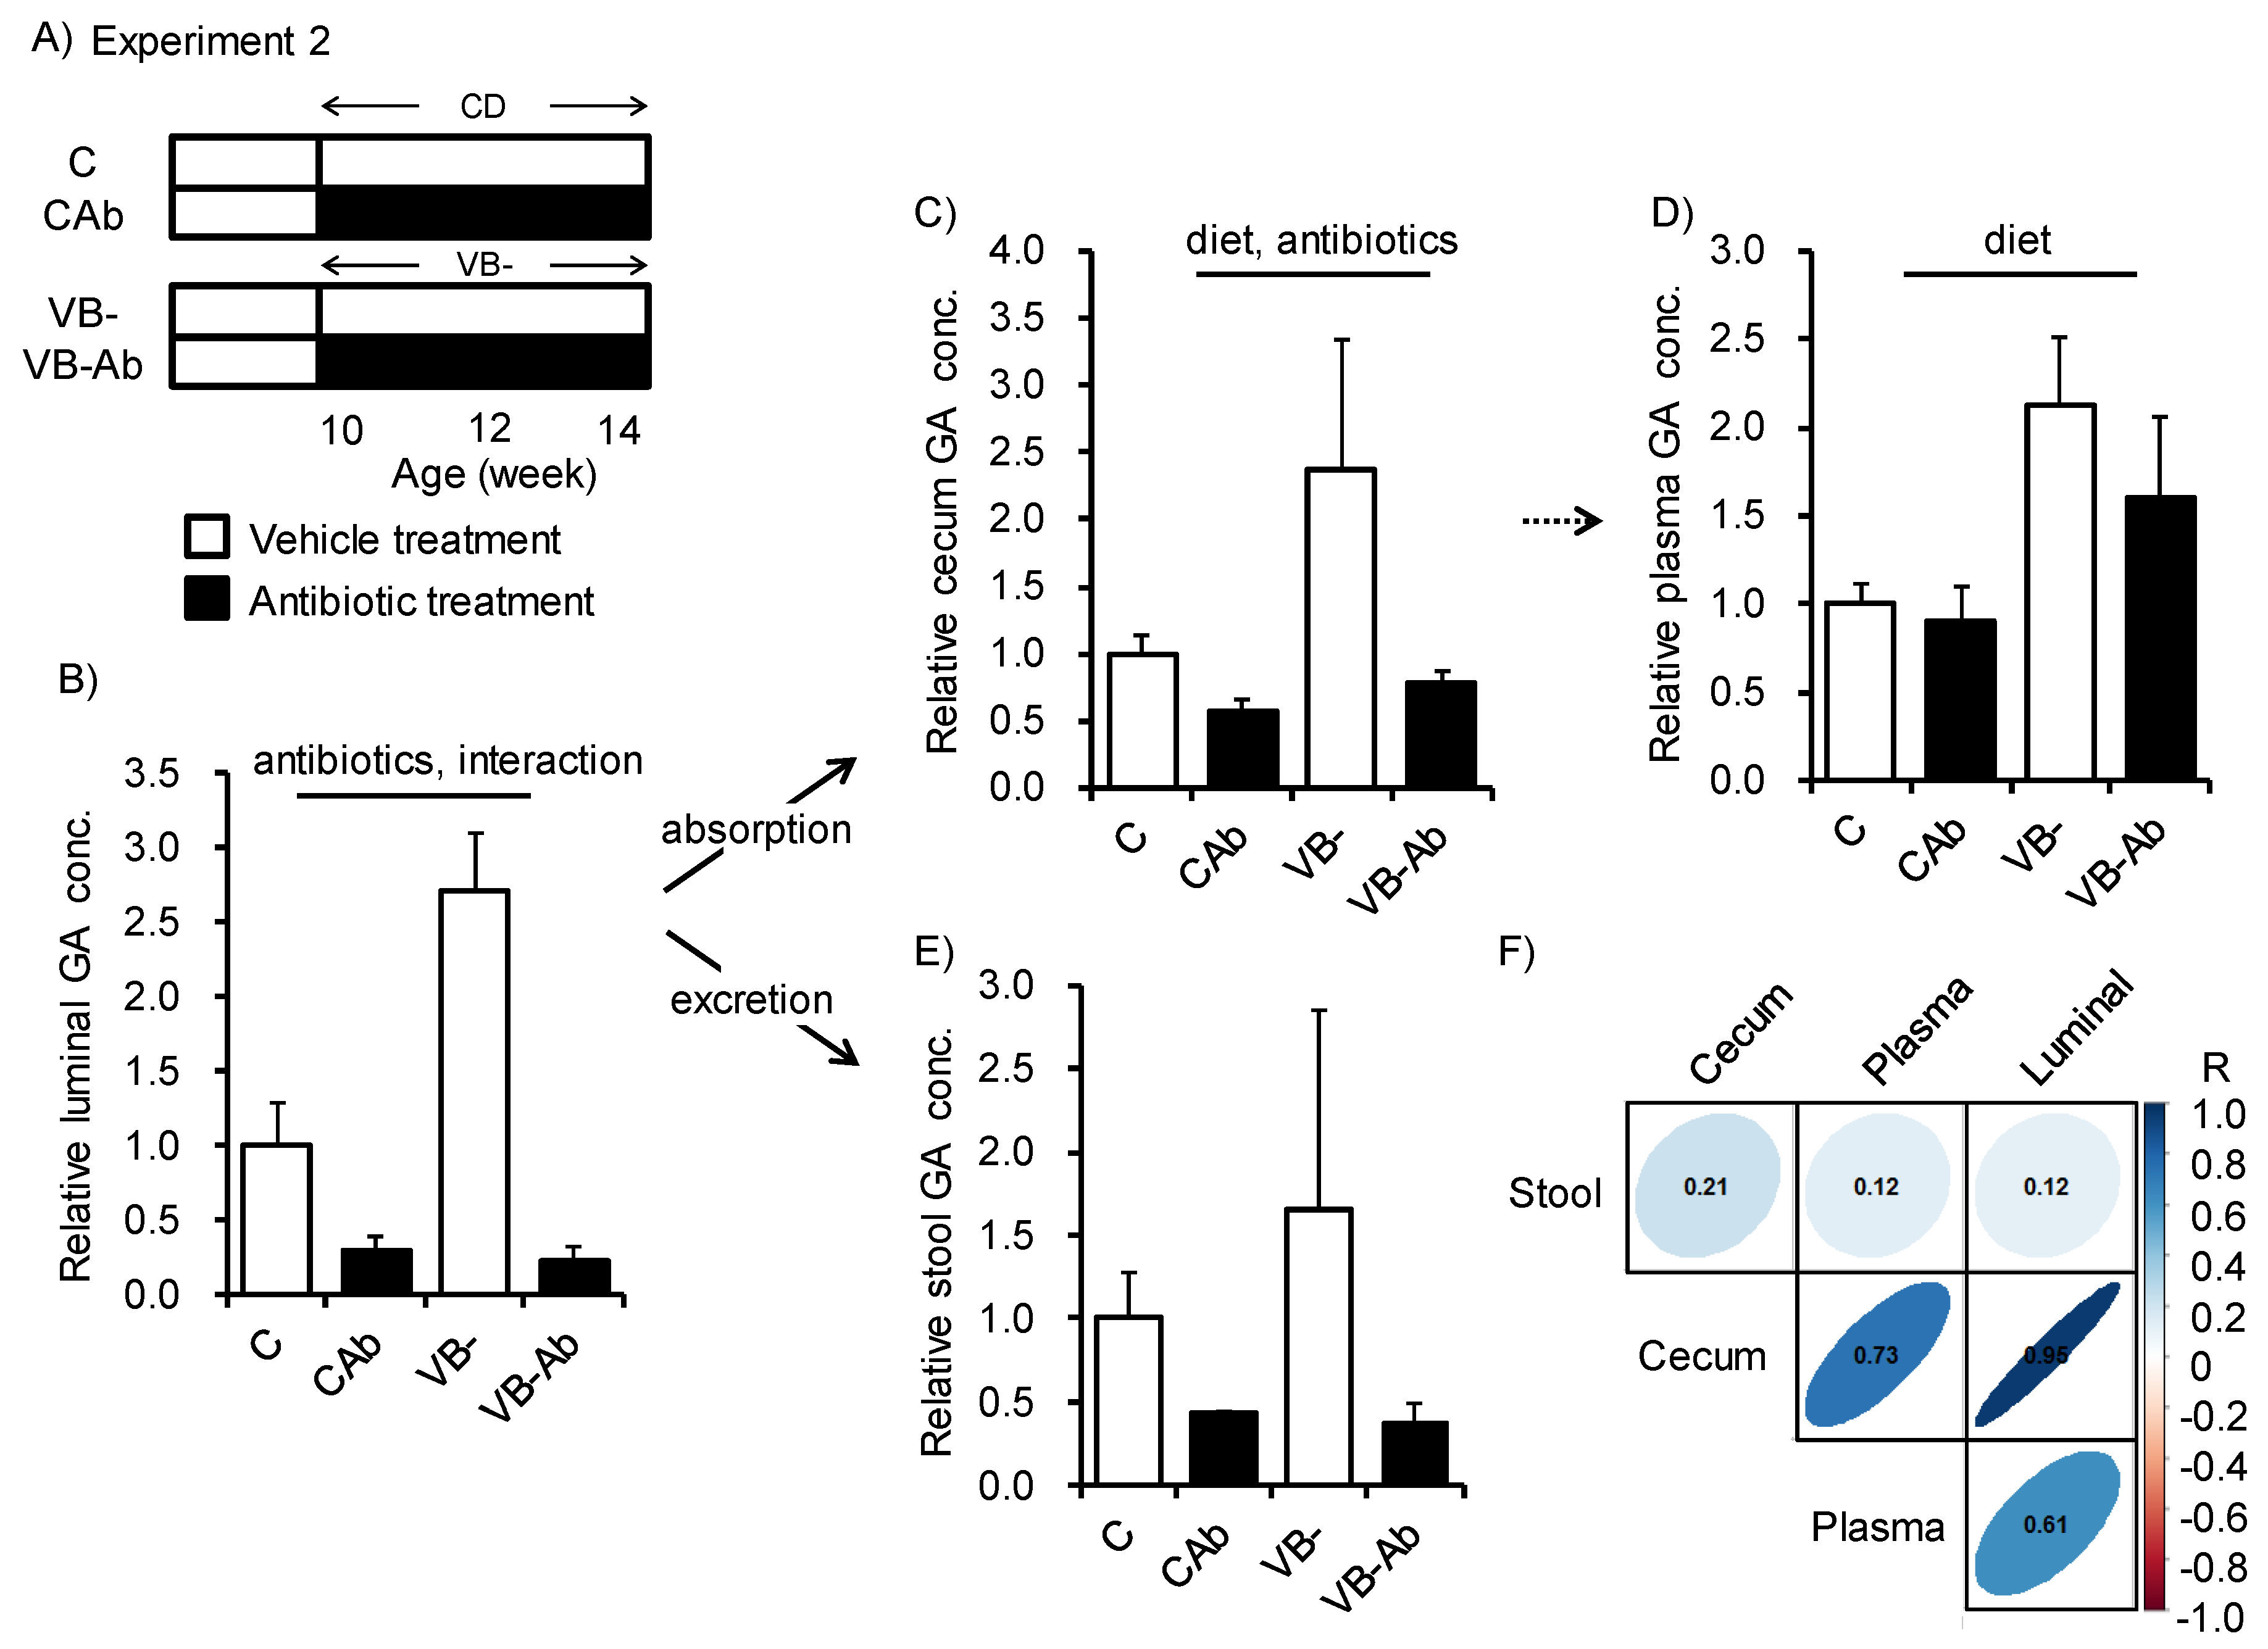
To investigate how the gut microbiota is involved in changes in GA metabolism upon VB- feeding, the gut microbiota was disrupted by delivery of antibiotic (Ab) mixtures for 4 weeks together with VB- diet feeding (Figure 2A). The total numbers of bacteria in feces from the Ab-treated group were significantly reduced (Supplemental Figure S3). Ab-treated mice also exhibited reduced luminal and cecum GA concentrations (Figure 2B,C), whereas the plasma GA concentration was affected only by vitamin B deficiency and not by the antibiotic treatment (Figure 2D). The GA concentration in the stool varied among individuals in the groups (Figure 2E). The correlation coefficients between luminal GA concentration and that of the cecum, plasma, and stool were 0.95, 0.61, and 0.12, respectively (Figure 2F). These results indicated that luminal GA was strongly affected by vitamin B deficiency in intestinal tissues, including the cecum, but was not sufficient to alter plasma GA levels. Moreover, both the gut microbiome and host exhibited similar metabolic changes in response to vitamin B2, B6, B12, and folic acid deficiency.
Next, we examined what type of vitamin B deficiency enhanced GA accumulation. Ogawa et al. reported that rats fed the VB6-deficient diet showed increased plasma GA concentrations [29]. VB6 is a cofactor of alanine-glyoxylate aminotransferase1 (AGT1) that catalyzes the transformation of glyoxylate into glycine [30]. When AGT1 is impaired, GA and oxalate are produced as compensatory products by glycolate oxidase (GO) and lactate dehydrogenase, respectively. Here, we used VB6 supplementation to complement VB6 deficiency caused by the VB- diet (Figure 3A). We also used a diet deficient in VB6 alone (VB6-) to investigate the direct effects of VB6 deficiency. Mice fed the VB- diet or VB6- diet for two weeks displayed significant reductions in VB6 intake and plasma VB6 concentration. These decreases were recovered following VB6 supplementation (Figure 3B,C). However, the plasma and luminal GA concentration were not changed by the VB6- diet or by VB6 supplementation (Figure 3D,E). Indeed, the plasma GA concentration did not correlate with the plasma VB6 concentration (R2 = 0.1035, p > 0.1, Figure 3F). These results indicate that VB6 deficiency does not have a central role in the GA increase seen in mice.
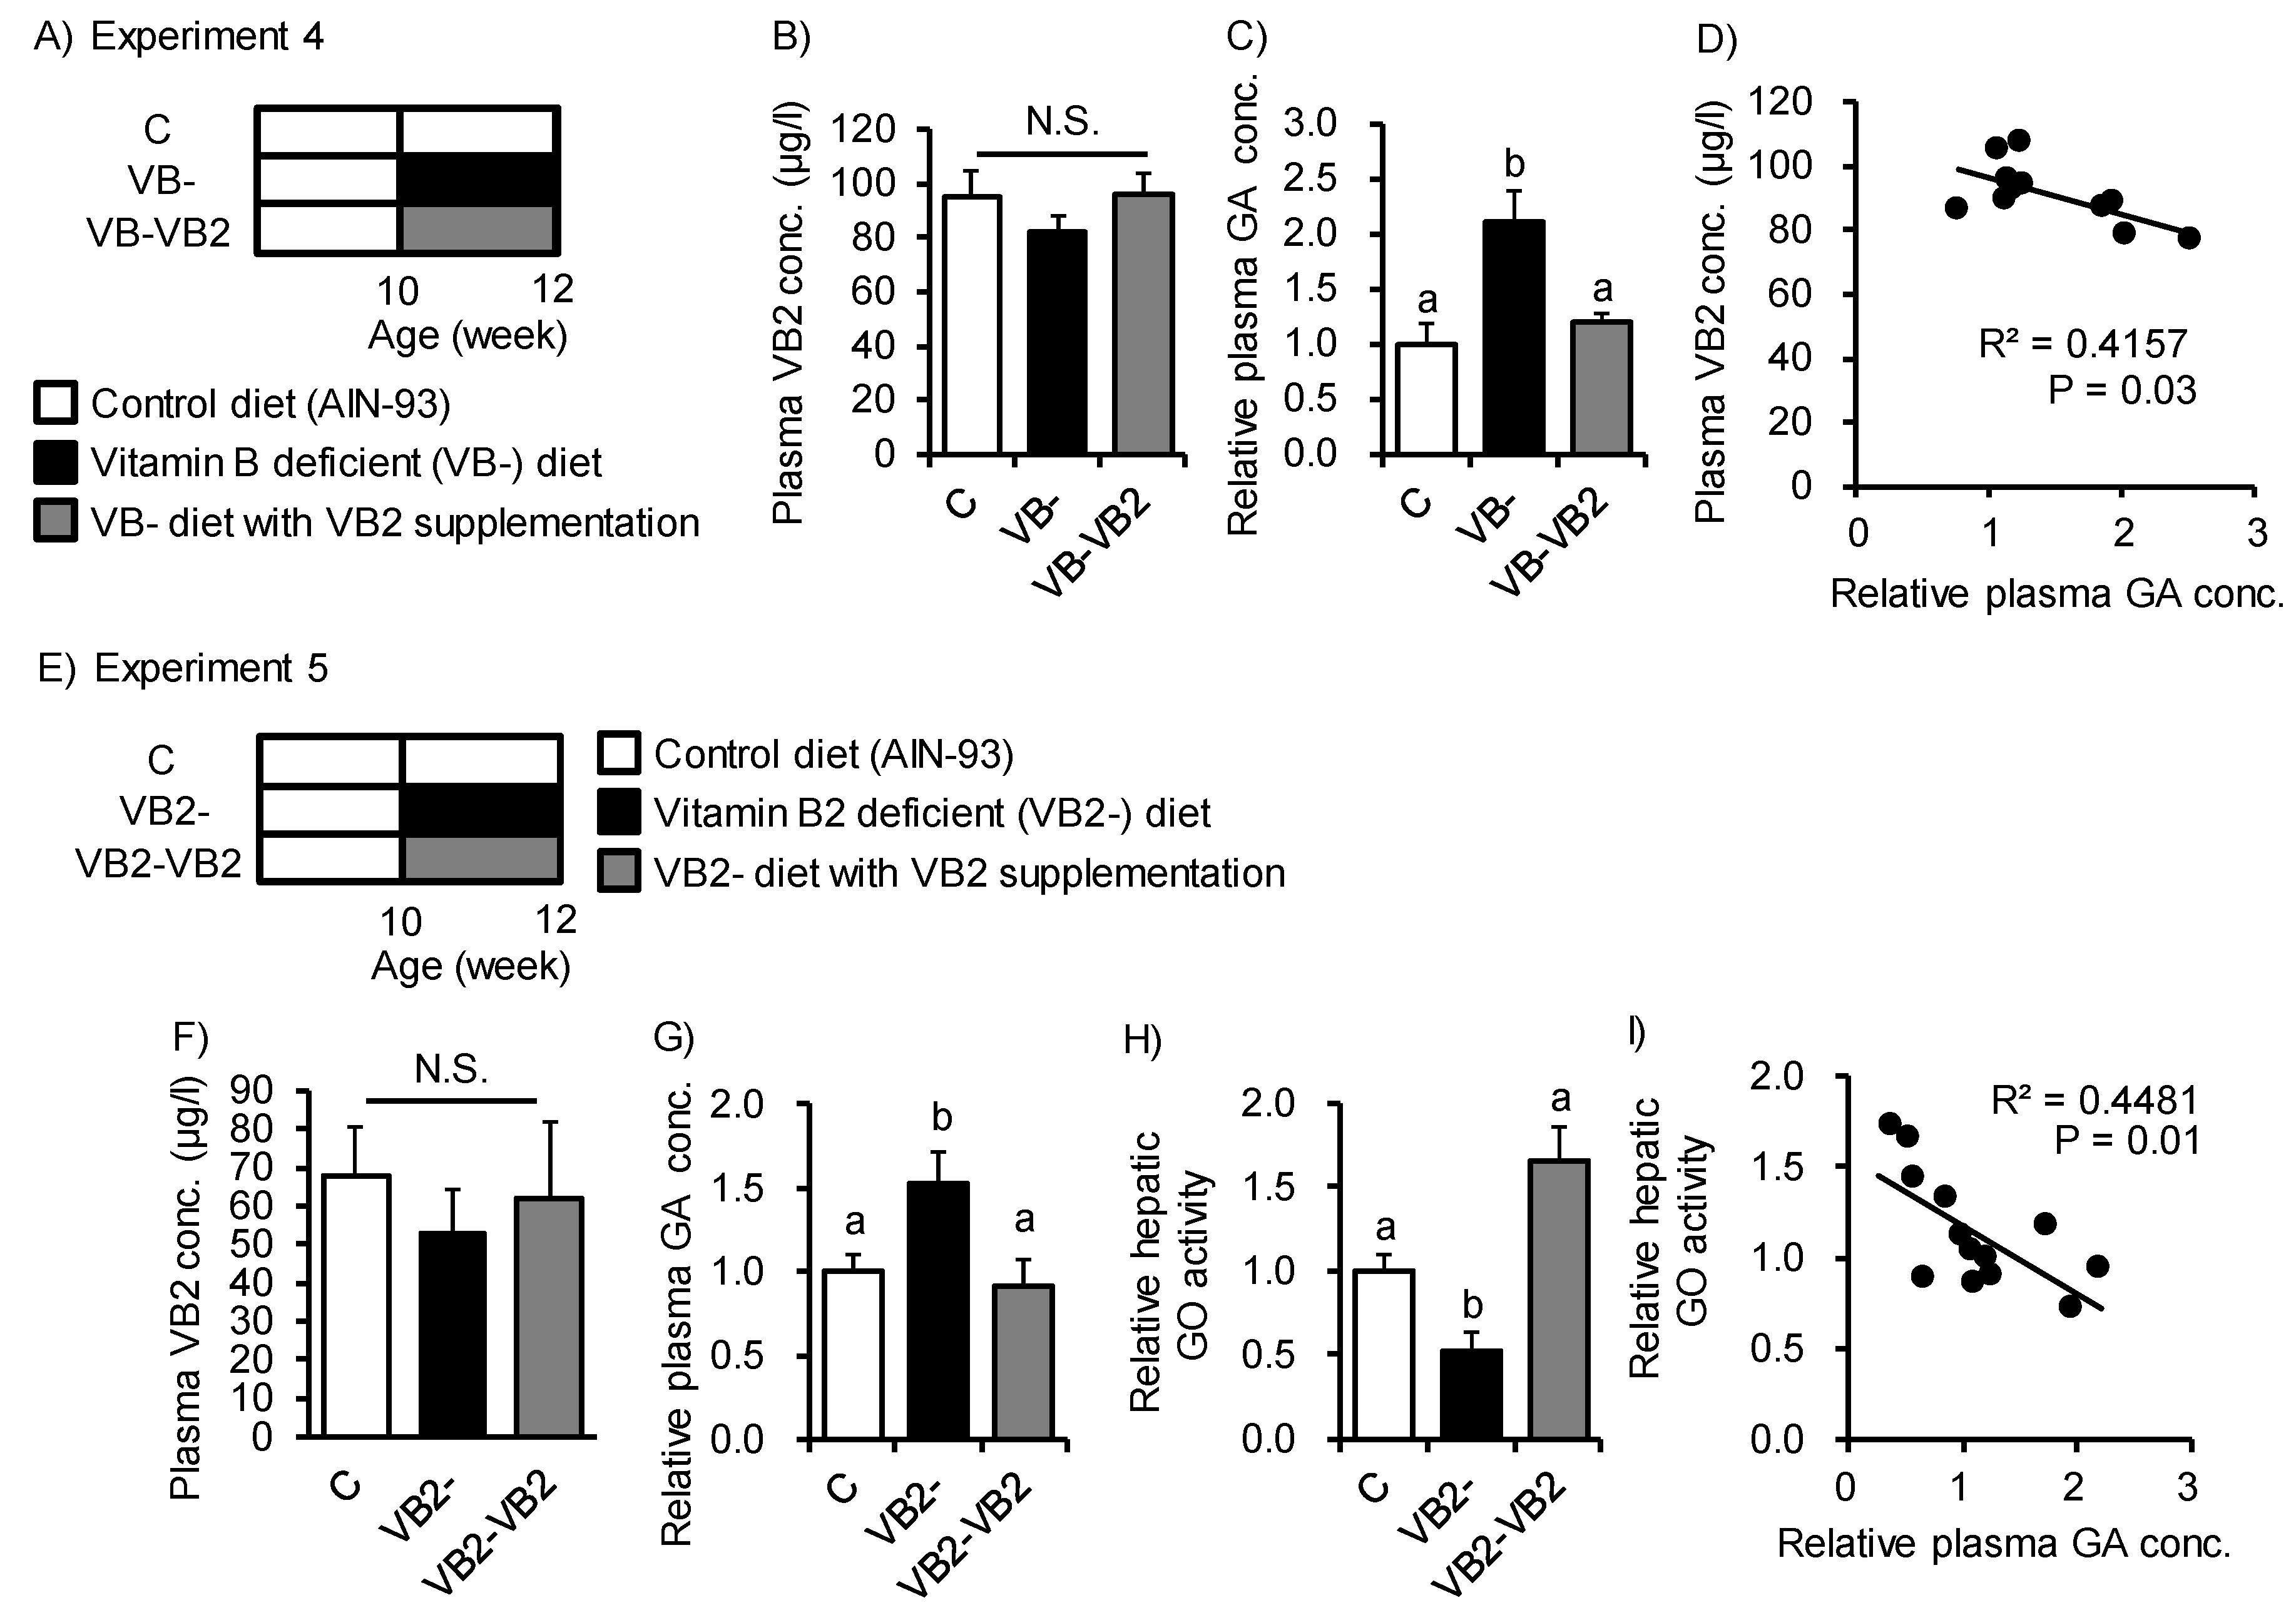
GO metabolizes GA into glyoxylate in the peroxisome. Impairment of GO activity induced elevations in urinary GA excretion in GO-deficient mice [31]. In this context, VB2 acts as a GO cofactor [32]. Therefore, we next examined the effect of VB2 deficiency on GA accumulation induced by the VB- diet (Figure 4A,E). Feeding of the VB- diet or VB2-deficient (VB2-) diet for 2 weeks slightly—but not significantly—reduced plasma VB2 concentrations, even though VB2 intake was reduced (Supplemental Figure S4A,B and Figure 4B,F). Meanwhile, the GA concentration in plasma increased with both VB- and VB2- diet feeding and the levels were restored to those of the control by VB2 supplementation (Figure 4C,G). The plasma GA concentration was significantly correlated with the plasma concentration of VB2 (R2 = 0.42, p = 0.03; Figure 4D). Accordingly, hepatic GO activity was reduced with VB2 deficiency and recovered by VB2 supplementation (Figure 4H). Hepatic GO activity was negatively correlated with plasma GA levels (Figure 4I). Together, these results suggest that VB2- diet feeding suppresses hepatic GO activity and could promote accumulation and secretion of GA to the bloodstream.
Finally, we investigated the capacity of gut microbiota to be a source of VB2 for the host (Figure 5A,C). Upon disruption of gut microbiota by antibiotic treatment, feeding of the VB- diet induced rapid elevation in urinary GA excretion after 2 days of feeding, and accumulation of GA in plasma was also higher than those of native gut microbiota mice after 3 and 5 days of feeding (Figure 5B,D). The magnitude of the elevation in urinary GA was higher for antibiotic-treated mice than for control mice. In control mice, urinary GA excretion increased after 7 days of VB- diet feeding. Urinary VB2 excretion was more rapidly affected by VB- diet feeding. These results suggest that urinary VB2 may reflect dietary VB2 intake and urinary GA may reflect VB2 deficiency in host liver tissues. Moreover, in mice, VB2 produced and supplied from the gut microbiota has a significant role in the VB2 status of the host after short-term depletion in dietary VB2.

4. Discussion

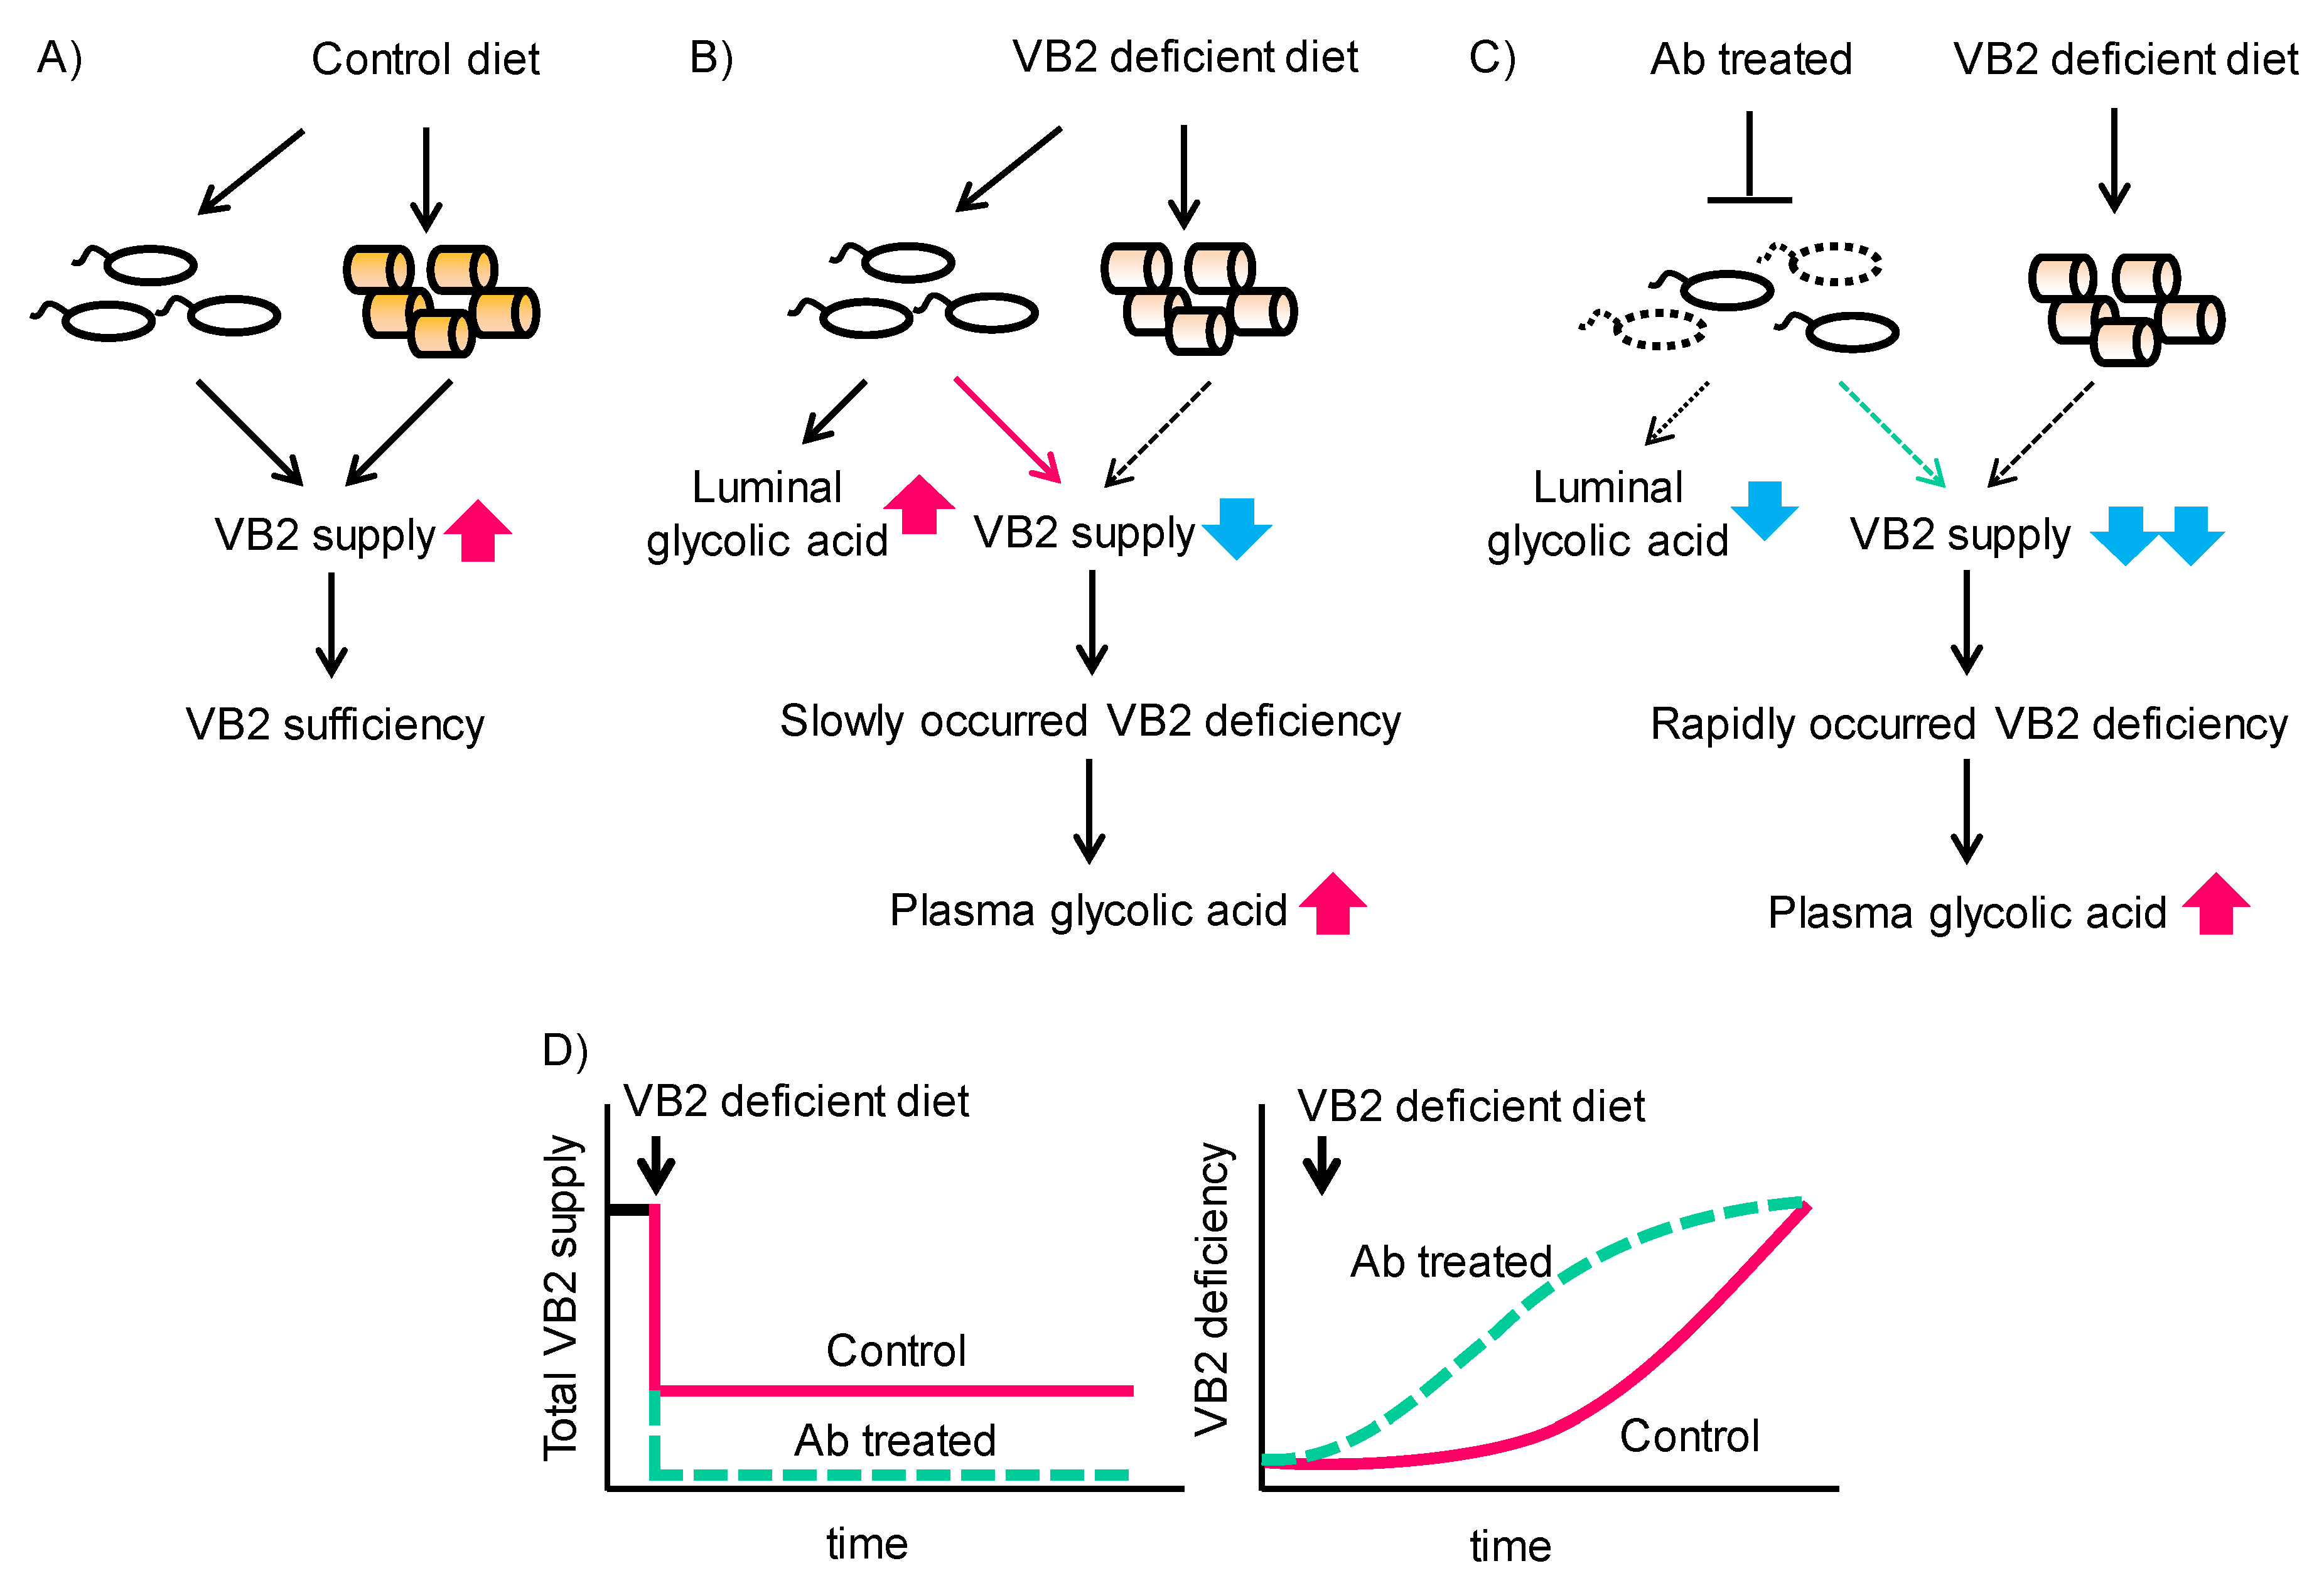
Vitamins act as coenzymes for various enzymes. In this study, we found that VB2 deficiency increases GA concentration both in the gut microbiota and the host. This accumulation of GA in the host occurred concomitantly with decreased activity of GO in the liver. In this context, luminal bacteria act as a supplier of VB2, and therefore, microbial dysbiosis may accelerate vitamin B2 deficiency when dietary VB2 is depleted (Figure 6).
The enzyme GO, also known as (L-2-) hydroxy-acid oxidase, which metabolizes GA to glyoxylate, is widely conserved in intestinal bacteria and mammals [33,34,35,36,37,38]. VB- diet feeding induced changes in the abundances of specific phylum, such as Firmicutes and Bacteroidetes; however, unlike the change in GA concentration, no consistent changes were observed between the 2-week and 4-week treatments (Supplemental Figure S5). These results suggest that GA production in the intestinal microbiota may be caused by metabolic changes of those bacteria instead of those compositional changes by VB- diet feeding. We found that Ab-treatment reduced luminal and cecum GA concentrations in mice fed both the control or VB- diet (Figure 2B,C), whereas the plasma GA concentration was affected only by vitamin B deficiency and not by the Ab-treatment (Figure 2D). These results indicated that luminal GA may be produced by intestinal bacteria and supply to the cecum. On the other hand, elevation of plasma GA may sorely depend on the production and supply of GA from the host itself. Indeed, an increase in urinary excretion of GA has been reported in knock-out mice lacking Hao1, which encodes GO [31]. In the present study, VB2 supplementation of the VB- diet significantly inhibited increases in GA concentration, and when a VB2- diet was administered, significant increases were observed in plasma GA concentrations. Because GO is primarily expressed in the liver in mice [31], this organ is thought to be the primary site for production of GA from glyoxylic acid. However, the effect of increases in plasma GA or in other organs in the host is unclear because GO knockout mice do not show a specific phenotype [31].
The production of GA was shown to increase in rats fed a diet deficient in VB6, a coenzyme of AGT1 [39,40,41]. However, even in mice fed a VB6-deficient diet in our study, no increase in GA concentration was observed, and VB6 supplementation of the VB- diet did not affect GA concentration. These results suggest that the glyoxylic acid and GA metabolic pathways may differ between rats and mice. Indeed, the pharmacokinetics of ethylene glycol, which is involved in the glyoxylic acid metabolism pathway, do differ between rats and mice [42].
VB2 is produced by several bacteria, including Lactobacillus, in the gut [43] and hosts express the VB2 transporter in the distal gut [44,45,46,47,48,49]. However, only estimates of VB2 that could be produced and supplied from the gut microbiota to the host are available [50]. In that study, conducted by Magnusdottir et al., only 2.8% of dietary reference intake appeared to be supplied from gut microbiota in humans. Here, we found that disruption of the gut microbiota by antibiotic treatment of mice induced more rapid elevations in plasma GA concentration upon feeding of the VB- diet. Moreover, the gut microbiota delayed elevations in urinary GA excretion from 2 days to 7 days. These results suggest that the supply of VB2 from enteric bacteria has a significant role in host VB2 homeostasis, especially when dietary intake of vitamin B2 was insufficient. The time course of changes in urinary GA concentration at the time that vitamin B-deficient food is consumed is consistent with our finding that increases in GA concentration occurred later in the control group than the group that received Ab.
Because VB2 deficiency is a risk factor for various diseases and is involved in the activation of other vitamins, proper assessment of the nutritional status for VB2 is important. Urinary VB2 (riboflavin) concentration and the erythrocyte glutathione reductase activation factor (EGRAC) are currently used as biomarkers to reflect the nutritional status of VB2 [51]. In experiments with VB- diet feeding and antibiotic treatment, the concentration of VB2 in urine decreased within 2 days of VB- diet administration in the control group to reflect VB2 intake. On the other hand, the urinary GA concentration increased 7 days after beginning administration of the VB- diet. Thus, changes in urinary GA concentration occurred more slowly than urinary VB2 levels. Changes in GA concentration may reflect VB2 sufficiency in the body because it involves enzyme activity as well as EGRAC. Evaluation of GA accumulation is simple since it increases, rather than decreases with VB2 deficiency, and in contrast to EGRAC, urinary GA levels can be easily measured. Therefore, information concerning dietary VB2 intake and the status of VB2 sufficiency/deficiency in the host can be obtained by measuring both urinary vitamins and GA as dual biomarkers of VB2 nutritional status. In addition, the ability of enterobacteria to supply VB2 can be evaluated.

5. Conclusions

The present study revealed that VB2 deficiency increases GA concentration, and that enterobacteria can compensate for VB2 deficiency in the host when the diet is deficient in VB2.

Supplementary Materials

The following are available online at https://www.mdpi.com/2072-6643/12/3/736/s1, Figure S1: Key members of metabolites (in the square), enzyme (grey), and B-vitamins (yellow) in one-carbon metabolism. Figure S2: The list of metabolites identified in plasma from a metabolite list provided by HMT. Figure S3: Antibiotic treatment reduced the size of gut microbiota in mice with or without VB- diet feeding. Figure S4: VB2 intake in Experiment 4 and 5. Figure S5: Effect of VB- diet feeding on the amount of gut microbiota in mice.

Author Contributions

T.U., T.S., K.M. and A.T. conceived this study. T.U., A.Y., S.A., M.N. and R.M. performed the experiments. T.U., A.Y. and S.A. wrote the manuscript. T.U., A.Y., S.A., M.N., R.M., T.S., K.M. and A.T. analyzed the data, interpreted the results and contributed to discussions. The manuscript was critically reviewed, revised and given final approval by all co-authors. T.U. and A.T. are the guarantors of this work. All authors have read and agreed to the published version of the manuscript.

Funding

This research received no external funding.

Acknowledgments

This work was financially supported by JSPS KAKENHI Grant Numbers JP15H0564710, JP16K15191, and JP18K19746. This study was supported by Support Center for The Special Mission Center for Metabolome Analysis, School of Medical Nutrition, Faculty of Medicine of Tokushima University and Support Center for Advanced Medical Sciences, Institute of Biomedical Sciences, Tokushima University Graduate School. We gratefully acknowledge the excellent assistance of Yumi Harada and the Metabolome Tokumei Unit of Tokushima University. We also thank the Division for Animal Research Resources and Genetic Engineering Support Center for Advanced Medical Sciences, Institute of Biomedical Sciences, Tokushima University Graduate School for care of the mice. T.U. grateful to my family, members of our laboratory, and the Jokyo-kai in our building for their support.

Conflicts of Interest

The authors declare no conflict of interest.

References

  1. Sender, R.; Fuchs, S.; Milo, R. Are We Really Vastly Outnumbered? Revisiting the Ratio of Bacterial to Host Cells in Humans. Cell 2016, 164, 337–340. [Google Scholar] [CrossRef] [PubMed] [Green Version]
  2. Singh, R.K.; Chang, H.W.; Yan, D.; Lee, K.M.; Ucmak, D.; Wong, K.; Abrouk, M.; Farahnik, B.; Nakamura, M.; Zhu, T.H.; et al. Influence of diet on the gut microbiome and implications for human health. J. Transl. Med. 2017, 15, 73. [Google Scholar] [CrossRef] [Green Version]
  3. Lynch, S.V.; Pedersen, O. The Human Intestinal Microbiome in Health and Disease. N. Engl. J. Med. 2016, 375, 2369–2379. [Google Scholar] [CrossRef] [PubMed] [Green Version]
  4. Stiemsma, L.T.; Michels, K.B. The Role of the Microbiome in the Developmental Origins of Health and Disease. Pediatrics 2018, 141, e20172437. [Google Scholar] [CrossRef] [PubMed] [Green Version]
  5. Wostmann, B.S.; Larkin, C.; Moriarty, A.; Bruckner-Kardoss, E. Dietary intake, energy metabolism, and excretory losses of adult male germfree Wistar rats. Lab. Anim. Sci. 1983, 33, 46–50. [Google Scholar] [PubMed]
  6. Schroeder, B.O.; Backhed, F. Signals from the gut microbiota to distant organs in physiology and disease. Nat. Med. 2016, 22, 1079–1089. [Google Scholar] [CrossRef] [PubMed]
  7. Turnbaugh, P.J.; Ley, R.E.; Mahowald, M.A.; Magrini, V.; Mardis, E.R.; Gordon, J.I. An obesity-associated gut microbiome with increased capacity for energy harvest. Nature 2006, 444, 1027–1031. [Google Scholar] [CrossRef]
  8. Backhed, F.; Ding, H.; Wang, T.; Hooper, L.V.; Koh, G.Y.; Nagy, A.; Semenkovich, C.F.; Gordon, J.I. The gut microbiota as an environmental factor that regulates fat storage. Proc. Natl. Acad. Sci. USA 2004, 101, 15718–15723. [Google Scholar] [CrossRef] [Green Version]
  9. Davie, J.R. Inhibition of histone deacetylase activity by butyrate. J. Nutr. 2003, 133, 2485S–2493S. [Google Scholar] [CrossRef]
  10. Kawamata, Y.; Fujii, R.; Hosoya, M.; Harada, M.; Yoshida, H.; Miwa, M.; Fukusumi, S.; Habata, Y.; Itoh, T.; Shintani, Y.; et al. A G protein-coupled receptor responsive to bile acids. J. Biol. Chem. 2003, 278, 9435–9440. [Google Scholar] [CrossRef] [Green Version]
  11. Lew, J.L.; Zhao, A.; Yu, J.; Huang, L.; de Pedro, N.; Peláez, F.; Wright, S.D.; Cui, J. The farnesoid X receptor controls gene expression in a ligand- and promoter-selective fashion. J. Biol. Chem. 2004, 279, 8856–8861. [Google Scholar] [CrossRef] [PubMed] [Green Version]
  12. Molinaro, A.; Wahlstrom, A.; Marschall, H.U. Role of Bile Acids in Metabolic Control. Trends Endocrinol. Metab. 2018, 29, 31–41. [Google Scholar] [CrossRef] [PubMed]
  13. Silverman, M.; Werkman, C.H. Adaptation of the Propionic-Acid Bacteria to Vitamin B(1) Synthesis Including a Method of Assay. J. Bacteriol. 1939, 38, 25–32. [Google Scholar] [CrossRef] [PubMed] [Green Version]
  14. Burkholder, P.R.; McVeigh, I. Synthesis of Vitamins by Intestinal Bacteria. Proc. Natl. Acad. Sci. USA 1942, 28, 285–289. [Google Scholar] [CrossRef] [PubMed] [Green Version]
  15. Strozzi, G.P.; Mogna, L. Quantification of folic acid in human feces after administration of Bifidobacterium probiotic strains. J. Clin. Gastroenterol. 2008, 42 Pt 2 (Suppl. 3), S179–S184. [Google Scholar] [CrossRef]
  16. Pompei, A.; Cordisco, L.; Amaretti, A.; Zanoni, S.; Raimondi, S.; Matteuzzi, D.; Rossi, M. Administration of folate-producing bifidobacteria enhances folate status in Wistar rats. J. Nutr. 2007, 137, 2742–2746. [Google Scholar] [CrossRef]
  17. Hayashi, A.; Mikami, Y.; Miyamoto, K.; Kamada, N.; Sato, T.; Mizuno, S.; Naganuma, M.; Teratani, T.; Aoki, R.; Fukuda, S.; et al. Intestinal Dysbiosis and Biotin Deprivation Induce Alopecia through Overgrowth of Lactobacillus murinus in Mice. Cell Rep. 2017, 20, 1513–1524. [Google Scholar] [CrossRef]
  18. Miki, T.; Goto, R.; Fujimoto, M.; Okada, N.; Hardt, W.D. The Bactericidal Lectin RegIIIbeta Prolongs Gut Colonization and Enteropathy in the Streptomycin Mouse Model for Salmonella Diarrhea. Cell Host Microbe 2017, 21, 195–207. [Google Scholar] [CrossRef] [Green Version]
  19. Cordonnier, C.; Le Bihan, G.; Emond-Rheault, J.G.; Garrivier, A.; Harel, J.; Jubelin, G. Vitamin B12 Uptake by the Gut Commensal Bacteria Bacteroides thetaiotaomicron Limits the Production of Shiga Toxin by Enterohemorrhagic Escherichia coli. Toxins (Basel) 2016, 8, 14. [Google Scholar] [CrossRef]
  20. Ducker, G.S.; Rabinowitz, J.D. One-Carbon Metabolism in Health and Disease. Cell Metab. 2017, 25, 27–42. [Google Scholar] [CrossRef] [Green Version]
  21. Locasale, J.W. Serine, glycine and one-carbon units: Cancer metabolism in full circle. Nat. Rev. Cancer 2013, 13, 572–583. [Google Scholar] [CrossRef] [PubMed] [Green Version]
  22. Macheroux, P.; Massey, V.; Thiele, D.J.; Volokita, M. Expression of spinach glycolate oxidase in Saccharomyces cerevisiae: Purification and characterization. Biochemistry 1991, 30, 4612–4619. [Google Scholar] [CrossRef] [PubMed]
  23. Rojas, C.M.; Senthil-Kumar, M.; Wang, K.; Ryu, C.M.; Kaundal, A.; Mysore, K.S. Glycolate oxidase modulates reactive oxygen species-mediated signal transduction during nonhost resistance in Nicotiana benthamiana and Arabidopsis. Plant Cell 2012, 24, 336–352. [Google Scholar] [CrossRef] [PubMed] [Green Version]
  24. Yoshimoto, A.; Uebanso, T.; Nakahashi, M.; Shimohata, T.; Mawatari, K.; Takahashi, A. Effect of prenatal administration of low dose antibiotics on gut microbiota and body fat composition of newborn mice. J. Clin. Biochem. Nutr. 2018, 62, 155–160. [Google Scholar] [CrossRef]
  25. Uebanso, T.; Kano, S.; Yoshimoto, A.; Naito, C.; Shimohata, T.; Mawatari, K.; Takahashi, A. Effects of Consuming Xylitol on Gut Microbiota and Lipid Metabolism in Mice. Nutrients 2017, 9, 756. [Google Scholar] [CrossRef] [Green Version]
  26. Uebanso, T.; Ohnishi, A.; Kitayama, R.; Yoshimoto, A.; Nakahashi, M.; Shimohata, T.; Mawatari, K.; Takahashi, A. Effects of Low-Dose Non-Caloric Sweetener Consumption on Gut Microbiota in Mice. Nutrients 2017, 9, 560. [Google Scholar] [CrossRef] [Green Version]
  27. Kami, K.; Fujimori, T.; Sato, H.; Sato, M.; Yamamoto, H.; Ohashi, Y.; Sugiyama, N.; Ishihama, Y.; Onozuka, H.; Ochiai, A.; et al. Metabolomic profiling of lung and prostate tumor tissues by capillary electrophoresis time-of-flight mass spectrometry. Metabolomics 2013, 9, 444–453. [Google Scholar] [CrossRef] [Green Version]
  28. Ohashi, Y.; Hirayama, A.; Ishikawa, T.; Nakamura, S.; Shimizu, K.; Ueno, Y.; Tomita, M.; Soga, T. Depiction of metabolome changes in histidine-starved Escherichia coli by CE-TOFMS. Mol. Biosyst. 2008, 4, 135–147. [Google Scholar] [CrossRef]
  29. Ogawa, Y.; Hossain, R.Z.; Ogawa, T.; Yamakawa, K.; Yonou, H.; Oshiro, Y.; Hokama, S.; Morozumi, M.; Uchida, A.; Sugaya, K. Vitamin B6 deficiency augments endogenous oxalogenesis after intravenous L-hydroxyproline loading in rats. Urol. Res. 2007, 35, 15–21. [Google Scholar] [CrossRef]
  30. Li, X.; Knight, J.; Fargue, S.; Buchalski, B.; Guan, Z.; Inscho, E.W.; Liebow, A.; Fitzgerald, K.; Querbes, W.; Todd Lowther, W.; et al. Metabolism of (13)C5-hydroxyproline in mouse models of Primary Hyperoxaluria and its inhibition by RNAi therapeutics targeting liver glycolate oxidase and hydroxyproline dehydrogenase. Biochim. Biophys. Acta 2016, 1862, 233–239. [Google Scholar] [CrossRef]
  31. Martin-Higueras, C.; Luis-Lima, S.; Salido, E. Glycolate Oxidase Is a Safe and Efficient Target for Substrate Reduction Therapy in a Mouse Model of Primary Hyperoxaluria Type I. Mol. Ther. 2016, 24, 719–725. [Google Scholar] [CrossRef] [PubMed] [Green Version]
  32. Pace, C.; Stankovich, M. Oxidation-reduction properties of glycolate oxidase. Biochemistry 1986, 25, 2516–2522. [Google Scholar] [CrossRef] [PubMed]
  33. Schuman, M.; Massey, V. Purification and characterization of glycolic acid oxidase from pig liver. Biochim. Biophys. Acta 1971, 227, 500–520. [Google Scholar] [CrossRef] [Green Version]
  34. Cha, M.; Kim, E.J.; Yun, H.; Cho, B.K.; Kim, B.G. Synthesis of enantiopure (S)-2-hydroxyphenylbutanoic acid using novel hydroxy acid dehydrogenase from Enterobacter sp. BK2K. Biotechnol. Prog. 2007, 23, 606–612. [Google Scholar] [CrossRef]
  35. Lee, H.S.; Park, J.; Yoo, Y.J.; Yeon, Y.J. A novel d-2-hydroxy acid dehydrogenase with high substrate preference for phenylpyruvate originating from lactic acid bacteria: Structural analysis on the substrate specificity. Enzyme Microb. Technol. 2019, 125, 37–44. [Google Scholar] [CrossRef]
  36. Jones, J.M.; Morrell, J.C.; Gould, S.J. Identification and characterization of HAOX1, HAOX2, and HAOX3, three human peroxisomal 2-hydroxy acid oxidases. J. Biol. Chem. 2000, 275, 12590–12597. [Google Scholar] [CrossRef] [Green Version]
  37. Kohler, S.A.; Menotti, E.; Kuhn, L.C. Molecular cloning of mouse glycolate oxidase. High evolutionary conservation and presence of an iron-responsive element-like sequence in the mRNA. J. Biol. Chem. 1999, 274, 2401–2407. [Google Scholar] [CrossRef] [Green Version]
  38. Kun, E.; Dechary, J.M.; Pitot, H.C. The oxidation of glycolic acid by a liver enzyme. J. Biol. Chem. 1954, 210, 269–280. [Google Scholar]
  39. Nishijima, S.; Sugaya, K.; Hokama, S.; Oshiro, Y.; Uchida, A.; Morozumi, M.; Ogawa, Y. Effect of vitamin B6 deficiency on glyoxylate metabolism in rats with or without glyoxylate overload. Biomed. Res. 2006, 27, 93–98. [Google Scholar] [CrossRef] [Green Version]
  40. Teerajetgul, Y.; Hossain, R.Z.; Machida, N.; Sugaya, K.; Ogawa, Y. Endogenous oxalogenesis after acute intravenous loading with ethylene glycol or glycine in rats receiving standard and vitamin B6-deficient diets. Int. J. Urol. 2008, 15, 929–935. [Google Scholar] [CrossRef]
  41. Teerajetgul, Y.; Hossain, R.Z.; Yamakawa, K.; Morozumi, M.; Sugaya, K.; Ogawa, Y. Oxalate synthesis from hydroxypyruvate in vitamin-B6-deficient rats. Urol. Res. 2007, 35, 173–178. [Google Scholar] [CrossRef] [PubMed]
  42. Frantz, S.W.; Beskitt, J.L.; Grosse, C.M.; Tallant, M.J.; Dietz, F.K.; Ballantyne, B. Pharmacokinetics of ethylene glycol. II. Tissue distribution, dose-dependent elimination, and identification of urinary metabolites following single intravenous, peroral or percutaneous doses in female Sprague-Dawley rats and CD-1 mice. Xenobiotica 1996, 26, 1195–1220. [Google Scholar] [CrossRef] [PubMed]
  43. Thakur, K.; Tomar, S.K.; De, S. Lactic acid bacteria as a cell factory for riboflavin production. Microb. Biotechnol. 2016, 9, 441–451. [Google Scholar] [CrossRef] [PubMed]
  44. Yonezawa, A.; Masuda, S.; Katsura, T.; Inui, K. Identification and functional characterization of a novel human and rat riboflavin transporter, RFT1. Am. J. Physiol. Cell Physiol. 2008, 295, C632–C641. [Google Scholar] [CrossRef] [PubMed] [Green Version]
  45. Subramanian, V.S.; Subramanya, S.B.; Rapp, L.; Marchant, J.S.; Ma, T.Y.; Said, H.M. Differential expression of human riboflavin transporters -1, -2, and -3 in polarized epithelia: A key role for hRFT-2 in intestinal riboflavin uptake. Biochim. Biophys. Acta 2011, 1808, 3016–3021. [Google Scholar] [CrossRef] [Green Version]
  46. Subramanian, V.S.; Sabui, S.; Heskett, C.W.; Said, H.M. Sodium Butyrate Enhances Intestinal Riboflavin Uptake via Induction of Expression of Riboflavin Transporter-3 (RFVT3). Dig. Dis. Sci. 2019, 64, 84–92. [Google Scholar] [CrossRef]
  47. Yamamoto, S.; Inoue, K.; Ohta, K.Y.; Fukatsu, R.; Maeda, J.Y.; Yoshida, Y.; Yuasa, H. Identification and functional characterization of rat riboflavin transporter 2. J. Biochem. 2009, 145, 437–443. [Google Scholar] [CrossRef]
  48. Yao, Y.; Yonezawa, A.; Yoshimatsu, H.; Masuda, S.; Katsura, T.; Inui, K. Identification and comparative functional characterization of a new human riboflavin transporter hRFT3 expressed in the brain. J. Nutr. 2010, 140, 1220–1226. [Google Scholar] [CrossRef] [Green Version]
  49. Yonezawa, A.; Inui, K. Novel riboflavin transporter family RFVT/SLC52: Identification, nomenclature, functional characterization and genetic diseases of RFVT/SLC52. Mol. Aspects Med. 2013, 34, 693–701. [Google Scholar] [CrossRef]
  50. Magnusdottir, S.; Ravcheev, D.; de Crecy-Lagard, V.; Thiele, I. Systematic genome assessment of B-vitamin biosynthesis suggests co-operation among gut microbes. Front. Genet. 2015, 6, 148. [Google Scholar] [CrossRef] [Green Version]
  51. Mushtaq, S.; Su, H.; Hill, M.H.; Powers, H.J. Erythrocyte pyridoxamine phosphate oxidase activity: A potential biomarker of riboflavin status? Am. J. Clin. Nutr. 2009, 90, 1151–1159. [Google Scholar] [CrossRef] [PubMed] [Green Version]
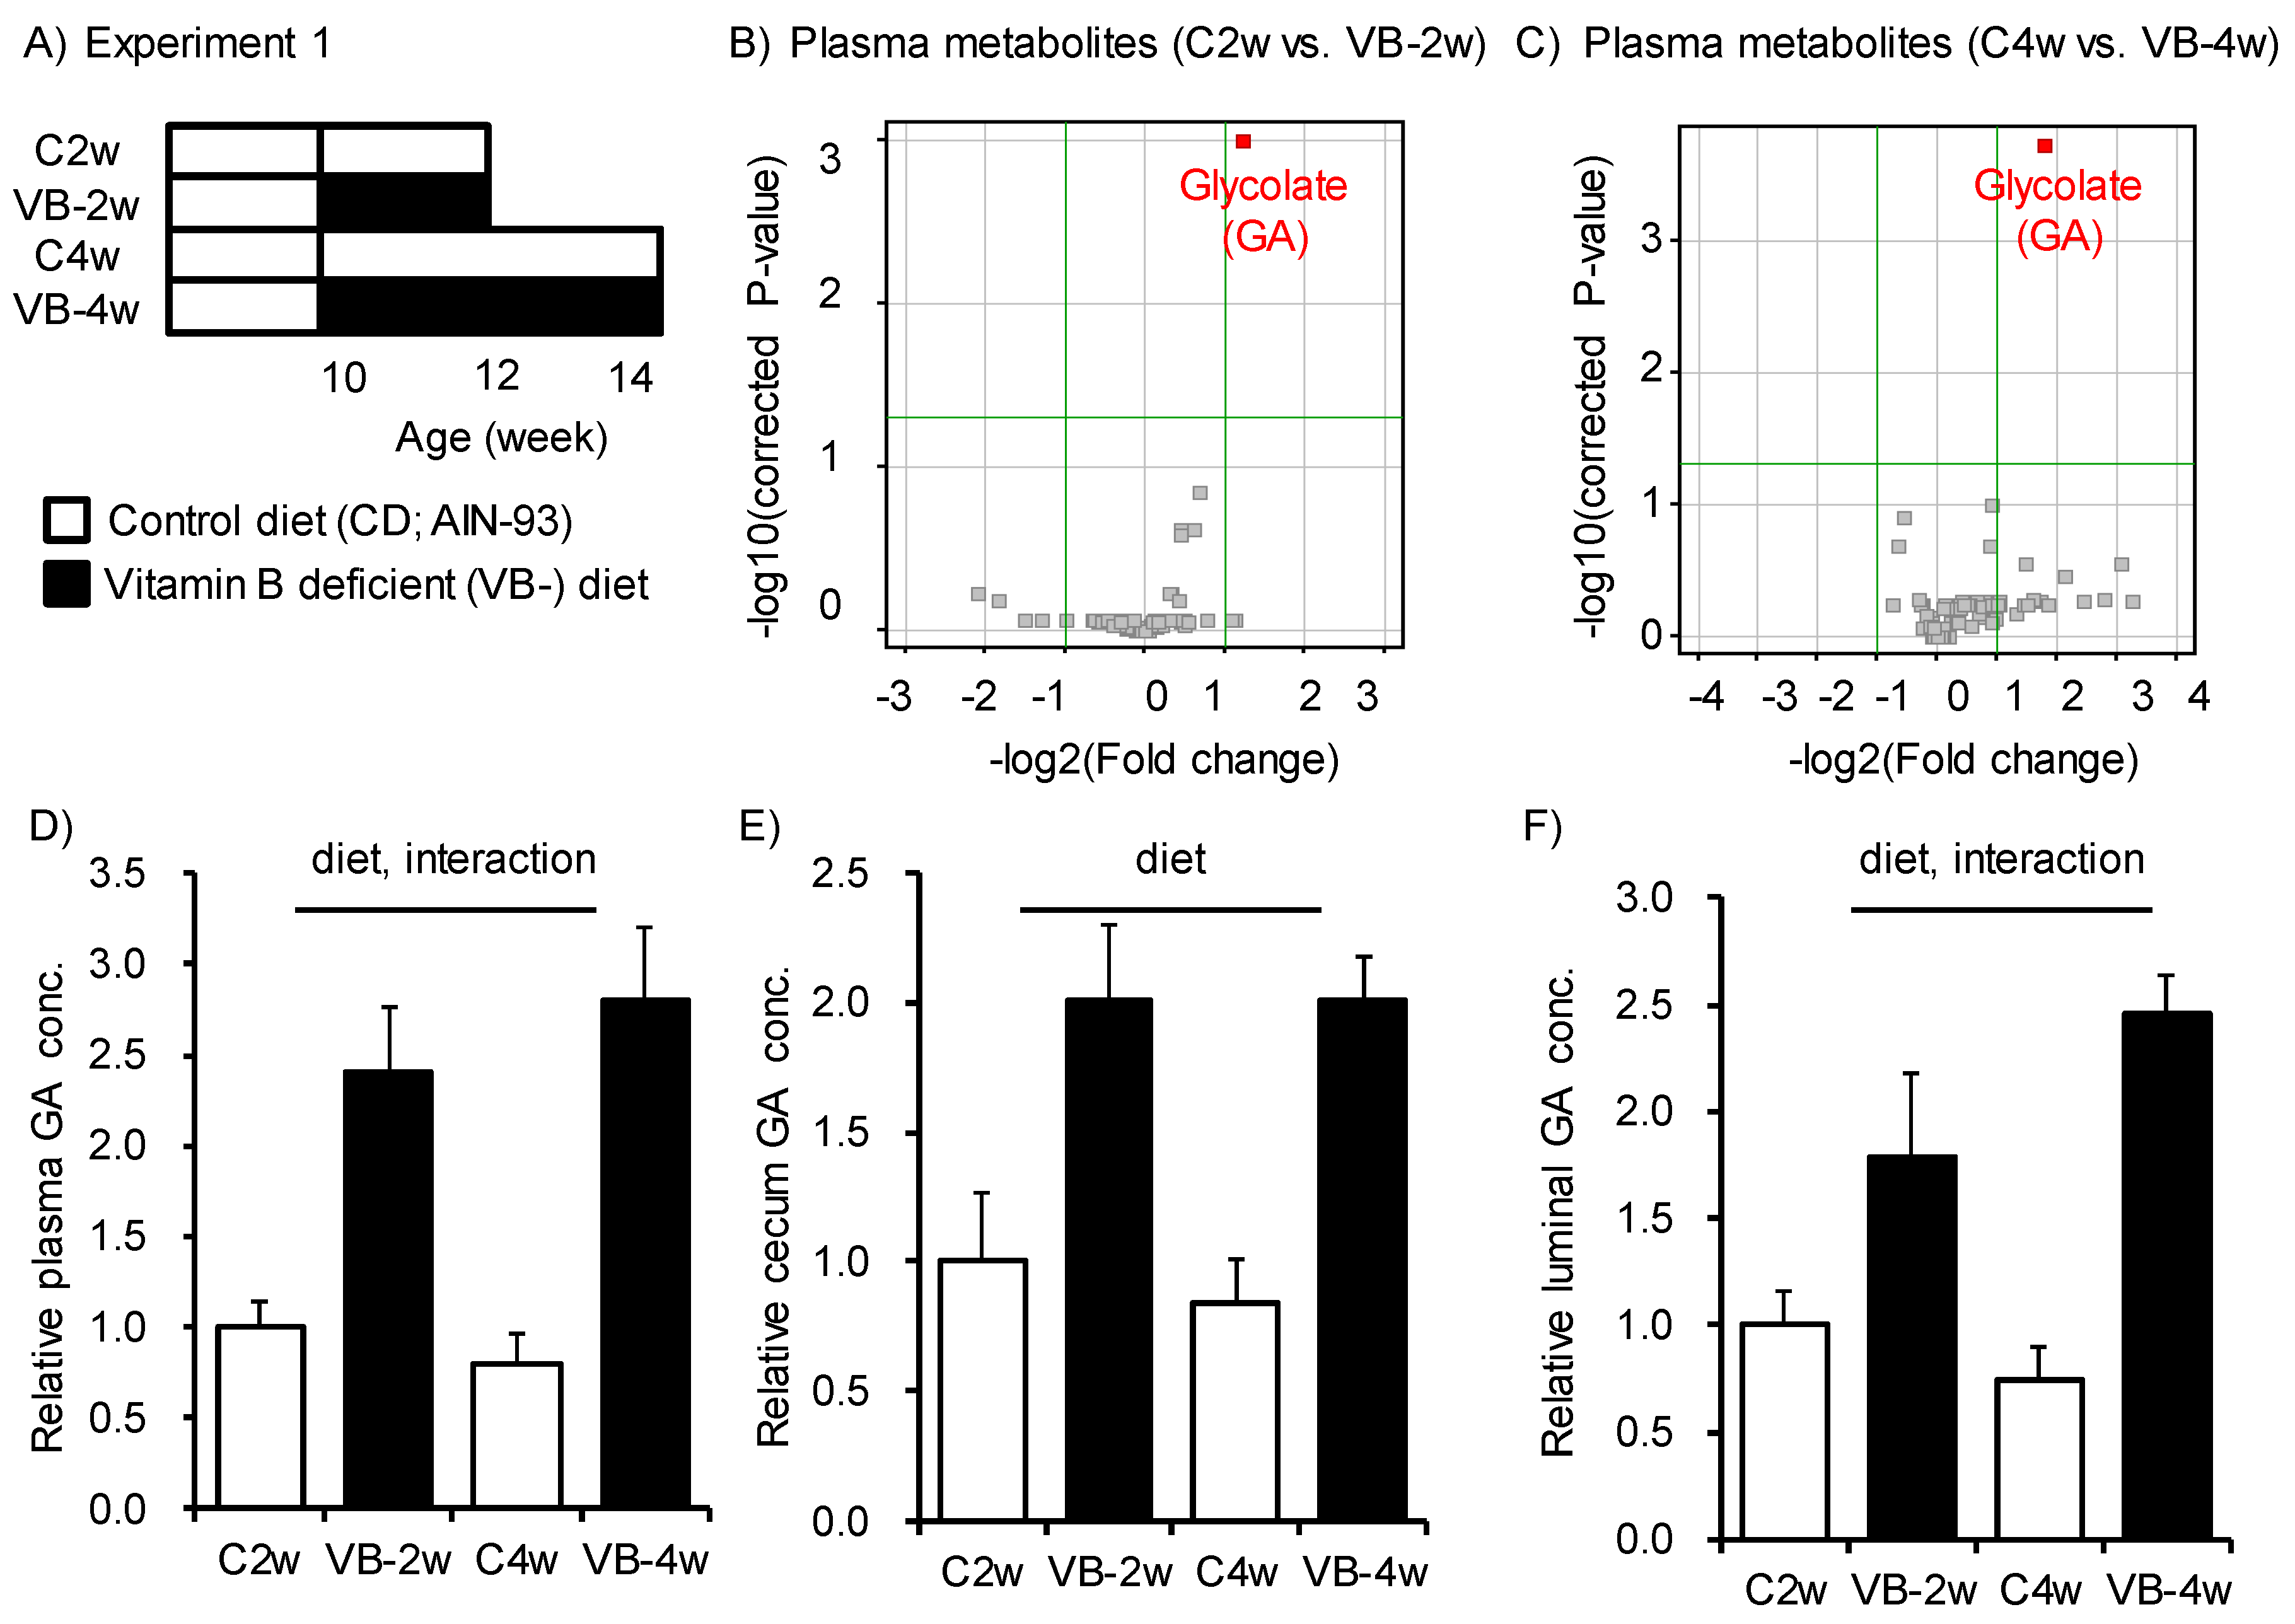
Figure 1. Feeding of diet deficient in vitamin B2, B6, B12, and folic acid induced accumulation of glycolate in plasma, cecum, and luminal content of the cecum. (A) Study design for Experiment 1. Mice were fed a control diet (C: AIN93-G) or a diet deficient in vitamin B2, B6, B12, and folic acid (VB-) diet for 2 or 4 weeks. (B,C) Volcano plots of 77 metabolites in plasma from mice fed either VB- or control diet for (B) 2 or (C) 4 weeks. The glycolate (GA) concentration changed significantly in both the 2- and 4-week feeding groups. (DF) Relative concentration of glycolate in (D) plasma, (E) cecum, and (F) luminal content for the four groups (n = 4–5). Two-way ANOVA was used to determine the effect of diet, time, and the interaction of diet and time; p < 0.05.
Nutrients 12 00736 g001
Figure 2. Both the gut microbiota and host accumulated glycolate in mice fed the VB- diet. (A) Study design for Experiment 2. Mice were fed the control diet or VB- diet for 4 weeks with or without treatment with four different antibiotics (150 mg/mouse/day penicillin V, ampicillin, metronidazole, and 75 mg/mouse/day vancomycin solved in distilled water). (BE) Relative concentration of GA in (B) luminal content, (C) cecum, (D) plasma, and (E) stool among the four groups (n = 3–4). Two-way ANOVA was used to determine the effect of diet, antibiotics, and the interaction of the two. p < 0.05. (F) Spearman’s rank correlation coefficient used to describe correlation between luminal GA concentration and that in cecum, plasma, and stool had values of 0.95, 0.61, and 0.12, respectively.
Nutrients 12 00736 g002
Figure 3. Feeding of a vitamin B6-deficient diet did not induce glycolate accumulation in plasma or luminal content. (A) Study design for Experiment 3. Mice were fed the control diet, VB- diet, or vitamin B6-deficient (VB6-) diet for 2 weeks with or without VB6 supplementation (6 μg/mL pyridoxine hydrochloride solution in distilled water). (B) Average daily VB6 intake and (C) plasma VB6 concentration for the five groups. (D,E) Relative concentration of GA in (D) plasma and (E) luminal content for the five groups. (F) Spearman’s rank correlation coefficients between plasma VB6 concentration and plasma GA levels (R2 = 0.1035, p > 0.1). ANOVA was used to determine the differences in each group (n = 4). Different letters indicate p < 0.05.
Nutrients 12 00736 g003
Figure 4. Feeding of a vitamin B2-deficient diet induced glycolate accumulation in plasma from mice. (A,E) Study design for Experiments 4 and 5. Mice were fed a control diet, VB- diet, or VB2-deficient (VB2-) diet for 2 weeks with or without VB2 supplementation (6 μg/mL flavin mononucleotide sodium salt solution in distilled water). (B,F) Average plasma VB2 concentration in each of the three groups. (C,G) Relative plasma concentration of GA. (D) Spearman’s rank correlation coefficients between plasma VB2 concentration and plasma GA levels (r2 = 0.42, p = 0.03). (H) Relative GA oxidase (GO) activity in the liver. (I) Spearman’s rank correlation coefficients between relative hepatic GO activity and plasma GA levels (r2 = 0.45, p = 0.01). ANOVA was used to determine differences in each group (n = 3–4 in Experiment 4 and n = 4–5 in Experiment 5). Different letters indicate p < 0.05 and N.S. represents no significant difference among the groups.
Nutrients 12 00736 g004
Figure 5. Disruption of gut microbiota following rapid depletion of VB2 in mice fed VB- diet for a short period. (A,C) Study design for Experiments 6 and 7. Mice were switched from the control diet to the VB- diet after treatment with antibiotics or the vehicle as a control. Urine or plasma samples were obtained over the indicated time period. (B) Time-dependent changes in creatinine-adjusted urinary GA concentration (white and black circles indicate the control and antibiotics-treated mice, respectively) or urinary VB2 concentration (white triangle in the control group). (D) Relative concentration of GA in plasma at different time points. Repeated measured ANOVA was used to determine the differences in each group (n = 3). * indicates p < 0.05. Two-way ANOVA was used to determine the effect of time, antibiotics, and the interaction of the two.
Nutrients 12 00736 g005
Figure 6. Interaction of dietary VB2, the gut microbiota, and glycolate accumulation in gut microbiota and the mouse host. (A) Control diet feeding with normal gut microbiota sustains a sufficient VB2 supply from both sources and preserves VB2 sufficiency. (B) VB2- diet feeding with normal gut microbiota sustains a VB2 supply from the gut microbiota only in the short term and before VB2 deficiency gradually develops. (C) Feeding of a VB2- diet in the presence of disrupted gut microbiota due to antibiotic treatment does not sustain adequate VB2 supplies and rapidly induces VB2 deficiency. (D) Time course of total VB2 supply (left) and VB2 deficiency (right) in mice fed the VB2- diet with or without antibiotic treatment.
Nutrients 12 00736 g006