A Fatty Acid Mouth Rinse Decreases Self-Reported Hunger and Increases Self-Reported Fullness in Healthy Australian Adults: A Randomized Cross-Over Trial


Abstract
1. Introduction
2. Materials and Methods
2.1. Participants
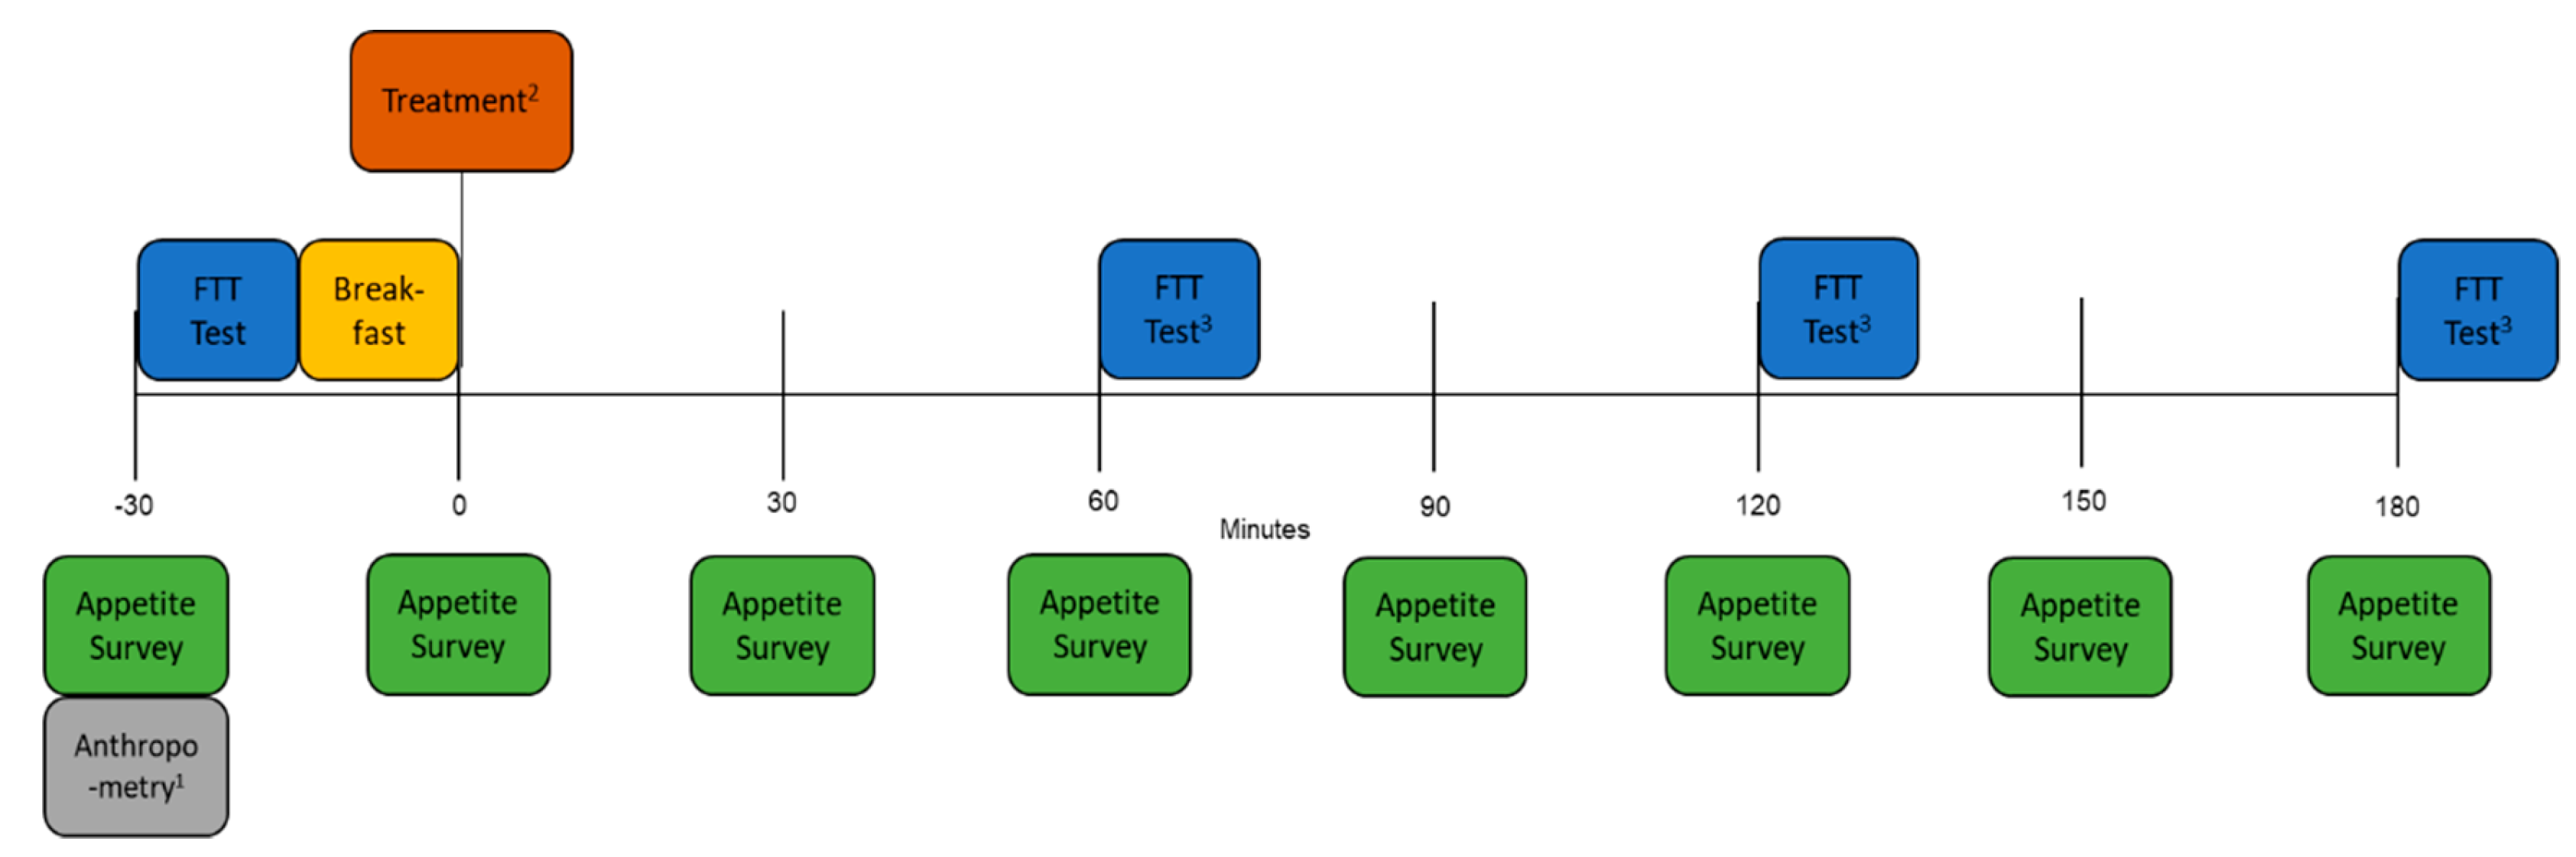
2.2. Study Outline
2.3. Appetite Questionnaire
2.4. Fat Taste Threshold (FTT)
2.5. Breakfast
2.6. Treatment Mouth Rinses
2.7. Statistical Analysis
3. Results
3.1. The Effect of The OA Mouth Rinse on Appetite
3.2. The Effect of the OA Mouth Rinse on FTT
3.3. The Influence of FTT (Effect Modification) on the Efficacy of the OA Mouth Rinse on Appetite
4. Discussion
5. Conclusions
Supplementary Materials
Author Contributions
Funding
Acknowledgments
Conflicts of Interest
References
- Stewart, J.E.; Seimon, R.V.; Otto, B.; Keast, R.S.; Clifton, P.M.; Feinle-Bisset, C. Marked differences in gustatory and gastrointestinal sensitivity to oleic acid between lean and obese men. Am. J. Clin. Nutr. 2011, 93, 703–711. [Google Scholar] [CrossRef]
- Feinle, C.; O’Donovan, D.; Doran, S.; Andrews, J.M.; Wishart, J.; Chapman, I.; Horowitz, M. Effects of fat digestion on appetite, APD motility, and gut hormones in response to duodenal fat infusion in humans. Am. J. Physiol. Gastr. 2003, 284, 798–807. [Google Scholar] [CrossRef]
- Stoeckel, L.E.; Weller, R.E.; Giddings, M.; Cox, J.E. Peptide YY levels are associated with appetite suppression in response to long-chain fatty acids. Physiol. Behav. 2008, 93, 289–295. [Google Scholar] [CrossRef]
- Heddle, R.; Collins, P.J.; Dent, J.; Horowitz, M.; Read, N.W.; Chatterton, B.; Houghton, L.A. Motor mechanisms associated with slowing of the gastric emptying of a solid meal by an intraduodenal lipid infusion. J. Gastroenterol. Hepatol. 1989, 4, 437–447. [Google Scholar] [CrossRef]
- Little, T.J.; Russo, A.; Meyer, J.H.; Horowitz, M.; Smyth, D.R.; Bellon, M.; Wishart, J.M.; Jones, K.L.; Feinle-Bisset, C. Free fatty acids have more potent effects on gastric emptying, gut hormones, and appetite than triacylglycerides. Gastroenterology 2007, 133, 1124–1131. [Google Scholar] [CrossRef]
- Roussel, A.; Canaan, S.; Egloff, M.P.; Rivière, M.; Dupuis, L.; Verger, R.; Cambillau, C. Crystal structure of human gastric lipase and model of lysosomal acid lipase, two lipolytic enzymes of medical interest. J. Biol. Chem. 1999, 274, 16995–17002. [Google Scholar] [CrossRef]
- Pepino, M.Y.; Love-Gregory, L.; Klein, S.; Abumrad, N.A. The fatty acid translocase gene CD36 and lingual lipase influence oral sensitivity to fat in obese subjects. J. Lipid. Res. 2012, 53, 561–566. [Google Scholar] [CrossRef]
- Damgaard, M.; Graff, J.; Fuglsang, S.; Holst, J.J.; Rehfeld, J.F.; Madsen, J.L. Effects of oleic acid and olive oil on gastric emptying, gut hormone secretion and appetite in lean and overweight or obese males. ESPEN J. 2013, 8, 8–14. [Google Scholar] [CrossRef]
- Liu, D.; Costanzo, A.; Evans, M.D.; Archer, N.S.; Nowson, C.; Duesing, K.; Keast, R. Expression of the candidate fat taste receptors in human fungiform papillae and the association with fat taste function. Br. J. Nutr. 2018, 120, 64–73. [Google Scholar] [CrossRef]
- Liu, D.; Archer, N.; Duesing, K.; Hannan, G.; Keast, R. Mechanism of fat taste perception: Association with diet and obesity. Prog. Lipid Res. 2016, 63, 41–49. [Google Scholar] [CrossRef]
- Simons, P.J.; Kummer, J.A.; Luiken, J.J.; Boon, L. Apical CD36 immunolocalization in human and porcine taste buds from circumvallate and foliate papillae. Acta Histochem. 2011, 113, 839–843. [Google Scholar] [CrossRef]
- Keast, R.S.; Costanzo, A. Is fat the sixth taste primary? Evidence and implications. Flavour 2015, 4, 5. [Google Scholar] [CrossRef]
- Costanzo, A.; Nowson, C.; Orellana, L.; Bolhuis, D.; Duesing, K.; Keast, R. Effect of dietary fat intake and genetics on fat taste sensitivity: A co-twin randomized controlled trial. Am. J. Clin. Nutr. 2018, 107, 683–694. [Google Scholar] [CrossRef]
- Newman, L.P.; Bolhuis, D.P.; Torres, S.J.; Keast, R.S. Dietary fat restriction increases fat taste sensitivity in people with obesity. Obesity 2016, 24, 328–334. [Google Scholar] [CrossRef]
- Stewart, J.E.; Keast, R.S. Recent fat intake modulates fat taste sensitivity in lean and overweight subjects. Int. J. Obesity 2012, 36, 834. [Google Scholar] [CrossRef]
- Mrizak, I.; Šerý, O.; Plesnik, J.; Arfa, A.; Fekih, M.; Bouslema, A.; Zaouali, M.; Tabka, Z.; Khan, N.A. The A allele of cluster of differentiation 36 (CD36) SNP 1761667 associates with decreased lipid taste perception in obese Tunisian women. Br. J. Nutr. 2015, 113, 1330–1337. [Google Scholar] [CrossRef]
- Sayed, A.; Šerý, O.; Plesnik, J.; Daoudi, H.; Rouabah, A.; Rouabah, L.; Khan, N.A. CD36 AA genotype is associated with decreased lipid taste perception in young obese, but not lean, children. Int. J. Obes. 2015, 39, 920. [Google Scholar] [CrossRef]
- Keast, R.S.; Azzopardi, K.M.; Newman, L.P.; Haryono, R.Y. Impaired oral fatty acid chemoreception is associated with acute excess energy consumption. Appetite 2014, 80, 1–6. [Google Scholar] [CrossRef]
- Costanzo, A.; Orellana, L.; Nowson, C.; Duesing, K.; Keast, R. Fat taste sensitivity is associated with short-term and habitual fat intake. Nutrients 2017, 9, 781. [Google Scholar] [CrossRef]
- Asano, M.; Hong, G.; Matsuyama, Y.; Wang, W.; Izumi, S.; Izumi, M.; Toda, T.; Kudo, T.A. Association of oral fat sensitivity with body mass index, taste preference, and eating habits in healthy Japanese young adults. Tohoku J. Exp. Med. 2016, 238, 93–103. [Google Scholar] [CrossRef]
- Kindleysides, S.; Beck, K.; Walsh, D.; Henderson, L.; Jayasinghe, S.; Golding, M.; Breier, B. Fat sensation: Fatty acid taste and olfaction sensitivity and the link with disinhibited eating behaviour. Nutrients 2017, 9, 879. [Google Scholar] [CrossRef]
- Stewart, J.E.; Feinle-Bisset, C.; Golding, M.; Delahunty, C.; Clifton, P.M.; Keast, R.S. Oral sensitivity to fatty acids, food consumption and BMI in human subjects. Br. J. Nutr. 2010, 104, 145–152. [Google Scholar] [CrossRef]
- Martínez-Ruiz, N.R.; López-Díaz, J.A.; Wall-Medrano, A.; Jiménez-Castro, J.A.; Angulo, O. Oral fat perception is related with body mass index, preference and consumption of high-fat foods. Physiol. Behav. 2014, 129, 36–42. [Google Scholar] [CrossRef]
- Tucker, R.M.; Edlinger, C.; Craig, B.A.; Mattes, R.D. Associations between BMI and fat taste sensitivity in humans. Chem. Senses 2014, 39, 349–357. [Google Scholar] [CrossRef]
- Martin, C.; Passilly-Degrace, P.; Gaillard, D.; Merlin, J.F.; Chevrot, M.; Besnard, P. The lipid-sensor candidates CD36 and GPR120 are differentially regulated by dietary lipids in mouse taste buds: Impact on spontaneous fat preference. PLoS ONE. Available online: https://journals.plos.org/plosone/article/file?type=printable&id=10.1371/journal.pone.0024014 (accessed on 21 February 2020).
- Harington, K.; Smeele, R.; Van Loon, F.; Yuan, J.; Haszard, J.J.; Drewer, A.; Venn, B.J. Desire for sweet taste unchanged after eating: Evidence of a dessert mentality? J. Am. Coll. Nutr. 2016, 35, 581–586. [Google Scholar] [CrossRef]
- Haryono, R.Y.; Sprajcer, M.A.; Keast, R.S. Measuring oral fatty acid thresholds, fat perception, fatty food liking, and papillae density in humans. JoVE J. Vis. Exp. 2014, 88. [Google Scholar] [CrossRef]
- Schofield, W.N. Predicting basal metabolic rate, new standards and review of previous work. Hum. Nutr. Clin. Nutr. 1985, 39, 5–41. [Google Scholar]
- National Health and Medical Research Council (NHMRC). Nutrient Reference Values for Australia and New Zealand including Recommended Dietary Intakes; NHMRC: Canberra, Australia, 2006.
- Pruessner, J.C.; Kirschbaum, C.; Meinlschmid, G.; Hellhammer, D.H. Two formulas for computation of the area under the curve represent measures of total hormone concentration versus time-dependent change. Psychoneuroendocrino 2003, 28, 916–931. [Google Scholar] [CrossRef]
- Robertson, M.D.; Jackson, K.G.; Williams, C.M.; Fielding, B.A.; Frayn, K.N. Prolonged effects of modified sham feeding on energy substrate mobilization. Am. J. Clin. Nutr. 2001, 73, 111–117. [Google Scholar] [CrossRef]
- Wisén, O.; Björvell, H.; Cantor, P.; Johansson, C.; Theodorsson, E. Plasma concentrations of regulatory peptides in obesity following modified sham feeding (MSF) and a liquid test meal. Regul. Peptides 1992, 39, 43–54. [Google Scholar] [CrossRef]
- Mattes, R.D. Oral fat exposure alters postprandial lipid metabolism in humans. Am. J. Clin. Nutr. 1996, 63, 911–917. [Google Scholar] [PubMed]
- Mattes, R.D. The taste of fat elevates postprandial triacylglycerol. Physiol. Behav. 2001, 74, 343–348. [Google Scholar] [CrossRef]
- Wøjdemann, M.; Olsen, O.; Nørregaard, P.; Sternby, B.; Rehfeld, J.F. Gastric lipase secretion after sham feeding and cholinergic blockade. Digest Dis. Sci. 1997, 42, 1070–1075. [Google Scholar] [CrossRef]
- Flint, A.; Raben, A.; Blundell, J.E.; Astrup, A. Reproducibility, power and validity of visual analogue scales in assessment of appetite sensations in single test meal studies. Int. J. Obes. 2000, 24, 38–48. [Google Scholar] [CrossRef]
- Costanzo, A.; Liu, D.; Nowson, C.; Duesing, K.; Archer, N.; Bowe, S.; Keast, R. A low-fat diet upregulates expression of fatty acid taste receptor gene FFAR4 in fungiform papillae in humans: A co-twin randomised controlled trial. Br. J. Nutr. 2019, 122, 1212–1220. [Google Scholar] [CrossRef]
- Brennan, I.M.; Feltrin, K.L.; Nair, N.S.; Hausken, T.; Little, T.J.; Gentilcore, D.; Wishart, J.M.; Jones, K.L.; Horowitz, M.; Feinle-Bisset, C. Effects of the phases of the menstrual cycle on gastric emptying, glycemia, plasma GLP-1 and insulin, and energy intake in healthy lean women. Am. J. Physiol. Gastr. 2009, 297, 602–610. [Google Scholar] [CrossRef]
- Chandarana, K.; Drew, M.E.; Emmanuel, J.; Karra, E.; Gelegen, C.; Chan, P.; Cron, N.J.; Batterham, R.L. Subject standardization, acclimatization, and sample processing affect gut hormone levels and appetite in humans. Gastroenterology 2009, 136, 2115–2126. [Google Scholar] [CrossRef]
- Kissileff, H.R. Effects of physical state (liquid-solid) of foods on food intake: Procedural and substantive contributions. Am. J. Clin. Nutr. 1985, 42, 956–965. [Google Scholar] [CrossRef]


| FTT Tertiles | |||||
|---|---|---|---|---|---|
| Overall | Hypersensitive | Moderately Sensitive | Hyposensitive | ANOVA p-Value | |
| n | 31 | 9 | 11 | 11 | − |
| % female | 55 | 46 | 58 | 60 | 0.432 |
| Age (years) | 32.0 (8.4) | 32.0 (6.5) | 30.8 (8.8) | 33.2 (9.2) | 0.385 |
| Height (cm) | 168.6 (8.6) | 170.9 (7.8) | 169.0 (8.8) | 166.0 (8.1) | 0.029 |
| Weight (kg) | 74.2 (23.0) | 69.9 (11.3) | 75.7 (26.1) | 76.2 (26.1) | 0.400 |
| BMI (kg/m2) | 26.1 (8.1) | 23.9 (3.4) | 26.5 (9.2) | 27.6 (9.0) | 0.100 |
| FTT | 3.7 (3.0) | 1.4 (0.4) | 2.4 (0.5) | 7.0 (2.1) | < 0.001 |
| Control mm × hr (95% CI) | OA mm × hr (95% CI) | Difference mm × hr (95% CI) | FTT Tertile × Treatment Interaction (p) | |
|---|---|---|---|---|
| Fullness AUC | <0.001 | |||
| Overall | 147 (128, 166) | 168 (149, 187) | 21 (7, 35) ** | |
| Hypersensitive | 139 (113, 165) | 176 (150, 203) | 37 (11, 63) ** | |
| Moderately sensitive | 149 (126, 173) | 171 (146, 196) | 22 (−4, 47) | |
| Hyposensitive | 152 (124, 179) | 156 (132, 181) | 5 (−20, 30) | |
| Hunger AUC | 0.028 | |||
| Overall | 170 (148, 192) | 147 (125, 168) | −24 (−38, −9) ** | |
| Hypersensitive | 183 (154, 211) | 140 (111, 169) | −42 (−69, −16) ** | |
| Moderately sensitive | 178 (153, 204) | 148 (120, 175) | −31 (−57, −4)* | |
| Hyposensitive | 150 (120, 180) | 152 (125, 179) | 2 (−24, 28) | |
| Desire AUC | 0.095 | |||
| Overall | 173 (146, 200) | 160 (133, 188) | −13 (−28, 3) | |
| Hypersensitive | 181 (148, 215) | 155 (120, 189) | −26 (−55, 2) | |
| Moderately sensitive | 183 (152, 214) | 168 (135, 200) | −15 (−44, 13) | |
| Hyposensitive | 155 (120, 191) | 159 (127, 191) | 3 (−25, 31) | |
| Quantity AUC | 0.133 | |||
| Overall | 157 (134, 181) | 146 (123, 170) | −11 (−25, 3) | |
| Hypersensitive | 172 (143, 201) | 150 (120, 180) | −22 (−48, 4) | |
| Moderately sensitive | 160 (133, 187) | 145 (116, 173) | −15 (−41, 11) | |
| Hyposensitive | 140 (109, 171) | 144 (116, 172) | 4 (−21, 29) | |
| Meal AUC | 0.196 | |||
| Overall | 154 (126, 181) | 147 (120, 175) | −6 (−23, 10) | |
| Hypersensitive | 173 (138, 207) | 150 (115, 185) | −23 (−53, 8) | |
| Moderately sensitive | 154 (123, 186) | 147 (114, 180) | −8 (−37, 22) | |
| Hyposensitive | 134 (98, 170) | 146 (113, 178) | 11 (−18, 41) | |
| Snack AUC | 0.389 | |||
| Overall | 227 (194, 260) | 216 (183, 249) | −11 (−28, 7) | |
| Hypersensitive | 229 (190, 269) | 218 (178, 259) | −11 (−43, 22) | |
| Moderately sensitive | 240 (203, 277) | 223 (185, 262) | −17 (−49, 15) | |
| Hyposensitive | 211 (169, 252) | 206 (167, 244) | −5 (−36, 27) | |
| Sweet AUC | 0.662 | |||
| Overall | 158 (126, 190) | 151 (119, 183) | −7 (−23, 9) | |
| Hypersensitive | 173 (134, 211) | 150 (111, 188) | −23 (−53, 7) | |
| Moderately sensitive | 172 (136, 208) | 168 (131, 205) | −4 (−33, 26) | |
| Hyposensitive | 130 (90, 169) | 135 (98, 172) | 6 (−24, 35) | |
| Salty AUC | 0.098 | |||
| Overall | 157 (123, 191) | 152 (118, 187) | −5 (−21, 11) | |
| Hypersensitive | 162 (122, 202) | 153 (112, 193) | −9 (−39, 21) | |
| Moderately sensitive | 165 (127, 202) | 148 (109, 187) | −17 (−46, 12) | |
| Hyposensitive | 145 (103, 186) | 156 (117, 195) | 11 (−17, 40) | |
| Savory AUC | 0.524 | |||
| Overall | 184 (155, 214) | 175 (145, 205) | −9 (−26, 7) | |
| Hypersensitive | 193 (157, 229) | 178 (141, 215) | −15 (−45, 16) | |
| Moderately sensitive | 193 (159, 227) | 173 (138, 208) | −20 (−50, 10) | |
| Hyposensitive | 167 (129, 205) | 174 (140, 209) | 7 (−22, 37) | |
| Fatty AUC | 0.067 | |||
| Overall | 131 (102, 159) | 129 (101, 158) | −1 (−15, 12) | |
| Hypersensitive | 141 (108, 174) | 135 (102, 169) | −6 (−31, 20) | |
| Moderately sensitive | 140 (109, 171) | 133 (100, 165) | −7 (−32, 18) | |
| Hyposensitive | 111 (76, 145) | 120 (88, 153) | 9 (−15, 34) | |
© 2020 by the authors. Licensee MDPI, Basel, Switzerland. This article is an open access article distributed under the terms and conditions of the Creative Commons Attribution (CC BY) license (http://creativecommons.org/licenses/by/4.0/).
Share and Cite
Costanzo, A.; Russell, C.G.; Lewin, S.; Keast, R. A Fatty Acid Mouth Rinse Decreases Self-Reported Hunger and Increases Self-Reported Fullness in Healthy Australian Adults: A Randomized Cross-Over Trial. Nutrients 2020, 12, 678. https://doi.org/10.3390/nu12030678
Costanzo A, Russell CG, Lewin S, Keast R. A Fatty Acid Mouth Rinse Decreases Self-Reported Hunger and Increases Self-Reported Fullness in Healthy Australian Adults: A Randomized Cross-Over Trial. Nutrients. 2020; 12(3):678. https://doi.org/10.3390/nu12030678
Chicago/Turabian StyleCostanzo, Andrew, Catherine G. Russell, Simone Lewin, and Russell Keast. 2020. "A Fatty Acid Mouth Rinse Decreases Self-Reported Hunger and Increases Self-Reported Fullness in Healthy Australian Adults: A Randomized Cross-Over Trial" Nutrients 12, no. 3: 678. https://doi.org/10.3390/nu12030678
APA StyleCostanzo, A., Russell, C. G., Lewin, S., & Keast, R. (2020). A Fatty Acid Mouth Rinse Decreases Self-Reported Hunger and Increases Self-Reported Fullness in Healthy Australian Adults: A Randomized Cross-Over Trial. Nutrients, 12(3), 678. https://doi.org/10.3390/nu12030678