Total Sugar Intake and Macro and Micronutrients in Children Aged 6–8 Years: The ANIVA Study

 ,
, 
 and
and
Abstract
1. Introduction
2. Materials and Methods
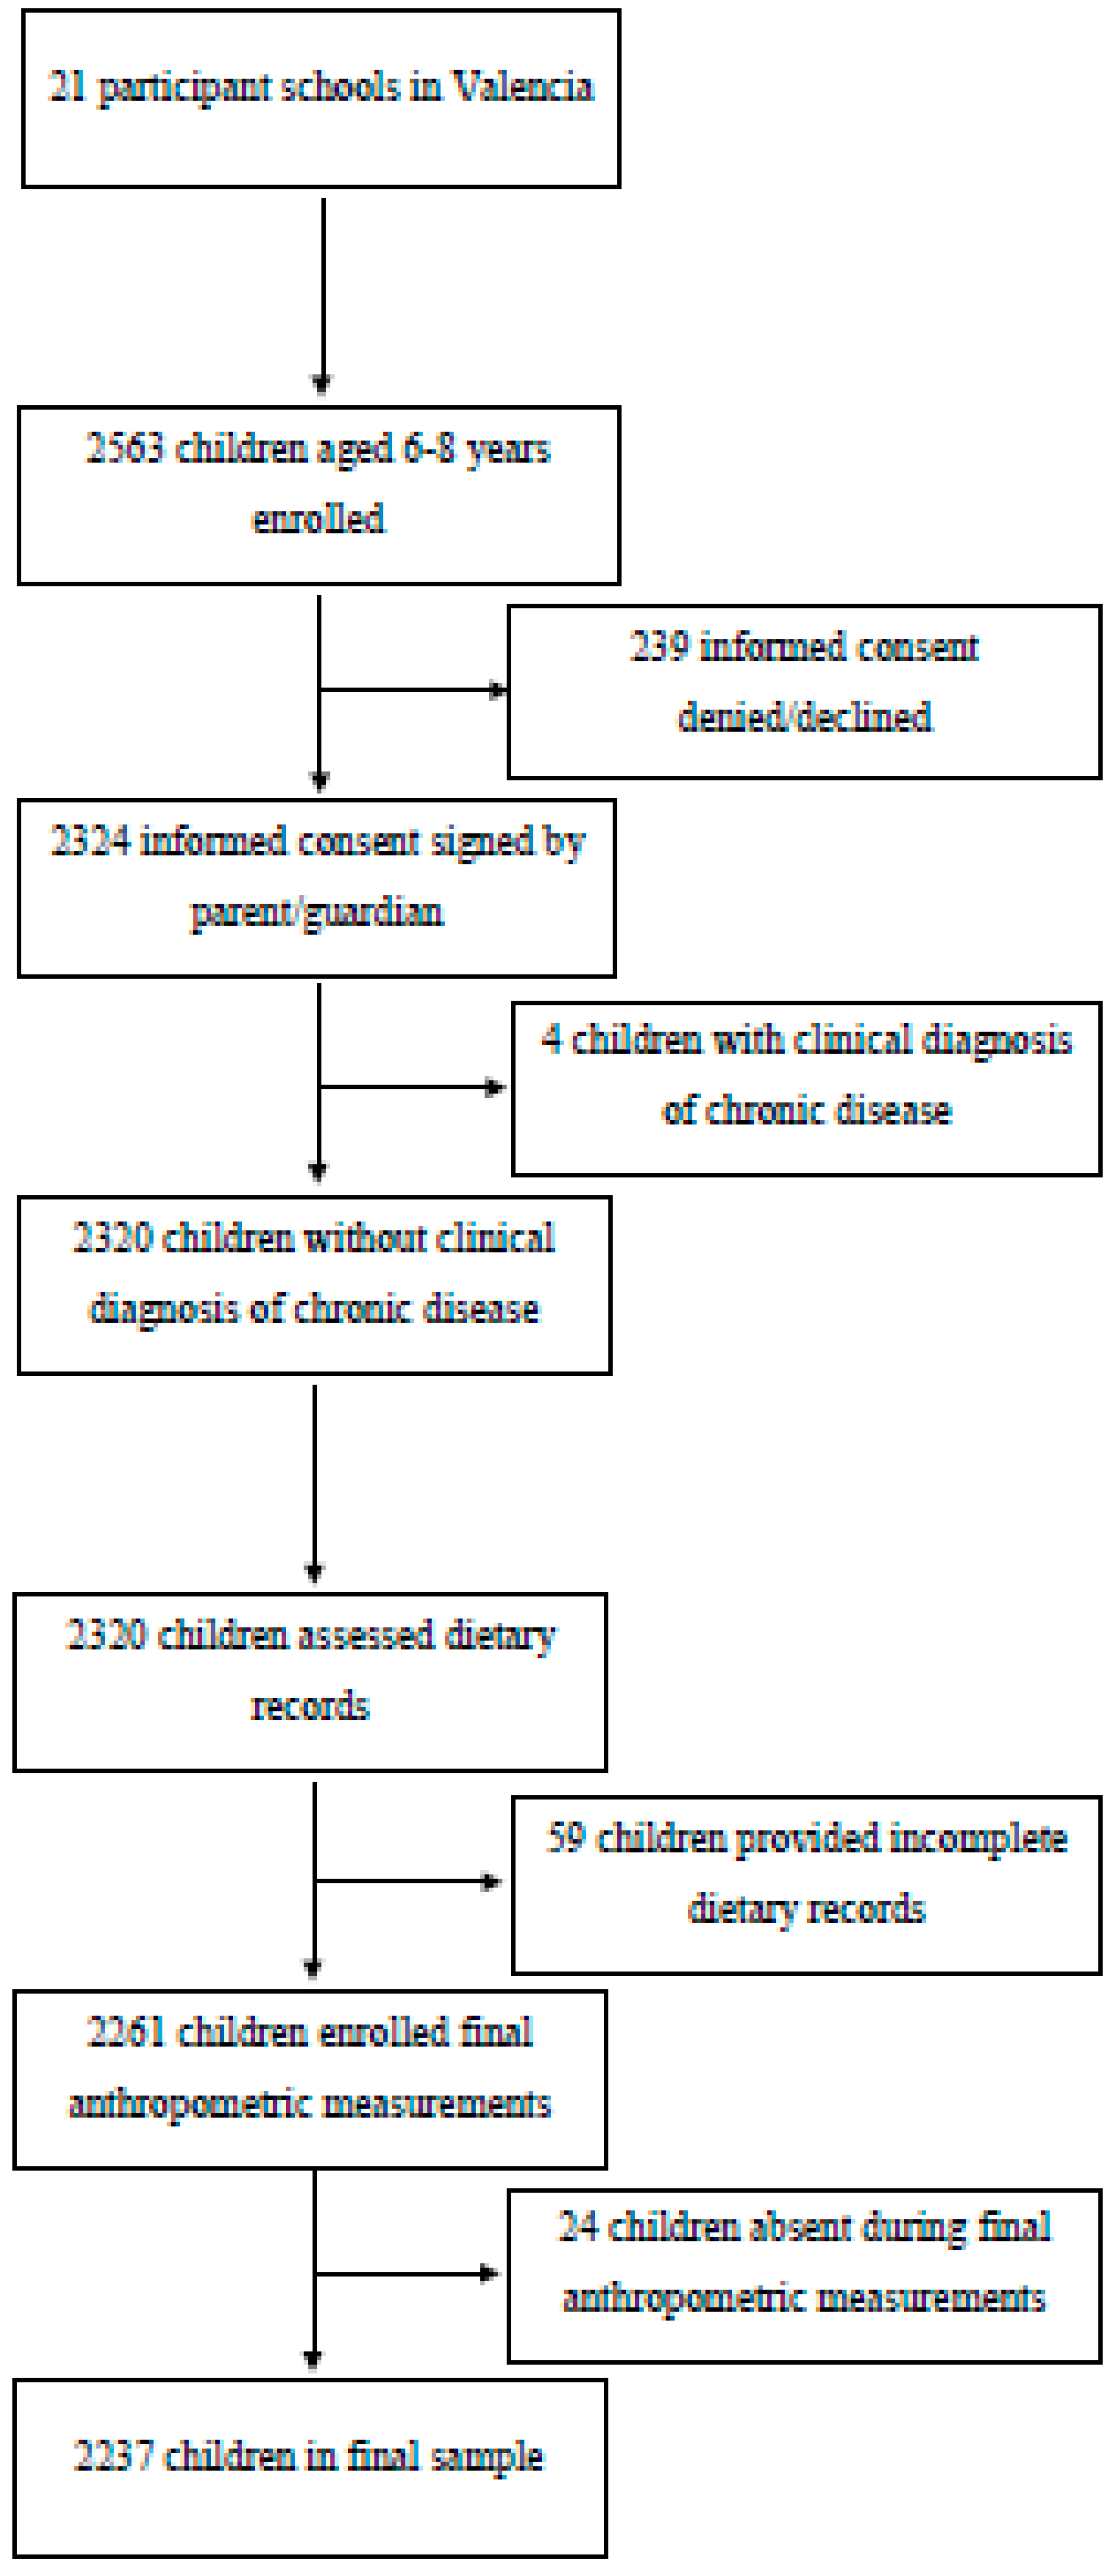
2.1. Population and Sample
2.2. Anthropometric Measures
2.3. Diet Assessment
2.4. Physical Activity
2.5. Socio-Educational Level
2.6. Statistical Analysis
3. Results
4. Discussion
Strengths and Limitations
5. Conclusions
Author Contributions
Funding
Conflicts of Interest
References
- World Health Organization. Guideline: Sugars Intake for Adults and Children; World Health Organization: Geneva, Switzerland, 2015. [Google Scholar]
- Chun, O.K.; Chung, C.E.; Wang, Y.; Padgitt, A.; Song, W.O. Changes in intakes of total and added sugar and their contribution to energy intake in the US. Nutrients 2010, 2, 834–854. [Google Scholar] [CrossRef]
- Wittekind, A.; Walton, J. Worldwide trends in dietary sugars intake. Nutr. Res. Rev. 2014, 27, 330–345. [Google Scholar] [CrossRef]
- Rippe, J.M.; Angelopoulos, T.J. Sucrose, high-fructose corn syrup, and fructose, their metabolism and potential health effects: What do we really know? Adv. Nutr. 2013, 4, 236–245. [Google Scholar] [CrossRef]
- Lustig, R.H.; Schmidt, L.A.; Brindis, C.D. Public health: The toxic truth about sugar. Nature 2012, 482, 27. [Google Scholar] [CrossRef]
- St-Onge, M.; Keller, K.L.; Heymsfield, S.B. Changes in childhood food consumption patterns: A cause for concern in light of increasing body weights. Am. J. Clin. Nutr. 2003, 78, 1068–1073. [Google Scholar] [CrossRef]
- Goldfein, K.R.; Slavin, J.L. Why sugar is added to food: Food science 101. Compr. Rev. Food Sci. Food Saf. 2015, 14, 644–656. [Google Scholar] [CrossRef]
- Spillane, W.J. Optimising Sweet Taste in Foods; CRC Press: Boca Raton, FL, USA, 2006. [Google Scholar]
- Varzakas, T.; Labropoulos, A.; Anestis, S. Sweeteners: Nutritional Aspects, Applications, and Production Technology; CRC Press: Boca Raton, FL, USA, 2012. [Google Scholar]
- Kitts, D.D. Sucrose: From Field to Table. Carbohydrate News. 2010. Available online: http://www.sugar.ca/SUGAR/media/Sugar-Main/News/CarboNews2010.pdf (accessed on 9 September 2019).
- Faruque, S.; Tong, J.; Lacmanovic, V.; Agbonghae, C.; Minaya, D.M.; Czaja, K. The dose makes the poison: Sugar and obesity in the United States—A review. Pol. J. Food Nutr. Sci. 2019, 69, 219–223. [Google Scholar] [CrossRef]
- Vos, M.B.; Kaar, J.L.; Welsh, J.A.; Van Horn, L.V.; Feig, D.I.; Anderson, C.A.M.; Patel, M.J.; Cruz Munos, J.; Krebs, N.F.; Xanthakos, S.A.; et al. Added sugars and cardiovascular disease risk in children: A scientific statement from the American Heart Association. Circulation 2017, 135, e1017–e1034. [Google Scholar] [CrossRef]
- Malik, V.S.; Popkin, B.M.; Bray, G.A.; Despres, J.P.; Willett, W.C.; Hu, F.B. Sugar-sweetened beverages and risk of metabolic syndrome and type 2 diabetes: A meta-analysis. Diabetes Care 2010, 33, 2477–2483. [Google Scholar] [CrossRef]
- Lamb, M.M.; Frederiksen, B.; Seifert, J.A.; Kroehl, M.; Rewers, M.; Norris, J.M. Sugar intake is associated with progression from islet autoimmunity to type 1 diabetes: The diabetes autoimmunity study in the young. Diabetologia 2015, 58, 2027–2034. [Google Scholar] [CrossRef]
- Kynde, I.; Johnsen, N.F.; Wedderkopp, N.; Bygbjerg, I.C.; Helge, J.W.; Heitmann, B.L. Intake of total dietary sugar and fibre is associated with insulin resistance among Danish 8–10-and 14–16-year-old girls but not boys. European Youth Heart Studies I and II. Public Health Nutr. 2010, 13, 1669–1674. [Google Scholar]
- Joint WHO/FAO Expert Consultation on Diet, Nutrition and the Prevention of Chronic Diseases. Diet, Nutrition, and the Prevention of Chronic Diseases: WHO Technical Report Series 916; WHO: Geneva, Switzerland, 2002. [Google Scholar]
- Te Morenga, L.; Mallard, S.; Mann, J. Dietary sugars and body weight: Systematic review and meta-analyses of randomised controlled trials and cohort studies. BMJ 2012, 346, e7492. [Google Scholar]
- Fattore, E.; Botta, F.; Agostoni, C.; Bosetti, C. Effects of free sugars on blood pressure and lipids: A systematic review and meta-analysis of nutritional isoenergetic intervention trials. Am. J. Clin. Nutr. 2016, 105, 42–56. [Google Scholar] [CrossRef]
- Tsilas, C.S.; de Souza, R.J.; Mejia, S.B.; Mirrahimi, A.; Cozma, A.I.; Jayalath, V.H.; Ha, V.; Tawfik, R.; Di Buono, M.; Jenkins, A.L.; et al. Relation of total sugars, fructose and sucrose with incident type 2 diabetes: A systematic review and meta-analysis of prospective cohort studies. CMAJ 2017, 189, E711–E720. [Google Scholar]
- Ha, V.; Sievenpiper, J.L.; de Souza, R.J.; Chiavaroli, L.; Wang, D.D.; Cozma, A.I.; Mirrahimi, A.; Yu, M.E.; Carleton, A.J.; Dibuono, M. Effect of fructose on blood pressure: A systematic review and meta-analysis of controlled feeding trials. Hypertension 2012, 59, 787–795. [Google Scholar]
- Church, T.S.; Thomas, D.M.; Tudor-Locke, C.; Katzmarzyk, P.T.; Earnest, C.P.; Rodarte, R.Q.; Martin, C.K.; Blair, S.N.; Bouchard, C. Trends over 5 decades in US occupation-related Physical activity and their associations with obesity. PLoS ONE 2011, 6, e19657. [Google Scholar]
- National Health Service. How Does SUGAR in Our Diet Affect Our Health? 2017. Available online: https://www.nhs.uk/live-well/eat-well/how-does-sugar-in-our-diet-affect-our-health/ (accessed on 9 September 2019).
- The European Parliament and the Council of the European Union. Regulation (EU) no 1169/2011 of the European Parliament and of the Council of 25 October 2011 on the Provision of Food Information to Consumers. Off. J. Eur. Union 2011, 54, L304/1–L304/88.
- Scientific Advisory Committee on Nutrition. Adoption of Children’s Reference Intakes for Labelling Purposes; 2013. Available online: https://web.archive.org/web/20140714150423/http://www.sacn.gov.uk/pdfs/sacn1305_childrens_ris.pdf (accessed on 17 November 2019).
- Herbert, J.; Department of Health of the United Kingdom. Update on Children’s Reference Intakes. 2013. Available online: https://assets.publishing.service.gov.uk/government/uploads/system/uploads/attachment_data/file/267822/Childrens_RIs.pdf (accessed on 3 June 2019).
- Federación Española de Sociedades de Nutrición, Alimentación y Dietética (FESNAD). Ingestas Dietéticas De Referencia (IDR) Para La Población Española, 2010. Act. Dietética 2010, 14, 196–197. [Google Scholar] [CrossRef]
- Aranceta Bartrina, J.; Arija Val, V.; Maíz Aldalur, E.; Martínez de Victoria Muñoz, E.; Ortega Anta, R.M.; Pérez-Rodrigo, C.; Quiles Izquierdo, J.; Rodríguez Martín, A.; Román Viñas, B.; Salvador i Castell, G.; et al. Guías Alimentarias Para La Población Española (SENC, Diciembre 2016); La Nueva Pirámide De La Alimentación Saludable. Nutrición Hospitalaria 2016, 33, 1–48. [Google Scholar]
- Huysentruyt, K.; Laire, D.; Van Avondt, T.; De Schepper, J.; Vandenplas, Y. Energy and macronutrient intakes and adherence to dietary guidelines of infants and toddlers in Belgium. Eur. J. Nutr. 2016, 55, 1595–1604. [Google Scholar]
- Abarca-Gómez, L.; Abdeen, Z.A.; Hamid, Z.A.; Abu-Rmeileh, N.M.; Acosta-Cazares, B.; Acuin, C.; Adams, R.J.; Aekplakorn, W.; Afsana, K.; Aguilar-Salinas, C.A. Worldwide trends in body-mass index, underweight, overweight, and obesity from 1975 to 2016: A pooled analysis of 2416 population-based measurement studies in 128 9 million children, adolescents, and adults. Lancet 2017, 390, 2627–2642. [Google Scholar]
- Te Morenga, L.A.; Howatson, A.J.; Jones, R.M.; Mann, J. Dietary sugars and cardiometabolic risk: Systematic review and meta-analyses of randomized controlled trials of the effects on blood pressure and lipids. Am. J. Clin. Nutr. 2014, 100, 65–79. [Google Scholar] [PubMed]
- Ajejas Bazan, M.J.; Jimenez-Trujillo, M.I.; Warnberg, J.; Dominguez Fernandez, S.; Lopez-de-Andres, A.; Perez-Farinos, N. Prevalence of childhood overweight/obesity in Spain 1993–2011 and associated risk factors in 2011 Prevalencia de sobrepeso y obesidad infa. Nutr. Hosp. 2018, 35, 84–89. [Google Scholar] [PubMed]
- Morales-Suárez-Varela, M.; Rubio-López, N.; Ruso, C.; Llopis-Gonzalez, A.; Ruiz-Rojo, E.; Redondo, M.; Pico, Y. Anthropometric Status and Nutritional Intake in Children (6–9 Years) in Valencia (Spain): The ANIVA Study. Int. J. Environ. Res. Public Health 2015, 12, 16082–16095. [Google Scholar]
- World Health Organization. WHO Child Growth Standards: Length/Height for Age, Weight-For-Age, Weight-For-Length, Weight-For-Height and Body Mass Index-For-Age, Methods and Development; World Health Organization, 2006. Available online: https://www.who.int/childgrowth/standards/Technical_report.pdf?ua=1 (accessed on 18 June 2019).
- Department of Nutrition (UCM); Alce Ingeniería, S.L. DIAL Software for Assessing Diets and Food Calculations [computer software]. 2016. Available online: https://www.alceingenieria.net/nutricion/descarga.htm (accessed on 18 June 2019).
- Serra-Majem, L.; Ribas, L.; Ngo, J.; Ortega, R.M.; García, A.; Pérez-Rodrigo, C.; Aranceta, J. Food, Youth and the Mediterranean diet in Spain. Development of KIDMED, Mediterranean diet quality index in children and adolescents. Public Health Nutr. 2004, 7, 931–935. [Google Scholar] [PubMed]
- Alacid, F.; Vaquero-Cristobal, R.; Sanchez-Pato, A.; Muyor, J.M.; Lopez-Minarro, P.A. Habit based consumptions in the Mediterranean diet and the relationship with anthropometric parameters in young female kayakers. Nutr. Hosp. 2014, 29, 121–127. [Google Scholar]
- Dura Trave, T.; Castroviejo Gandarias, A. Adherence to a Mediterranean diet in a college population. Nutr. Hosp. 2011, 26, 602–608. [Google Scholar]
- Navarro-González, I.; López-Nicolás, R.; Rodríguez-Tadeo, A.; Ros-Berruezo, G.; Martínez-Marín, M.; Doménech-Asensi, G. Adherence to the Mediterranean diet by nursing students of Murcia (Spain). Nutr. Hosp. 2014, 30, 165–172. [Google Scholar]
- Rodriguez, F.; Palma, X.; Romo, A.; Escobar, D.; Aragu, B.; Espinoza, L.; McMillan, N.; Galvez, J. Eating habits, physical activity and socioeconomic level in university students of Chile. Nutr. Hosp. 2013, 28, 447–455. [Google Scholar]
- San Mauro-Martin, I.; Onrubia-Gonzalez-De la Aleja, J.; Garicano-Vilar, E.; Cadenato-Ruiz, C.; Hernandez-Villa, I.; Rodriguez-Alonso, P.; Pina-Ordunez, D.; Fortunez-Garrido, E.; Villacorta-Perez, P.; Sanz-Guisado, C.; et al. Analysis of the nutritional status and body composition of persons with intellectual disability. Rev. Neurol. 2016, 62, 493–501. [Google Scholar]
- Štefan, L.; Prosoli, R.; Juranko, D.; Čule, M.; Milinović, I.; Novak, D.; Sporiš, G. The Reliability of the Mediterranean Diet Quality Index (KIDMED) Questionnaire. Nutrients 2017, 9, 419. [Google Scholar] [CrossRef] [PubMed]
- Ministerio de Sanidad, Servicios Sociales e Igualdad. Encuesta Nacional De Salud. España 2011/12. Actividad Física, Descanso Y Ocio. Serie Informes Monográficos Nº 4. 2014. Available online: https://www.mscbs.gob.es/estadEstudios/estadisticas/encuestaNacional/encuestaNac2011/informesMonograficos/Act_fis_desc_ocio.4.pdf (accessed on 4 March 2019).
- World Health Organization Regional Office for Europe, European Commission. Spain, Physical Activity Factsheet. 2018. Available online: http://www.euro.who.int/__data/assets/pdf_file/0008/382580/spain-eng.pdf?ua=1 (accessed on 19 June 2019).
- Ruiz, E.; Rodriguez, P.; Valero, T.; Ávila, J.; Aranceta-Bartrina, J.; Gil, Á.; González-Gross, M.; Ortega, R.; Serra-Majem, L.; Varela-Moreiras, G. Dietary intake of individual (free and intrinsic) sugars and food sources in the Spanish population: Findings from the ANIBES study. Nutrients 2017, 9, 275. [Google Scholar] [CrossRef] [PubMed]
- Ruiz, E.; Ávila, J.M.; Valero, T.; del Pozo, S.; Rodriguez, P.; Aranceta-Bartrina, J.; Gil, Á.; González-Gross, M.; Ortega, R.M.; Serra-Majem, L. Energy intake, profile, and dietary sources in the Spanish population: Findings of the ANIBES study. Nutrients 2015, 7, 4739–4762. [Google Scholar] [CrossRef] [PubMed]
- Ruiz, E.; Varela-Moreiras, G. Adecuación de la ingesta de azúcares totales Y añadidos en la dieta española a las recomendaciones: Estudio ANIBES. Nutr. Hosp. 2017, 34, 45–52. [Google Scholar] [CrossRef] [PubMed]
- Newens, K.; Walton, J. A Review of Sugar Consumption from Nationally Representative Dietary Surveys Across the World. J. Hum. Nutr. Diet. 2016, 29, 225–240. [Google Scholar] [CrossRef]
- Svensson, Å.; Larsson, C.; Eiben, G.; Lanfer, A.; Pala, V.; Hebestreit, A.; Huybrechts, I.; Fernández-Alvira, J.; Russo, P.; Koni, A. European children’s sugar intake on weekdays versus weekends: The IDEFICS Study. Eur. J. Clin. Nutr. 2014, 68, 822. [Google Scholar] [CrossRef]
- Langlois, K.; Garriguet, D. Sugar Consumption among Canadians of all Ages. Health Rep. 2011, 22, 23. [Google Scholar]
- Marinho, A.R.; Severo, M.; Correia, D.; Lobato, L.; Vilela, S.; Oliveira, A.; Ramos, E.; Torres, D.; Lopes, C.; IAN-AF Consortium. Total, added and free sugar intakes, dietary sources and determinants of consumption in Portugal: The national food, nutrition and physical activity survey (IAN-AF 2015–2016). Public Health Nutr. 2019, 1–13. [Google Scholar] [CrossRef]
- Sluik, D.; van Lee, L.; Engelen, A.; Feskens, E. Total, free, and added sugar consumption and adherence to guidelines: The Dutch national food consumption survey 2007–2010. Nutrients 2016, 8, 70. [Google Scholar] [CrossRef]
- Azaïs-Braesco, V.; Sluik, D.; Maillot, M.; Kok, F.; Moreno, L.A. A Review of Total & Added Sugar Intakes and Dietary Sources in Europe. Nutr. J. 2017, 16, 6. [Google Scholar]
- Health Canada. Do Canadian Children Meet Their Nutrient Requirements through Food Intake Alone? Health Canada 2012. Available online: https://www.canada.ca/en/health-canada/services/food-nutrition/food-nutrition-surveillance/health-nutrition-surveys/canadian-community-health-survey-cchs/canadian-children-meet-their-nutrient-requirements-through-food-intake-alone-health-canada-2012.html (accessed on 18 October 2019).
- Börnhorst, C.; Huybrechts, I.; Hebestreit, A.; Krogh, V.; De Decker, A.; Barba, G.; Moreno, L.; Lissner, L.; Tornaritis, M.; Loit, H. Usual Energy and Macronutrient Intakes in 2–9-Year-Old European Children. Int. J. Obes. 2014, 38, S115. [Google Scholar] [CrossRef] [PubMed]
- Kliegman, R.; St. Geme, J. Nelson Textbook of Pediatrics, 21st ed.; Elsevier Health Sciences: Philadelphia, PA, USA, 2019. [Google Scholar]
- López-Sobaler, A.M.; Aparicio, A.; González-Rodríguez, L.G.; Cuadrado-Soto, E.; Rubio, J.; Marcos, V.; Sanchidrián, R.; Santos, S.; Pérez-Farinós, N.; Dal Re, M.Á. Adequacy of usual vitamin and mineral intake in Spanish children and adolescents: ENALIA Study. Nutrients 2017, 9, 131. [Google Scholar] [CrossRef] [PubMed]
- Louie, J.C.Y.; Tapsell, L.C. Intake of total and added sugars and nutrient dilution in Australian children and adolescents. Br. J. Nutr. 2015, 114, 1875–1886. [Google Scholar] [CrossRef] [PubMed]
- Moshtaghian, H.; Louie, J.C.Y.; Charlton, K.E.; Probst, Y.C.; Gopinath, B.; Mitchell, P.; Flood, V.M. Added sugar intake that exceeds current recommendations is associated with nutrient dilution in older Australians. Nutrition 2016, 32, 937–942. [Google Scholar] [CrossRef]
- Louie, J.C.Y.; Tapsell, L.C. Association between intake of total vs added sugar on diet quality: A systematic review. Nutr. Rev. 2015, 73, 837–857. [Google Scholar] [CrossRef]
- Malik, V.S.; Schulze, M.B.; Hu, F.B. Intake of sugar-sweetened beverages and weight gain: A systematic review. Am. J. Clin. Nutr. 2006, 84, 274–288. [Google Scholar] [CrossRef]
- Stern, D.; Middaugh, N.; Rice, M.S.; Laden, F.; López-Ridaura, R.; Rosner, B.; Willett, W.; Lajous, M. Changes in sugar-sweetened soda consumption, weight, and waist circumference: 2-year cohort of Mexican women. Am. J. Public Health 2017, 107, 1801–1808. [Google Scholar] [CrossRef]
- Laverty, A.A.; Magee, L.; Monteiro, C.A.; Saxena, S.; Millett, C. Sugar and artificially sweetened beverage consumption and adiposity changes: National longitudinal study. Int. J. Behav. Nutr. Phys. Act. 2015, 12, 137. [Google Scholar] [CrossRef]
- Bigornia, S.J.; LaValley, M.P.; Noel, S.E.; Moore, L.L.; Ness, A.R.; Newby, P. Sugar-sweetened beverage consumption and central and total adiposity in older children: A prospective study accounting for dietary reporting errors. Public Health Nutr. 2015, 18, 1155–1163. [Google Scholar] [CrossRef]
- Hall, K.D.; Guo, J. Obesity energetics: Body weight regulation and the effects of diet composition. Gastroenterology 2017, 152, 1718–1727.e3. [Google Scholar] [CrossRef]
- Westman, E.C.; Feinman, R.D.; Mavropoulos, J.C.; Vernon, M.C.; Volek, J.S.; Wortman, J.A.; Yancy, W.S.; Phinney, S.D. Low-carbohydrate nutrition and metabolism. Am. J. Clin. Nutr. 2007, 86, 276–284. [Google Scholar] [CrossRef]
- Schwarz, J.; Noworolski, S.M.; Wen, M.J.; Dyachenko, A.; Prior, J.L.; Weinberg, M.E.; Herraiz, L.A.; Tai, V.W.; Bergeron, N.; Bersot, T.P. Effect of a high-fructose weight-maintaining diet on lipogenesis and liver fat. J. Clin. Endocrinol. Metab. 2015, 100, 2434–2442. [Google Scholar] [CrossRef] [PubMed]
- Lim, J.S.; Mietus-Snyder, M.; Valente, A.; Schwarz, J.; Lustig, R.H. The role of fructose in the pathogenesis of NAFLD and the metabolic syndrome. Nat. Rev. Gastroenterol. Hepatol. 2010, 7, 251. [Google Scholar] [CrossRef] [PubMed]
- Jackson, R.; Lawes, C.M.; Bennett, D.A.; Milne, R.J.; Rodgers, A. Treatment with drugs to lower blood pressure and blood cholesterol based on an individual’s absolute cardiovascular risk. Lancet 2005, 365, 434–441. [Google Scholar] [CrossRef]
- Morales-Suárez-Varela, M.; Mohino-Chocano, M.; Soler, C.; Llopis-Morales, A.; Peraita-Costa, I.; Llopis-González, A. Prevalencia de hipertensión arterial y su asociación con antropometría y dieta en niños (de seis a nueve años): Estudio ANIVA. Nutr. Hosp. 2019, 36, 133–141. [Google Scholar] [PubMed]
- Khan, T.A.; Tayyiba, M.; Agarwal, A.; Mejia, S.B.; de Souza, R.J.; Wolever, T.M.; Leiter, L.A.; Kendall, C.W.; Jenkins, D.J.; Sievenpiper, J.L. Relation of total sugars, sucrose, fructose, and added sugars with the risk of cardiovascular disease: A systematic review and dose-response meta-analysis of prospective cohort studies. Mayo Clin. Proc. 2019, 94, 2399–2414. [Google Scholar] [CrossRef]
- Pawellek, I.; Grote, V.; Theurich, M.; Closa-Monasterolo, R.; Stolarczyk, A.; Verduci, E.; Xhonneux, A.; Koletzko, B. Factors associated with sugar intake and sugar sources in EUROPEAN children from 1 to 8 years of age. Eur. J. Clin. Nutr. 2017, 71, 25. [Google Scholar] [CrossRef]
- Xie, B.; Gilliland, F.D.; Li, Y.; Rockett, H.R. Effects of ethnicity, family income, and education on dietary intake among adolescents. Prev. Med. 2003, 36, 30–40. [Google Scholar] [CrossRef]
- Thompson, F.E.; McNeel, T.S.; Dowling, E.C.; Midthune, D.; Morrissette, M.; Zeruto, C.A. Interrelationships of added sugars intake, socioeconomic status, and race/ethnicity in adults in the United States: National health interview survey, 2005. J. Am. Diet. Assoc. 2009, 109, 1376–1383. [Google Scholar] [CrossRef]
- Lobstein, T.; Baur, L.; Uauy, R. Obesity in children and young people: A crisis in public health. Obes. Rev. 2004, 5, 4–85. [Google Scholar] [CrossRef]
- McLaren, L. Socioeconomic Status and Obesity. Epidemiol. Rev. 2007, 29, 29–48. [Google Scholar] [CrossRef] [PubMed]
- Drewnowski, A. The real contribution of added sugars and fats to obesity. Epidemiol. Rev. 2007, 29, 160–171. [Google Scholar] [CrossRef] [PubMed]
- Popkin, B.M.; Nielsen, S.J. The Sweetening of the World’s Diet. Obes. Res. 2003, 11, 1325–1332. [Google Scholar] [CrossRef] [PubMed]
- Drewnowski, A.; Specter, S.E. Poverty and Obesity: The Role of Energy Density and Energy Costs. Am. J. Clin. Nutr. 2004, 79, 6–16. [Google Scholar] [CrossRef] [PubMed]
- Drewnowski, A.; Darmon, N. The Economics of Obesity: Dietary Energy Density and Energy Cost. Am. J. Clin. Nutr. 2005, 82, 265S–273S. [Google Scholar] [CrossRef] [PubMed]
- Andrieu, E.; Darmon, N.; Drewnowski, A. Low-Cost Diets: More Energy, Fewer Nutrients. Eur. J. Clin. Nutr. 2006, 60, 434. [Google Scholar] [CrossRef]


| Participants | Total Sugar Intake (g) | ||||||||||||
|---|---|---|---|---|---|---|---|---|---|---|---|---|---|
| Mean | Median | SD | IQR | Minimum | Maximum | P5 | P10 | P25 | P50 | P75 | P90 | P95 | |
| Total (n = 2237) | 93.77 | 91.85 | 25.72 | 32.10 | 24.60 | 348.00 | 55.40 | 63.80 | 76.90 | 91.85 | 109.00 | 125.00 | 136.00 |
| Boys (n = 1098) | 96.24 | 94.90 | 24.34 | 32.10 | 24.60 | 250.00 | 58.28 | 66.94 | 79.90 | 94.90 | 112.00 | 127.00 | 138.00 |
| Girls (n = 1139) | 91.38 | 88.80 | 26.78 | 31.50 | 25.10 | 348.00 | 53.02 | 61.30 | 74.50 | 88.80 | 106.00 | 122.00 | 133.00 |
| Sugars | Total (n = 2237) | Boys (n = 1098) | Girls (n = 1139) | p-Value *a | |||||||||
|---|---|---|---|---|---|---|---|---|---|---|---|---|---|
| Mean | SD | Minimum | Maximum | Mean | SD | Minimum | Maximum | Mean | SD | Minimum | Maximum | ||
| Total sugar intake (g) | 93.77 | 25.72 | 24.60 | 348.00 | 96.24 | 24.34 | 24.60 | 250.00 | 91.38 | 26.78 | 25.10 | 348.00 | <0.001 |
| Glucose (g) | 8.10 | 4.40 | 0.00 | 43.40 | 8.46 | 4.46 | 0.18 | 35.10 | 7.75 | 4.31 | 0.00 | 43.40 | <0.001 |
| Fructose (g) | 11.04 | 6.10 | 0.00 | 56.30 | 11.55 | 6.24 | 0.14 | 45.30 | 10.55 | 5.93 | 0.00 | 56.30 | <0.001 |
| Galactose (g) | 0.16 | 0.35 | 0.00 | 3.10 | 0.16 | 0.34 | 0.00 | 2.20 | 0.16 | 0.35 | 0.00 | 3.10 | 1.000 |
| Sucrose (g) | 22.70 | 13.33 | 0.09 | 276.00 | 23.30 | 11.28 | 0.35 | 133.00 | 22.12 | 15.04 | 0.09 | 276.00 | 0.036 |
| Maltose (g) | 0.13 | 0.25 | 0.00 | 2.80 | 0.13 | 0.25 | 0.00 | 2.40 | 0.14 | 0.25 | 0.00 | 2.80 | 0.344 |
| Lactose (g) | 14.58 | 7.29 | 0.00 | 68.40 | 14.94 | 7.10 | 0.00 | 55.60 | 14.23 | 7.46 | 0.00 | 68.40 | 0.021 |
| Characteristics | Simple Sugars Intake (93.77 ± 25.72 g) | ||||||||
|---|---|---|---|---|---|---|---|---|---|
| Boys (n = 1098) | Girls (n = 1139) | ||||||||
| Simple Sugars Intake (96.24 ± 24.34 g) | Simple Sugars Intake (91.38 ± 26.78 g) | ||||||||
| P25 (<79.9 g) (n = 276) | P25–P75 (79.9–112.0 g) (n = 542) | P75 (>112.0 g) (n = 280) | p-Value *a | P25 (<74.5 g)(n = 324) | P25–P75 (74.5–106.0 g) (n = 526) | P75 (>106.0 g) (n = 289) | p-Value *b | p-Value *c | |
| % | % | % | % | % | % | ||||
| Fathers’ educational level | |||||||||
| Low | 31.4 | 28.0 | 20.0 | ˂0.001 | 31.5 | 28.5 | 20.6 | 0.017 | ˂0.001 |
| Average | 36.4 | 34.6 | 28.5 | ˂0.001 | 30.5 | 33.8 | 32.1 | 0.016 | ˂0.001 |
| High | 32.2 | 37.5 | 51.5 | ˂0.001 | 38.0 | 37.7 | 47.3 | 0.003 | 0.025 |
| Mothers’ educational level | |||||||||
| Low | 18.7 | 11.1 | 8.2 | ˂0.001 | 17.3 | 16.8 | 11.6 | 0.025 | ˂0.001 |
| Average | 39.3 | 35.9 | 26.8 | ˂0.001 | 35.0 | 32.3 | 27.9 | 0.023 | ˂0.001 |
| High | 42.1 | 52.9 | 65.1 | ˂0.001 | 47.7 | 50.9 | 60.5 | 0.003 | 0.194 |
| Level of physical activity | |||||||||
| Inadequate | 14.3 | 14.6 | 10.4 | 0.233 | 22.3 | 21.1 | 23.2 | 0.778 | ˂0.001 |
| Adequate | 85.7 | 85.4 | 89.6 | 0.233 | 77.7 | 78.9 | 76.8 | 0.778 | ˂0.001 |
| Mediterranean diet adherence | |||||||||
| Low | 7.5 | 6.5 | 4.1 | 0.172 | 3.7 | 5.1 | 4.4 | 0.623 | 0.189 |
| Average | 46.3 | 43.7 | 42.3 | 0.594 | 36.6 | 43.4 | 48.4 | 0.013 | 0.073 |
| Optimum | 46.3 | 49.8 | 53.6 | 0.236 | 59.8 | 51.5 | 47.3 | 0.006 | 0.010 |
| Characteristics | % of Total Energy from Sugar (21.07 ± 12.09%) | ||||||||
|---|---|---|---|---|---|---|---|---|---|
| Boys (n = 1098) | Girls (n = 1139) | ||||||||
| % of Total Energy from Sugar (21.15 ± 11.90%) | % of Total Energy from Sugar (20.99 ± 12.26%) | ||||||||
| P25 (<14.99%) (n = 274) | P25–P75 (14.99%–21.17%) (n = 549) | P75 (>21.17%) (n = 275) | p-Value *a | P25 (<14.61%) (n = 284) | P25–P75 (14.61%–20.90%) (n = 570) | P75 (>20.90%) (n = 285) | p-Value *b | p-Value *c | |
| % | % | % | % | % | % | ||||
| Fathers’ educational level | |||||||||
| Low | 32.4 | 27.0 | 28.7 | 0.257 | 31.9 | 27.7 | 28.3 | 0.411 | 0.479 |
| Average | 34.6 | 34.2 | 34.3 | 0.991 | 35.1 | 33.9 | 34.6 | 0.918 | 0.999 |
| High | 33.1 | 38.8 | 36.9 | 0.293 | 33.0 | 38.4 | 37.1 | 0.311 | 0.442 |
| Mothers’ educational level | |||||||||
| Low | 16.7 | 13.6 | 15.2 | 0.480 | 16.3 | 14.1 | 14.4 | 0.693 | 0.818 |
| Average | 38.0 | 34.3 | 34.2 | 0.533 | 38.7 | 34.0 | 35.1 | 0.396 | 0.679 |
| High | 45.3 | 52.1 | 50.6 | 0.177 | 45.0 | 51.8 | 50.6 | 0.176 | 0.225 |
| Level of physical activity | |||||||||
| Inadequate | 17.7 | 17.3 | 17.1 | 0.968 | 18.3 | 16.8 | 18.3 | 0.700 | 0.994 |
| Adequate | 82.3 | 82.7 | 82.9 | 0.968 | 81.7 | 83.2 | 81.7 | 0.700 | 0.994 |
| Mediterranean diet adherence | |||||||||
| Low | 4.9 | 5.6 | 6.0 | 0.828 | 4.7 | 5.6 | 6.1 | 0.742 | 0.965 |
| Average | 45.6 | 42.4 | 41.6 | 0.575 | 44.9 | 42.4 | 43.1 | 0.767 | 0.894 |
| Optimum | 49.5 | 52.1 | 52.4 | 0.763 | 50.3 | 52.0 | 50.8 | 0.899 | 0.979 |
| Characteristics | Simple Sugars Intake (93.77 ± 25.72 g) | ||||||||||||||
|---|---|---|---|---|---|---|---|---|---|---|---|---|---|---|---|
| Boys (n = 1098) | Girls (n = 1139) | ||||||||||||||
| Simple Sugars Intake (96.24 ± 24.34 g) | Simple Sugars Intake (91.38 ± 26.78 g) | ||||||||||||||
| P25 (<79.9 g) (n = 276) | P25–P75 (79.9–112.0 g) (n = 542) | P75 (>112.0 g) (n = 280) | p-Value *a | P25 (<74.5 g) (n = 324) | P25–P75 (74.5–106.0 g) (n = 526) | P75 (>106.0 g) (n = 289) | p-Value *b | p-Value *c | |||||||
| Mean | SD | Mean | SD | Mean | SD | Mean | SD | Mean | SD | Mean | SD | ||||
| Age (years) | 7.31 | 1.04 | 7.24 | 1.01 | 7.44 | 1.03 | 0.026 | 7.34 | 1.03 | 7.29 | 1.02 | 7.32 | 1.03 | 0.826 | 0.178 |
| Weight (kg) | 29.15 | 7.98 | 28.74 | 6.92 | 29.31 | 7.16 | 0.518 | 29.46 | 7.50 | 28.81 | 7.05 | 28.27 | 6.95 | 0.117 | 0.332 |
| Weight z-score | 2.54 | 11.61 | 1.15 | 4.24 | 0.79 | 1.08 | 0.003 | 1.78 | 8.64 | 0.91 | 2.33 | 0.77 | 2.32 | 0.018 | 0.001 |
| Height (m) | 1.28 | 0.08 | 1.28 | 0.08 | 1.29 | 0.08 | 0.605 | 1.29 | 0.08 | 1.28 | 0.08 | 1.27 | 0.08 | 0.183 | 0.306 |
| Height z-score | 1.91 | 9.86 | 1.05 | 5.18 | 0.55 | 1.01 | 0.030 | 1.40 | 8.06 | 1.04 | 5.76 | 0.75 | 4.13 | 0.424 | 0.120 |
| BMI | 17.41 | 3.20 | 17.04 | 2.56 | 17.25 | 2.57 | 0.173 | 17.58 | 2.95 | 17.26 | 2.85 | 17.01 | 2.57 | 0.042 | 0.057 |
| BMI z-score | 2.27 | 13.14 | 0.88 | 4.10 | 0.66 | 1.14 | 0.013 | 1.54 | 7.91 | 0.68 | 1.75 | 0.54 | 1.41 | 0.007 | 0.002 |
| Waist (cm) | 60.43 | 9.65 | 61.28 | 6.84 | 61.02 | 7.62 | 0.397 | 61.41 | 7.75 | 60.78 | 7.13 | 59.32 | 7.59 | 0.002 | 0.007 |
| Hip (cm) | 69.16 | 10.08 | 70.78 | 7.07 | 70.48 | 7.83 | 0.041 | 70.86 | 8.20 | 70.07 | 8.39 | 69.28 | 7.82 | 0.083 | 0.039 |
| Waist/hip Index | 0.87 | 0.05 | 0.86 | 0.56 | 1.20 | 5.48 | 0.257 | 0.89 | 0.46 | 0.87 | 0.28 | 0.85 | 0.05 | 0.312 | 0.272 |
| Fat percentage | 16.79 | 10.74 | 16.09 | 9.10 | 18.43 | 6.87 | 0.024 | 18.55 | 10.17 | 16.84 | 9.43 | 20.59 | 7.08 | 0.001 | 0.001 |
| Characteristics | % of Total Energy from Sugar (21.07 ± 12.09%) | ||||||||||||||
|---|---|---|---|---|---|---|---|---|---|---|---|---|---|---|---|
| Boys (n = 1098) | Girls (n = 1139) | ||||||||||||||
| % of Total Energy from Sugar (21.15 ± 11.90%) | % of Total Energy from Sugar (20.99 ± 12.26%) | ||||||||||||||
| P25 (<14.99%) (n = 274) | P25–P75 (14.99%–21.17%) (n = 549) | P75 (>21.17%) (n = 275) | p-Value *a | P25 (<14.61%) (n = 284) | P25–P75 (14.61%–20.90%) (n = 570) | P75 (>20.90%) (n = 285) | p-Value *b | p-Value *c | |||||||
| Mean | SD | Mean | SD | Mean | SD | Mean | SD | Mean | SD | Mean | SD | ||||
| Weight (kg) | 29.37 | 8.14 | 29.03 | 7.01 | 28.55 | 6.83 | 0.413 | 29.69 | 7.25 | 28.76 | 7.15 | 28.25 | 7.08 | 0.050 | 0.163 |
| Weight z-score | 2.17 | 10.50 | 1.33 | 5.54 | 0.81 | 1.16 | 0.049 | 1.85 | 9.24 | 0.91 | 2.25 | 0.82 | 2.36 | 0.020 | 0.010 |
| Height (m) | 1.30 | 0.09 | 1.29 | 0.08 | 1.28 | 0.08 | 0.242 | 1.30 | 0.08 | 1.29 | 0.08 | 1.27 | 0.09 | 0.005 | ˂0.001 |
| Height z-score | 1.80 | 9.75 | 1.08 | 5.29 | 0.59 | 1.10 | 0.067 | 1.88 | 10.20 | 0.83 | 1.71 | 0.64 | 1.46 | 0.038 | 0.016 |
| BMI | 17.24 | 3.05 | 17.21 | 2.70 | 17.10 | 2.49 | 0.791 | 17.39 | 2.84 | 17.29 | 2.86 | 17.21 | 2.75 | 0.755 | 0.877 |
| BMI z-score | 1.85 | 11.88 | 1.11 | 5.77 | 0.64 | 1.20 | 0.141 | 1.56 | 8.45 | 0.68 | 1.71 | 0.64 | 1.46 | 0.014 | 0.037 |
| Waist (cm) | 60.95 | 9.65 | 61.65 | 7.07 | 59.76 | 6.92 | 0.010 | 61.54 | 7.64 | 60.91 | 7.29 | 58.91 | 7.39 | 0.009 | ˂0.001 |
| Hip (cm) | 69.78 | 10.07 | 70.83 | 7.22 | 69.82 | 7.51 | 0.145 | 71.08 | 8.14 | 70.30 | 7.98 | 68.64 | 8.56 | 0.003 | 0.002 |
| Waist/hip Index | 0.87 | 0.06 | 0.87 | 0.06 | 0.96 | 2.81 | 0.232 | 0.90 | 0.48 | 0.87 | 0.05 | 0.88 | 0.31 | 0.430 | 0.862 |
| Fat percentage | 16.17 | 10.46 | 16.00 | 9.02 | 19.02 | 6.78 | ˂0.001 | 18.13 | 9.85 | 16.79 | 9.67 | 21.59 | 6.20 | ˂0.001 | ˂0.001 |
| Characteristics | % of Total Energy from Sugar (21.07% ± 12.09%) | |||||||||||
|---|---|---|---|---|---|---|---|---|---|---|---|---|
| Boys (n = 1098) | Girls (n = 1139) | |||||||||||
| % of Total Energy from Sugar (21.15% ± 11.90%) | % of Total Energy from Sugar (20.99% ± 12.26%) | |||||||||||
| P25 (<14.99%) (n = 274) | P25–P75 (14.995–21.17%) (n = 549) | P75 (>21.17%) (n = 275) | P25 (<14.61%) (n = 284) | P25–P75 (14.61%–20.90%) (n = 570) | P75 (>20.90%) (n = 285) | |||||||
| R2 | p-Value | R2 | p-Value | R2 | p-Value | R2 | p-Value | R2 | p-Value | R2 | p-Value | |
| Weight (kg) | 0.298 | 0.001 | 0.303 | 0.001 | 0.322 | 0.001 | 0.270 | 0.001 | 0.308 | 0.001 | 0.312 | 0.001 |
| Weight z-score | 0.004 | 0.664 | 0.004 | 0.959 | 0.065 | 0.007 | 0.006 | 0.462 | 0.003 | 0.919 | 0.001 | 0.421 |
| Height (m) | 0.331 | 0.001 | 0.328 | 0.001 | 0.401 | 0.001 | 0.283 | 0.001 | 0.324 | 0.001 | 0.399 | 0.001 |
| Height z-score | 0.006 | 0.818 | 0.001 | 0.366 | 0.003 | 0.317 | 0.003 | 0.232 | 0.002 | 0.643 | 0.001 | 0.289 |
| BMI | 0.079 | 0.001 | 0.084 | 0.001 | 0.099 | 0.001 | 0.055 | 0.001 | 0.089 | 0.001 | 0.094 | 0.001 |
| BMI z-score | 0.004 | 0.556 | 0.004 | 0.939 | 0.113 | 0.001 | 0.004 | 0.640 | 0.001 | 0.283 | 0.009 | 0.687 |
| Waist (cm) | 0.114 | 0.113 | 0.129 | 0.001 | 0.118 | 0.001 | 0.095 | 0.001 | 0.131 | 0.001 | 0.123 | 0.001 |
| Hip (cm) | 0.001 | 0.701 | 0.219 | 0.001 | 0.173 | 0.001 | 0.156 | 0.001 | 0.213 | 0.001 | 0.182 | 0.001 |
| Waist/hip Index | 0.016 | 0.014 | 0.020 | 0.001 | 0.001 | 0.716 | 0.007 | 0.184 | 0.015 | 0.001 | 0.001 | 0.713 |
| Fat percentage | 0.001 | 0.404 | 0.001 | 0.748 | 0.006 | 0.202 | 0.003 | 0.468 | 0.001 | 0.466 | 0.003 | 0.405 |
| Simple Sugars Intake (93.77 ± 25.72 g) | |||||||||||||||
|---|---|---|---|---|---|---|---|---|---|---|---|---|---|---|---|
| Macronutrient RDI | Boys (n = 1098) | Girls (n = 1139) | |||||||||||||
| Simple Sugars Intake (96.24 ± 24.34 g) | Simple Sugars Intake (91.38 ± 26.78 g) | ||||||||||||||
| P25 (<79.9 g) (n = 276) | P25–P75 (79.9–112.0 g) (n = 542) | P75 (>112.0 g) (n = 280) | p-value *a | P25 (<74.5 g) (n = 324) | P25–P75 (74.5–106.0 g) (n = 526) | P75 (>106.0 g) (n = 289) | p-Value *b | p-Value *c | |||||||
| Mean | SD | Mean | SD | Mean | SD | Mean | SD | Mean | SD | Mean | SD | ||||
| Energy 1500–1700 kcal | 2004.67 | 345.14 | 2270.34 | 356.60 | 2630.55 | 663.38 | ˂0.001 | 1939.44 | 328.49 | 2197.29 | 359.56 | 2540.01 | 609.11 | ˂0.001 | ˂0.001 |
| Protein 19 g | 86.96 | 21.23 | 93.35 | 18.85 | 104.04 | 38.91 | ˂0.001 | 82.99 | 21.12 | 89.54 | 18.41 | 98.12 | 24.14 | ˂0.001 | ˂0.001 |
| Carbohydrate 130 g | 202.13 | 43.85 | 233.57 | 35.58 | 281.32 | 54.39 | ˂0.001 | 191.19 | 36.83 | 222.81 | 35.02 | 269.47 | 55.52 | ˂0.001 | ˂0.001 |
| Glucose (g) | 5.95 | 2.89 | 8.76 | 4.06 | 11.85 | 5.41 | ˂0.001 | 5.41 | 2.68 | 8.09 | 3.47 | 11.40 | 6.20 | ˂0.001 | ˂0.001 |
| Fructose (g) | 8.34 | 4.33 | 11.98 | 5.88 | 15.69 | 7.32 | ˂0.001 | 7.48 | 3.94 | 11.05 | 5.02 | 15.11 | 8.20 | ˂0.001 | ˂0.001 |
| Galactose (g) | 0.05 | 0.18 | 0.19 | 0.37 | 0.23 | 0.42 | ˂0.001 | 0.08 | 0.24 | 0.17 | 0.36 | 0.28 | 0.49 | ˂0.001 | ˂0.001 |
| Lactose (g) | 11.96 | 6.06 | 15.47 | 6.27 | 18.32 | 9.24 | ˂0.001 | 11.59 | 6.28 | 14.64 | 6.65 | 18.24 | 9.80 | ˂0.001 | ˂0.001 |
| Maltose (g) | 0.08 | 0.16 | 0.15 | 0.27 | 0.18 | 0.30 | ˂0.001 | 0.08 | 0.17 | 0.15 | 0.25 | 0.21 | 0.37 | ˂0.001 | ˂0.001 |
| Sucrose (g) | 15.82 | 6.86 | 24.16 | 8.98 | 33.36 | 15.05 | ˂0.001 | 14.52 | 7.01 | 23.04 | 8.89 | 34.47 | 28.21 | ˂0.001 | ˂0.001 |
| Fiber 25 g | 16.96 | 5.67 | 19.34 | 8.17 | 21.23 | 7.03 | ˂0.001 | 15.86 | 4.55 | 18.79 | 5.28 | 21.65 | 13.41 | ˂0.001 | ˂0.001 |
| Cholesterol (mg) | 327.18 | 102.53 | 353.77 | 101.43 | 392.19 | 259.85 | ˂0.001 | 304.94 | 85.77 | 344.10 | 106.30 | 369.79 | 117.50 | ˂0.001 | ˂0.001 |
| Lipid (g) | 92.88 | 21.82 | 103.42 | 23.00 | 116.51 | 40.17 | ˂0.001 | 91.37 | 21.22 | 101.45 | 23.49 | 114.14 | 37.72 | ˂0.001 | ˂0.001 |
| SFA (g) | 30.71 | 7.24 | 34.72 | 7.68 | 38.92 | 11.12 | ˂0.001 | 29.38 | 6.89 | 33.89 | 7.74 | 39.17 | 11.87 | ˂0.001 | ˂0.001 |
| Myristic Acid (g) | 2.31 | 0.83 | 2.66 | 0.89 | 2.92 | 1.09 | ˂0.001 | 2.15 | 0.81 | 2.57 | 0.86 | 3.01 | 1.68 | ˂0.001 | ˂0.001 |
| Palmitic Acid (g) | 16.59 | 3.99 | 18.42 | 4.37 | 20.38 | 6.71 | ˂0.001 | 15.90 | 3.79 | 17.90 | 4.33 | 20.34 | 5.89 | ˂0.001 | ˂0.001 |
| Stearic Acid (g) | 6.83 | 1.78 | 7.66 | 1.99 | 8.50 | 2.78 | ˂0.001 | 6.58 | 1.78 | 7.56 | 1.99 | 8.65 | 2.48 | ˂0.001 | ˂0.001 |
| MUFA (g) | 40.88 | 11.44 | 45.42 | 12.18 | 52.32 | 23.81 | ˂0.001 | 40.25 | 11.67 | 44.61 | 12.42 | 50.85 | 22.83 | ˂0.001 | ˂0.001 |
| Palmitoleic Acid (g) | 1.51 | 0.40 | 1.66 | 0.43 | 1.74 | 0.59 | ˂0.001 | 1.45 | 0.40 | 1.60 | 0.45 | 1.72 | 0.56 | ˂0.001 | ˂0.001 |
| Oleic Acid (g) | 37.25 | 10.71 | 41.65 | 11.38 | 47.98 | 22.75 | ˂0.001 | 37.09 | 11.03 | 40.89 | 11.71 | 46.88 | 22.18 | ˂0.001 | ˂0.001 |
| PUFA (g) | 11.72 | 3.39 | 12.95 | 4.08 | 14.14 | 4.69 | ˂0.001 | 11.44 | 3.46 | 12.71 | 4.38 | 13.76 | 4.85 | ˂0.001 | ˂0.001 |
| ω-6 PUFA 10 g | 7.00 | 4.38 | 8.66 | 4.53 | 8.90 | 5.01 | ˂0.001 | 7.68 | 4.00 | 8.20 | 4.67 | 8.87 | 5.49 | ˂0.001 | ˂0.001 |
| ω-3 PUFA 0.9 g | 0.94 | 0.73 | 1.31 | 0.84 | 1.26 | 0.92 | ˂0.001 | 1.09 | 0.71 | 1.20 | 0.86 | 1.21 | 0.94 | ˂0.001 | ˂0.001 |
| Linoleic Acid 10 g | 9.41 | 2.97 | 10.37 | 3.40 | 11.35 | 3.73 | ˂0.001 | 9.28 | 3.01 | 10.24 | 3.75 | 11.16 | 4.06 | ˂0.001 | ˂0.001 |
| Linolenic Acid 0.9 g | 1.03 | 0.35 | 1.22 | 0.64 | 1.31 | 0.57 | ˂0.001 | 1.03 | 0.35 | 1.18 | 0.54 | 1.30 | 0.65 | ˂0.001 | ˂0.001 |
| Arachidonic Acid (g) | 0.17 | 0.09 | 0.18 | 0.10 | 0.16 | 0.09 | ˂0.001 | 0.15 | 0.08 | 0.17 | 0.09 | 0.17 | 0.10 | ˂0.001 | ˂0.001 |
| % of Total Energy from Sugar (21.07 ± 12.09%) | |||||||||||||||
|---|---|---|---|---|---|---|---|---|---|---|---|---|---|---|---|
| Macronutrient | Boys (n = 1098) | Girls (n = 1139) | |||||||||||||
| % of Total Energy from Sugar (21.15% ± 11.90%) | % of Total Energy from Sugar (20.99% ± 12.26%) | ||||||||||||||
| P25 (<14.99%) (n = 274) | P25–P75 (14.99%–21.17%) (n = 549) | P75 (>21.17%) (n = 275) | p-Value *a | P25 (<14.61%) (n = 284) | P25–P75 (14.61%–20.90%) (n = 570) | P75 (>20.90%) (n = 285) | p-Value *b | p-Value *c | |||||||
| Mean | SD | Mean | SD | Mean | SD | Mean | SD | Mean | SD | Mean | SD | ||||
| Energy (kcal) | 2004.67 | 345.14 | 2270.34 | 356.60 | 2236.68 | 716.33 | ˂0.001 | 1939.44 | 328.49 | 2197.29 | 359.56 | 2168.21 | 672.69 | ˂ 0.001 | ˂0.001 |
| Protein | 16.91 | 2.87 | 16.52 | 2.40 | 15.72 | 2.37 | ˂0.001 | 16.98 | 2.97 | 16.51 | 2.38 | 16.52 | 2.57 | ˂0.001 | ˂0.001 |
| Carbohydrate | 38.72 | 5.49 | 41.43 | 4.64 | 44.91 | 4.22 | ˂0.001 | 38.50 | 5.64 | 41.32 | 4.62 | 44.73 | 4.22 | ˂0.001 | ˂0.001 |
| Glucose | 1.05 | 0.53 | 1.53 | 0.66 | 2.15 | 1.06 | ˂0.001 | 1.02 | 0.51 | 1.51 | 0.65 | 2.13 | 1.04 | ˂0.001 | ˂0.001 |
| Fructose | 1.47 | 0.77 | 2.10 | 0.98 | 2.83 | 1.41 | ˂0.001 | 1.44 | 0.75 | 2.06 | 0.97 | 2.81 | 1.39 | ˂0.001 | ˂0.001 |
| Galactose | 0.01 | 0.04 | 0.03 | 0.06 | 0.06 | 0.10 | ˂0.001 | 0.01 | 0.04 | 0.03 | 0.06 | 0.06 | 0.09 | ˂0.001 | ˂0.001 |
| Lactose | 2.21 | 1.18 | 2.73 | 1.20 | 2.50 | 1.62 | ˂0.001 | 2.17 | 1.16 | 2.71 | 1.21 | 3.45 | 1.59 | ˂0.001 | ˂0.001 |
| Maltose | 0.01 | 0.03 | 0.03 | 0.04 | 0.03 | 0.06 | ˂0.001 | 0.01 | 0.03 | 0.02 | 0.04 | 0.03 | 0.06 | ˂0.001 | ˂0.001 |
| Sucrose | 2.83 | 1.24 | 4.31 | 1.61 | 5.99 | 3.02 | ˂0.001 | 2.73 | 1.19 | 4.24 | 1.59 | 5.94 | 2.94 | ˂0.001 | ˂0.001 |
| Fiber (g) | 8.08 | 2.12 | 8.54 | 2.74 | 8.24 | 1.95 | ˂0.001 | 8.07 | 2.16 | 8.51 | 2.72 | 8.29 | 1.94 | 0.003 | ˂0.001 |
| Cholesterol (mg) | 159.79 | 44.50 | 156.24 | 37.58 | 146.76 | 40.45 | ˂0.001 | 160.75 | 45.30 | 155.84 | 37.28 | 148.18 | 41.38 | ˂0.001 | ˂0.001 |
| Lipid (g) | 48.14 | 4.78 | 45.18 | 4.47 | 41.88 | 4.66 | ˂0.001 | 48.38 | 4.84 | 45.31 | 4.44 | 41.97 | 4.64 | ˂0.001 | ˂0.001 |
| SFA (g) | 15.45 | 2.38 | 15.21 | 2.19 | 14.95 | 2.38 | 0.007 | 15.49 | 2.41 | 15.22 | 2.20 | 14.94 | 2.33 | 0.003 | 0.011 |
| Myristic Acid (g) | 1.14 | 0.41 | 1.16 | 0.35 | 1.17 | 0.38 | 0.360 | 1.14 | 0.41 | 1.15 | 0.35 | 1.17 | 0.37 | 0.445 | 0.844 |
| Palmitic Acid (g) | 8.33 | 1.27 | 8.08 | 1.22 | 7.63 | 1.31 | 0.001 | 8.36 | 1.27 | 8.09 | 1.22 | 7.64 | 1.29 | ˂0.001 | ˂0.001 |
| Stearic Acid (g) | 3.42 | 0.63 | 3.38 | 0.64 | 3.30 | 0.73 | 0.038 | 3.44 | 0.64 | 3.37 | 0.64 | 3.30 | 0.71 | 0.010 | 0.047 |
| MUFA (g) | 21.43 | 3.95 | 19.80 | 3.15 | 18.09 | 2.98 | ˂0.001 | 21.57 | 4.00 | 19.87 | 3.16 | 18.12 | 3.00 | ˂0.001 | ˂0.001 |
| Palmitoleic Acid (g) | 0.75 | 0.15 | 0.72 | 0.14 | 0.67 | 0.14 | ˂0.001 | 0.76 | 0.15 | 0.72 | 0.14 | 0.67 | 0.14 | ˂0.001 | ˂0.001 |
| Oleic Acid (g) | 19.63 | 3.94 | 18.17 | 3.12 | 16.61 | 2.97 | ˂0.001 | 19.76 | 3.99 | 18.23 | 1.13 | 16.64 | 2.99 | ˂0.001 | ˂0.001 |
| PUFA (g) | 6.03 | 1.42 | 5.65 | 1.7 | 5.04 | 1.02 | ˂0.001 | 6.07 | 1.41 | 5.67 | 1.20 | 5.05 | 1.00 | ˂0.001 | ˂0.001 |
| ω-6 PUFA (g) | 3.87 | 2.01 | 3.71 | 1.75 | 3.11 | 1.63 | ˂0.001 | 3.91 | 2.03 | 3.71 | 1.76 | 3.13 | 1.62 | ˂0.001 | ˂0.001 |
| ω-3 PUFA (g) | 0.53 | 0.36 | 0.54 | 0.34 | 0.46 | 0.35 | 0.002 | 0.53 | 0.37 | 0.54 | 0.34 | 0.47 | 0.34 | 0.003 | 0.003 |
| Linoleic Acid (g) | 4.86 | 1.25 | 4.54 | 1.05 | 4.06 | 0.90 | ˂0.001 | 4.91 | 1.26 | 4.55 | 1.07 | 4.07 | 0.88 | ˂0.001 | ˂0.001 |
| Linolenic Acid (g) | 0.54 | 0.22 | 0.52 | 0.15 | 0.48 | 0.16 | ˂0.001 | 0.55 | 0.23 | 0.52 | 0.15 | 0.48 | 0.16 | ˂0.001 | ˂0.001 |
| Arachidonic Acid (g) | 0.08 | 0.04 | 0.07 | 0.03 | 0.07 | 0.03 | ˂0.001 | 0.08 | 0.04 | 0.07 | 0.04 | 0.07 | 0.03 | ˂0.001 | ˂0.001 |
| Micronutrient RDI | Simple Sugars Intake (93.77 ± 25.72 g) | ||||||||||||||
|---|---|---|---|---|---|---|---|---|---|---|---|---|---|---|---|
| Boys (n = 1098) | Girls (n = 1139) | ||||||||||||||
| Simple Sugars Intake (96.24 ± 24.34 g) | Simple Sugars Intake (91.38 ± 26.78 g) | ||||||||||||||
| P25 (<79.9 g) (n = 276) | P25–P75 (79.9–112.0 g) (n = 542) | P75 (>112.0 g) (n = 280) | p-Value *a | P25 (<74.5 g) (n = 324) | P25–P75 (74.5–106.0 g) (n = 526) | P75 (>106.0 g) (n = 289) | p-Value *b | p-Value *c | |||||||
| Mean | SD | Mean | SD | Mean | SD | Mean | SD | Mean | SD | Mean | SD | ||||
| Mineral RDI | |||||||||||||||
| Ca 800 mg | 832.20 | 201.39 | 1010.05 | 219.31 | 1062.73 | 311.12 | ˂0.001 | 797.50 | 208.97 | 967.86 | 215.00 | 1156.60 | 327.88 | ˂0.001 | ˂0.001 |
| Fe 9 mg | 12.24 | 3.23 | 13.46 | 3.87 | 15.80 | 7.84 | ˂0.001 | 11.62 | 3.46 | 12.93 | 3.54 | 14.88 | 6.01 | ˂0.001 | ˂0.001 |
| I 120µg | 89.50 | 27.07 | 105.72 | 62.20 | 123.57 | 113.06 | ˂0.001 | 86.14 | 26.75 | 98.74 | 27.51 | 113.75 | 38.58 | ˂0.001 | ˂0.001 |
| Mg 170 mg | 259.14 | 65.34 | 300.21 | 64.44 | 349.33 | 122.89 | ˂0.001 | 247.57 | 56.44 | 287.14 | 55.19 | 336.08 | 106.74 | ˂0.001 | ˂0.001 |
| Zinc 6.5 mg | 8.95 | 1.95 | 9.92 | 2.08 | 11.07 | 3.90 | ˂0.001 | 8.52 | 1.92 | 9.56 | 2.02 | 10.65 | 2.80 | ˂0.001 | ˂0.001 |
| Vitamin RDI | |||||||||||||||
| A 450 µg | 866.14 | 1051.02 | 985.54 | 571.89 | 1099.67 | 757.48 | ˂0.001 | 832.38 | 1045.39 | 947.15 | 544.91 | 1185.26 | 1289.60 | ˂0.001 | ˂0.001 |
| B1 0.8 mg | 1.67 | 2.54 | 1.61 | 1.32 | 1.74 | 1.18 | 0.672 | 1.48 | 1.78 | 1.46 | 0.64 | 1.66 | 0.80 | 0.918 | 0.213 |
| B2 1.1 mg | 1.67 | 0.42 | 1.95 | 0.41 | 2.29 | 0.71 | ˂0.001 | 1.60 | 0.47 | 1.90 | 0.46 | 2.20 | 0.70 | ˂0.001 | ˂0.001 |
| B6 1.0 mg | 1.90 | 0.51 | 2.17 | 0.59 | 2.45 | 1.14 | ˂0.001 | 1.80 | 0.56 | 2.08 | 0.58 | 2.34 | 0.99 | ˂0.001 | ˂0.001 |
| Folate 200 µg | 7.87 | 15.40 | 10.24 | 17.86 | 16.56 | 37.81 | 0.247 | 8.98 | 19.13 | 10.68 | 19.91 | 13.30 | 27.23 | 0.235 | 0.337 |
| B12 1.2 µg | 5.67 | 4.74 | 5.95 | 2.83 | 6.96 | 5.08 | ˂0.001 | 5.15 | 3.02 | 5.80 | 2.64 | 6.19 | 2.71 | ˂0.001 | ˂0.001 |
| C 45 mg | 78.48 | 35.93 | 104.77 | 49.33 | 129.95 | 59.72 | ˂0.001 | 77.53 | 36.94 | 99.95 | 42.05 | 131.08 | 85.81 | ˂0.001 | ˂0.001 |
| D 5 µg | 2.84 | 2.94 | 3.03 | 2.36 | 3.51 | 3.45 | ˂0.001 | 2.56 | 2.39 | 2.90 | 2.24 | 3.44 | 2.86 | ˂0.001 | ˂0.001 |
| E 7.0 mg | 6.96 | 2.53 | 8.12 | 3.17 | 9.55 | 3.95 | 0.017 | 6.68 | 2.36 | 7.93 | 2.85 | 3.33 | 4.34 | ˂0.001 | ˂0.001 |
| % of Total Energy from Sugar (21.07 ± 12.09%) | |||||||||||||||
|---|---|---|---|---|---|---|---|---|---|---|---|---|---|---|---|
| Micronutrient | Boys (n = 1098) | Girls (n = 1139) | |||||||||||||
| % of Total Energy from Sugar (21.15% ± 11.90%) | % of Total Energy from Sugar (20.99% ± 12.26%) | ||||||||||||||
| P25 (<14.99%) (n = 274) | P25–P75 (14.99%–21.17%) (n = 549) | P75 (>21.17%) (n = 275) | p-Value *a | P25 (<14.61%) (n = 284) | P25–P75 (14.61%–20.90%) (n = 570) | P75 (>20.90%) (n = 285) | p-Value *b | p-Value *c | |||||||
| Mean | SD | Mean | SD | Mean | SD | Mean | SD | Mean | SD | Mean | SD | ||||
| Mineral | |||||||||||||||
| Ca (mg) | 395.48 | 91.70 | 449.65 | 97.23 | 498.00 | 115.29 | ˂0.001 | 393.19 | 91.09 | 446.32 | 97.19 | 498.01 | 114.10 | ˂0.001 | ˂0.001 |
| Fe (mg) | 5.91 | 1.34 | 6.04 | 1.54 | 5.73 | 1.47 | 0.004 | 5.93 | 1.38 | 6.02 | 1.53 | 5.76 | 1.44 | 0.018 | 0.015 |
| I (µg) | 43.58 | 14.96 | 46.27 | 19.83 | 47.31 | 12.40 | 0.002 | 43.57 | 15.39 | 46.03 | 19.56 | 47.45 | 12.38 | 0.003 | 0.011 |
| Mg (mg) | 124.96 | 24.90 | 133.51 | 21.67 | 136.45 | 23.08 | ˂0.001 | 125.26 | 25.67 | 132.72 | 21.53 | 136.57 | 23.24 | ˂0.001 | ˂0.001 |
| Zinc (mg) | 4.34 | 0.75 | 4.39 | 0.73 | 4.35 | 0.73 | 0.364 | 4.36 | 0.76 | 4.37 | 0.73 | 4.36 | 0.73 | 0.898 | 0.952 |
| Vitamin | |||||||||||||||
| A (µg) | 430.90 | 485.35 | 432.28 | 250.20 | 433.51 | 333.26 | 0.993 | 435.03 | 513.31 | 428.63 | 246.95 | 439.16 | 202.50 | 0.856 | 0.998 |
| B1 (mg) | 0.74 | 0.87 | 0.71 | 0.67 | 0.65 | 0.17 | 0.173 | 0.75 | 0.91 | 0.71 | 0.67 | 0.65 | 0.17 | 0.123 | 0.297 |
| B2 (mg) | 0.79 | 0.18 | 0.87 | 0.19 | 0.93 | 0.21 | ˂0.001 | 0.79 | 0.18 | 0.86 | 0.19 | 0.93 | 0.21 | ˂0.001 | ˂0.001 |
| B6 (mg) | 0.91 | 0.22 | 0.96 | 0.24 | 0.93 | 0.26 | ˂0.001 | 0.91 | 0.22 | 0.96 | 0.21 | 0.94 | 0.25 | ˂0.001 | ˂0.001 |
| Folate (µg) | 3.91 | 7.63 | 5.08 | 9.76 | 5.44 | 10.13 | 0.018 | 3.93 | 7.71 | 5.01 | 9.67 | 5.38 | 9.93 | 0.038 | 0.153 |
| B12 (µg) | 2.69 | 1.73 | 2.67 | 1.23 | 2.46 | 0.81 | 0.038 | 2.71 | 1.82 | 2.66 | 1.22 | 2.49 | 0.82 | 0.051 | 0.065 |
| C (mg) | 37.79 | 18.38 | 46.97 | 20.48 | 54.19 | 24.43 | ˂0.001 | 37.36 | 18.08 | 46.43 | 20.35 | 54.12 | 24.51 | ˂0.001 | ˂0.001 |
| D (µg) | 1.32 | 1.20 | 1.38 | 1.13 | 1.22 | 0.96 | 0.097 | 1.30 | 1.21 | 1.38 | 1.13 | 1.25 | 0.96 | 0.132 | 0.248 |
| E (mg) | 3.57 | 1.15 | 3.56 | 1.05 | 3.42 | 1.00 | 0.107 | 3.56 | 1.14 | 3.56 | 1.07 | 3.44 | 0.99 | 0.184 | 0.264 |
© 2020 by the authors. Licensee MDPI, Basel, Switzerland. This article is an open access article distributed under the terms and conditions of the Creative Commons Attribution (CC BY) license (http://creativecommons.org/licenses/by/4.0/).
Share and Cite
Morales-Suarez-Varela, M.; Peraita-Costa, I.; Llopis-Morales, A.; Picó, Y.; Bes-Rastrollo, M.; Llopis-Gonzalez, A. Total Sugar Intake and Macro and Micronutrients in Children Aged 6–8 Years: The ANIVA Study. Nutrients 2020, 12, 349. https://doi.org/10.3390/nu12020349
Morales-Suarez-Varela M, Peraita-Costa I, Llopis-Morales A, Picó Y, Bes-Rastrollo M, Llopis-Gonzalez A. Total Sugar Intake and Macro and Micronutrients in Children Aged 6–8 Years: The ANIVA Study. Nutrients. 2020; 12(2):349. https://doi.org/10.3390/nu12020349
Chicago/Turabian StyleMorales-Suarez-Varela, María, Isabel Peraita-Costa, Agustín Llopis-Morales, Yolanda Picó, Maira Bes-Rastrollo, and Agustín Llopis-Gonzalez. 2020. "Total Sugar Intake and Macro and Micronutrients in Children Aged 6–8 Years: The ANIVA Study" Nutrients 12, no. 2: 349. https://doi.org/10.3390/nu12020349
APA StyleMorales-Suarez-Varela, M., Peraita-Costa, I., Llopis-Morales, A., Picó, Y., Bes-Rastrollo, M., & Llopis-Gonzalez, A. (2020). Total Sugar Intake and Macro and Micronutrients in Children Aged 6–8 Years: The ANIVA Study. Nutrients, 12(2), 349. https://doi.org/10.3390/nu12020349