Knowledge about Sugar Sources and Sugar Intake Guidelines in Portuguese Consumers


Abstract
:1. Introduction
The Current Study
2. Materials and Methods
2.1. Participants
2.2. Procedure and Measures
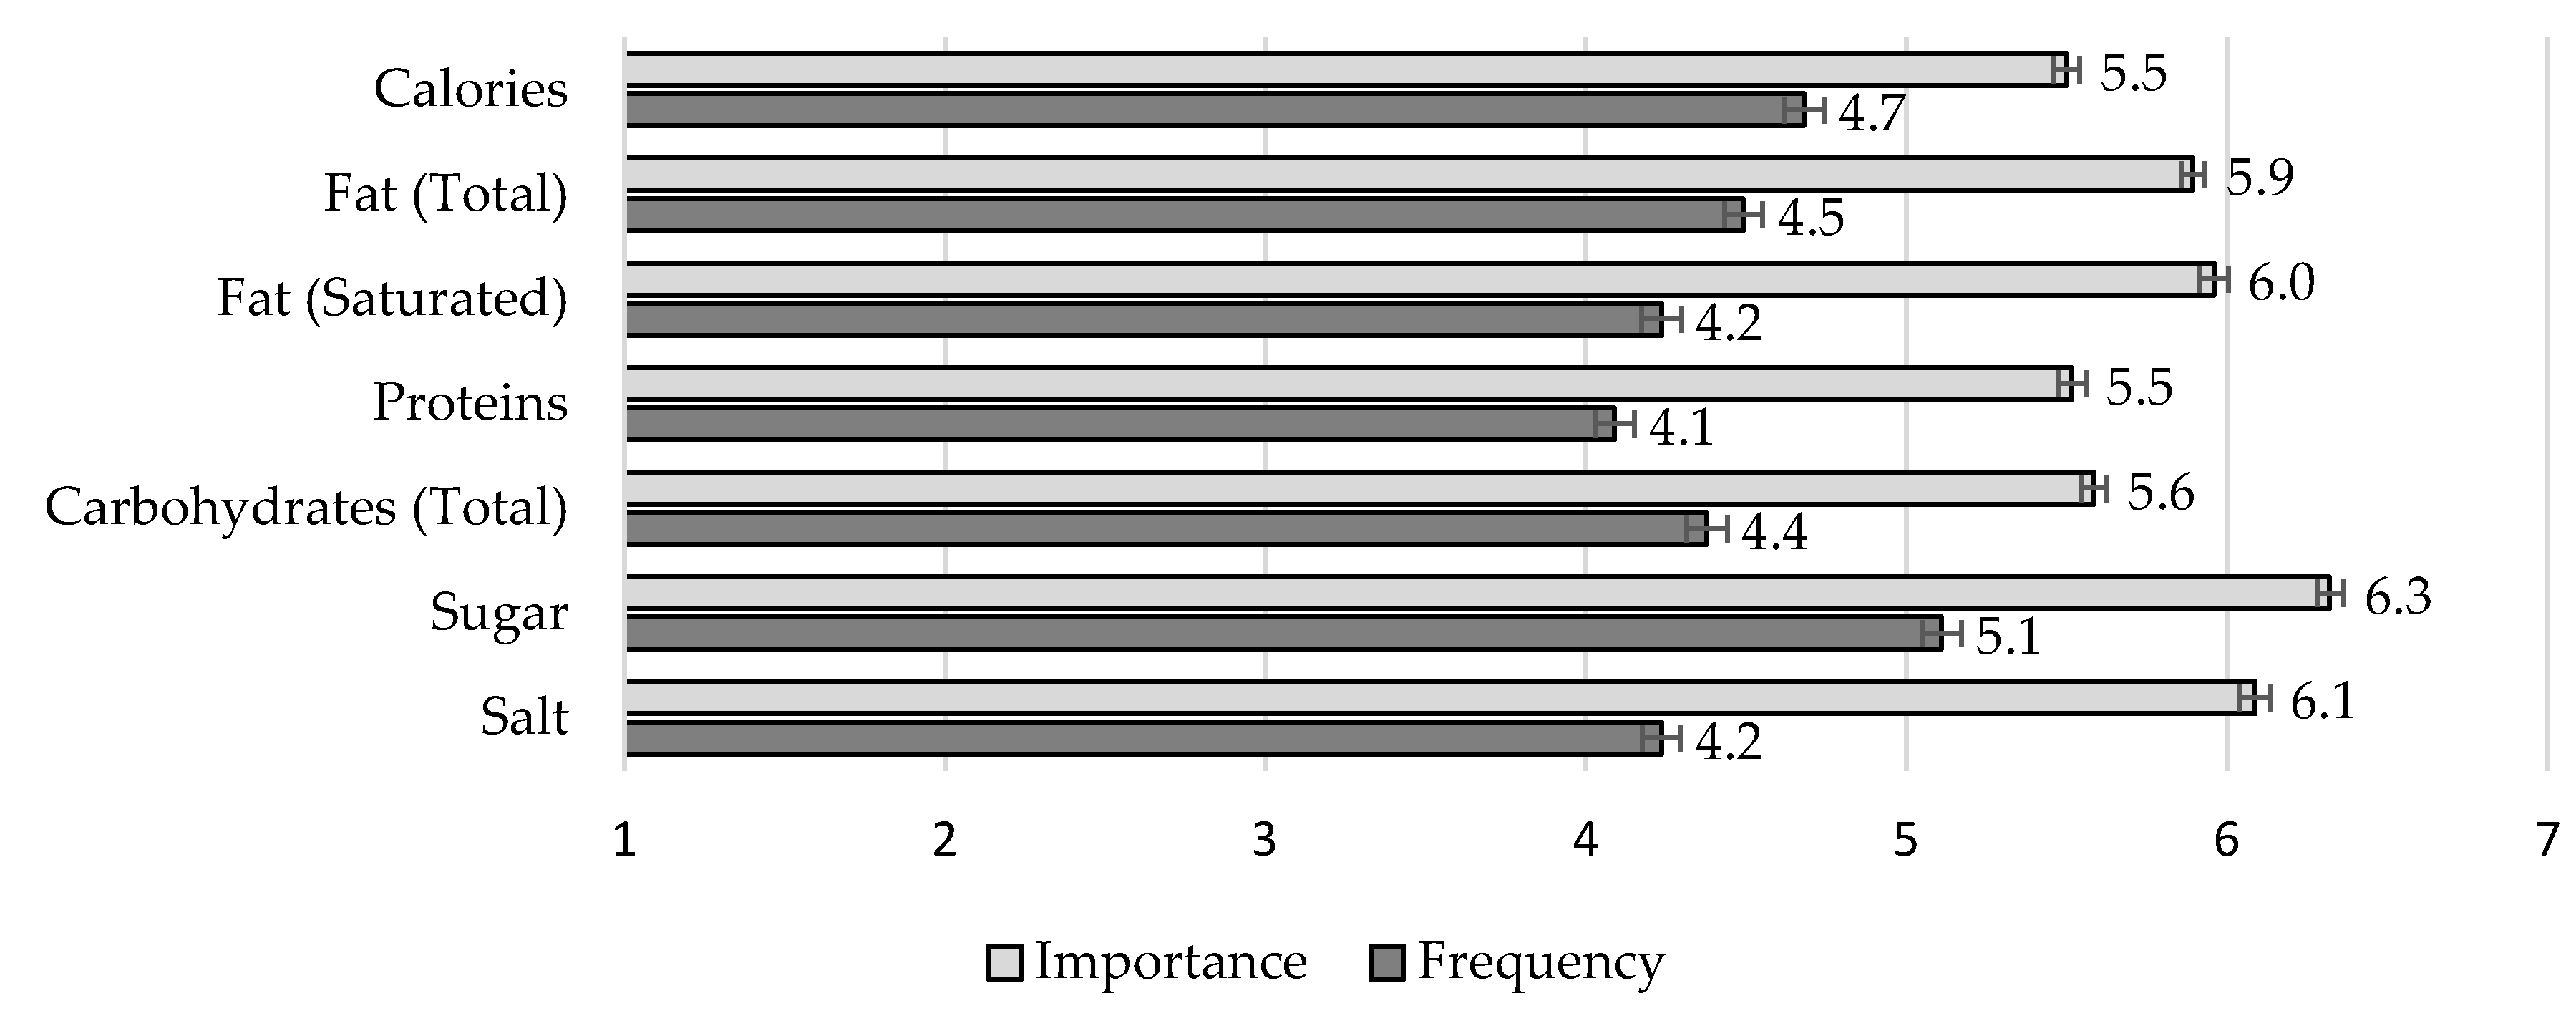
- Frequency of use and perceived importance of nutritional information: To assess the type of nutritional information prioritized by participants, we included two items (adapted from [20]). First, we asked participants to indicate how frequently they take into consideration each of the following items of the nutritional label: calories, total fat, saturated fat, proteins, total carbohydrates, sugar, and salt (from 1 = Never to 7 = Always). Responses were averaged into a single index (α = 0.93). Second, we asked participants to indicate how important they believe it is to watch each item to stay healthy (from 1 = Not at all important to 7 = Very important). Again, responses were averaged into a single index (α = 0.89). In both cases, the seven items of the nutritional table were presented in random order.
- Short Food Literacy Questionnaire (SFLQ): We translated the SFLQ [32] to European Portuguese to assess self-reported food literacy. The original measure included 12 items (e.g., “When I have questions on healthy nutrition, I know where I can find information on this issue”; from 1 = Strongly Disagree to 7 = Strongly Agree). Besides cultural adaptations (e.g., “Swiss Food Pyramid” was replaced by “Food Wheel”), we also standardized the number of points of the rating scales across all items (i.e., 7-point response scales). Moreover, the response options to the item related to sources of nutritional information (“How well do you understand the following types of nutritional information?”) included a new type of source (i.e., scientific papers or books). Finally, the original measure included an item regarding the perceived knowledge of the guidelines for salt intake, and we added a new item regarding the guidelines for sugar intake (“I know the guidelines for sugar intake for the Portuguese population”). After confirming the adequacy of the sampling based on the Kaiser-Meyer-Olkin (KMO) and Bartlett’s test of sphericity (KMO = 0.90), an exploratory factor analysis with principal axis factoring and Promax rotation allowed the extraction of two factors (eigenvalues > 1) that accounted for 58.07% of the variance. Factor 1 (eigenvalue 5.81; 44.67% of explained variance) included nine items (α = 0.88) related to the perceived ability of finding, understanding, and assessing nutritional information (SFLQ_1). Factor 2 (eigenvalue 1.74; 13.40% of explained variance) included four items (α = 0.87) related to the perceived knowledge of nutritional guidelines (SFLQ_2; for descriptive results and factor loadings per item, see Appendix A).
- Frequency of consumption of sugary products: To assess the frequency of consumption of sugary products, we included a general item—“Usually, how frequently do you consume high sugar foods and drinks?” (1 = Never or less than once a month; 2 = 1 to 3 times/month, 3 = once a week, 4 = 2 to 4 times/weeks, 5 = 5 to 6 times/week, 6 = once a day, 7 = more than once a day).
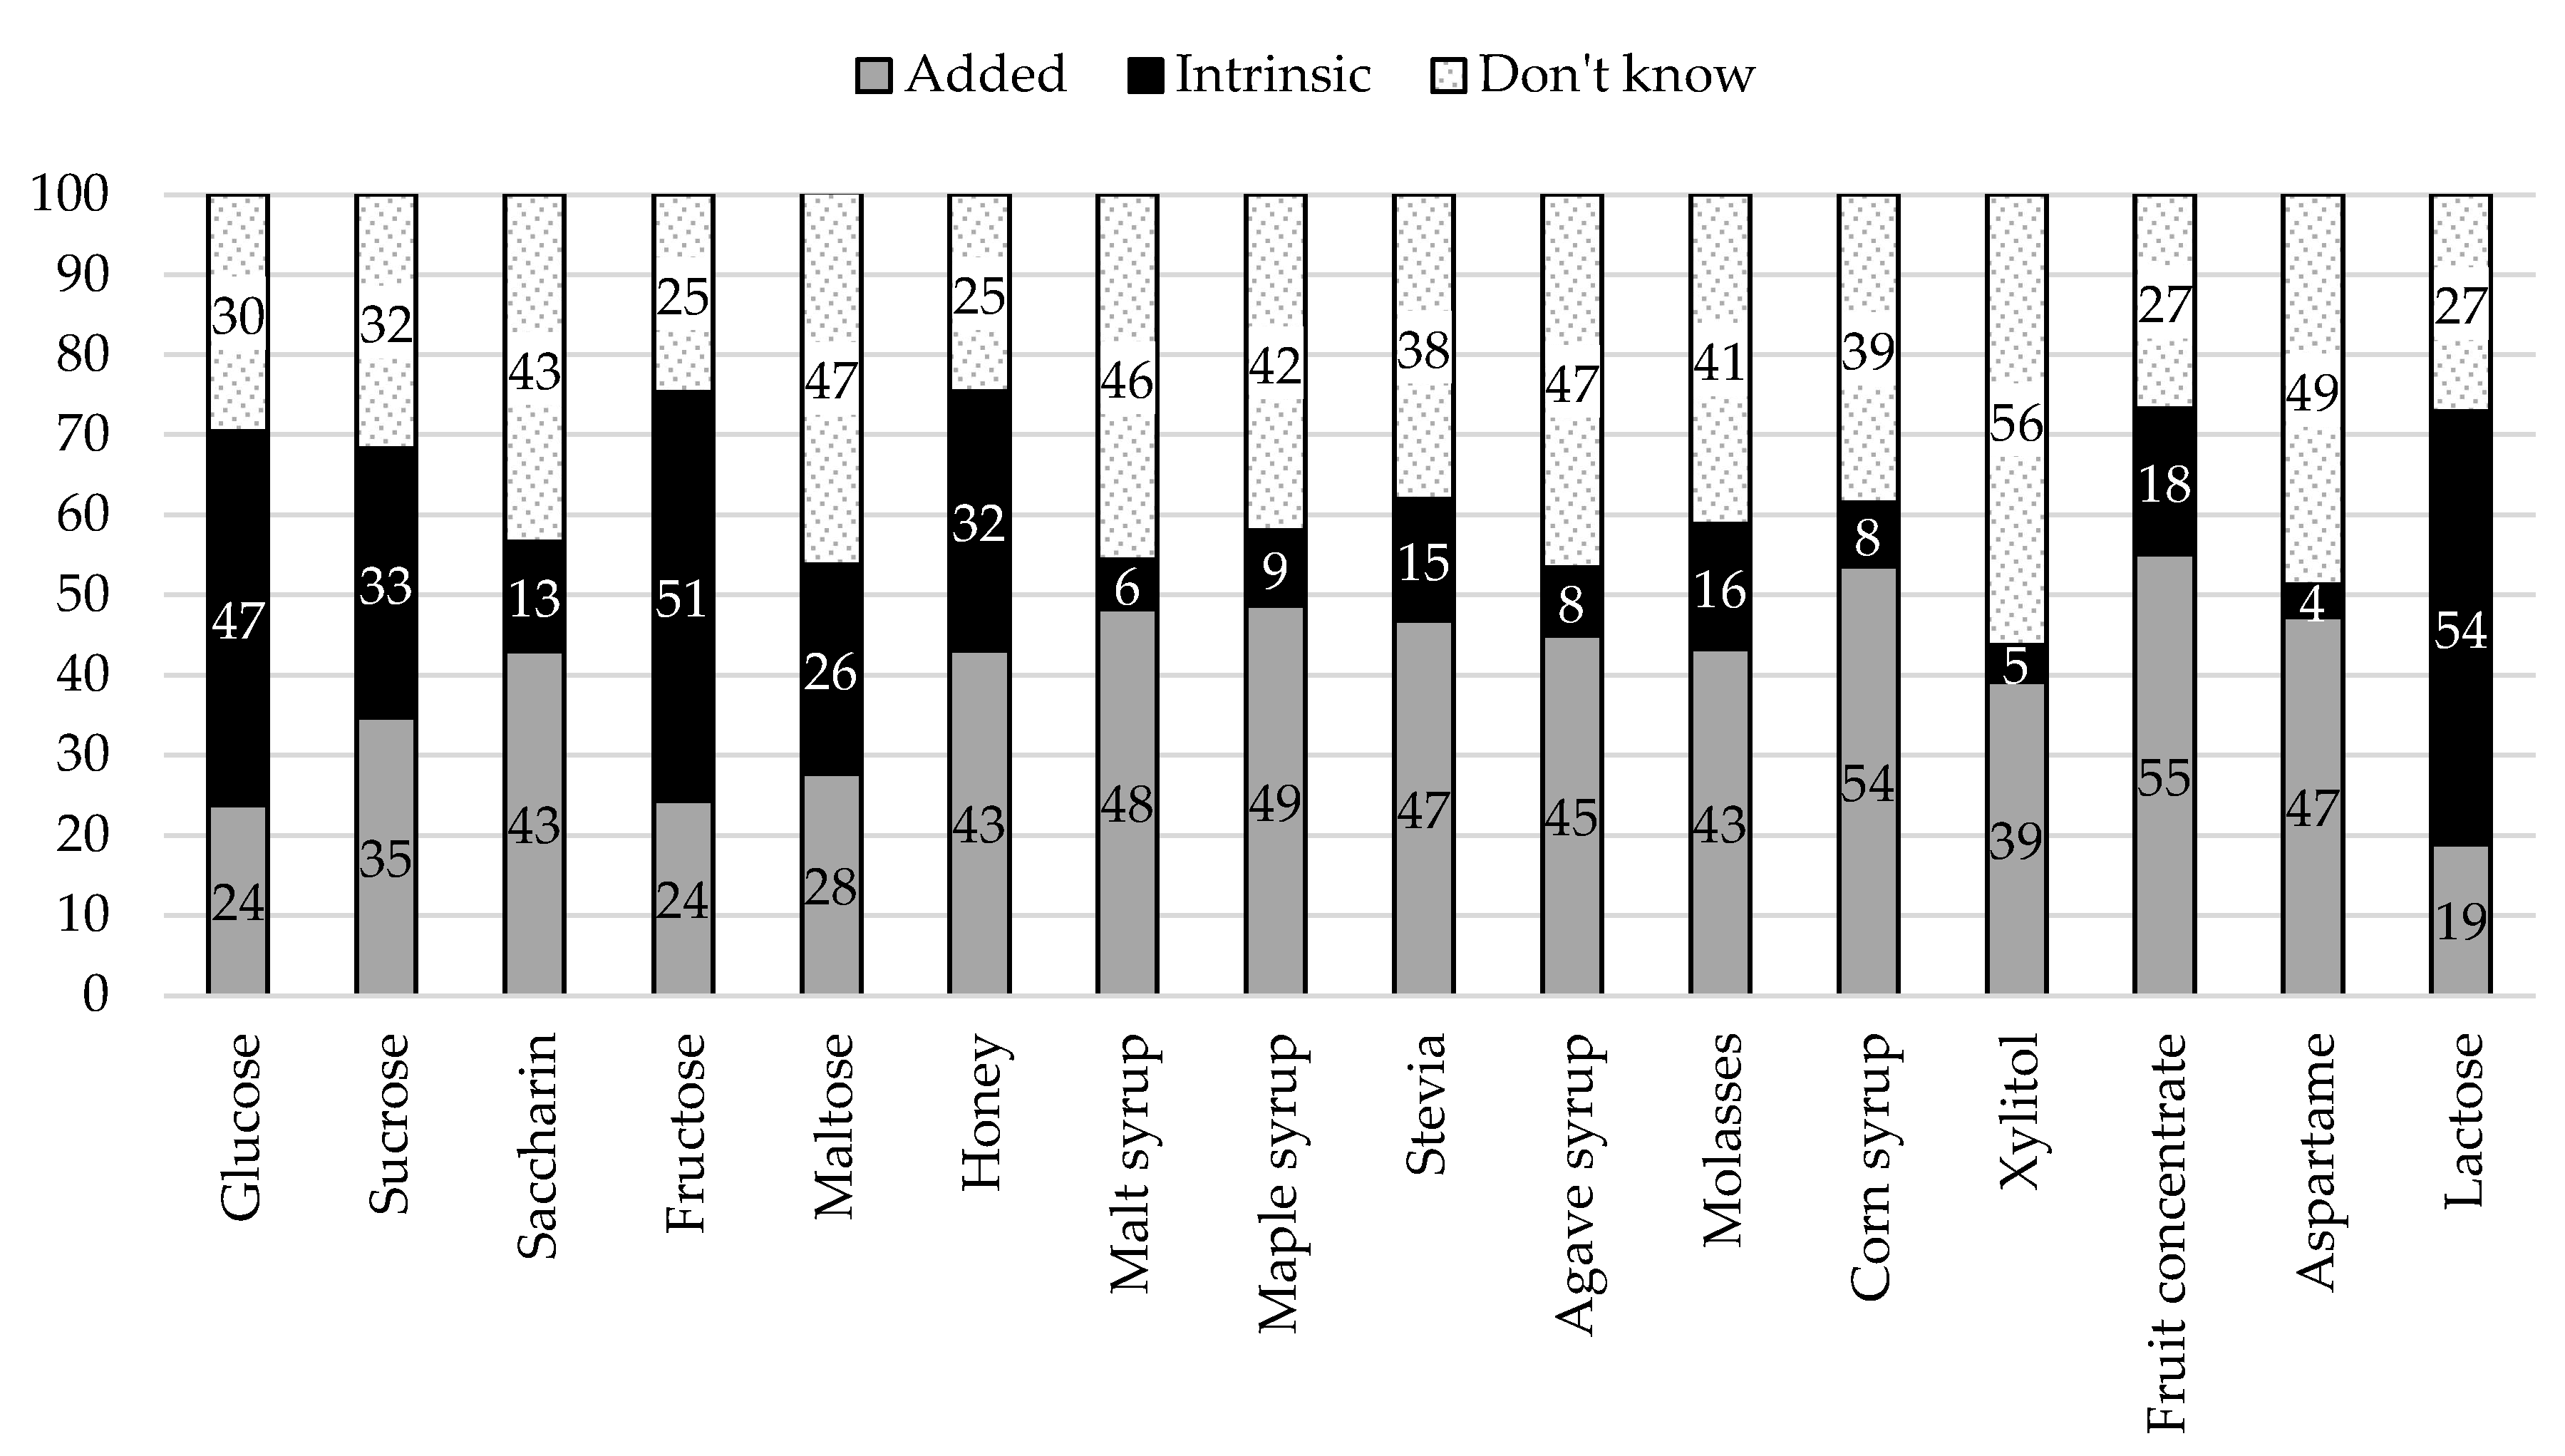
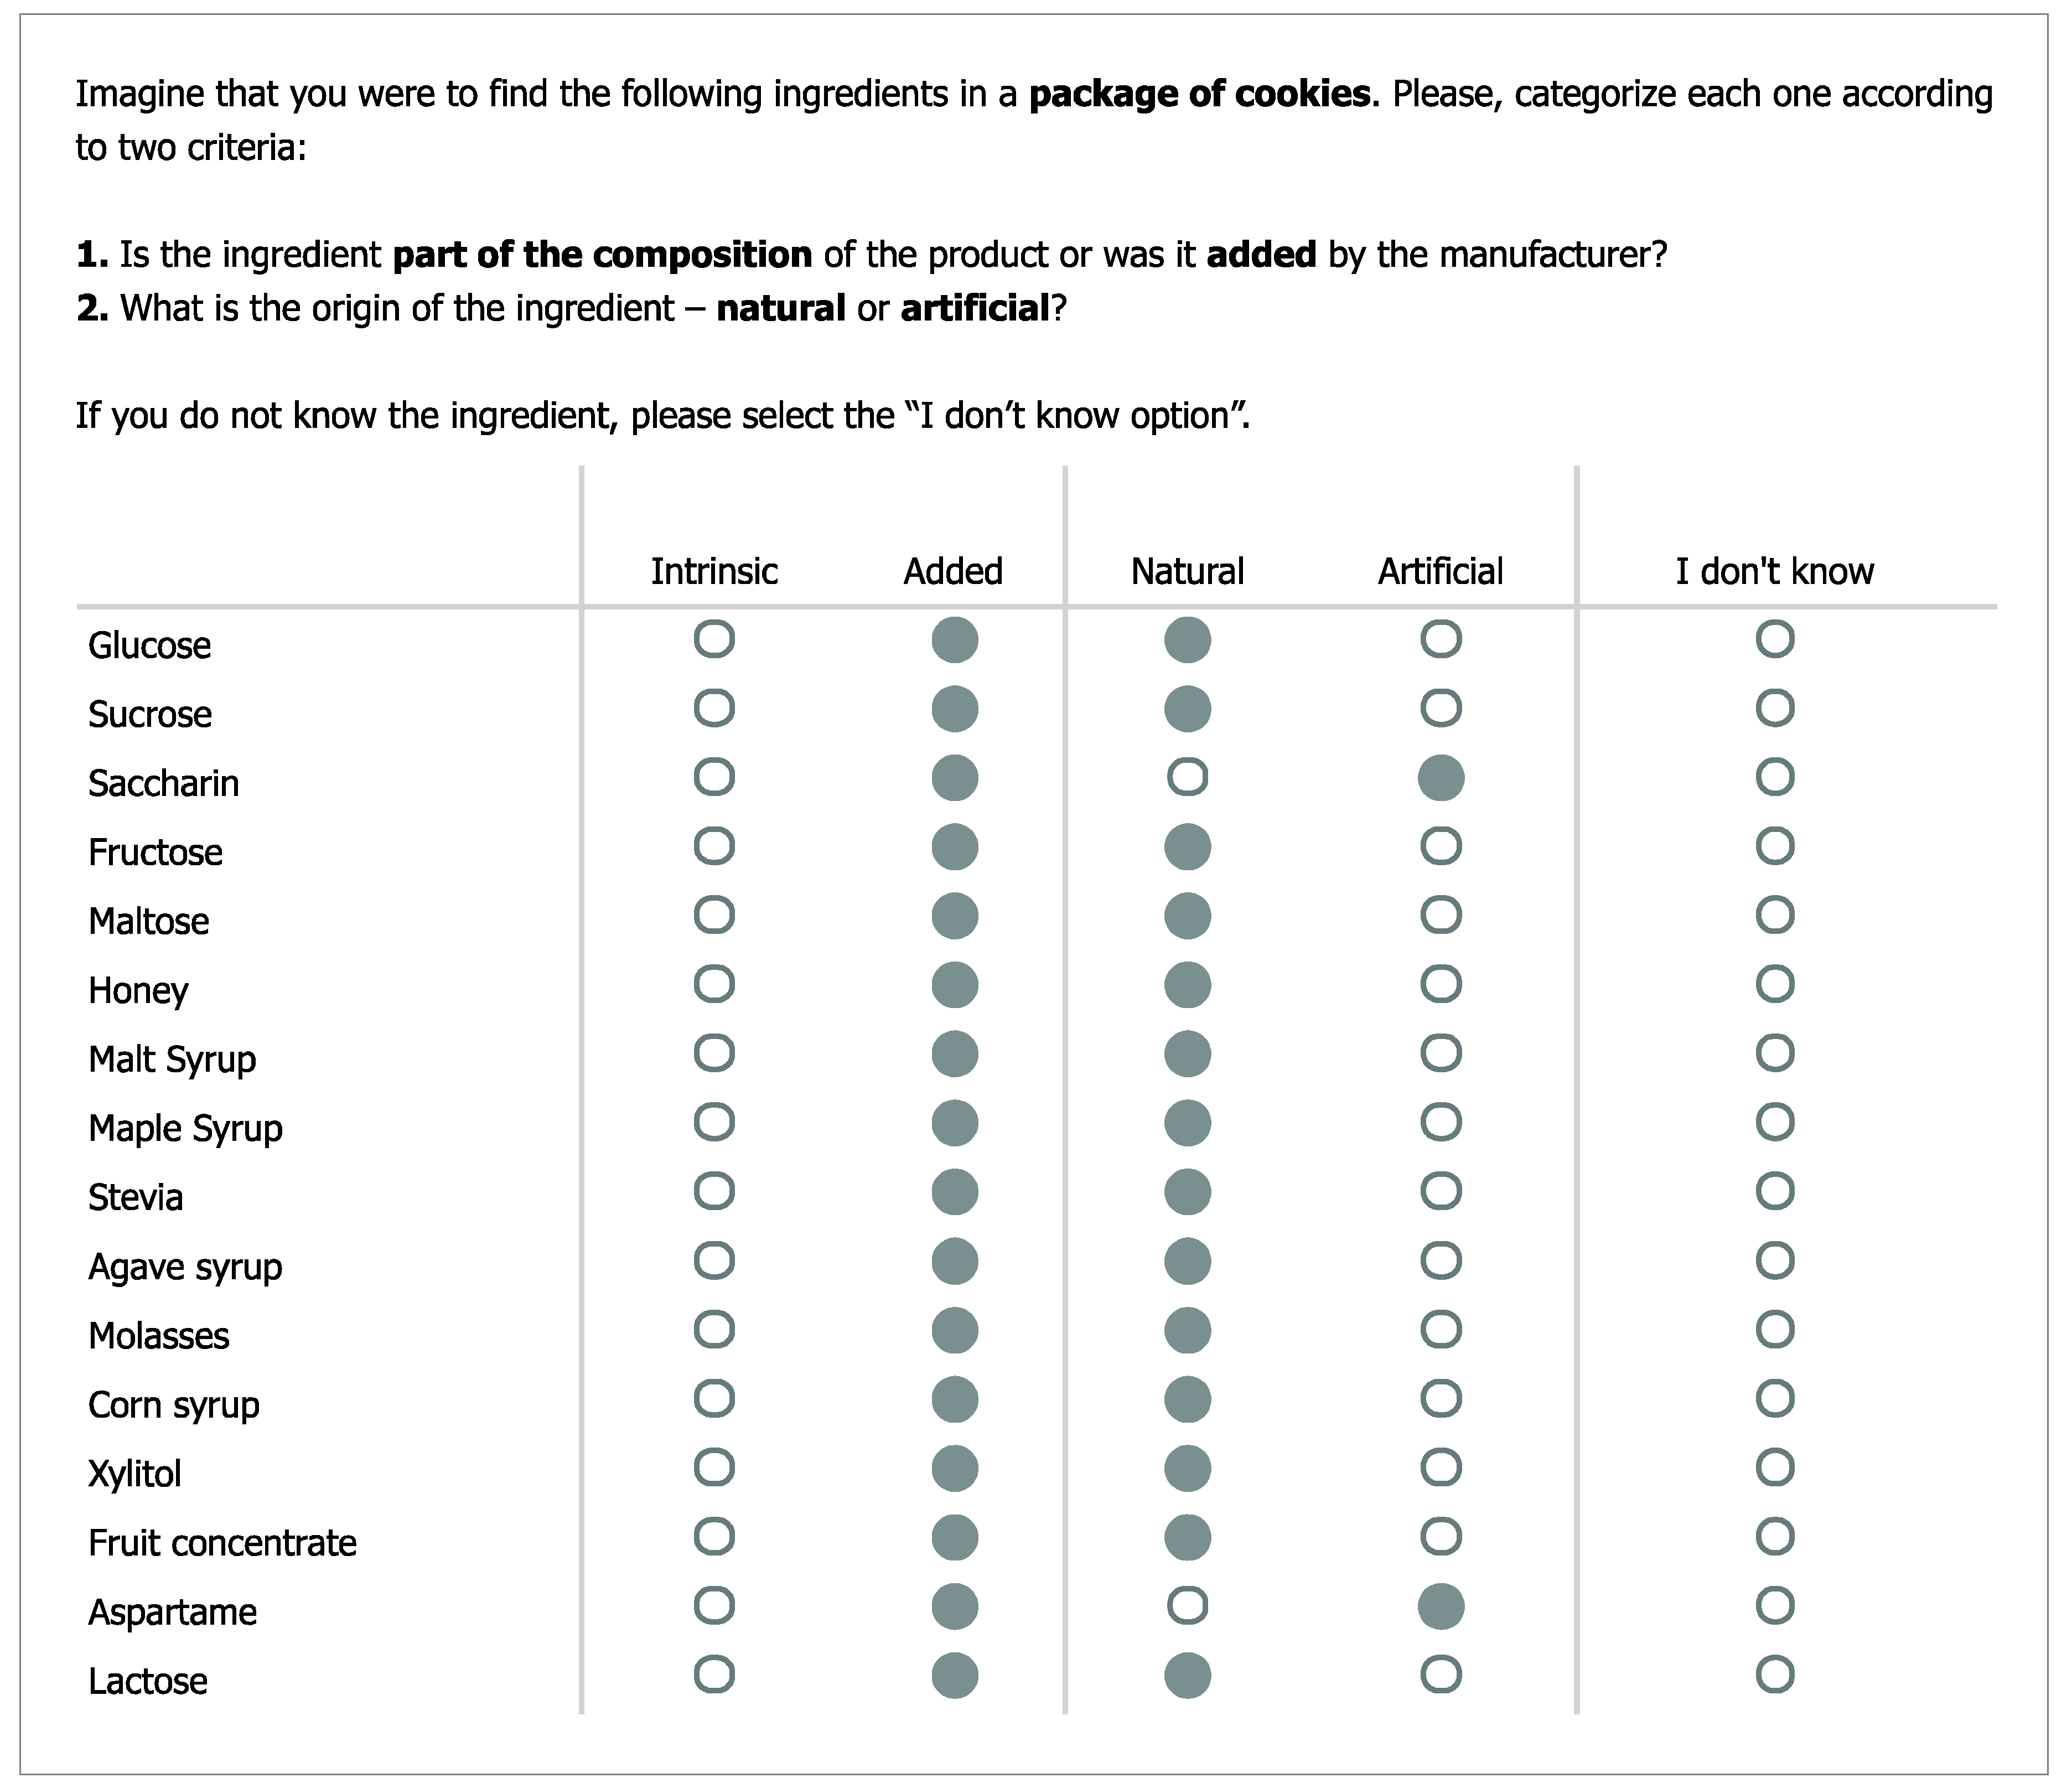
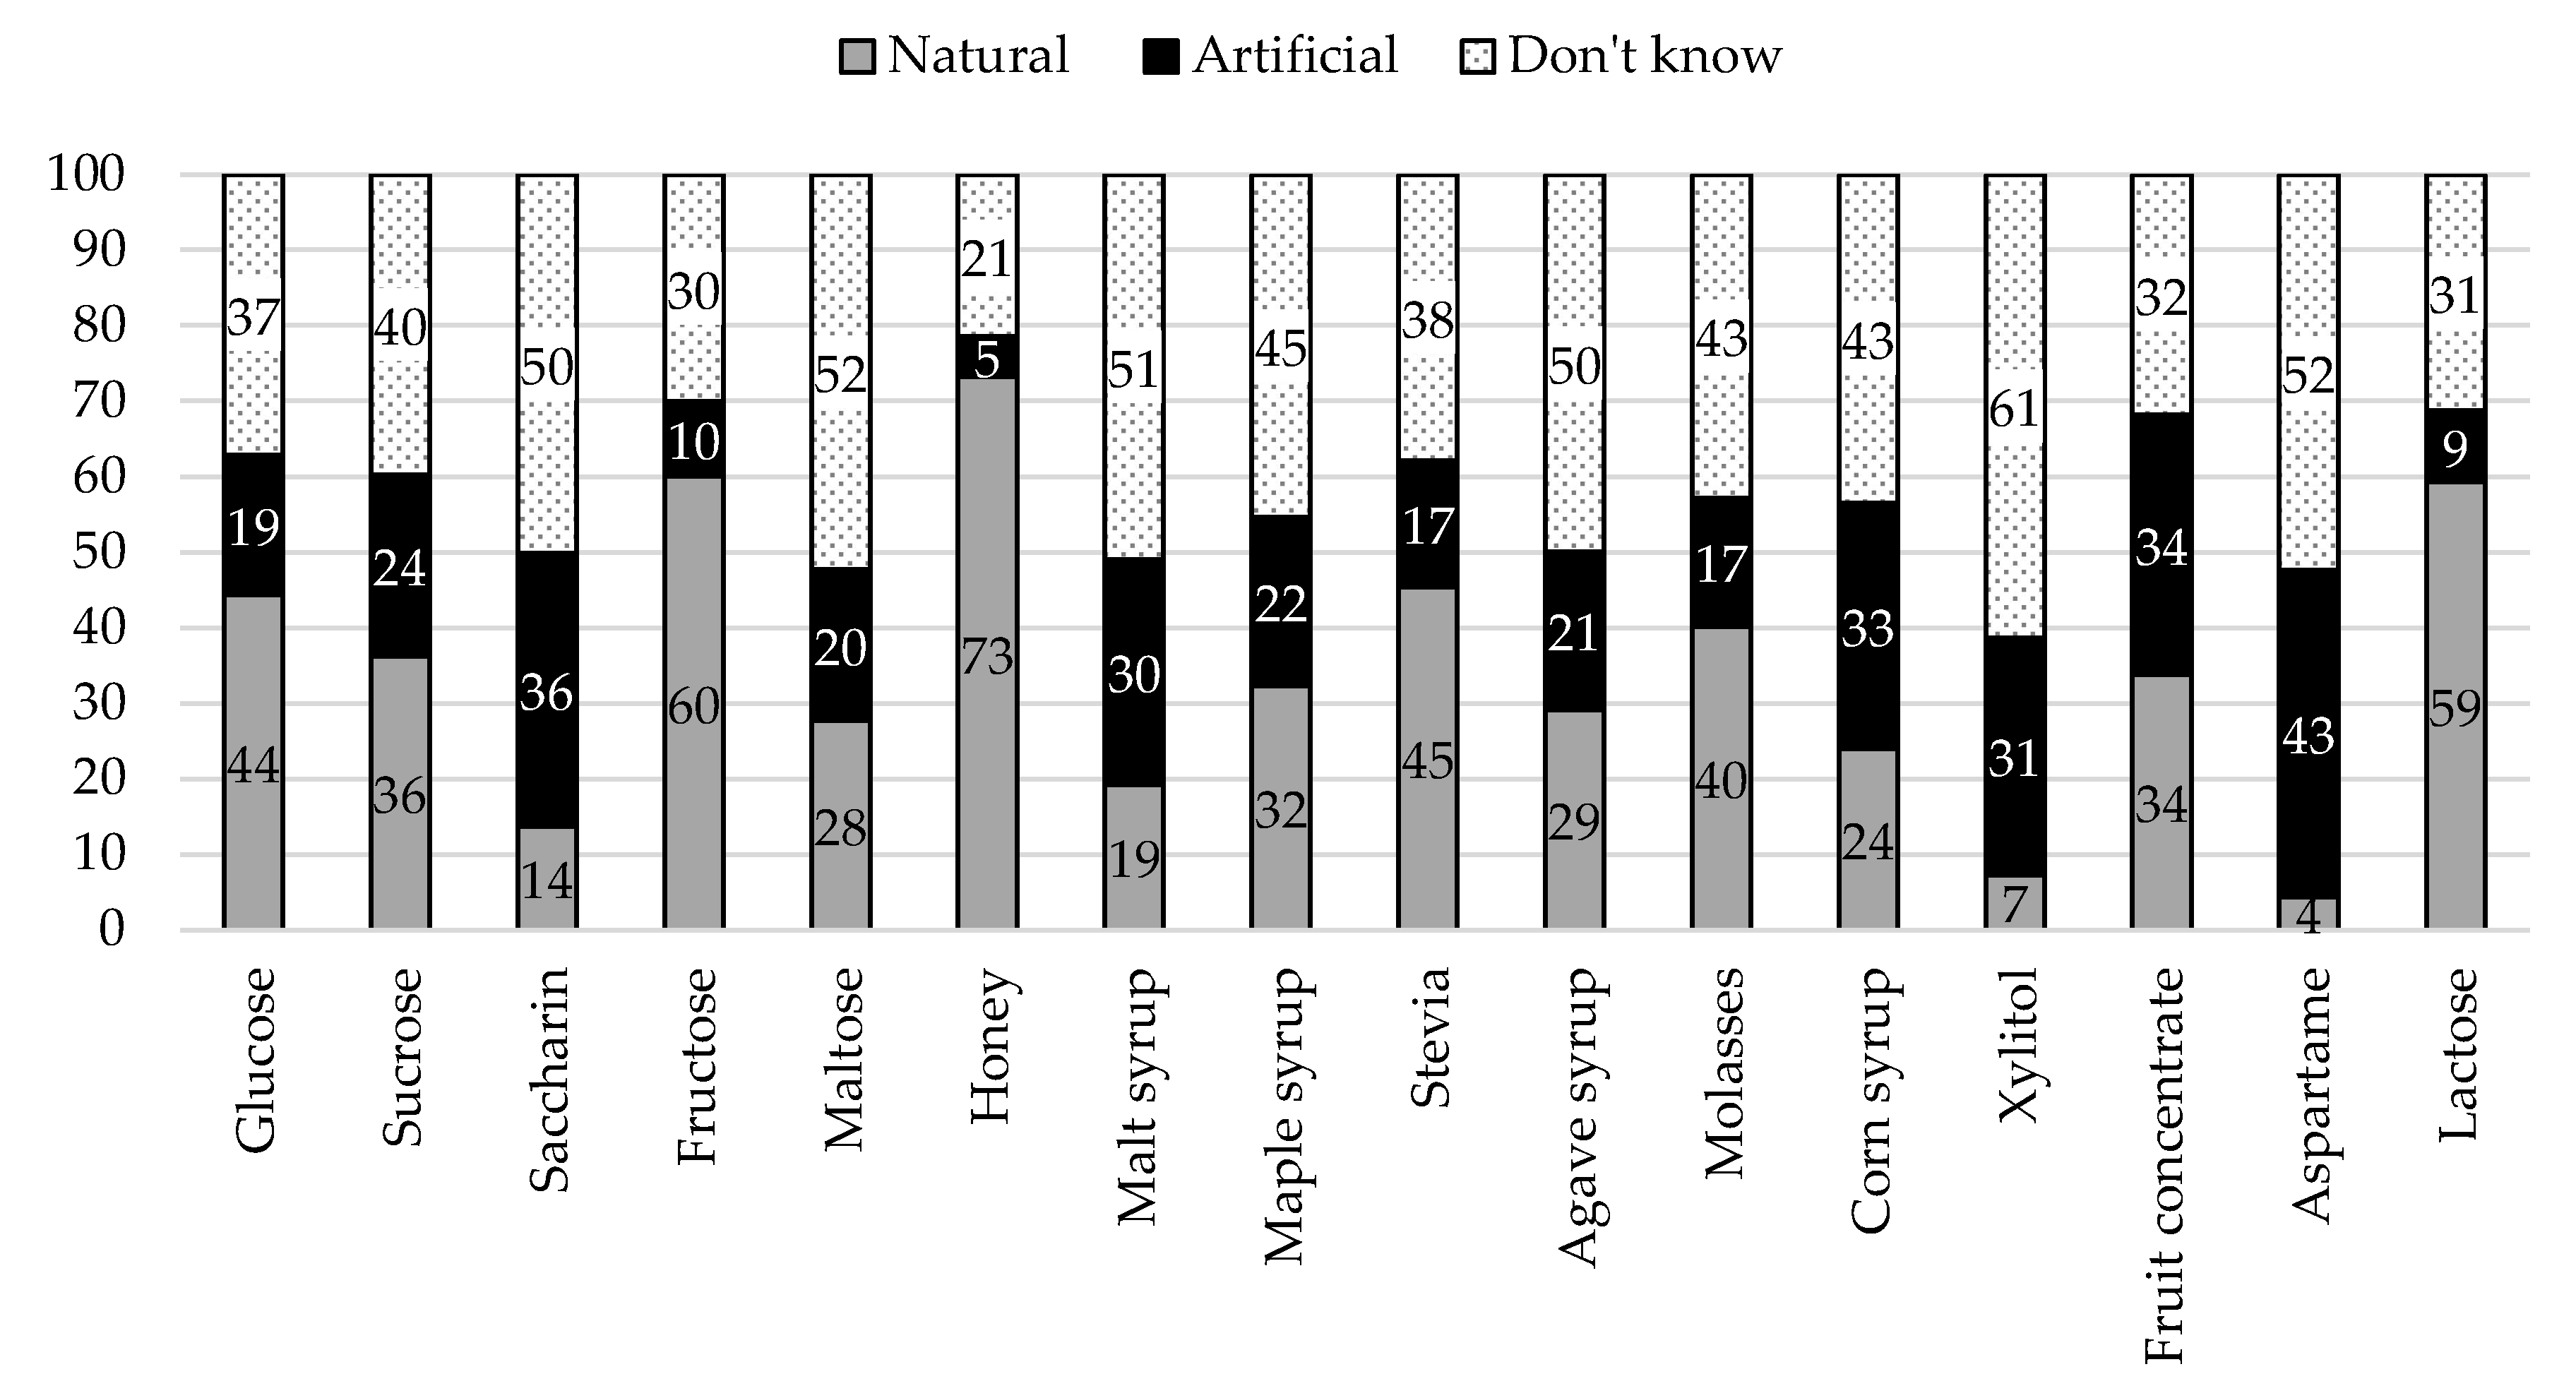
- Knowledge categorization of sugar sources: This task was based on the one used by Tierney et al. [20] with the following exceptions: (a) the list of “sugar” sources included 16 items (e.g., sucrose, honey, aspartame—this set included different types of sugars and sweeteners; for the sake of brevity, we refer to this list as sugar sources), instead of 13; (b) these sources were presented in random order, instead of a fixed order; and (c) the categorization included two criteria—composition (i.e., intrinsic vs. added) and origin (i.e., natural vs. artificial)—instead of a single one (original response options were “natural sugar”, “added/free sugar” and “artificial sweetener”). We have also changed the instructions to emphasize that all sugar sources were ingredients for another food product and not as food products on their own (e.g., honey is a natural product with intrinsic sugars that become a source of added sugars when used to make cookies). The categorization task (including instructions and the full list of 16 items) is presented in Figure 1.
- Knowledge of the WHO guidelines regarding sugar intake. We stated that the WHO had recently defined guidelines regarding the intake of free sugars and presented the definition of free sugars (we used the official Portuguese definition, see [33]). Then, we asked participants to use 7-point rating scales to indicate their opinion regarding how easy it was to understand that definition (from 1 = It is hard to comprehend what free sugars are to 7 = It is easy to comprehend what free sugars are) and to identify free sugars in products (from 1 = Identifying free sugars in products is hard to 7 = Identifying free sugars in products is easy). The items were strongly and positively correlated, r = 0.75, p < 0.001. Next, we asked participants to indicate whether they knew the maximum amount of sugar recommended and provided three response options (1 = The daily intake of sugar should be limited to___ g, 2 = I don’t know about these guidelines, 3 = I have heard about these guidelines, but I can’t recall the exact value).In the last block of questions, participants were asked to indicate their type(s) of diet(s), height, and weight (open-ended answers, including “I don’t know/I rather not say” options). Lastly, participants were thanked and debriefed.
3. Results
3.1. Analytical Plan
3.2. Frequency of Use and Perceived Importance of Nutritional Information
3.3. Knowledge: Categorization of Sugar Sources
3.4. Short Food Literacy Questionnaire (SFLQ), Knowledge of WHO Guidelines and Ease of Comprehension and Identification of Free Sugars
3.5. Individual Differences
3.5.1. Gender
3.5.2. Children in the Household
3.5.3. Level of Education
3.6. Correlations
3.7. Hierarchical Regression Analysis
4. Discussion
Author Contributions
Funding
Acknowledgments
Conflicts of Interest
Appendix A
| M | SD | Factor Loading a | |
| Factor 1 (SFLQ_1): Perceived capability finding, understanding, and assessing nutritional information | |||
| 1. When I have questions on healthy nutrition, I know where I can find information on this issue. | 5.24 | 1.48 | 0.57 |
| 2. In general, how well do you understand the following types of nutritional information? (6 sources) | 4.82 | 1.29 | 0.48 |
| 7. Think about a usual day: how easy or difficult is it for you to compose a balanced meal at home? | 5.24 | 1.47 | 0.48 |
| 8. In the past, how often were you able to help your family members or a friend if they had questions concerning nutritional issues? | 4.09 | 1.74 | 0.55 |
| 9. There is a lot of information available on healthy nutrition today. How well do you manage to choose the information relevant to you? | 5.20 | 1.39 | 0.77 |
| 10. How easy is it for you to judge if media information on nutritional issues can be trusted? | 4.47 | 1.57 | 0.84 |
| 11. Commercials often relate foods with health. How easy is it for you to judge if the presented associations are appropriate or not? | 4.55 | 1.57 | 0.80 |
| 12. How easy is it for you to evaluate if a specific food is relevant for a healthy diet? | 5.34 | 1.27 | 0.75 |
| 13. How easy is it for you to evaluate the longer-term impact of your dietary habits on your health? | 5.35 | 1.39 | 0.60 |
| Factor 1 Total | 4.92 | 1.04 | - |
| Factor 2 (SFLQ_2): Perceived knowledge of nutritional guidelines | |||
| 3. How familiar are you with the Food Wheel? | 5.91 | 1.18 | 0.41 |
| 4. I know the recommendations about fruit and vegetable consumption for the Portuguese population. | 5.71 | 1.46 | 0.77 |
| 5. I know the recommendations about salt intake for the Portuguese population. | 5.70 | 1.49 | 0.93 |
| 6. I know the recommendations about sugar intake for the Portuguese population. | 5.79 | 1.47 | 0.92 |
| Factor 2 Total | 5.78 | 1.19 | - |
| Note. Ratings for all items varied between 1 and 7. Sample size for all items = 1010, except for Item 2 (n = 993). a Principal axis factoring analysis with Promax rotation. | |||
References
- World Health Organization. Guideline: Sugars Intake for Adults and Children; World Health Organization: Geneva, Switzerland, 2015. [Google Scholar]
- Lobstein, T.; Jackson-Leach, R. Planning for the worst: Estimates of obesity and comorbidities in school-age children in 2025. Pediatr. Obes. 2016, 11, 321–325. [Google Scholar] [PubMed]
- Barbieri, M.; Désesquelles, A.; Egidi, V.; Demuru, E.; Frova, L.; Meslé, F.; Pappagallo, M. Obesity-related mortality in France, Italy, and the United States: A comparison using multiple cause-of-death analysis. Int. J. Public Health 2017, 62, 623–629. [Google Scholar] [CrossRef] [PubMed] [Green Version]
- Flegal, K.M.; Graubard, B.I.; Williamson, D.F.; Gail, M.H. Excess deaths associated with underweight, overweight, and obesity. JAMA-J. Am. Med. Assoc. 2005, 293, 1861–1867. [Google Scholar] [CrossRef] [PubMed] [Green Version]
- Franks, P.W.; Hanson, R.L.; Knowler, W.C.; Sievers, M.L.; Bennett, P.H.; Looker, H.C.; Health, A.Z. Childhood obesity, other cardiovascular risk factors, and premature death. N. Engl. J. Med. 2010, 363, 485–493. [Google Scholar] [CrossRef]
- Greenberg, J.A. Obesity and early mortality in the United States. Obesity 2013, 21, 405–412. [Google Scholar]
- Faruque, S.; Tong, J.; Agbonghae, C.; Minaya, D.M.; Czaja, K. The dose makes the poison: Sugar and obesity in the united states—A review. Pol. J. Food Nutr. Sci. 2019, 69, 219–233. [Google Scholar] [CrossRef]
- Jiang, Y.; Pan, Y.; Rhea, P.R.; Tan, L.; Gagea, M.; Cohen, L.; Fischer, S.M.; Yang, P. A sucrose-enriched diet promotes tumorigenesis in mammary gland in part through the 12-lipoxygenase pathway. Cancer Res. 2016, 7, 24–29. [Google Scholar] [CrossRef] [Green Version]
- Larsson, S.C.; Bergkvist, L.; Wolk, A. Consumption of sugar and sugar-sweetened foods and the risk of pancreatic cancer in a prospective study. Am. J. Clin. Nutr. 2006, 84, 1171–1176. [Google Scholar]
- Azaïs-Braesco, V.; Sluik, D.; Maillot, M.; Kok, F.; Moreno, L.A. A review of total & added sugar intakes and dietary sources in Europe. Nutr. J. 2017, 16, 6. [Google Scholar]
- Mela, D.J.; Woolner, E.M. Perspective: Total, added, or free? What kind of sugars should we be talking about? Adv. Nutr. 2018, 1, 63–69. [Google Scholar] [CrossRef]
- World Health Organization. Diet, Nutrition and the Prevention of Chronic Diseases; World Health Organization: Geneva, Switzerland, 2003. [Google Scholar]
- Baranowski, T.; Cullen, K.W.; Nicklas, T.; Thompson, D.; Baranowski, J. Are current health behavioral change models helpful in guiding prevention of weight gain efforts? Obes. Res. 2003, 11, 23S–43S. [Google Scholar] [CrossRef] [PubMed]
- Gupta, A.; Smithers, L.G.; Harford, J.; Merlin, T.; Braunack-Mayer, A. Determinants of knowledge and attitudes about sugar and the association of knowledge and attitudes with sugar intake among adults: A systematic review. Appetite 2018, 126, 185–194. [Google Scholar] [CrossRef] [PubMed] [Green Version]
- Gase, L.N.; Robles, B.; Barragan, N.C.; Kuo, T. Relationship between nutritional knowledge and the amount of sugar-sweetened beverages consumed in Los Angeles county. Health Educ. Behav. 2014, 41, 431–439. [Google Scholar] [CrossRef] [PubMed]
- Lee, Y.; Joo, N. The awareness level and needs for education on reducing sugar consumption among mothers with preschool children. Nutr. Res. Pract. 2016, 10, 229–236. [Google Scholar] [CrossRef] [Green Version]
- Park, S.; Onufrak, S.; Sherry, B.; Blanck, H.M. The relationship between health-related knowledge and sugar-sweetened beverage intake among US adults. J. Acad. Nutr. Diet. 2014, 114, 1059–1066. [Google Scholar] [CrossRef] [Green Version]
- Rampersaud, G.C.; Kim, H.; Gao, Z.; House, L.A. Knowledge, perceptions, and behaviors of adults concerning nonalcoholic beverages suggest some lack of comprehension related to sugars. Nutr. Res. 2014, 34, 134–142. [Google Scholar] [CrossRef]
- Miller, C.; Wakefield, M.; Braunack-Mayer, A.; Roder, D.; O’Dea, K.; Ettridge, K.; Dono, J. Who drinks sugar sweetened beverages and juice? An Australian population study of behaviour, awareness and attitudes. BMC Obes. 2019, 6, 1. [Google Scholar] [CrossRef] [Green Version]
- Tierney, M.; Gallagher, A.M.; Giotis, E.S.; Pentieva, K. An online survey on consumer knowledge and understanding of added sugars. Nutrients 2017, 9, 37. [Google Scholar] [CrossRef] [Green Version]
- Vanderlee, L.; White, C.M.; Bordes, I.; Hobin, E.P.; Hammond, D. The efficacy of sugar labeling formats: Implications for labeling policy. Obesity 2015, 23, 2406–2413. [Google Scholar]
- Acton, R.B.; Vanderlee, L.; Hobin, E.P.; Hammond, D. Added sugar in the packaged foods and beverages available at a major Canadian retailer in 2015: A descriptive analysis. CMAJ Open 2017, 5, E1–E6. [Google Scholar] [CrossRef] [Green Version]
- Popkin, B.M.; Hawkes, C. Sweetening of the global diet, particularly beverages: Patterns, trends, and policy responses. Lancet Diabetes Endocrinol. 2016, 4, 174–186. [Google Scholar] [CrossRef] [Green Version]
- Bernstein, J.T.; Schermel, A.; Mills, C.M.; L’Abbé, M.R. Total and free sugar content of Canadian prepackaged foods and beverages. Nutrients 2016, 8, 582. [Google Scholar] [CrossRef] [PubMed] [Green Version]
- Prada, M.; Godinho, C.; Rodrigues, D.L.; Lopes, C.; Garrido, M.V. The impact of a gluten-free claim on the perceived healthfulness, calories, level of processing and expected taste of food products. Food Qual. Prefer. 2019, 73, 284–287. [Google Scholar] [CrossRef] [Green Version]
- Román, S.; Sánchez-Siles, L.M.; Siegrist, M. The importance of food naturalness for consumers: Results of a systematic review. Trends Food Sci. Technol. 2017, 67, 44–57. [Google Scholar] [CrossRef]
- Bucher, T.; Siegrist, M. Children’s and parents’ health perception of different soft drinks. Br. J. Nutr. 2015, 113, 526–535. [Google Scholar] [CrossRef] [Green Version]
- Sütterlin, B.; Siegrist, M. Simply adding the word “fruit” makes sugar healthier: The misleading effect of symbolic information on the perceived healthiness of food. Appetite 2015, 95, 252–261. [Google Scholar]
- Lopes, C.; Torres, D.; Oliveira, A.; Severo, M.; Alarcão, V.; Guiomar, S.; Mota, J.; Teixeira, P.; Rodrigues, S.; Lobato, L.; et al. Inquérito Alimentar Nacional e de Atividade Física de 2015–2016; Universidade do Porto: Porto, Portugal, 2017. [Google Scholar]
- Ministério da Saúde. Retrato da Saúde; Ministério da Saúde: Lisboa, Portugal, 2018.
- Prada, M.; Rodrigues, D.L.; Godinho, C.A.; Lopes, D.; Garrido, M.V. Knowledge and acceptance of interventions aimed at reducing sugar intake in Portugal. Public Health Nutr. 2020, 23, 1–12. [Google Scholar] [CrossRef]
- Krause, C.G.; Beer-Borst, S.; Sommerhalder, K.; Hayoz, S.; Abel, T. A short food literacy questionnaire (SFLQ) for adults: Findings from a Swiss validation study. Appetite 2018, 120, 275–280. [Google Scholar] [CrossRef]
- PNPAS. Alimentação Saudável. Desafios e Estratégias; Direção Geral de Saúde: Lisboa, Portugal, 2018.
- Cannoosamy, K.; Pugo-Gunsam, P.; Jeewon, R. Consumer knowledge and attitudes toward nutritional labels. J. Nutr. Educ. Behav. 2014, 46, 334–340. [Google Scholar] [CrossRef]
- Nayga, R.M. Determinants of consumers’ use of nutritional information on food packages. JAAE 1996, 28, 303–312. [Google Scholar] [CrossRef] [Green Version]
- Szűcs, V.; Szabó, E.; Guerrero, L.; Tarcea, M.; Bánáti, D. Modelling of avoidance of food additives: A cross country study. Int. J. Food Sci. Nutr. 2019, 70, 1020–1032. [Google Scholar] [CrossRef] [PubMed]
- Nayga, R.M. Impact of sociodemographic factors on perceived importance of nutrition in food shopping. J. Consum. Aff. 1997, 31, 1–9. [Google Scholar] [CrossRef]
- Guthrie, J.F.; Fox, J.J.; Cleveland, L.E.; Welsh, S. Who uses nutrition labeling, and what effects does label use have on diet quality? J. Nutr. Educ. 1995, 27, 163–172. [Google Scholar] [CrossRef]
- Hieke, S.; Taylor, C.R. A critical review of the literature on nutritional labeling. J. Consum. Aff. 2012, 46, 120–156. [Google Scholar] [CrossRef]
- Williams, S.L.; Mummery, K.W. Characteristics of consumers using “better for you” front-of-pack food labelling schemes—An example from the Australian Heart Foundation Tick. Public Health Nutr. 2013, 16, 2265–2272. [Google Scholar] [CrossRef] [PubMed] [Green Version]
- Heiman, A.; Lowengart, O. Calorie information effects on consumers’ food choices: Sources of observed gender heterogeneity. J. Bus. Res. 2014, 67, 964–973. [Google Scholar] [CrossRef]
- Hieke, S.; Newman, C.L. The effects of nutrition label comparison baselines on consumers’ food choices. J. Consum. Aff. 2015, 49, 613–626. [Google Scholar] [CrossRef]
- Birch, L.L.; Fisher, J.O. Development of eating behaviors among children and adolescents. Pediatrics 1998, 101, 539–549. [Google Scholar]
- Drichoutis, A.C.; Lazaridis, P.; Nayga, R.M. Nutrition knowledge and consumer use of nutritional food labels. Eur. Rev. Agric. Econ. 2005, 32, 93–118. [Google Scholar] [CrossRef]
- Oh, A.; Nguyen, A.B.; Patrick, H. Correlates of reported use and perceived helpfulness of calorie information in restaurants among U.S. adults. Am. J. Health Promot. 2016, 30, 242–249. [Google Scholar]
- Kessler, D. Toward more comprehensive food labeling. N. Engl. J. Med. 2014, 17, 193–195. [Google Scholar] [CrossRef] [PubMed]
- de Vriendt, T.; Matthys, C.; Verbeke, W.; Pynaert, I.; de Henauw, S. Determinants of nutrition knowledge in young and middle-aged Belgian women and the association with their dietary behaviour. Appetite 2009, 52, 788–792. [Google Scholar] [CrossRef] [PubMed]
- Grunert, K.G.; Wills, J.; Celemín, L.F.; Lähteenmäki, L.; Scholderer, J.; Bonsmann, S.S.G. Socio-demographic and attitudinal determinants of nutrition knowledge of food shoppers in six European countries. Food Qual. Prefer. 2012, 26, 166–177. [Google Scholar] [CrossRef]
- Hendrie, G.A.; Coveney, J.; Cox, D. Exploring nutrition knowledge and the demographic variation in knowledge levels in an Australian community sample. Public. Health Nutr. 2008, 11, 1365–1371. [Google Scholar] [CrossRef] [Green Version]
- Nicklas, T.A.; Jahns, L.; Bogle, M.L.; Chester, D.N.; Giovanni, M.; Klurfeld, D.M.; Laugero, K.; Liu, Y.; Lopez, S.; Tucker, K.L. Barriers and facilitators for consumer adherence to the dietary guidelines for americans: The HEALTH study. J. Acad. Nutr. Diet. 2013, 113, 1317–1331. [Google Scholar] [CrossRef]
- Tallant, A.; Rettig, M.; Tennyson, S. Barriers and facilitators for fruit and vegetable consumption among adults in rural counties. Fam. Consum. Sci. Res. J. 2018, 47, 87–100. [Google Scholar]
- Yeh, M.C.; Ickes, S.B.; Lowenstein, L.M.; Shuval, K.; Ammerman, A.S.; Farris, R.; Katz, D.L. Understanding barriers and facilitators of fruit and vegetable consumption among a diverse multi-ethnic population in the USA. Health Promot. Int. 2008, 23, 42–51. [Google Scholar] [CrossRef] [Green Version]
- Jústiz, A.M.; Landry, M.J.; Asigbee, F.M.; Ghaddar, R.; Jeans, M.R.; Davis, J.N. Nutrition education associations between child and parent knowledge of added sugar recommendations and added sugar intake in multiethnic elementary-aged children. Cur Dev. Nutr. 2020, 4, nzaa140. [Google Scholar] [CrossRef]
- Wang, F.; Diangelo, C.L.; Marsden, S.L.; Pasut, L.; Kitts, D.; Bellissimo, N. Knowledge of sugars consumption and the WHO sugars guideline among Canadian dietitians and other health professionals. Can. J. Diet. Pract. Res. 2020, 81, 142–145. [Google Scholar] [CrossRef] [Green Version]
- Khandpur, N.; Graham, D.J.; Roberto, C.A. Simplifying mental math: Changing how added sugars are displayed on the nutrition facts label can improve consumer understanding. Appetite 2017, 114, 38–46. [Google Scholar] [CrossRef]
- Capewell, S.; Lloyd-Williams, F. The role of the food industry in health: Lessons from tobacco? Br. Med. Bull. 2018, 125, 131–143. [Google Scholar] [CrossRef] [PubMed]


| Gender | Children in the Household | Higher Education | ||||||||||
|---|---|---|---|---|---|---|---|---|---|---|---|---|
| Men (n = 231) | Women (n = 775) | No (n = 672) | Yes (n = 338) | No (n = 215) | Yes (n = 795) | |||||||
| M | (SD) | M | (SD) | M | (SD) | M | (SD) | M | (SD) | M | (SD) | |
| Frequency of use | ||||||||||||
| Calories | 4.18 a | (2.01) | 4.83 b | (1.87) | 4.66 c | (1.98) | 4.71 c | (1.81) | 4.40 e | (2.08) | 4.76 f | (1.87) |
| Fat (Total) | 4.02 a | (2.01) | 4.63 b | (1.89) | 4.42 c | (2.03) | 4.64 c | (1.73) | 4.27 e | (2.08 | 4.55 e | (1.89) |
| Fat (Saturated) | 3.84 a | (2.00) | 4.35 b | (1.99) | 4.18 c | (2.08) | 4.35 c | (1.86) | 4.08 e | (2.11) | 4.28 e | (1.98) |
| Proteins | 3.91 a | (2.01) | 4.14 a | (1.93) | 4.08 c | (2.02) | 4.10 c | (1.81) | 3.88 e | (2.00) | 4.14 e | (1.94) |
| Carbohydrates (Total) | 4.00 a | (2.02) | 4.49 b | (1.93) | 4.36 c | (2.03) | 4.42 c | (1.81) | 4.09 e | (2.05) | 4.45 f | (1.93) |
| Sugar | 4.42 a | (2.04) | 5.31 b | (1.76) | 5.02 c | (1.93) | 5.29 d | (1.71) | 4.83 e | (2.00) | 5.19 f | (1.82) |
| Salt | 3.88 a | (2.03) | 4.34 b | (1.97) | 4.11 c | (2.03) | 4.49 d | (1.88) | 4.17 e | (2.06) | 4.25 e | (1.97) |
| Total | 4.04 a | (1.79) | 4.58 b | (1.56) | 4.40 c | (1.70) | 4.57 c | (1.45) | 4.25 e | (1.77) | 4.52 f | (1.58) |
| Perceived Importance 1 | ||||||||||||
| Calories | 5.52 a | (1.46) | 5.51 a | (1.50) | 5.52 c | (1.51) | 5.47 c | (1.45) | 5.54 e | (1.57) | 5.49 e | (1.47) |
| Fat (Total) | 5.60 a | (1.40) | 5.98 b | (1.23) | 5.92 c | (1.28) | 5.83 c | (1.27) | 5.77 e | (1.43) | 5.92 e | (1.23) |
| Fat (Saturated) | 5.69 a | (1.40) | 6.04 b | (1.26) | 6.00 c | (1.31) | 5.89 c | (1.28) | 5.79 e | (1.48) | 6.01 f | (1.25) |
| Proteins | 5.37 a | (1.41) | 5.56 a | (1.38) | 5.58 c | (1.37) | 5.40 c | (1.43) | 5.54 e | (1.41) | 5.51 e | (1.38) |
| Carbohydrates (Total) | 5.42 a | (1.42) | 5.64 b | (1.37) | 5.60 c | (1.41) | 5.55 c | (1.34) | 5.54 e | (1.44) | 5.60 e | (1.37) |
| Sugar | 6.04 a | (1.31) | 6.40 b | (1.08) | 6.32 c | (1.15) | 6.32 c | (1.14) | 6.06 e | (1.44) | 6.38 f | (1.04) |
| Salt | 5.77 a | (1.43) | 6.18 b | (1.22) | 6.07 c | (1.31) | 6.12 c | (1.22) | 5.92 e | (1.53) | 6.14 f | (1.20) |
| Total | 5.63 a | (1.16) | 5.90 b | (0.98) | 5.86 c | (1.03) | 5.80 c | (1.03) | 5.74 e | (1.18) | 5.87 e | (0.98) |
| Sugar sources categorization | ||||||||||||
| 1. Hits: Composition | 36.04 a | (28.94) | 44.88 b | (30.84) | 41.24 c | (30.51) | 45.90 d | (30.65) | 31.34 e | (30.63) | 45.90 f | (29.89) |
| 2. Hits: Origin | 35.52 a | (25.15) | 41.11 b | (26.34) | 39.09 c | (26.49) | 41.40 c | (25.64) | 28.66 e | (25.68) | 42.89 f | (25.55) |
| SFLQ 1 | ||||||||||||
| Perceived capability (SFLQ_1) | 4.68 a | (1.03) | 4.99 b | (1.03) | 4.90 c | (1.06) | 4.96 c | (1.01) | 4.72 e | (1.06) | 4.97 f | (1.03) |
| Perceived knowledge (SFLQ_2) | 5.44 a | (1.35) | 5.88 b | (1.12) | 5.69 c | (1.23) | 5.96 d | (1.08) | 5.64 e | (1.22) | 5.82 e | (1.18) |
| Ease of comprehension of FS 2 definition | 3.88 a | (1.81) | 4.24 b | (1.98) | 4.13 c | (1.95) | 4.20 c | (1.96) | 3.90 e | (1.99) | 4.22 f | (1.93) |
| Ease of identification of FS | 3.74 a | (1.82) | 3.83 a | (1.91) | 3.77 c | (1.92) | 3.87 c | (1.85) | 3.82 e | (1.93) | 3.80 e | (1.89) |
| Total | 3.81 a | (1.72) | 4.04 a | (1.82) | 3.95 c | (1.80) | 4.03 c | (1.79) | 3.86 e | (1.85) | 4.00 e | (1.79) |
| 1. | 2. | 3. | 4. | 5. | 6. | 7. | 8. | 9. | |
|---|---|---|---|---|---|---|---|---|---|
| 1. Hits: Composition | - | ||||||||
| 2. Hits: Origin | 0.48 *** | - | |||||||
| 3. Sugar: Frequency of use | 0.26 *** | 0.29 *** | - | ||||||
| 4. Sugar: Importance | 0.16 *** | 0.16 *** | 0.40 *** | - | |||||
| 5. Perceived capability (SFLQ_1) | 0.22 *** | 0.21 *** | 0.41 *** | 0.20 *** | - | ||||
| 6. Perceived knowledge (SFLQ_2) | 0.19 *** | 0.13 *** | 0.33 *** | 0.24 *** | 0.52 *** | - | |||
| 7. Ease of comprehension and identification FS | 0.13 *** | 0.16 *** | 0.11 ** | −0.03 | 0.41 *** | 0.25 *** | - | ||
| 8. Age | −0.08 ** | −0.06 | 0.02 | −0.04 | 0.03 | 0.13 *** | 0.00 | - | |
| 9. BMI | −0.09 ** | −0.04 | −0.03 | −0.03 | −0.06 | −0.04 | 0.00 | 0.28 *** | - |
| 10. Frequency of sugar consumption | −0.10 ** | −0.07 * | −0.25 *** | −0.11 *** | −0.26 *** | −0.18 *** | −0.13 *** | −0.17 *** | 0.05 |
| B | SE B | β | |
|---|---|---|---|
| Step 1 | |||
| Constant | 26.50 | 5.72 | |
| Gender (women = 1; men = 0) | 5.94 | 1.86 | 0.10 ** |
| Age | −0.02 | 0.06 | −0.01 |
| Children in the household (1 = yes; no = 0) | 4.55 | 1.62 | 0.09 ** |
| Education (superior = 1 vs. not superior = 0) | 13.91 | 1.97 | 0.23 *** |
| BMI | −0.06 | 0.19 | −0.01 |
| Step 2 | |||
| Constant | 31.96 | 6.06 | |
| Gender (women = 1; men = 0) | 5.78 | 1.86 | 0.10 ** |
| Age | −0.06 | 0.06 | −0.03 |
| Children in the household (1 = yes; no = 0) | 4.50 | 1.62 | 0.09 ** |
| Education (superior = 1 vs. not superior = 0) | 13.23 | 1.98 | 0.22 *** |
| BMI | −0.02 | 0.19 | 0.00 |
| Frequency of sugar intake | −1.36 | 0.51 | −0.09 ** |
| Step 3 | |||
| Constant | −7.54 | 7.71 | |
| Gender (women = 1; men = 0) | 1.79 | 1.80 | 0.03 |
| Age | −0.07 | 0.06 | −0.04 |
| Children in the household (1 = yes; no = 0) | 3.52 | 1.55 | 0.07 * |
| Education (superior = 1 vs. not superior = 0) | 11.68 | 1.89 | 0.19 *** |
| BMI | −0.07 | 0.18 | −0.01 |
| Frequency of sugar intake | 0.14 | 0.50 | 0.01 |
| Sugar: Frequency of use | 2.79 | 0.47 | 0.21 *** |
| Sugar: Importance | 1.41 | 0.70 | 0.07 * |
| Perceived capability (SFLQ_1) | 1.87 | 0.91 | 0.08 * |
| Perceived knowledge guidelines (SFLQ_2) | 0.50 | 0.74 | 0.03 |
| Ease of comprehension and identification FS | 1.40 | 0.45 | 0.10 ** |
Publisher’s Note: MDPI stays neutral with regard to jurisdictional claims in published maps and institutional affiliations. |
© 2020 by the authors. Licensee MDPI, Basel, Switzerland. This article is an open access article distributed under the terms and conditions of the Creative Commons Attribution (CC BY) license (http://creativecommons.org/licenses/by/4.0/).
Share and Cite
Prada, M.; Saraiva, M.; Garrido, M.V.; Rodrigues, D.L.; Lopes, D. Knowledge about Sugar Sources and Sugar Intake Guidelines in Portuguese Consumers. Nutrients 2020, 12, 3888. https://doi.org/10.3390/nu12123888
Prada M, Saraiva M, Garrido MV, Rodrigues DL, Lopes D. Knowledge about Sugar Sources and Sugar Intake Guidelines in Portuguese Consumers. Nutrients. 2020; 12(12):3888. https://doi.org/10.3390/nu12123888
Chicago/Turabian StylePrada, Marília, Magda Saraiva, Margarida V. Garrido, David L. Rodrigues, and Diniz Lopes. 2020. "Knowledge about Sugar Sources and Sugar Intake Guidelines in Portuguese Consumers" Nutrients 12, no. 12: 3888. https://doi.org/10.3390/nu12123888
APA StylePrada, M., Saraiva, M., Garrido, M. V., Rodrigues, D. L., & Lopes, D. (2020). Knowledge about Sugar Sources and Sugar Intake Guidelines in Portuguese Consumers. Nutrients, 12(12), 3888. https://doi.org/10.3390/nu12123888