The Gut Microbiome, Aging, and Longevity: A Systematic Review


Abstract
1. Introduction
2. Materials and Methods
2.1. Inclusion and Exclusion Criteria
2.2. Review Process
3. Results
3.1. Characteristics of Reviewed Studies
3.2. Alpha Diversity
3.3. Beta Diversity
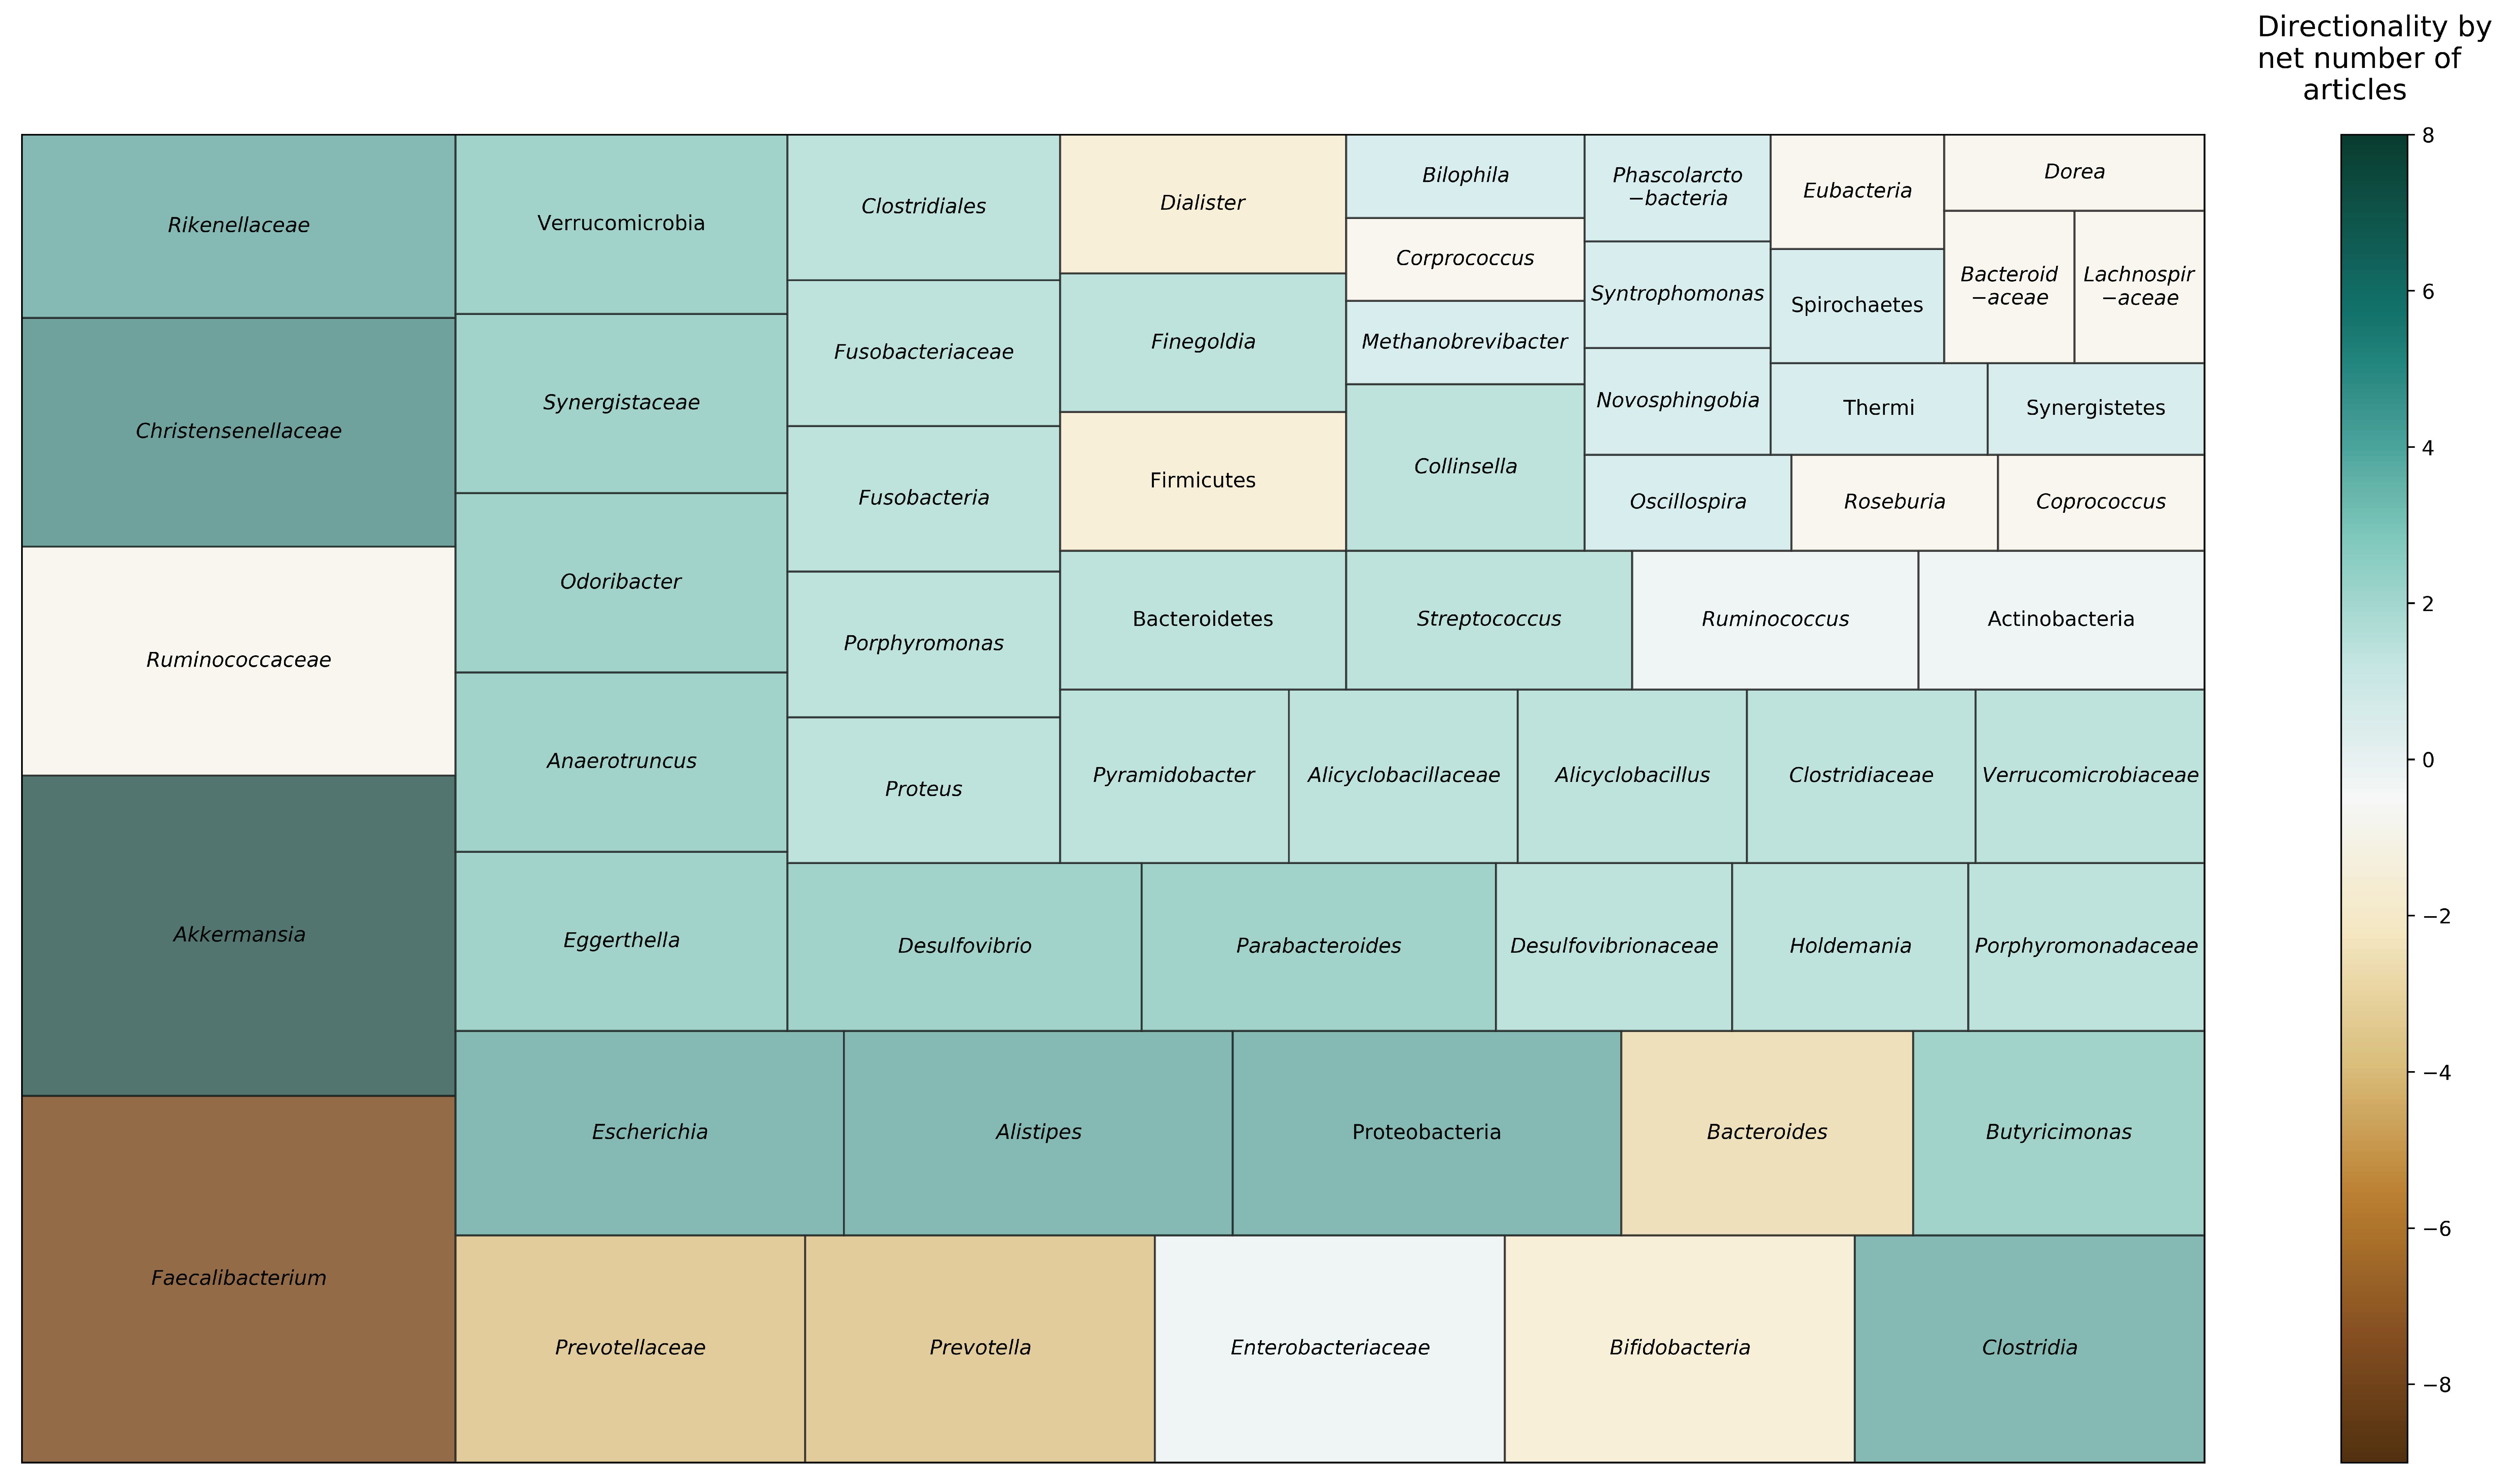
3.4. Taxonomic Composition
3.5. Functional Potential and Metabolites
4. Discussion
5. Conclusions
Supplementary Materials
Author Contributions
Funding
Conflicts of Interest
Appendix A
Appendix A.1. PubMed
Appendix A.2. PsycINFO
Appendix A.3. Embase
References
- Rogina, B.; Reenan, R.A.; Nilsen, S.P.; Helfand, S.L. Extended Life-Span Conferred by Cotransporter Gene Mutations in Drosophila. Science 2000, 290, 2137–2140. [Google Scholar] [CrossRef] [PubMed]
- López-Otín, C.; Blasco, M.A.; Partridge, L.; Serrano, M.; Kroemer, G. The Hallmarks of Aging. Cell 2013, 153, 1194–1217. [Google Scholar] [CrossRef] [PubMed]
- Clemente, J.C.; Ursell, L.K.; Parfrey, L.W.; Knight, R. The impact of the gut microbiota on human health: An integrative view. Cell 2012, 148, 1258–1270. [Google Scholar] [CrossRef] [PubMed]
- Bana, B.; Cabreiro, F. The Microbiome and Aging. Annu. Rev. Genet. 2019, 53, 239–261. [Google Scholar] [CrossRef]
- Honda, K.; Littman, D.R. The Microbiome in Infectious Disease and Inflammation. Annu. Rev. Immunol. 2012, 30, 759–795. [Google Scholar] [CrossRef]
- Franceschi, C.; Bonafè, M.; Valensin, S.; Olivieri, F.; De Luca, M.; Ottaviani, E.; De Benedictis, G. Inflamm-aging: An evolutionary perspective on immunosenescence. Ann. N. Y. Acad. Sci. 2000, 908, 244–254. [Google Scholar] [CrossRef]
- Ferrucci, L.; Fabbri, E. Inflammageing: Chronic inflammation in ageing, cardiovascular disease, and frailty. Nat. Rev. Cardiol. 2018, 15, 505–522. [Google Scholar] [CrossRef]
- Gorelick, P.B. Role of inflammation in cognitive impairment: Results of observational epidemiological studies and clinical trials. Ann. N. Y. Acad. Sci. 2010, 1207, 155–162. [Google Scholar] [CrossRef]
- Cryan, J.F.; Dinan, T.G. Mind-altering microorganisms: The impact of the gut microbiota on brain and behaviour. Nat. Rev. Neurosci. 2012, 13, 701–712. [Google Scholar] [CrossRef]
- Depp, C.A.; Jeste, D.V. Definitions and Predictors of Successful Aging: A Comprehensive Review of Larger Quantitative Studies. Am. J. Geriatr. Psychiatry 2006, 14, 6–20. [Google Scholar] [CrossRef]
- Franceschi, C.; Capri, M.; Monti, D.; Giunta, S.; Olivieri, F.; Sevini, F.; Panourgia, M.P.; Invidia, L.; Celani, L.; Scurti, M.; et al. Inflammaging and anti-inflammaging: A systemic perspective on aging and longevity emerged from studies in humans. Mech. Ageing Dev. 2007, 128, 92–105. [Google Scholar] [CrossRef] [PubMed]
- Brown, E.G.; Tanner, C.M.; Goldman, S.M. The Microbiome in Neurodegenerative Disease. Curr. Geriatr. Rep. 2018, 7, 81–91. [Google Scholar] [CrossRef]
- Ticinesi, A.; Tana, C.; Nouvenne, A.; Prati, B.; Lauretani, F.; Meschi, T. Gut microbiota, cognitive frailty and dementia in older individuals: A systematic review. Clin. Interv. Aging 2018, 13, 1497–1511. [Google Scholar] [CrossRef] [PubMed]
- Steves, C.J.; Bird, S.; Williams, F.M.; Spector, T.D. The Microbiome and Musculoskeletal Conditions of Aging: A Review of Evidence for Impact and Potential Therapeutics. J. Bone Miner. Res. 2016, 31, 261–269. [Google Scholar] [CrossRef]
- van den Munckhof, I.C.L.; Kurilshikov, A.; ter Horst, R.; Riksen, N.P.; Joosten, L.A.B.; Zhernakova, A.; Fu, J.; Keating, S.T.; Netea, M.G.; de Graaf, J.; et al. Role of gut microbiota in chronic low-grade inflammation as potential driver for atherosclerotic cardiovascular disease: A systematic review of human studies. Obes. Rev. 2018, 19, 1719–1734. [Google Scholar] [CrossRef]
- Bischoff, S.C. Microbiota and aging. Curr. Opin. Clin. Nutr. Metab. Care 2016, 19, 26–30. [Google Scholar] [CrossRef]
- Zapata, H.J.; Quagliarello, V.J. The Microbiota and Microbiome in Aging: Potential Implications in Health and Age-Related Diseases. J. Am. Geriatr. Soc. 2015, 63, 776–781. [Google Scholar] [CrossRef]
- Santoro, A.; Ostan, R.; Candela, M.; Biagi, E.; Brigidi, P.; Capri, M.; Franceschi, C. Gut microbiota changes in the extreme decades of human life: A focus on centenarians. Cell. Mol. Life Sci. 2018, 75, 129–148. [Google Scholar] [CrossRef]
- Biagi, E.; Franceschi, C.; Rampelli, S.; Severgnini, M.; Ostan, R.; Turroni, S.; Consolandi, C.; Quercia, S.; Scurti, M.; Monti, D. Gut microbiota and extreme longevity. Curr. Biol. 2016, 26, 1480–1485. [Google Scholar] [CrossRef]
- Drago, L.; Toscano, M.; Rodighiero, V.; De Vecchi, E.; Mogna, G. Cultivable and pyrosequenced fecal microflora in centenarians and young subjects. J. Clin. Gastroenterol. 2012, 46, S81–S84. [Google Scholar] [CrossRef]
- Kim, B.-S.; Choi, C.W.; Shin, H.; Jin, S.-P.; Bae, J.-S.; Han, M.; Seo, E.Y.; Chun, J.; Chung, J.H. Comparison of the gut microbiota of centenarians in longevity villages of South Korea with those of other age groups. J. Microbiol. Biotechnol. 2019, 29, 429–440. [Google Scholar] [CrossRef] [PubMed]
- Kong, F.; Hua, Y.; Zeng, B.; Ning, R.; Li, Y.; Zhao, J. Gut microbiota signatures of longevity. Curr. Biol. 2016, 26, R832–R833. [Google Scholar] [CrossRef] [PubMed]
- Rampelli, S.; Candela, M.; Turroni, S.; Biagi, E.; Collino, S.; Franceschi, C.; O’Toole, P.W.; Brigidi, P. Functional metagenomic profiling of intestinal microbiome in extreme ageing. Aging 2013, 5, 902–912. [Google Scholar] [CrossRef] [PubMed]
- Tuikhar, N.; Keisam, S.; Labala, R.K.; Ramakrishnan, P.; Arunkumar, M.C.; Ahmed, G.; Biagi, E.; Jeyaram, K. Comparative analysis of the gut microbiota in centenarians and young adults shows a common signature across genotypically non-related populations. Mech. Ageing Dev. 2019, 179, 23–35. [Google Scholar] [CrossRef]
- Wu, L.; Zeng, T.; Zinellu, A.; Rubino, S.; Kelvin, D.J.; Carru, C. A Cross-Sectional Study of Compositional and Functional Profiles of Gut Microbiota in Sardinian Centenarians. mSystems 2019, 4, e00325-19. [Google Scholar] [CrossRef]
- Yu, X.; Wu, X.; Qiu, L.; Wang, D.; Gan, M.; Chen, X.; Wei, H.; Xu, F. Analysis of the intestinal microbial community structure of healthy and long-living elderly residents in Gaotian Village of Liuyang City. Appl. Microbiol. Biotechnol. 2015, 99, 9085–9095. [Google Scholar] [CrossRef]
- Claesson, M.J.; Jeffery, I.B.; Conde, S.; Power, S.E.; O’connor, E.M.; Cusack, S.; Harris, H.M.; Coakley, M.; Lakshminarayanan, B.; O’Sullivan, O. Gut microbiota composition correlates with diet and health in the elderly. Nature 2012, 488, 178–184. [Google Scholar] [CrossRef]
- Hippe, B.; Zwielehner, J.; Liszt, K.; Lassl, C.; Unger, F.; Haslberger, A.G. Quantification of butyryl CoA: Acetate CoA-transferase genes reveals different butyrate production capacity in individuals according to diet and age. FEMS Microbiol. Lett. 2011, 316, 130–135. [Google Scholar] [CrossRef]
- Hopkins, M.J.; Sharp, R.; Macfarlane, G.T. Variation in human intestinal microbiota with age. Digest. Liver Dis. 2002, 34, S12–S18. [Google Scholar] [CrossRef]
- Jeffery, I.B.; Lynch, D.B.; O’toole, P.W. Composition and temporal stability of the gut microbiota in older persons. ISME J. 2016, 10, 170. [Google Scholar] [CrossRef]
- Kato, K.; Odamaki, T.; Mitsuyama, E.; Sugahara, H.; Xiao, J.-Z.; Osawa, R. Age-Related Changes in the Composition of Gut Bifidobacterium Species. Curr. Microbiol. 2017, 74, 987–995. [Google Scholar] [CrossRef] [PubMed]
- Kushugulova, A.; Kozhakhmetov, S.; Baiskhanova, D.; Tynybayeva, I.; Kakimova, A.; Khassenbekova, Z.; Saduakhasova, S.; Shakhabaeva, G.; Nagyzbekkyzy, E.; Nurgozhin, T. GUT MICROBIOME DIVERSITY IN KAZAKHSTANI WOMEN OF DIFFERENT AGE GROUPS. Int. J. Probiot. Prebiot. 2015, 10, 97–108. [Google Scholar]
- Le Roy, C.I.; Štšepetova, J.; Sepp, E.; Songisepp, E.; Claus, S.P.; Mikelsaar, M. New insights into the impact of Lactobacillus population on host-bacteria metabolic interplay. Oncotarget 2015, 6, 30545. [Google Scholar] [CrossRef] [PubMed]
- Odamaki, T.; Kato, K.; Sugahara, H.; Hashikura, N.; Takahashi, S.; Xiao, J.-Z.; Abe, F.; Osawa, R. Age-related changes in gut microbiota composition from newborn to centenarian: A cross-sectional study. BMC Microbiol. 2016, 16, 90. [Google Scholar] [CrossRef] [PubMed]
- Odamaki, T.; Bottacini, F.; Kato, K.; Mitsuyama, E.; Yoshida, K.; Horigome, A.; Xiao, J.-z.; van Sinderen, D. Genomic diversity and distribution of Bifidobacterium longum subsp. longum across the human lifespan. Sci. Rep. 2018, 8, 85. [Google Scholar] [CrossRef]
- Pan, Y.; Wang, F.; Sun, D.-W.; Li, Q. Intestinal Lactobacillus community structure and its correlation with diet of Southern Chinese elderly subjects. J. Microbiol. 2016, 54, 594–601. [Google Scholar] [CrossRef]
- Ruiz-Ruiz, S.; Sanchez-Carrillo, S.; Ciordia, S.; Mena, M.C.; Méndez-García, C.; Rojo, D.; Bargiela, R.; Zubeldia-Varela, E.; Martínez-Martínez, M.; Barbas, C. Functional microbiome deficits associated with ageing: Chronological age threshold. Aging Cell 2019, 19, e13063. [Google Scholar] [CrossRef]
- Singh, H.; Torralba, M.G.; Moncera, K.J.; DiLello, L.; Petrini, J.; Nelson, K.E.; Pieper, R. Gastro-intestinal and oral microbiome signatures associated with healthy aging. GeroScience 2019, 41, 907–921. [Google Scholar] [CrossRef]
- Anderson, J.R.; Carroll, I.; Azcarate-Peril, M.A.; Rochette, A.D.; Heinberg, L.J.; Peat, C.; Steffen, K.; Manderino, L.M.; Mitchell, J.; Gunstad, J. A preliminary examination of gut microbiota, sleep, and cognitive flexibility in healthy older adults. Sleep Med. 2017, 38, 104–107. [Google Scholar] [CrossRef]
- Manderino, L.; Carroll, I.; Azcarate-Peril, M.A.; Rochette, A.; Heinberg, L.; Peat, C.; Steffen, K.; Mitchell, J.; Gunstad, J. Preliminary Evidence for an Association Between the Composition of the Gut Microbiome and Cognitive Function in Neurologically Healthy Older Adults. J. Int. Neuropsychol. Soc. 2017, 23, 700–705. [Google Scholar] [CrossRef]
- Verdi, S.; Jackson, M.A.; Beaumont, M.; Bowyer, R.C.E.; Bell, J.T.; Spector, T.D.; Steves, C.J. An Investigation Into Physical Frailty as a Link Between the Gut Microbiome and Cognitive Health. Front. Aging Neurosci. 2018, 10, 398. [Google Scholar] [CrossRef] [PubMed]
- An, R.; Wilms, E.; Smolinska, A.; Hermes, G.D.; Masclee, A.A.; de Vos, P.; Schols, H.A.; van Schooten, F.J.; Smidt, H.; Jonkers, D.M. Sugar Beet Pectin Supplementation Did Not Alter Profiles of Fecal Microbiota and Exhaled Breath in Healthy Young Adults and Healthy Elderly. Nutrients 2019, 11, 2193. [Google Scholar] [CrossRef] [PubMed]
- Bjorklund, M.; Ouwehand, A.C.; Forssten, S.D.; Nikkila, J.; Tiihonen, K.; Rautonen, N.; Lahtinen, S.J. Gut microbiota of healthy elderly NSAID users is selectively modified with the administration of Lactobacillus acidophilus NCFM and lactitol. Age 2012, 34, 987–999. [Google Scholar] [CrossRef] [PubMed]
- Spaiser, S.J.; Culpepper, T.; Nieves, C., Jr.; Ukhanova, M.; Mai, V.; Percival, S.S.; Christman, M.C.; Langkamp-Henken, B. Lactobacillus gasseri KS-13, Bifidobacterium bifidum G9-1, and Bifidobacterium longum MM-2 Ingestion Induces a Less Inflammatory Cytokine Profile and a Potentially Beneficial Shift in Gut Microbiota in Older Adults: A Randomized, Double-Blind, Placebo-Controlled, Crossover Study. J. Am. Coll. Nutr. 2015, 34, 459–469. [Google Scholar] [CrossRef]
- Valentini, L.; Pinto, A.; Bourdel-Marchasson, I.; Ostan, R.; Brigidi, P.; Turroni, S.; Hrelia, S.; Hrelia, P.; Bereswill, S.; Fischer, A. Impact of personalized diet and probiotic supplementation on inflammation, nutritional parameters and intestinal microbiota–The “RISTOMED project”: Randomized controlled trial in healthy older people. Clin. Nutr. 2015, 34, 593–602. [Google Scholar] [CrossRef]
- Virgin, H.W.; Todd, J.A. Metagenomics and personalized medicine. Cell 2011, 147, 44–56. [Google Scholar] [CrossRef]
- Turnbaugh, P.J.; Ley, R.E.; Mahowald, M.A.; Magrini, V.; Mardis, E.R.; Gordon, J.I. An obesity-associated gut microbiome with increased capacity for energy harvest. Nature 2006, 444, 1027. [Google Scholar] [CrossRef]
- Manichanh, C.; Rigottier-Gois, L.; Bonnaud, E.; Gloux, K.; Pelletier, E.; Frangeul, L.; Nalin, R.; Jarrin, C.; Chardon, P.; Marteau, P. Reduced diversity of faecal microbiota in Crohn’s disease revealed by a metagenomic approach. Gut 2006, 55, 205–211. [Google Scholar] [CrossRef]
- Sartor, R.B. Genetics and environmental interactions shape the intestinal microbiome to promote inflammatory bowel disease versus mucosal homeostasis. Gastroenterology 2010, 139, 1816–1819. [Google Scholar] [CrossRef]
- Yatsunenko, T.; Rey, F.E.; Manary, M.J.; Trehan, I.; Dominguez-Bello, M.G.; Contreras, M.; Magris, M.; Hidalgo, G.; Baldassano, R.N.; Anokhin, A.P.; et al. Human gut microbiome viewed across age and geography. Nature 2012, 486, 222–227. [Google Scholar] [CrossRef]
- Kashtanova, D.A.; Tkacheva, O.N.; Doudinskaya, E.N.; Strazhesko, I.D.; Kotovskaya, Y.V.; Popenko, A.S.; Tyakht, A.V.; Alexeev, D.G. Gut microbiota in patients with different metabolic statuses: Moscow study. Microorganisms 2018, 6, 98. [Google Scholar] [CrossRef] [PubMed]
- Wu, X.; Liu, J.; Xiao, L.; Lu, A.; Zhang, G. Alterations of gut microbiome in rheumatoid arthritis. Osteoarthr. Cartil. 2017, 25, S287–S288. [Google Scholar] [CrossRef]
- Allesina, S.; Tang, S. Stability criteria for complex ecosystems. Nature 2012, 483, 205–208. [Google Scholar] [CrossRef] [PubMed]
- Mariat, D.; Firmesse, O.; Levenez, F.; Guimarăes, V.; Sokol, H.; Doré, J.; Corthier, G.; Furet, J. The Firmicutes/Bacteroidetes ratio of the human microbiota changes with age. BMC Microbiol. 2009, 9, 123. [Google Scholar] [CrossRef] [PubMed]
- Walters, W.A.; Xu, Z.; Knight, R. Meta-analyses of human gut microbes associated with obesity and IBD. FEBS Lett. 2014, 588, 4223–4233. [Google Scholar] [CrossRef]
- Casati, M.; Ferri, E.; Azzolino, D.; Cesari, M.; Arosio, B. Gut microbiota and physical frailty through the mediation of sarcopenia. Exp. Gerontol. 2019, 124, 110639. [Google Scholar] [CrossRef] [PubMed]
- Wang, K.; Liao, M.; Zhou, N.; Bao, L.; Ma, K.; Zheng, Z.; Wang, Y.; Liu, C.; Wang, W.; Wang, J. Parabacteroides distasonis alleviates obesity and metabolic dysfunctions via production of succinate and secondary bile acids. Cell Rep. 2019, 26, 222–235. [Google Scholar] [CrossRef]
- Zhang, X.; Zhang, N.; Kan, J.; Sun, R.; Tang, S.; Wang, Z.; Chen, M.; Liu, J.; Jin, C. Anti-inflammatory activity of alkali-soluble polysaccharides from Arctium lappa L. and its effect on gut microbiota of mice with inflammation. Int. J. Biol. Macromol. 2020, 154, 773–787. [Google Scholar] [CrossRef]
- Sakamoto, M.; Takagaki, A.; Matsumoto, K.; Kato, Y.; Goto, K.; Benno, Y. Butyricimonas synergistica gen. nov., sp. nov. and Butyricimonas virosa sp. nov., butyric acid-producing bacteria in the family ‘Porphyromonadaceae’ isolated from rat faeces. Int. J. Syst. Evol. Microbiol. 2009, 59, 1748–1753. [Google Scholar] [CrossRef]
- Biagi, E.; Candela, M.; Fairweather-Tait, S.; Franceschi, C.; Brigidi, P. Ageing of the human metaorganism: The microbial counterpart. Age 2012, 34, 247–267. [Google Scholar] [CrossRef]
- Waters, J.L.; Ley, R.E. The human gut bacteria Christensenellaceae are widespread, heritable, and associated with health. BMC Biol. 2019, 17, 83. [Google Scholar] [CrossRef]
- Everard, A.; Belzer, C.; Geurts, L.; Ouwerkerk, J.P.; Druart, C.; Bindels, L.B.; Guiot, Y.; Derrien, M.; Muccioli, G.G.; Delzenne, N.M. Cross-talk between Akkermansia muciniphila and intestinal epithelium controls diet-induced obesity. Proc. Natl. Acad. Sci. USA 2013, 110, 9066–9071. [Google Scholar] [CrossRef] [PubMed]
- Xu, Y.; Wang, N.; Tan, H.-Y.; Li, S.; Zhang, C.; Feng, Y. Function of Akkermansia muciniphila in Obesity: Interactions With Lipid Metabolism, Immune Response and Gut Systems. Front. Microbiol. 2020, 11. [Google Scholar] [CrossRef] [PubMed]
- Rizzatti, G.; Lopetuso, L.; Gibiino, G.; Binda, C.; Gasbarrini, A. Proteobacteria: A common factor in human diseases. BioMed Res. Int. 2017, 2017, 9351507. [Google Scholar] [CrossRef] [PubMed]
- Louis, P.; Flint, H.J. Formation of propionate and butyrate by the human colonic microbiota. Environ. Microbiol. 2017, 19, 29–41. [Google Scholar] [CrossRef] [PubMed]
- Baggio, G.; Donazzan, S.; Monti, D.; Mari, D.; Martini, S.; Gabelli, C.; Dalla Vestra, M.; Previato, L.; Guido, M.; Pigozzo, S. Lipoprotein (a) and lipoprotein profile in healthy centenarians: A reappraisal of vascular risk factors. FASEB J. 1998, 12, 433–437. [Google Scholar] [CrossRef]
- Gangemi, S.; Basile, G.; Merendino, R.A.; Minciullo, P.L.; Novick, D.; Rubinstein, M.; Dinarello, C.A.; Balbo, C.L.; Franceschi, C.; Basili, S. Increased circulating Interleukin-18 levels in centenarians with no signs of vascular disease: Another paradox of longevity? Exp. Gerontol. 2003, 38, 669–672. [Google Scholar] [CrossRef]
- Lio, D.; Scola, L.; Crivello, A.; Colonna-Romano, G.; Candore, G.; Bonafe, M.; Cavallone, L.; Franceschi, C.; Caruso, C. Gender-specific association between− 1082 IL-10 promoter polymorphism and longevity. Genes Immun. 2002, 3, 30–33. [Google Scholar] [CrossRef]
- Campbell, J.H.; Foster, C.M.; Vishnivetskaya, T.; Campbell, A.G.; Yang, Z.K.; Wymore, A.; Palumbo, A.V.; Chesler, E.J.; Podar, M. Host genetic and environmental effects on mouse intestinal microbiota. ISME J. 2012, 6, 2033–2044. [Google Scholar] [CrossRef]
- Dąbrowska, K.; Witkiewicz, W. Correlations of Host Genetics and Gut Microbiome Composition. Front. Microbiol. 2016, 7. [Google Scholar] [CrossRef]
- Goodrich, J.K.; Waters, J.L.; Poole, A.C.; Sutter, J.L.; Koren, O.; Blekhman, R.; Beaumont, M.; Van Treuren, W.; Knight, R.; Bell, J.T.; et al. Human Genetics Shape the Gut Microbiome. Cell 2014, 159, 789–799. [Google Scholar] [CrossRef] [PubMed]
- Davenport, E.R.; Cusanovich, D.A.; Michelini, K.; Barreiro, L.B.; Ober, C.; Gilad, Y. Genome-Wide Association Studies of the Human Gut Microbiota. PLoS ONE 2015, 10, e0140301. [Google Scholar] [CrossRef] [PubMed]
- Suzuki, T.A.; Phifer-Rixey, M.; Mack, K.L.; Sheehan, M.J.; Lin, D.; Bi, K.; Nachman, M.W. Host genetic determinants of the gut microbiota of wild mice. Mol. Ecol. 2019, 28, 3197–3207. [Google Scholar] [CrossRef] [PubMed]
- Lim, M.Y.; You, H.J.; Yoon, H.S.; Kwon, B.; Lee, J.Y.; Lee, S.; Song, Y.-M.; Lee, K.; Sung, J.; Ko, G. The effect of heritability and host genetics on the gut microbiota and metabolic syndrome. Gut 2017, 66, 1031–1038. [Google Scholar] [CrossRef]
- Wu, G.D.; Chen, J.; Hoffmann, C.; Bittinger, K.; Chen, Y.Y.; Keilbaugh, S.A.; Bewtra, M.; Knights, D.; Walters, W.A.; Knight, R.; et al. Linking long-term dietary patterns with gut microbial enterotypes. Science 2011, 334, 105–108. [Google Scholar] [CrossRef]
- Muegge, B.D.; Kuczynski, J.; Knights, D.; Clemente, J.C.; Gonzalez, A.; Fontana, L.; Henrissat, B.; Knight, R.; Gordon, J.I. Diet drives convergence in gut microbiome functions across mammalian phylogeny and within humans. Science 2011, 332, 970–974. [Google Scholar] [CrossRef]
- Jeffery, I.B.; O’Toole, P.W. Diet-microbiota interactions and their implications for healthy living. Nutrients 2013, 5, 234–252. [Google Scholar] [CrossRef]
- Kahleova, H.; Levin, S.; Barnard, N.D. Plant-Based Diets for Healthy Aging. J. Am. Coll. Nutr. 2020, 1–2. [Google Scholar] [CrossRef]
- Gill, P.A.; van Zelm, M.C.; Muir, J.G.; Gibson, P.R. Review article: Short chain fatty acids as potential therapeutic agents in human gastrointestinal and inflammatory disorders. Aliment. Pharm. Ther. 2018, 48, 15–34. [Google Scholar] [CrossRef]
- Yoshii, K.; Hosomi, K.; Sawane, K.; Kunisawa, J. Metabolism of dietary and microbial vitamin B family in the regulation of host immunity. Front. Nutr. 2019, 6, 48. [Google Scholar] [CrossRef]
- Gast, G.-C.M.; de Roos, N.M.; Sluijs, I.; Bots, M.L.; Beulens, J.W.; Geleijnse, J.M.; Witteman, J.C.; Grobbee, D.E.; Peeters, P.H.; van der Schouw, Y.T. A high menaquinone intake reduces the incidence of coronary heart disease. Nutr. Metab. Cardiovasc. Dis. 2009, 19, 504–510. [Google Scholar] [CrossRef] [PubMed]
- Huttenhower, C.; Gevers, D.; Knight, R.; Abubucker, S.; Badger, J.H.; Chinwalla, A.T.; Creasy, H.H.; Earl, A.M.; FitzGerald, M.G.; Fulton, R.S.; et al. Structure, function and diversity of the healthy human microbiome. Nature 2012, 486, 207–214. [Google Scholar] [CrossRef]
- Kovacs, A.; Ben-Jacob, N.; Tayem, H.; Halperin, E.; Iraqi, F.A.; Gophna, U. Genotype Is a Stronger Determinant than Sex of the Mouse Gut Microbiota. Microb. Ecol. 2011, 61, 423–428. [Google Scholar] [CrossRef]
- Escobar, J.S.; Klotz, B.; Valdes, B.E.; Agudelo, G.M. The gut microbiota of Colombians differs from that of Americans, Europeans and Asians. BMC Microbiol. 2014, 14, 311. [Google Scholar] [CrossRef]
- Austad, S.N. Why women live longer than men: Sex differences in longevity. Gender Med. 2006, 3, 79–92. [Google Scholar] [CrossRef]
- Saad, N.; Delattre, C.; Urdaci, M.; Schmitter, J.M.; Bressollier, P. An overview of the last advances in probiotic and prebiotic field. LWT Food Sci. Technol. 2013, 50, 1–16. [Google Scholar] [CrossRef]
- Sofi, F.; Cesari, F.; Abbate, R.; Gensini, G.F.; Casini, A. Adherence to Mediterranean diet and health status: Meta-analysis. BMJ 2008, 337, a1344. [Google Scholar] [CrossRef]
- Meslier, V.; Laiola, M.; Roager, H.M.; De Filippis, F.; Roume, H.; Quinquis, B.; Giacco, R.; Mennella, I.; Ferracane, R.; Pons, N.; et al. Mediterranean diet intervention in overweight and obese subjects lowers plasma cholesterol and causes changes in the gut microbiome and metabolome independently of energy intake. Gut 2020, 69, 1258–1268. [Google Scholar] [CrossRef]
- Garcia-Mantrana, I.; Selma-Royo, M.; Alcantara, C.; Collado, M.C. Shifts on Gut Microbiota Associated to Mediterranean Diet Adherence and Specific Dietary Intakes on General Adult Population. Front. Microbiol. 2018, 9. [Google Scholar] [CrossRef]


| Publication | Country (Rural/Urban) | Sample Size (Age Range) | Gender (%Female) | Sequencing/Genetic Analysis | Diversity Patterns | Taxonomic Composition | Functional Potential and Metabolites |
|---|---|---|---|---|---|---|---|
| Centenarian Studies | |||||||
| Biagi et al., 2016 [19] | Italy (U) | SCTN: 24 (105–109) LL: 15 (99–104) YO: 15 (65–75) ADT: 15 (22–48) | SCTN: 75.0 LL: 93.3 YO: 46.7 ADT: 53.3 | 16S rRNA (V3-V4) | α: N/A β: Different between all possible comparisons of age groups (SCTN, LL, YO, ADT), except between SCTN and LL (unweighted UniFrac) | Changes with aging (SCTN, LL, YO, ADT): Family: ↓ Bacteroidaceae, ↓ Lachnospiraceae, ↓ Ruminococcaceae, ↑ Synergistaceae, and ↑ Christensenellaceae with aging | N/A |
| Drago et al., 2012 [20] | Italy (U) | CTN: 14 (100–104) ADT: 10 (24–57) | CTN: not reported ADT: not reported | 16S rDNA pyrosequencing | α: N/A β: N/A | Family/Genera: CTN ↓ Enterobacteriaceae, ↓ Bifidobacteria, ↓ Bacteroides, compared to ADT Species: CTN ↑ Bifidobacterium longum, ↑ Clostridia sensu stricto, compared to ADT | N/A |
| Kim et al., 2019 [21] | South Korea (R) | LL: 30 (95–108) YO: 17 (67–69) ADT: 9 (26–43) | LL: 90.0 YO: 41.2 ADT: 33.3 | 16S rRNA (V1-V3) pyrosequencing | α: No difference across LL, YO, and ADT groups (Shannon, observed OTUs) β: Did not report across LL, YO, and ADT | Phylum: LL ↑ Verrucomicrobia, compared to YO, and ↑ Verrucomicrobia, ↑ Proteobacteria, ↑ Actinobacteria, compared to ADT; YO ↓ Bacteroidetes and ↑ Proteobacteria, compared to ADT Family/Genera: LL ↓ Faecalibacterium, ↓ Prevotella, ↑ Escherichia, ↑ Akkermansia, ↑ Clostridium, ↑ Collinsella, ↑ Streptococcus, ↑ uncultured Christensenellaceae, compared to YO and ADT | KEGG Level 1: LL and ADT ↑ pathways related to metabolism, compared to YO; ↓ pathways related to genetic information processing in LL, then YO, then ADT; LL and YO ↑ pathways related to environmental information processing, compared to ADT. KEGG Level 3: 26 metabolic pathways different between groups; of these, LL ↑ phosphatidylinositol signaling system, compared to YO and ADT; LL and ADT ↑ glycosphingolipid biosynthesis, compared to YO, and LL ↑ N-glycan biosynthesis, compared to YO and ADT |
| Kong et al., 2016 [22] | China (U) | LL: 67 (90–102) ADT: 101 (24–83) | LL: 61.2 ADT: 45.8 | 16S rRNA (V4-V5) | α: LL ↑ observed OTUs, ↑ Chao, ↑ Shannon, compared to ADT β: Did not assess between LL vs. ADT | Family/Genera: LL ↑ Ruminococcaceae, ↑ Christensenellaceae, ↑ Clostridium cluster XIVa, ↑ Akkermansia, compared to ADT | N/A |
| Rampelli et al., 2013 [23] | Italy (U) | LL: 3 (99–102) YO: 5 (59–75) ADT: 1 (38) | LL: not reported YO: not reported ADT: not reported | Shotgun metagenomic sequencing | α: N/A β: Different between LL and YO (Euclidean distance) | Genera: LL ↑ Escherichia, and ↑ Ruminococcus, compared to YO; YO ↑ Faecalibacterium, ↑ Eubacterium, and ↑ Bifidobacterium, compared to LL | α: No differences between LL and YO for KEGG pathways (Simpson index) β: LL different from YO and ADT for KEGG pathways (Euclidean distance) Aging (LL, YO) associated with ↑ metabolism of aromatic amino acids (tryptophan and phenylalanine), metabolism of amino acids (tyrosine, valine and lysine); ADT profile associated with ↑ metabolism amino acids (histidine) and carbohydrates (glucose, galactose), pyruvate, and butanoate, and ↑ SCFA production. |
| Tuikhar et al., 2019 [24] | India (R) | LL: 30 (97–110) ADT internal: 30 (28–47)ADT external: 30 (22–50) | LL: 50.0 ADT internal: 60.0ADT external: 50.0 | 16S rRNA (V4-V5) qPCR | α: LL ↑ Chao1, compared to ADT; no difference in Shannon index β: Different between LL and ADT (Bray–Curtis) | Family/Genera: LL ↓ Prevotellaceae, ↑ Eggerthella, ↑ Rikenellaceae, ↑ Alistipes, ↑ Porphyromonadaceae, ↑ Parabacteroides, ↑ Porphyromonas, ↑ Odoribacter, ↑ Butyricimonas, ↑ Alicyclobacillaceae, ↑ Alicyclobacillus, ↑ Clostridiaceae_Finegoldia, ↓ Ruminococcaceae, ↓ Faecalibacterium, ↑ Anaerotruncus, ↑ Enterobacteriaceae, ↑ Desulfovibrionaceae, ↑ Desulfovibrio, ↑ Synergistaceae, ↑ Pyramidobacter, ↑ Verrucomicrobiaceae, ↑ Akkermansia and ↑ Clostridiales Family XI Incertae Sedis, compared to ADT Species: LL ↑ Alistipes shahii, ↑ Porphyromonas uenonis, ↑ Odoribacter splanchnicus, ↑ Parabacteroides goldsteinii, ↑ Alicyclobacillus acidoterrestris, ↑ Finegoldia magna, ↑ Clostridium aminobutyricum, ↑ Clostridium p_enrichment_culture_clone_7_25, ↑ Clostridium sp_Kas107_1, ↑ Clostridium hathewayi, ↑ Eubacterium siraeum, ↑ Clostridium cellulolyticum, ↑ Clostridium asparagiforme, ↑ Faecalibacterium prausnitzii, ↑ Clostridium methylpentosum, ↑ Anaerotruncus colihominis, ↑ Escherichia albertii, ↑ Pyramidobacter piscolens, ↑ Akkermansia muciniphila, compared to ADT | 109 out of 871 metabolites significantly different between LL and ADT. LL ↑ DL-3-Aminoisobutyric acid, ↑ N-Ethylglycine, ↑ gamma-Aminobutyric acid (GABA), ↑ Imidazoleacetic acid, ↑ Niridazole, ↑ Erucic acid, ↑ Dihydroxyphthalic acid, ↑ Nitridazole, ↑ Triacetin, ↑ Goralatide, compared to ADT internal and external; ↓ cyclohexanecarboxylic acid, compared to ADT internal; ↓ 13-cis,16-cis-Docosadienoic acid, compared to ADT external |
| Wu et al., 2019 [25] | Italy (R) | LL: 19 (99–107) YO: 23 (68–88) ADT: 17 (21–33) | LL: 68.4 YO: 56.5 ADT: 58.8 | Shotgun metagenomic sequencing | α: No difference across age groups (LL, YO, ADT) (Shannon index, observed OTUs) β: LL different from YO and ADT (Bray–Curtis) | Phyla: LL ↑ Proteobacteria, compared to YO and ADT; LL ↓ Firmicutes and ↓ Firmicutes/Bacteroidetes ratio, compared to YO Genera: LL ↓ Faecalibacterium, ↓ Ruminococcus, ↓ Corprococcus, ↓ Dorea, ↑ Methanobrevibacter, compared to YO and ADT Species: LL ↓ Faecalibacterium prausnitzi, ↓ Eubacterium rectale, ↑ Bifidobacterium adolescentis, ↓ Ruminococcus sp_5_1_39BFAA, ↓ Dorea longicatena, ↑ Methanobrevibacter smithii, compared to YO and ADT | α: LL ↑ Shannon and ↑ observed KOs, compared to YO and ADT; no difference between YO and ADT β: LL different from YO and ADT (Bray–Curtis); no difference between YO and ADT 115 out of 463 gene pathways significantly different among age groups LL ↑ pathways related to central metabolism (glycolysis, pentose phosphate pathways, and tricarboxylic acid cycle), ↑ anaerobic respiration, ↑ aerobic respiration, ↑ metabolism of and fermentation to SCFAs (propanoate and acetate), ↓ amino acid biosynthesis pathways (e.g., L-lysine-, L-isoleucine-, and L-methionine), ↑ aromatic compounds (e.g., L-phenylalanine metabolism and chorismite biosynthesis), ↓ pathways related to carbohydrate degradation, ↑ vitamin B2 and K2 synthesis pathways, ↑ KOs related to phosphotransferase system, F420, and coenzyme M, compared to YO and ADT; LL and YO ↓ vitamin B1 synthesis pathways, compared to ADT |
| Yu et al., 2015 [26] | China (R) | LL: 21 (50–95) CK: 28 (range not reported; mean: 50) | LL: 52.4 CK: Not reported | 16S rRNA (V4) qPCR | α: LL ↑ Chao1 and Shannon index, compared to CK β: Different between CK and LL (unweighted UniFrac) | Phylum: LL ↓ Firmicutes, ↑ Bacteroidetes, ↑ Proteobacteria, ↑ Verrucomicrobia, ↑ Spirochaetes, ↑ Synergistetes, ↑ Thermi, compared to CK Genera: LL ↑ Escherichia, ↑ Phascolarctobacterium, ↑ Parabacteroides, ↑ Desulfovibrio, ↑ Syntrophomonas, ↑ Novosphingobium, ↓ Faecalibacterium, compared to CK | N/A |
| Lifespan Studies | |||||||
| Claesson et al., 2012 [27] | Ireland (U) | YO: 178 (64–102) ADT: 13 (28–46) | YO: not reported ADT: not reported | 16S rRNA (V4) | α: Did not report between YO and ADT β: No difference between community-dwelling YO and ADT | Genus: YO ↓ Ruminococcus, ↓ Blautia, ↑ Escherichia/Shigella, compared to ADT | Did not report between YO and ADT |
| Hippe et al., 2011 [28] | Austria (U) | YO: 15 (range not reported; mean: 86) ADT vegetarians: 15 (range not reported; mean: 26) ADT omnivores: 17 (range not reported; mean: 24) | YO: not reported ADT vegetarians: not reported ADT omnivores: not reported | 16S rRNA genes and metabolic genes qPCR | α: N/A β: N/A | Genus: YO ↓ Clostridium cluster XIVa, compared to ADT omnivores and ADT vegetarians Species: (Melt curve analysis) YO ↓ Eubacterium hallii/Anaerostipes coli, ↓ E. rectale/Roseburia spp., ↓ F. prausnitzii melt peaks, compared to ADT omnivores and ADT vegetarians | YO ↓ butyryl-CoA:acetate CoA-transferase gene, compared to ADT; ↑ ADT vegetarians, compared ADT omnivores. |
| Hopkins et al., 2002 [29] | United Kingdom (U) | NHYO: 4 (68–73) YO: 5 (67–88) ADT: 7 (21–34) CHD: 10 (16 months-7) | NHYO: not reported YO: not reported ADT: not reported CHD: not reported | 16S rRNA | α: N/A β: N/A | Genus: NHYO ↓ Bacteroides, compared to CHD, ADT, and YO; NHYO ↑ lactobacillus, ↑ clostridia, compared to ADT and YO; YO, NHYO ↓ Bifidobacteria, compared to CHD, ADT. Family: ADT ↓ Enterobacteria, compared to CHD, NHYO | NHYO ↑ Saturated straight chain (20:0), ↑ Unsaturated straight chain (20:1 cis ll), ↓ Saturated straight chain (12:0, 15:0) and absence of the branched chain (15:O ante and 15:O iso fatty acids); ADT ↑ branched chain CFA, compared to all other groups; ↑ dimethyl acyl (18.1 cisl1 DMA, 14.0 DMA), compared to CHD and NHYO; ↑ 15:0 ante DMA, compared to other groups; CHD did not have dimethyl acyl (18:0 DMA), unsaturated straight chain (16:1 cis9), compared to other groups. |
| Jeffery et al., 2016 [30] | Ireland (U) | YO: 371 (64–102) ADT: 13 (28–46) | YO: not reported ADT: not reported | 16S rRNA (V4) | α: Did not report between YO and ADT β: No difference between ADT and community-dwelling YO (unweighted UniFrac) | N/A | N/A |
| Kato et al., 2017 [31] | Japan (U) | Age Groups 100: 5 (100 and up) 90: 19 (90–99) 80: 51 (80–89) 70: 31 (70–79) 60: 42 (60–69) 50: 29 (50–59) 40: 37 (40–49) 30: 114 (30–39) 20: 42 (20–29) 10: 10 (10–19) 4: 17 (4–9) 3: 21 (weaned—3 years old) 2: 12 (weaning; mean: 0.8) 1: 16 (preweaning; mean: 0.3) | 100: 100.0 90: 78.9 80: 66.6 70: 61.3 60: 66.7 50: 55.2 40: 64.9 30: 52.6 20: 61.9 10: 30.0 4: 58.8 3: 52.4 2: 41.7 1: 43.8 | 16S rDNA qPCR | α: N/A β: N/A | Species: B. longum detected in all groups; Elderly ↑ B. dentium, ↓ B. catenulatum; Adult ↑ B. adolescentis, ↓ B. breve, ↑ B. gallinarum, ↑ B. catenulatum; Infant ↑ B. breve, ↓ B. adolescentis | N/A |
| Kushugulova et al., 2015 [32] | Kazakhstan (not reported) | LL: 6 (90 and up) YO: 17 (50–70)ADT: 6 (30–44) | LL: 100.0 YO: 100.0 ADT: 100.0 | 16S rDNA | α: N/A β: N/A | Phylum: ADT ↑ Bacteroidetes; YO ↑ Firmicutes; LL ↑ Tenericutes, compared to other groups Species: LL ↓ butyrate-producing and mucin-degrading species, compared with YO, ADT | N/A |
| Le Roy et al., 2015 [33] | Estonia (U) | YO: 33 (65–81) ADT: 16 (20–48) | YO: not reported ADT: not reported | 16S 23S rRNA intergenic spacer region qPCR | α: N/A β: N/A | YO ↑ L. paracasei, ↑ L. plantarum, ↓ L. salivarius, and ↓ L. helveticus, compared to ADT | No difference between ADT and YO in metabolic profiles |
| Odamaki et al., 2016 [34] | Japan (not reported) | Age Groups 100: 6 (100 and up) 90: 19 (90–99) 80: 48 (80–89) 70: 15 (70–79) 60: 28 (60–69) 50: 25 (50–59) 40: 34 (40–49) 30: 88 (30–39) 20: 40 (20–29) 10: 10 (10–19) 4: 14 (4–9) 3: 18 (weaned—3 years old) 2: 12 (weaning; mean: 0.8) 1: 14 (preweaning; mean: 0.3) | 100: 100.0 90: 78.9 80: 66.7 70: 66.7 60: 60.7 50: 52.0 40: 61.8 30: 48.9 20: 60.0 10: 30.0 4: 57.1 3: 44.4 2: 50.0 1: 50.0 | 16S rRNA (V3-V4) qPCR | α: ↑ with age (Chao1, number of observed species, Shannon index, phylogenetic distance whole tree) β: Variation in data due to age (UniFrac distances, both weighted and un-weighted analyses) | Composition across all ages (0 to 100+): Phyla: With ↑ Age, ↓ Actinobacteria, ↑ Bacteroidetes, ↑ Proteobacteria | Infant/Elderly vs. Adult enriched clusters: Preweaned infants ↓ xylose transporterInfant/Elderly ↑ drug transporters |
| Odamaki et al., 2018 [35] | Japan (U) | Age Groups 100: 6 (100 and up) 90: 19 (90–99) 80: 51 (80–89) 70: 31 (70–79) 60: 42 (60–69) 50: 34 (50–59) 40: 37 (40–49) 30: 117 (30–39) 20: 42 (20–29) 10: 10 (10–19) 4: 17 (4–9) 3: 22 (weaned—3 years old) 2: 12 (weaning; mean: 0.8) 1: 13 (preweaning; mean: 0.3) | 100: 100.0 90: 78.9 80: 66.7 70: 61.3 60: 66.7 50: 58.8 40: 62.2 30: 52.1 20: 66.7 10: 30.0 4: 58.8 3: 50.0 2: 33.3 1: 46.2 | 16S rRNA (V3-V4) Strain-specific PCR | α: N/A β: N/A | Across age groups (preweaning to 100+ age) Species: Blautia wexlerae, Streptococcus salivarius, Bifidobacterium longum; * no inferential statistics provided, detected >50% of participants across age groups | Younger vs. Older (GF enriched in B. longum subsp. longum strains)Older (GF:11) ↓ GF involved in carbohydrate transport and metabolism, compared to infants (GF:22); Adults ↑ GF involved defense mechanisms, transcription and replication, recombination, and repair, compared other groups. 169 GF enriched in B. Longum subsp. longum strains in younger participants vs. 55 GF enriched in older participants; younger participants ↑ sialidase-encoding cluster, ↑ an α arabinofuranosidase gene cluster, ↑ pNAC3 (a 10 kb plasmid) homologue, ↑ capsule biosynthesis-related genes and a Type VII secretion system, ↑ some prophage regions found in the AH1206 episome; infants enriched in sialidase clusters; older ↑ extracellular α-L-arabinofuranosidases, putative multidrug-family ABC transporter (associated two-component system), a genetic cluster (Hsp20-family heat shock chaperone), ↑ prophage regions |
| Pan et al., 2016 [36] | China (R) | LL Bama: 8 (80–99) LL Nanning: 8 (80–99) | LL Bama: 62.5 LL Nanning: 50.0 | 16S rRNA (V2-V3) PCR-DGGE | α: No difference between LL Nanning and LL Bama subjects (only for diversity of genus Lactobacillus; Shannon–Wiener) β: N/A | Representative Lactobacillus species in LL: W. confusa, L. mucosae, L. crispatus, L. salivarius, and L. delbrueckii | N/A |
| Ruiz-Ruiz et al., 2019 [37] | Spain (U) | YO: 10 (68–81) ADT: 10 (27–44) CHD: 10 (2–5) | YO: 70.0 ADT: 50.0 CHD: 50.0 | LC-MS | α: N/A β: N/A | N/A | α: YO ↑ compared to CHD, ADT (microbial richness, Pielou’s evenness, Shannon index) YO ↓ tryptophan and indole production with ↑ age; YO ↓ TnaA, ↓ TrpB, ↓ tryptophan, ↓ indole, compared to CHD, ADT |
| Singh et al., 2019 [38] | USA (R) | YO: 33 (70–82) NHYO: 32 (70–82) | YO: 57.6 NHYO: 46.9 | 16S rRNA (V1-V3) | α: No significant differences between YO and NHYO (Shannon, Chao1) β: No difference between YO and NHYO (Bray–Curtis) | Family/Genus: YO ↑ Akkermansia, ↑ Erysipelotrichaceae UCG-003, ↑ Bacteroides, ↓ Streptococcus, ↓ Lactobacillus, ↑ Lachnospiraceae (UCG-005)1, ↓ Escherichia1/Shigella1, ↑ Cardiobacterium, ↑ Neisseria, ↑ Comamonas, ↑ Capnocytophaga, ↓ Bifidobacterium, ↑ Filifactor, ↑ Fusobacterium, ↑ Propionibacterium, ↑ Haemophilus, ↑ Corynebacterium, ↓ Rothia, ↑ Porphyromonas, ↑ Ruminococcaceae UCG-014, ↑ Prevotella 2, ↑ Peptoclostridium, compared to NHYO | N/A |
| Cognition Studies | |||||||
| Anderson et al., 2017 [39] | USA (not reported) | YO: 37 (50–85) | YO: 73.0 | 16S rRNA | α: N/A β: N/A | Verrucomicrobia and Lentisphaerae: ↑ sleep quality Verrucomicrobia: ↑ word reading processing speed Lentisphaerae: ↑ cognitive flexibility; non-significant after accounting for sleep | N/A |
| Manderino et al., 2017 [40] | USA (U) | YO: 25 (50–85) NHYO: 18 (50–85) | YO: 32.0 NHYO: 33.3 | 16S rRNA | α: N/A β: N/A | YO ↓ Bacteroidetes, ↓ Proteobacteria, ↑ Firmicutes, ↑ Verrucomicrobia, compared to NHYO Phylum: ↑ Verrucomicrobia showed ↑ verbal learning, ↑ visual scanning, ↑ cognitive set-shifting, ↑ cognitive flexibility (word reading), ↑ cognitive flexibility (color naming); ↑ Firmicutes showed ↑ spatial perception and visual memory, ↑ memory; ↑ Bacteroidetes correlated to ↓ spatial perception and visual memory, ↓ memory; ↑ Proteobacteria correlated to ↓ verbal Recognition/Discrimination, ↓ FAB, ↓ FAS | N/A |
| Verdi et al., 2018 [41] | United Kingdom (U/R) | YO: 1551 (40–89) | YO: 66.8 | 16S rRNA | α: ↑ Chao1, phylogenetic diversity, and observed OTU associated with ↓ reaction time and ↓ verbal fluency β: N/A | Order: ↑ Burkholderiales associated with ↓ reaction time Class: ↑ Betaproteobacteria associated with ↓ reaction time | N/A |
| Intervention Studies | |||||||
| An et al., 2019 [42] | Netherlands (U) | YO pectin: 24 (65–75) YO placebo: 24 (65–75) ADT pectin: 25 (18–40) ADT placebo: 27 (18–40) | YO pectin: 37.5 YO placebo: 50.0 ADT pectin: 68.0 ADT placebo: 48.1 | 16S rDNA (V5-V6) | α: No difference (Faith’s PD, inverse Simpson) in either ADT and YO, before vs. after pectin supplementation β: Smaller intra-individual change, compared to inter-individual change (weighted UniFrac and unweighted UniFrac), before vs. after pectin supplementation | YO ↑ Enterorhabdus, ↑ Ruminiclostridium 6, ↑ uncultured genus within the family Coriobacteriaceae, ↑ Mogibacterium, ↑ Lachnospiraceae (UCG-008), compared to ADT YO ↑ Enterorhabdus, ↑ uncultured genus within the family Coriobacteriaceae, ↑ Mogibacterium, ↑ Lachnospiraceae UCG-008), compared to ADT, after pectin supplementation | No significant differences in BCFA and SCFA between YO and ADT at baseline. No significant differences in BCFA and SCFA (acetic acid, propionic acid, butyric acid, valeric acid, isobutyric acid, isovaleric acid) in YO or ADT, before vs. after pectin supplementation |
| Björklund et al., 2011 [43] | Finland (U) | YO synbiotic: 23 (above 65) YO placebo: 24 (above 65) | YO synbiotic: 79.2 YO placebo: 69.6 | qPCR, non-selective DNA-based method, percent guanine-plus cytosine (%G+C) profiling | α: N/A β: N/A | Genera: Synbiotic ↑ Bifidobacteria, ↑ L. acidophilus NCFM, compared to placebo; both (synbiotic and placebo) ↓ Clostridium cluster XIVab, ↓ Blautia coccoides– Eubacterium rectale | N/A |
| Spaiser et al., 2015 [44] | USA (U) | YO probiotic: 16 (not reported) YO placebo: 16 (not reported) YO total: (65–80) | YO probiotic: not reported YO placebo: not reportedYO total: 68.8 | 16S rRNA qPCR | α: No difference between placebo and probiotic groups (Chao1, observed OTUs) β: No difference between placebo and probiotic groups (UniFrac) | Genus: Probiotic ↑ Bifidobacteria and ↑ lactic acid bacteria, compared to placebo Species: Probiotic ↓ Escherichia coli and ↑ Faecalibacterium prausnitzii, compared to placebo | N/A |
| Valentini et al., 2014 [45] | France, Germany, and Italy (U) | YO with diet and VSL#3 treatment: 31 YO with diet alone: 31 YO total (65–85) | YO total: 53.2 Not reported for each treatment arm | 16S rDNA gene-targeted qPCR | α: N/A β: N/A | No change in Clostridium cluster IV, Bifidobacterium spp., after diet only and diet+VSL#3 treatment arms | N/A |
| Alpha Diversity | Beta Diversity | Taxonomic Differences | Functional Potential and Metabolites | |
|---|---|---|---|---|
| (A) Long-Lived Individuals | 5/5 studies 60% reported differences between LL younger age groups. 40% reported no differences across LL, YO, and ADT groups. | 5/7 studies 100% reported differences between LL and younger age groups, including YO and ADT. | 8/8 studies 37.5% reported Phylum level: LL ↑ Proteobacteria and ↓ Firmicutes 100% reported Family/Genus level: LL ↑ Akkermansia, Christensenellaceae, Escherichia, Clostridium, Desulfovibrio, Parabacteroides, Odoribacter, Butyricimonas, Eggerthella, and Anaerotruncus; ↓ Faecalibacterium, Prevotella, and Bacteroides. | 4/4 studies 75% examined KEGG pathways; 25% studied gut metabolites.Beta diversity of KEGG gene pathways different between LL and YO and ADT. LL ↑ pathways related to central energy metabolism and respiration; ↓ pathways related to genetic information processing; ↓ pathways related to carbohydrate degradation and metabolism; ↓ vitamin B1 pathways, but ↑ B2 and K2 pathways; ↑ metabolite derivatives of butyrate. |
| (B) Lifespan | 2/6 studies 50% reported ↑ alpha diversity with age (lowest at infancy, with increasingly higher levels through adolescence and young adulthood; stable across adult decades; higher in YO and LL). 50% reported no difference between YO and ADT.50% ↑ alpha diversity in community-dwelling YO compared to long-term care YO. | 4/5 studies 25% reported that aging explained a significant proportion of variance in beta diversity distances across lifespan. 75% reported no difference between YO and ADT.33% reported differences between community-dwelling YO and long-term care YO. | 9/10 studies 33% reported Phylum level: Actinobacteria highest in infants, lower after weaning and lower with age/development. YO ↑ Proteobacteria and Bacteroidetes.33% reported Family/Genus level: YO ↓ Clostridium cluster XIVa 70% reported Species level: Bifidobacterium longum present across the lifespan. B. breve most prevalent in infants, B. adolescentis in adults, and B. dentium in YO. YO ↑ specific Lactobacillus species (L. paracasei, L. plantarum, L. salivarius, and L. delbrueckii). YO ↓ Faecalibacterium prausnitzii. | 7/7 studies 71.4% investigated metabolites; 14.2% studied gene families; 14.2% examined KEGG pathways. YO ↑ functional pathways related to drug transporters and ↑ gene clusters related to polysaccharide synthesis; ↓ gene families involved in genetic transcription, repair, and defense mechanisms, ↓ butyrate-producing gene (butyryl-CoA:acetate CoA-transferase). Aging associated with ↑ metabolism of aromatic amino acids and ↓ biosynthesis of amino acids, whereas adulthood associated with ↑ SCFA production. No difference in gut metabolites between YO and ADT. |
| (C) Cognition | 0/1 study | 0/0 studies | 0/3 studies | 0/0 studies |
| (D) Intervention | 2/2 studies 100% reported no significant differences following probiotic or prebiotic in YO. | 2/2 studies 50% studies performed placebo-controlled vs. treatment group comparisons; 50% examined pre- vs. and post-treatment comparisons.100% reported no significant differences following probiotic or prebiotic. | 4/4 studies 75% of studies reported ↑ Bifidobacterium, 25% reported ↑ Faecalibacterium prausnitzii, 25% reported ↑ Lactobacillus spp., 25% reported ↑ Lactobacillus acidophilus, and 25% reported ↓ Escherichia coli following probiotic and synbiotic.No change in taxonomic composition following prebiotic. | 1/1 study 100% found no significant differences in BCFA or SCFA following prebiotic. |
Publisher’s Note: MDPI stays neutral with regard to jurisdictional claims in published maps and institutional affiliations. |
© 2020 by the authors. Licensee MDPI, Basel, Switzerland. This article is an open access article distributed under the terms and conditions of the Creative Commons Attribution (CC BY) license (http://creativecommons.org/licenses/by/4.0/).
Share and Cite
Badal, V.D.; Vaccariello, E.D.; Murray, E.R.; Yu, K.E.; Knight, R.; Jeste, D.V.; Nguyen, T.T. The Gut Microbiome, Aging, and Longevity: A Systematic Review. Nutrients 2020, 12, 3759. https://doi.org/10.3390/nu12123759
Badal VD, Vaccariello ED, Murray ER, Yu KE, Knight R, Jeste DV, Nguyen TT. The Gut Microbiome, Aging, and Longevity: A Systematic Review. Nutrients. 2020; 12(12):3759. https://doi.org/10.3390/nu12123759
Chicago/Turabian StyleBadal, Varsha D., Eleonora D. Vaccariello, Emily R. Murray, Kasey E. Yu, Rob Knight, Dilip V. Jeste, and Tanya T. Nguyen. 2020. "The Gut Microbiome, Aging, and Longevity: A Systematic Review" Nutrients 12, no. 12: 3759. https://doi.org/10.3390/nu12123759
APA StyleBadal, V. D., Vaccariello, E. D., Murray, E. R., Yu, K. E., Knight, R., Jeste, D. V., & Nguyen, T. T. (2020). The Gut Microbiome, Aging, and Longevity: A Systematic Review. Nutrients, 12(12), 3759. https://doi.org/10.3390/nu12123759