Association of Food and Alcohol Consumption with Peripheral Atherosclerotic Plaque Volume as Measured by 3D-Ultrasound

 , ,
, ,
Abstract
:1. Introduction
2. Methods
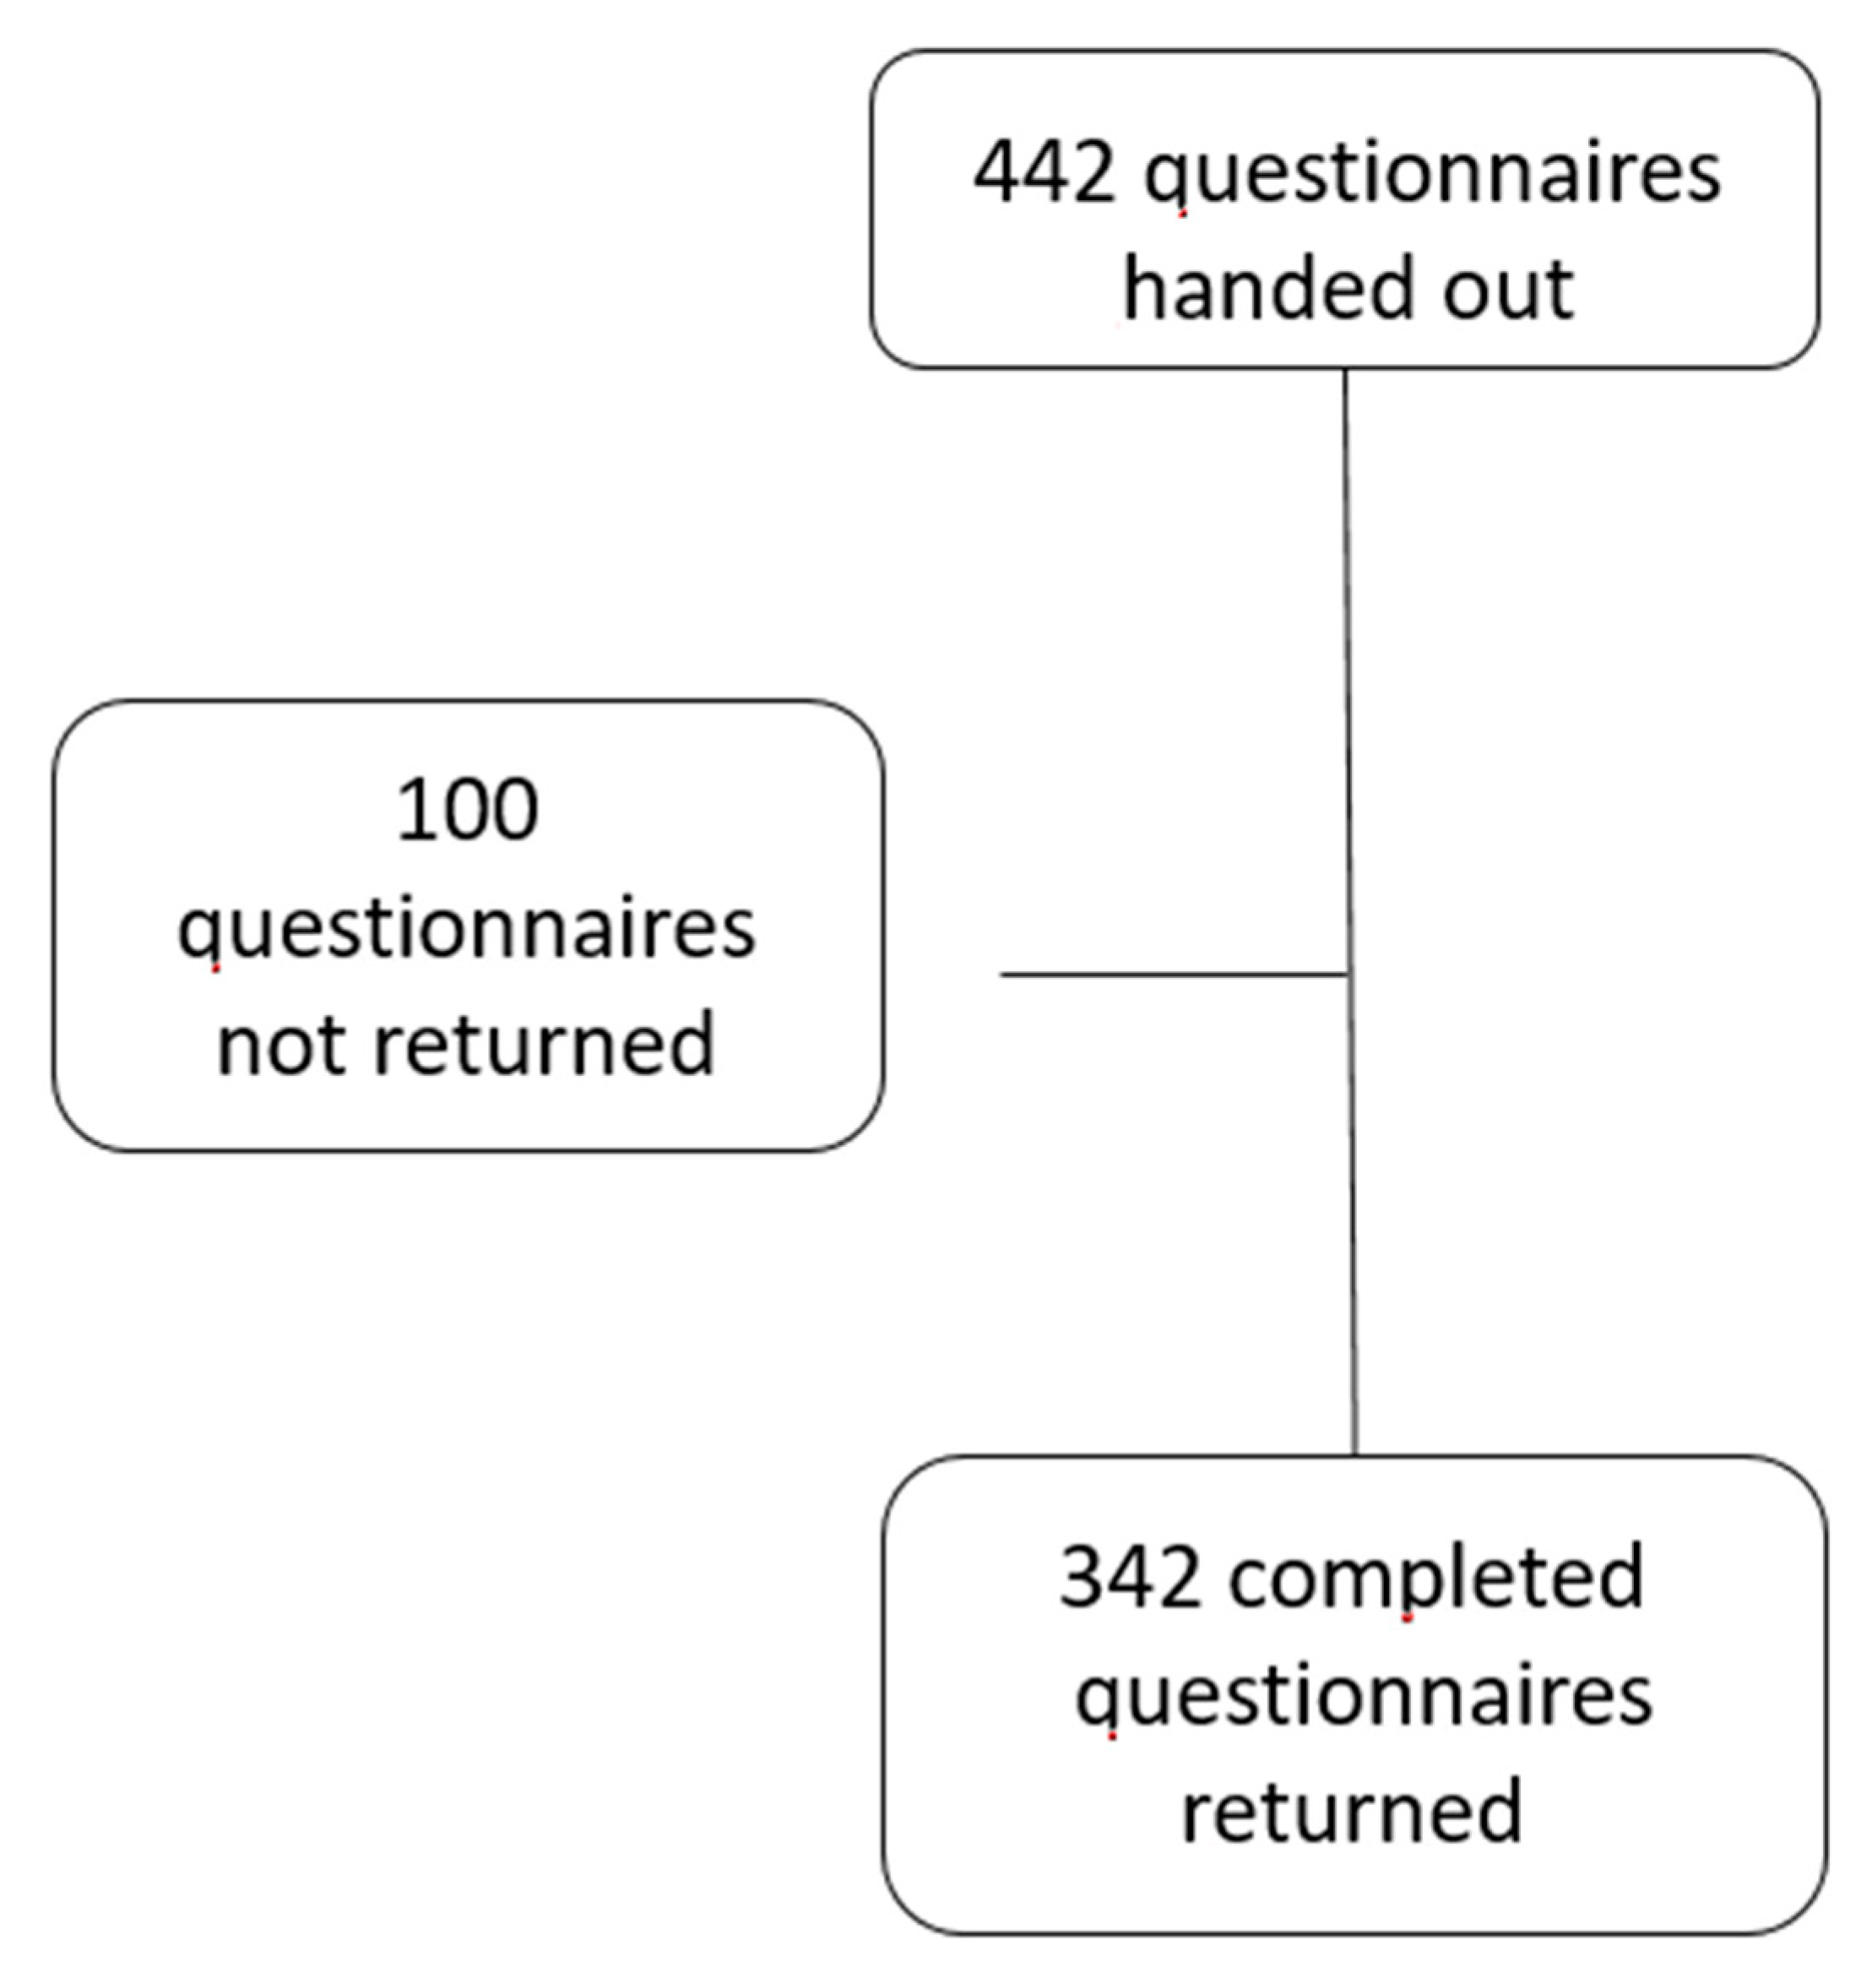
2.1. Study Design
2.2. Ultrasound Imaging
2.3. Dietary Assessment
2.4. Statistical Analysis
3. Results
3.1. Characteristics of Study Population
3.2. Distribution of Atherosclerotic PV According to the Consumption of Vegetables and Fruits
3.3. Association of Atherosclerotic PV According to Alcohol Consumption
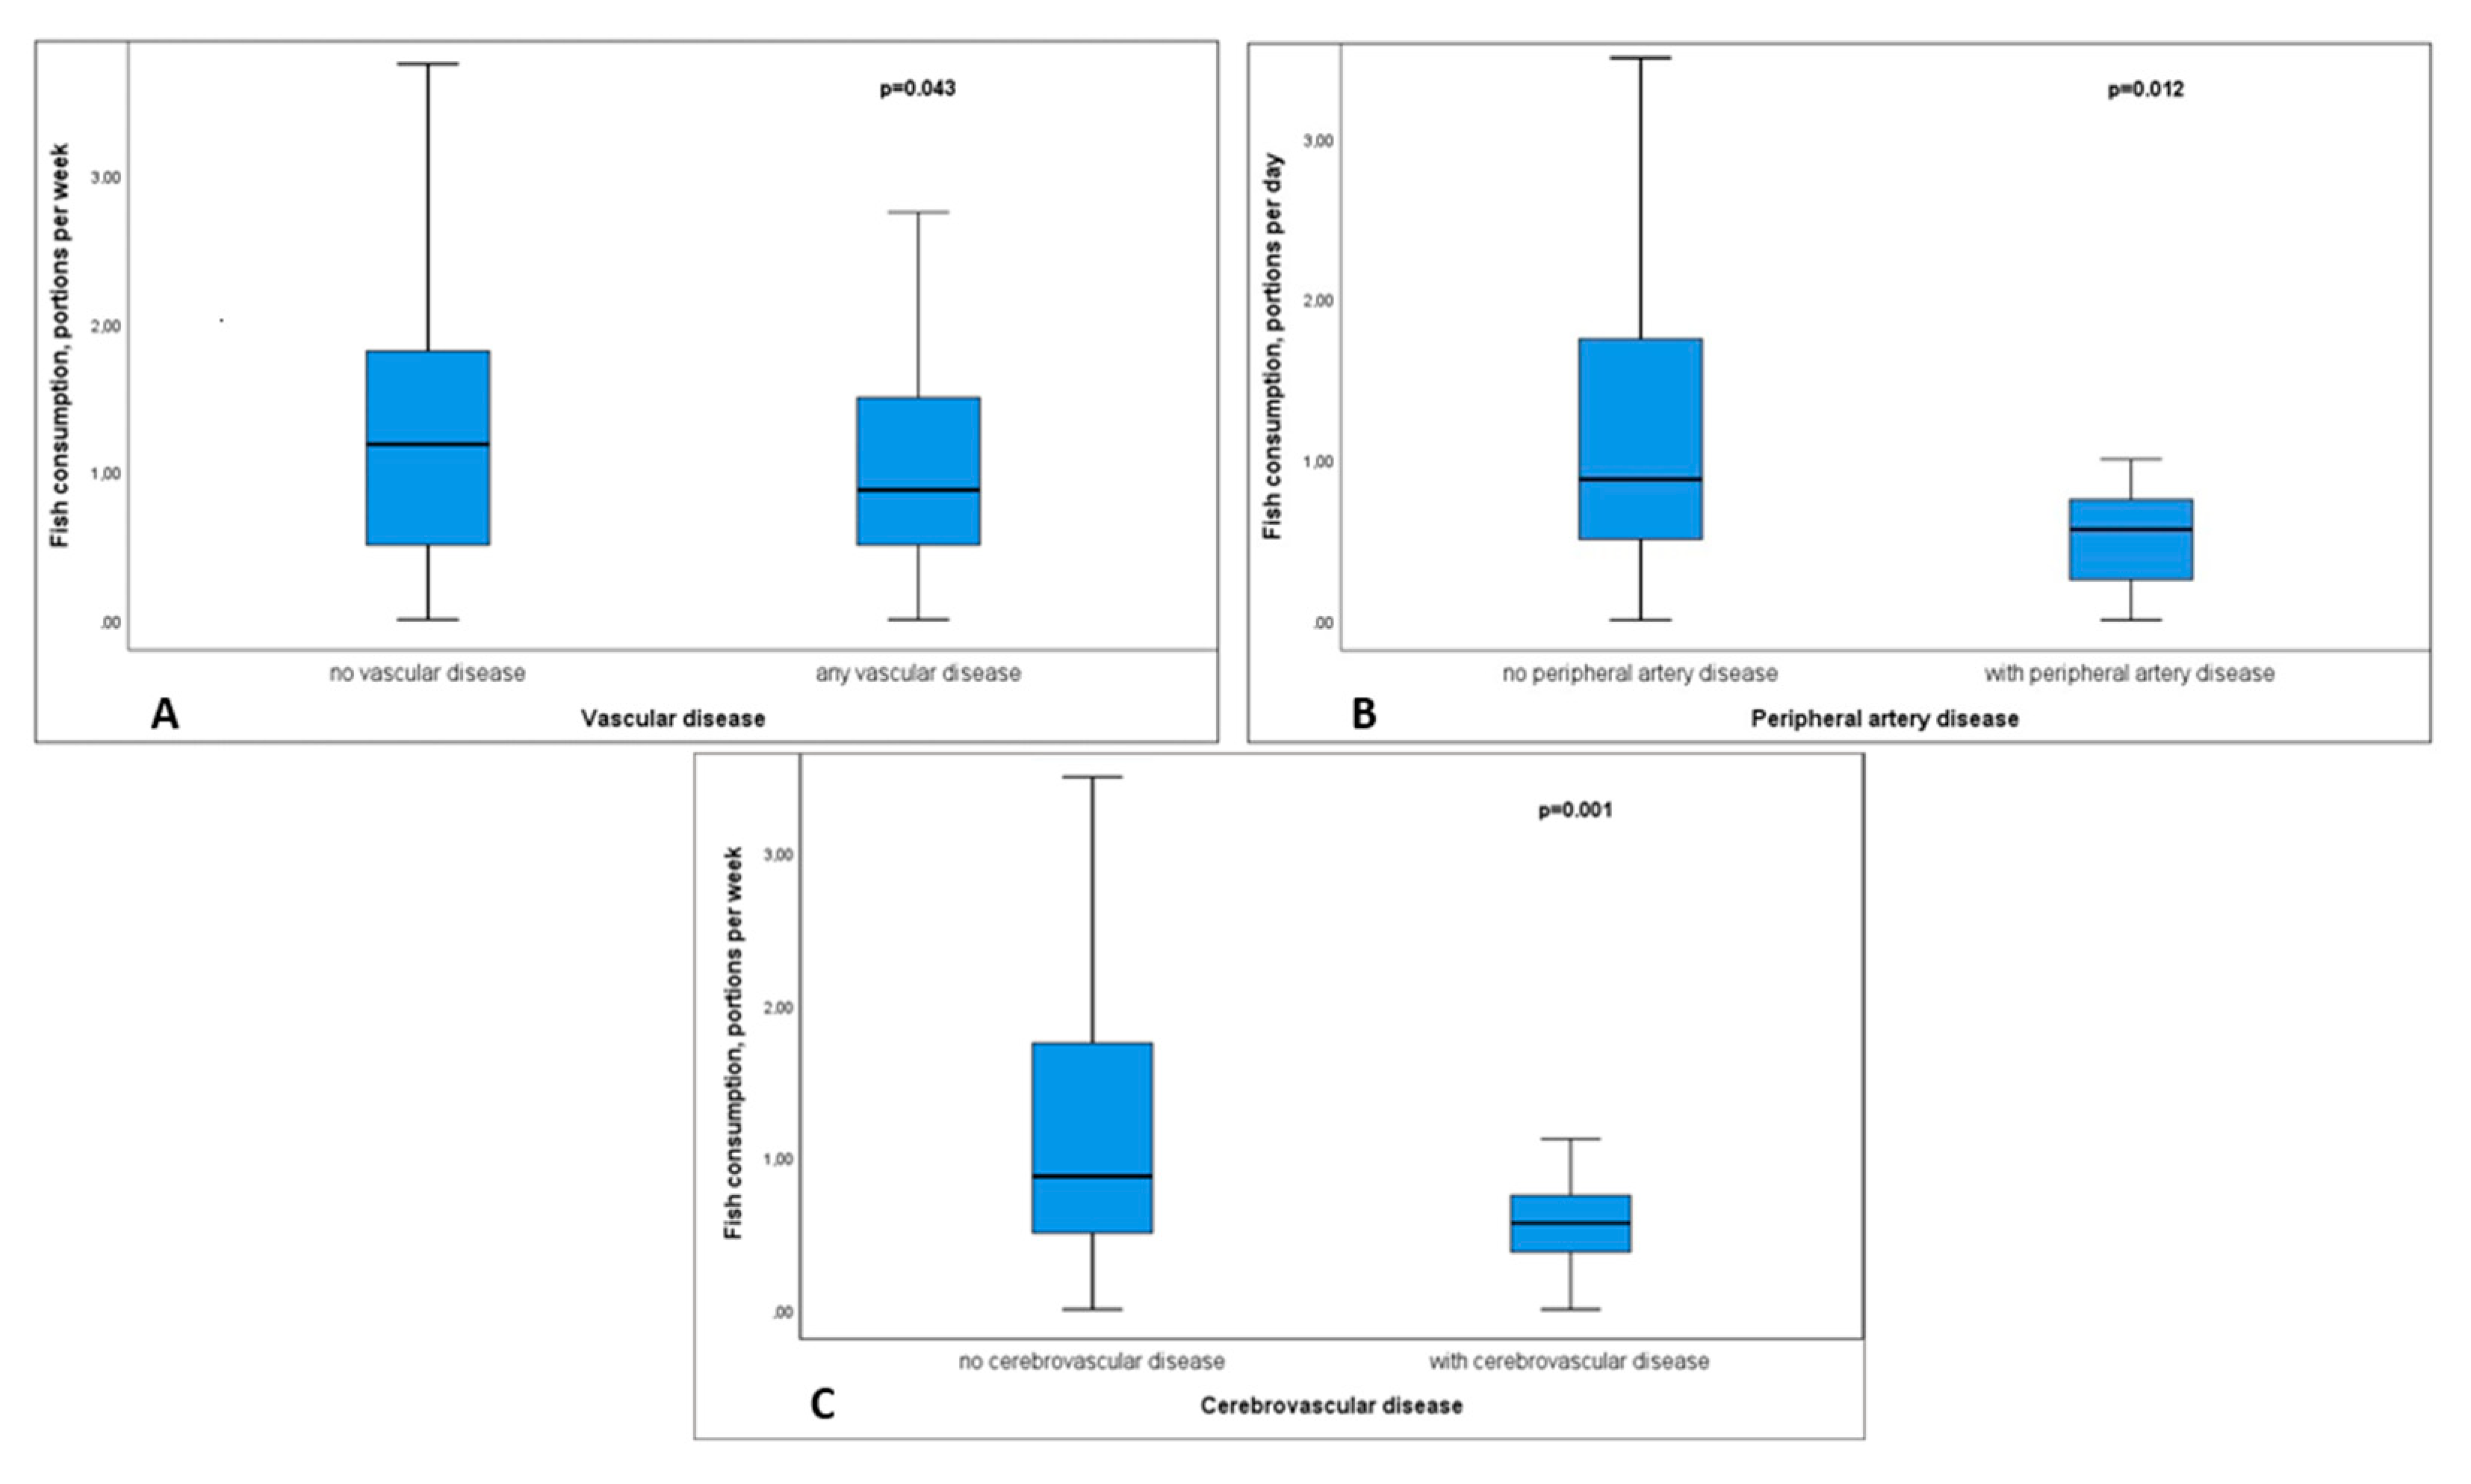
3.4. Association of Fish Consumption with the Presence of Vascular Diseases
3.5. Multivariate Analysis
4. Discussion
5. Limitations
6. Perspective
Author Contributions
Funding
Acknowledgments
Conflicts of Interest
Abbreviation
| BMI | body mass index |
| CAD | coronary artery disease |
| CBVD | cerebrovascular disease |
| CHD | coronary heart disease |
| CVD | cardiovascular disease |
| CVRF | cardiovascular risk factor |
| CKD | chronic kidney disease |
| 3D | three-dimensional |
| DEGS | Studie zur Gesundheit Erwachsener in Deutschland |
| eGFR | estimated glomerular filtration rate |
| hsCRP | high-sensitivity C-reactive protein |
| IL-6 | interleukin 6 |
| IMT | intima media thickness |
| IQR | interquartile range |
| MDRD | modification of diet in renal disease |
| SD | standard deviation |
| PAD | peripheral arterial disease |
| PV | plaque volume |
References
- Mosca, L.; Benjamin, E.J.; Berra, K.; Bezanson, J.L.; Dolor, R.J.; Lloyd-Jones, D.M.; Newby, L.K.; Pina, I.L.; Roger, V.L.; Shaw, L.J.; et al. Effectiveness-based guidelines for the prevention of cardiovascular disease in women—2011 update: A guideline from the American Heart Association. J. Am. Coll. Cardiol. 2011, 57, 1404–1423. [Google Scholar] [CrossRef] [PubMed] [Green Version]
- Lozano, R.; Naghavi, M.; Foreman, K.; Lim, S.; Shibuya, K.; Aboyans, V.; Abraham, J.; Adair, T.; Aggarwal, R.; Ahn, S.Y.; et al. Global and regional mortality from 235 causes of death for 20 age groups in 1990 and 2010: A systematic analysis for the Global Burden of Disease Study 2010. Lancet 2012, 380, 2095–2128. [Google Scholar] [CrossRef]
- Eaker, E.D.; Chesebro, J.H.; Sacks, F.M.; Wenger, N.K.; Whisnant, J.P.; Winston, M. Cardiovascular disease in women. Circulation 1993, 88, 1999–2009. [Google Scholar] [CrossRef] [PubMed] [Green Version]
- Piepoli, M.F.; Hoes, A.W.; Agewall, S.; Albus, C.; Brotons, C.; Catapano, A.L.; Cooney, M.T.; Corra, U.; Cosyns, B.; Deaton, C.; et al. 2016 European Guidelines on cardiovascular disease prevention in clinical practice: The Sixth Joint Task Force of the European Society of Cardiology and Other Societies on Cardiovascular Disease Prevention in Clinical Practice (constituted by representatives of 10 societies and by invited experts)Developed with the special contribution of the European Association for Cardiovascular Prevention & Rehabilitation (EACPR). Eur. Heart J. 2016, 37, 2315–2381. [Google Scholar]
- Knoops, K.T.; de Groot, L.C.; Kromhout, D.; Perrin, A.E.; Moreiras-Varela, O.; Menotti, A.; van Staveren, W.A. Mediterranean diet, lifestyle factors, and 10-year mortality in elderly European men and women: The HALE project. JAMA 2004, 292, 1433–1439. [Google Scholar] [CrossRef] [PubMed]
- Dehghan, M.; Mente, A.; Teo, K.K.; Gao, P.; Sleight, P.; Dagenais, G.; Avezum, A.; Probstfield, J.L.; Dans, T.; Yusuf, S.; et al. Relationship between healthy diet and risk of cardiovascular disease among patients on drug therapies for secondary prevention: A prospective cohort study of 31 546 high-risk individuals from 40 countries. Circulation 2012, 126, 2705–2712. [Google Scholar] [CrossRef]
- Holmes, M.V.; Dale, C.E.; Zuccolo, L.; Silverwood, R.J.; Guo, Y.; Ye, Z.; Prieto-Merino, D.; Dehghan, A.; Trompet, S.; Wong, A.; et al. Association between alcohol and cardiovascular disease: Mendelian randomisation analysis based on individual participant data. BMJ 2014, 349, g4164. [Google Scholar] [CrossRef] [PubMed] [Green Version]
- Corrao, G.; Rubbiati, L.; Bagnardi, V.; Zambon, A.; Poikolainen, K. Alcohol and coronary heart disease: A meta-analysis. Addiction 2000, 95, 1505–1523. [Google Scholar] [CrossRef]
- Ronksley, P.E.; Brien, S.E.; Turner, B.J.; Mukamal, K.J.; Ghali, W.A. Association of alcohol consumption with selected cardiovascular disease outcomes: A systematic review and meta-analysis. BMJ 2011, 342, d671. [Google Scholar] [CrossRef] [Green Version]
- Djousse, L.; Lee, I.M.; Buring, J.E.; Gaziano, J.M. Alcohol consumption and risk of cardiovascular disease and death in women: Potential mediating mechanisms. Circulation 2009, 120, 237–244. [Google Scholar] [CrossRef]
- Xi, B.; Veeranki, S.P.; Zhao, M.; Ma, C.W.; Yan, Y.K.; Mi, J. Relationship of Alcohol Consumption to All-Cause, Cardiovascular, and Cancer-Related Mortality in US Adults. J. Am. Coll. Cardiol. 2017, 70, 913–922. [Google Scholar] [CrossRef] [PubMed]
- Costanzo, S.; Di Castelnuovo, A.; Donati, M.B.; Iacoviello, L.; de Gaetano, G. Wine, beer or spirit drinking in relation to fatal and non-fatal cardiovascular events: A meta-analysis. Eur. J. Epidemiol. 2011, 26, 833–850. [Google Scholar] [CrossRef]
- Mukamal, K.J.; Clowry, C.M.; Murray, M.M.; Hendriks, H.F.J.; Rimm, E.B.; Sink, K.M.; Adebamowo, C.A.; Dragsted, L.O.; Lapinski, P.S.; Lazo, M.; et al. Moderate Alcohol Consumption and Chronic Disease: The Case for a Long-Term Trial. Alcohol. Clin. Exp. Res. 2016, 40, 2283–2291. [Google Scholar] [CrossRef] [PubMed] [Green Version]
- Sillesen, H.; Muntendam, P.; Adourian, A.; Entrekin, R.; Garcia, M.; Falk, E.; Fuster, V. Carotid plaque burden as a measure of subclinical atherosclerosis: Comparison with other tests for subclinical arterial disease in the High Risk Plaque BioImage study. JACC Cardiovasc. Imaging 2012, 5, 681–689. [Google Scholar] [CrossRef] [PubMed] [Green Version]
- Lopez-Melgar, B.; Fernandez-Friera, L.; Oliva, B.; Garcia-Ruiz, J.M.; Penalvo, J.L.; Gomez-Talavera, S.; Sanchez-Gonzalez, J.; Mendiguren, J.M.; Ibanez, B.; Fernandez-Ortiz, A.; et al. Subclinical Atherosclerosis Burden by 3D Ultrasound in Mid-Life: The PESA Study. J. Am. Coll. Cardiol. 2017, 70, 301–313. [Google Scholar] [CrossRef]
- Gallino, A.; Stuber, M.; Crea, F.; Falk, E.; Corti, R.; Lekakis, J.; Schwitter, J.; Camici, P.; Gaemperli, O.; Di Valentino, M.; et al. “In vivo” imaging of atherosclerosis. Atherosclerosis 2012, 224, 25–36. [Google Scholar] [CrossRef] [PubMed]
- Schreinlechner, M.; Noflatscher, M.; Kremser, C.; Steiger, R.; Gromer, J.; Theurl, M.; Kirchmair, R.; Mayr, A.; Marschang, P. A Large Bifurcation Angle Is Strongly Associated with Increased Plaque Volume and Plaque Progression. JACC Cardiovasc. Imaging 2019, 12, 2087–2088. [Google Scholar] [CrossRef]
- Noflatscher, M.; Schreinlechner, M.; Sommer, P.; Kerschbaum, J.; Berggren, K.; Theurl, M.; Kirchmair, R.; Marschang, P. Influence of Traditional Cardiovascular Risk Factors on Carotid and Femoral Atherosclerotic Plaque Volume as Measured by Three-Dimensional Ultrasound. J. Clin. Med. 2019, 8, 32. [Google Scholar] [CrossRef] [Green Version]
- Touboul, P.J.; Hennerici, M.G.; Meairs, S.; Adams, H.; Amarenco, P.; Bornstein, N.; Csiba, L.; Desvarieux, M.; Ebrahim, S.; Hernandez Hernandez, R.; et al. Mannheim carotid intima-media thickness and plaque consensus (2004-2006-2011). An update on behalf of the advisory board of the 3rd, 4th and 5th watching the risk symposia, at the 13th, 15th and 20th European Stroke Conferences, Mannheim, Germany, 2004, Brussels, Belgium, 2006, and Hamburg, Germany, 2011. Cerebrovasc. Dis. 2012, 34, 290–296. [Google Scholar]
- Haftenberger, M.; Heuer, T.; Heidemann, C.; Kube, F.; Krems, C.; Mensink, G.B.M. Relative validation of a food frequency questionnaire for national health and nutrition monitoring. Nutr. J. 2010, 9, 36. [Google Scholar] [CrossRef] [Green Version]
- Massey, F.J. The Kolmogorov-Smirnov Test for Goodness of Fit. J. Am. Stat. Assoc. 1951, 46, 68–78. [Google Scholar] [CrossRef]
- Gardener, H.; Wright, C.B.; Cabral, D.; Scarmeas, N.; Gu, Y.A.; Cheung, K.; Elkind, M.S.V.; Sacco, R.L.; Rundek, T. Mediterranean diet and carotid atherosclerosis in the Northern Manhattan Study. Atherosclerosis 2014, 234, 303–310. [Google Scholar] [CrossRef] [PubMed] [Green Version]
- Tzima, N.; Pitsavos, C.; Panagiotakos, D.B.; Skoumas, J.; Zampelas, A.; Chrysohoou, C.; Stefanadis, C. Mediterranean diet and insulin sensitivity, lipid profile and blood pressure levels, in overweight and obese people; The Attica study. Lipids Health Dis. 2007, 6, 22. [Google Scholar] [CrossRef] [PubMed] [Green Version]
- Psaltopoulou, T.; Naska, A.; Orfanos, P.; Trichopoulos, D.; Mountokalakis, T.; Trichopoulou, A. Olive oil, the Mediterranean diet, and arterial blood pressure: The Greek European Prospective Investigation into Cancer and Nutrition (EPIC) study. Am. J. Clin. Nutr. 2004, 80, 1012–1018. [Google Scholar] [CrossRef] [PubMed]
- Babio, N.; Bullo, M.; Salas-Salvado, J. Mediterranean diet and metabolic syndrome: The evidence. Public Health Nutr. 2009, 12, 1607–1617. [Google Scholar] [CrossRef] [PubMed] [Green Version]
- Rumawas, M.E.; Meigs, J.B.; Dwyer, J.T.; McKeown, N.M.; Jacques, P.F. Mediterranean-style dietary pattern, reduced risk of metabolic syndrome traits, and incidence in the Framingham Offspring Cohort. Am. J. Clin. Nutr. 2009, 90, 1608–1614. [Google Scholar] [CrossRef] [Green Version]
- Fung, T.T.; McCullough, M.L.; Newby, P.K.; Manson, J.E.; Meigs, J.B.; Rifai, N.; Willett, W.C.; Hu, F.B. Diet-quality scores and plasma concentrations of markers of inflammation and endothelial dysfunction. Am. J. Clin. Nutr. 2005, 82, 163–173. [Google Scholar] [CrossRef]
- Dai, J.; Miller, A.H.; Bremner, J.D.; Goldberg, J.; Jones, L.; Shallenberger, L.; Buckham, R.; Murrah, N.V.; Veledar, E.; Wilson, P.W.; et al. Adherence to the Mediterranean diet is inversely associated with circulating interleukin-6 among middle-aged men. Circulation 2008, 117, 169–175. [Google Scholar] [CrossRef] [Green Version]
- Vazquez-Prieto, M.A.; Miatello, R.M. Organosulfur compounds and cardiovascular disease. Mol. Asp. Med. 2010, 31, 540–545. [Google Scholar] [CrossRef]
- Cheng, Y.C.; Sheen, J.M.; Hu, W.L.; Hung, Y.C. Polyphenols and Oxidative Stress in Atherosclerosis-Related Ischemic Heart Disease and Stroke. Oxid. Med. Cell. Longev. 2017. [Google Scholar] [CrossRef] [Green Version]
- Kromhout, D.; Spaaij, C.J.K.; de Goede, J.; Weggemans, R.M.; Brug, J.; Geleijnse, J.M.; van Goudoever, J.B.; Hoes, A.W.; Hopman, M.T.; Iestra, J.A.; et al. The 2015 Dutch food-based dietary guidelines. Eur. J. Clin. Nutr. 2016, 70, 869–878. [Google Scholar] [CrossRef] [PubMed]
- Lampe, J.W. Health effects of vegetables and fruit: Assessing mechanisms of action in human experimental studies. Am. J. Clin. Nutr. 1999, 70, 475s–490s. [Google Scholar] [CrossRef] [PubMed]
- Gardener, H.; Wright, C.B.; Gu, Y.A.; Demmer, R.T.; Boden-Albala, B.; Elkind, M.S.V.; Sacco, R.L.; Scarmeas, N. Mediterranean-style diet and risk of ischemic stroke, myocardial infarction, and vascular death: The Northern Manhattan Study. Am. J. Clin. Nutr. 2011, 94, 1458–1464. [Google Scholar] [CrossRef] [PubMed]
- Siscovick, D.S.; Barringer, T.A.; Fretts, A.M.; Wu, J.H.Y.; Lichtenstein, A.H.; Costello, R.B.; Kris-Etherton, P.M.; Jacobson, T.A.; Engler, M.B.; Alger, H.M.; et al. Omega-3 Polyunsaturated Fatty Acid (Fish Oil) Supplementation and the Prevention of Clinical Cardiovascular Disease: A Science Advisory From the American Heart Association. Circulation 2017, 135, e867–e884. [Google Scholar] [CrossRef] [PubMed]
- Kris-Etherton, P.M.; Harris, W.S.; Appel, L.J. Fish consumption, fish oil, omega-3 fatty acids, and cardiovascular disease. Circulation 2002, 106, 2747–2757. [Google Scholar]
- Johnsen, S.H.; Jacobsen, B.K.; Brkkaen, S.K.; Hansen, J.B.; Mathiesen, E.B. Fish consumption, fish oil supplements and risk of atherosclerosis in the Tromso study. Nutr. J. 2018, 17, 56. [Google Scholar] [CrossRef]
- Angerer, P.; Kothny, W.; Stork, S.; von Schacky, C. Effect of dietary supplementation with omega-3 fatty acids on progression of atherosclerosis in carotid arteries. Cardiovasc. Res. 2002, 54, 183–190. [Google Scholar] [CrossRef] [Green Version]
- Buscemi, S.; Nicolucci, A.; Lucisano, G.; Galvano, F.; Grosso, G.; Belmonte, S.; Sprini, D.; Migliaccio, S.; Cianferotti, L.; Brandi, M.L.; et al. Habitual fish intake and clinically silent carotid atherosclerosis. Nutr. J. 2014, 13, 2. [Google Scholar] [CrossRef] [Green Version]
- Di Castelnuovo, A.; Costanzo, S.; Bagnardi, V.; Donati, M.B.; Iacoviello, L.; de Gaetano, G. Alcohol dosing and total mortality in men and women—An updated meta-analysis of 34 prospective studies. Arch. Intern. Med. 2006, 166, 2437–2445. [Google Scholar] [CrossRef]
- Kloner, R.A.; Rezkalla, S.H. To drink or not to drink? That is the question. Circulation 2007, 116, 1306–1317. [Google Scholar] [CrossRef]
- Criqui, M.H. Alcohol and coronary heart disease: Consistent relationship and public health implications. Clin. Chim. Acta 1996, 246, 51–57. [Google Scholar] [CrossRef]
- Friedman, L.A.; Kimball, A.W. Coronary heart disease mortality and alcohol consumption in Framingham. Am. J. Epidemiol. 1986, 124, 481–489. [Google Scholar] [CrossRef] [PubMed] [Green Version]
- Keil, U.; Chambless, L.E.; Doring, A.; Filipiak, B.; Stieber, J. The relation of alcohol intake to coronary heart disease and all-cause mortality in a beer-drinking population. Epidemiology 1997, 8, 150–156. [Google Scholar] [CrossRef] [PubMed]
- Gaziano, J.M.; Gaziano, T.A.; Glynn, R.J.; Sesso, H.D.; Ajani, U.A.; Stampfer, M.J.; Manson, J.E.; Hennekens, C.H.; Buring, J.E. Light-to-moderate alcohol consumption and mortality in the physicians’ health study enrollment cohort. J. Am. Coll. Cardiol. 2000, 35, 96–105. [Google Scholar] [CrossRef] [Green Version]
- Mukamal, K.J.; Longstreth, W.T.; Mittleman, M.A.; Crum, R.M.; Siscovick, D.S. Alcohol consumption and subclinical findings on magnetic resonance imaging of the brain in older adults—The Cardiovascular Health Study. Stroke 2001, 32, 1939–1945. [Google Scholar] [CrossRef] [Green Version]
- Worm, N. Alkohol: Mehr Vorteile als Risiken bei moderatem Genuss. Dtsch. Med. Wochenschr. 2017, 142, 1930–1932. [Google Scholar] [CrossRef]
- Brien, S.E.; Ronksley, P.E.; Turner, B.J.; Mukamal, K.J.; Ghali, W.A. Effect of alcohol consumption on biological markers associated with risk of coronary heart disease: Systematic review and meta-analysis of interventional studies. Br. Med. J. 2011, 342, d636. [Google Scholar] [CrossRef] [Green Version]
- Gresele, P.; Cerletti, C.; Guglielmini, G.; Pignatelli, P.; de Gaetano, G.; Violi, F. Effects of resveratrol and other wine polyphenols on vascular function: An update. J. Nutr. Biochem. 2011, 22, 201–211. [Google Scholar] [CrossRef]
- Piazzon, A.; Forte, M.; Nardini, M. Characterization of Phenolics Content and Antioxidant Activity of Different Beer Types. J. Agric. Food Chem. 2010, 58, 10677–10683. [Google Scholar] [CrossRef]
- Martinez, N.; Urpi-Sarda, M.; Martinez-Gonzalez, M.A.; Andres-Lacueva, C.; Mitjavila, M.T. Dealcoholised beers reduce atherosclerosis and expression of adhesion molecules in apoE-deficient mice. Br. J. Nutr. 2011, 105, 721–730. [Google Scholar] [CrossRef] [Green Version]
- Ellison, R.C.; Zhang, Y.; Hopkins, P.N.; Knox, S.; Djousse, L.; Carr, J.J. Is alcohol consumption associated with calcified atherosclerotic plaque in the coronary arteries and aorta? Am. Heart J. 2006, 152, 177–182. [Google Scholar] [CrossRef] [PubMed]
- Wright, C.B.; Elkind, M.S.V.; Rundek, T.; Boden-Albala, B.; Paik, M.C.; Sacco, R.L. Alcohol intake, carotid plaque, and cognition—The Northern Manhattan Study. Stroke 2006, 37, 1160–1164. [Google Scholar] [CrossRef] [PubMed] [Green Version]
- Demirovic, J.; Nabulsi, A.; Folsom, A.R.; Carpenter, M.A.; Szklo, M.; Sorlie, P.D.; Barnes, R.W. Alcohol-Consumption and Ultrasonographically Assessed Carotid-Artery Wall Thickness and Distensibility. Circulation 1993, 88, 2787–2793. [Google Scholar] [CrossRef] [PubMed] [Green Version]
- Serdula, M.K.; Byers, T.; Mokdad, A.H.; Simoes, E.; Mendlein, J.M.; Coates, R.J. The association between fruit and vegetable intake and chronic disease risk factors. Epidemiology 1996, 7, 161–165. [Google Scholar] [CrossRef] [PubMed]
- Stampfer, M.J.; Hu, F.B.; Manson, J.E.; Rimm, E.B.; Willett, W.C. Primary prevention of coronary heart disease in women through diet and lifestyle. N. Engl. J. Med. 2000, 343, 16–22. [Google Scholar] [CrossRef]


| Total Population (n = 342) | Low Total Plaque Burden (n = 171, 50%, 0–254 mm3) | High Total Plaque Burden (n = 171, 50%, 255–1887 mm3) | p-Value | |
|---|---|---|---|---|
| Age, years | 66 (58–73) | 61 (55–68) | 69 (61–74) | <0.001 |
| Female, n (%) | 145 (42.4) | 88 (51.5) | 57 (33.3) | 0.001 |
| Body mass index, kg/m2 | 25.7 (23.7–28.4) | 25.4 (23.3–28.3) | 26 (24.1–28.4) | 0.215 |
| Hypertension, n (%) | 231 (67.5) | 94 (55) | 137 (80.1) | <0.001 |
| Family history for CVD, n (%) | 84 (24.6) | 47 (27.5) | 37 (21.6) | 0.210 |
| Smoking (pack years) | 20 (10–40) | 15 (5–30) | 30 (15–40) | 0.001 |
| Hyperlipidaemia, n (%) | 305 (89.2) | 148 (86.5) | 157 (91.8) | 0.118 |
| Diabetes mellitus, n (%) | 44 (12.9) | 18 (10.5) | 26 (15.2) | 0.197 |
| HbA1c, % | 5.5 (5.4–5.8) | 5.5 (5.3–5.7) | 5.5 (5.4–5.9) | 0.070 |
| hs-CRP, mg/dL | 0.19 (0.09–0.43) | 0.17 (0.09–0.42) | 0.21 (0.1–0.45) | 0.354 |
| Total cholesterol, mg/dL | 192.9 (±45.3) | 201.4 (±46.1) | 184.3 (±42.9) | <0.001 |
| LDL-cholesterol, mg/dL | 114 (88.8–143) | 122 (98–147.3) | 106 (85–135) | 0.001 |
| HDL-cholesterol, mg/dL | 57 (46–71) | 58.5 (48–74.3) | 55.5 (45–67) | 0.048 |
| Triglyceride mg/dL | 132 (93.8–185) | 126.5 (85–174.3) | 135 (97–196) | 0.225 |
| Creatinin, mg/dL | 0.95 (0.83–1.1) | 0.92 (0.83–1.05) | 0.96 (0.84–1.12) | 0.028 |
| Anticoagulation therapy, n, % | 22 (6.4) | 6 (3.5) | 16 (9.4) | 0.027 |
| Antiplatelet therapy, n, % | 163 (47.7) | 61 (35.7) | 102 (59.6) | <0.001 |
| Lipid lowering therapy | 197 (57.6) | 87 (50.9) | 110 (64.3) | 0.014 |
| Antihypertensive therapy | 209 (61.1) | 89 (52) | 120 (70.2) | 0.001 |
| Any vascular disease, n (%) | 139 (40.6) | 51 (29.8) | 88 (51.5) | <0.001 |
| CAD, n (%) | 119 (34.8) | 42 (24.6) | 77 (45) | <0.001 |
| CBVD, n (%) | 32 (9.4) | 11 (6.4) | 21 (12.3) | 0.064 |
| PAD, n (%) | 19 (5.6) | 4 (2.3) | 15 (8.8) | 0.010 |
| Total plaque volume, mm3 | 254 (94.8–502.8) | 95 (23–171) | 502 (360–745) | <0.001 |
| Femoral plaque volume, mm3 | 135.1 (32.5–281) | 47 (0-101) | 281 (171–478) | <0.001 |
| Carotid plaque volume, mm3 | 88.5 (15–223.3) | 22 (0–63) | 222 (106–385) | <0.001 |
| Femoral IMT, mm | 0.49 (0.44–0.54) | 0.47 (0.42–0.53) | 0.50 (0.45–0.55) | 0.001 |
| Carotid IMT, mm | 0.72 (0.63–0.82) | 0.69 (0.61–0.79) | 0.73 (0.67–0.85) | 0.001 |
| Systolic blood pressure, mmHg | 119 (108–133) | 117 (106–128) | 122 (110–138) | 0.006 |
| Total Population | Low Total Plaque Volume | High Total Plaque Volume | p-Value | |
|---|---|---|---|---|
| Vegetables, portions per week | 6.33 (5.81–6.94) | 7.18 (6.40–8.06) | 5.46 (4.81–6.17) | 0.004 |
| Vegetable juice, portions per week | 0.34 (0.15–0.64) | 0.54 (0.19–1.28) | 0.13 (0.07–0.21) | 0.019 |
| Fruits, portions per week | 9.20 (8.18–10.22) | 9.30 (7.87–10.93) | 9.10 (7.73–10.73) | 0.848 |
| Fruits juice, portions per week | 3.50 (2.73–4.34) | 2.81 (2.06–3.73) | 4.18 (3.03–5.46) | 0.282 |
| Total Population | Low Total Plaque Volume | High Total Plaque Volume | p-Value | |
|---|---|---|---|---|
| Total alcohol, drinks per week | 5.04 (4.22–5.87) | 3.57 (2.78–4.35) | 6.51 (5.27–7.88) | 0.026 |
| Beer, drinks per week | 2.12 (1.64–2.68) | 1.53 (1.02–2.12) | 2.73 (1.91–3.69) | 0.025 |
| Wine, drinks per week | 2.52 (2.06–3.00) | 1.79 (1.39–2.16) | 3.27 (2.38–4.16) | 0.497 |
| Spirits, drinks per week | 0.30 (0.21–0.41) | 0.19 (0.13–0.26) | 0.39 (0.25–0.61) | 0.151 |
| Total Plaque Volume (mm3) | ||
|---|---|---|
| Parameter | B (95CI) | p-Value |
| Total alcohol consumption (drinks per week) | 8.67 (3.60–13.74) | 0.001 |
| Vegetables consumption (portions per week) | −7.49 (−14.42–−0.57) | 0.034 |
| Age (years) | 12.83 (8.90–16.77) | <0.001 |
| Female gender | −93.98 (−171.78–−16.18) | 0.018 |
| BMI (kg/m2) | 4.56 (−3.66–12.78) | 0.276 |
| Vascular disease | 141.82 (65.24–218.4) | <0.001 |
| CVRF | 81.59 (41.60–121.59) | <0.001 |
Publisher’s Note: MDPI stays neutral with regard to jurisdictional claims in published maps and institutional affiliations. |
© 2020 by the authors. Licensee MDPI, Basel, Switzerland. This article is an open access article distributed under the terms and conditions of the Creative Commons Attribution (CC BY) license (http://creativecommons.org/licenses/by/4.0/).
Share and Cite
Noflatscher, M.; Schreinlechner, M.; Sommer, P.; Deutinger, P.; Theurl, M.; Kirchmair, R.; Bauer, A.; Marschang, P. Association of Food and Alcohol Consumption with Peripheral Atherosclerotic Plaque Volume as Measured by 3D-Ultrasound. Nutrients 2020, 12, 3711. https://doi.org/10.3390/nu12123711
Noflatscher M, Schreinlechner M, Sommer P, Deutinger P, Theurl M, Kirchmair R, Bauer A, Marschang P. Association of Food and Alcohol Consumption with Peripheral Atherosclerotic Plaque Volume as Measured by 3D-Ultrasound. Nutrients. 2020; 12(12):3711. https://doi.org/10.3390/nu12123711
Chicago/Turabian StyleNoflatscher, Maria, Michael Schreinlechner, Philip Sommer, Philipp Deutinger, Markus Theurl, Rudolf Kirchmair, Axel Bauer, and Peter Marschang. 2020. "Association of Food and Alcohol Consumption with Peripheral Atherosclerotic Plaque Volume as Measured by 3D-Ultrasound" Nutrients 12, no. 12: 3711. https://doi.org/10.3390/nu12123711
APA StyleNoflatscher, M., Schreinlechner, M., Sommer, P., Deutinger, P., Theurl, M., Kirchmair, R., Bauer, A., & Marschang, P. (2020). Association of Food and Alcohol Consumption with Peripheral Atherosclerotic Plaque Volume as Measured by 3D-Ultrasound. Nutrients, 12(12), 3711. https://doi.org/10.3390/nu12123711