Maternal Intake of Cow’s Milk during Lactation Is Associated with Lower Prevalence of Food Allergy in Offspring

 ,
,  ,
,
Abstract
1. Introduction
2. Materials and Methods
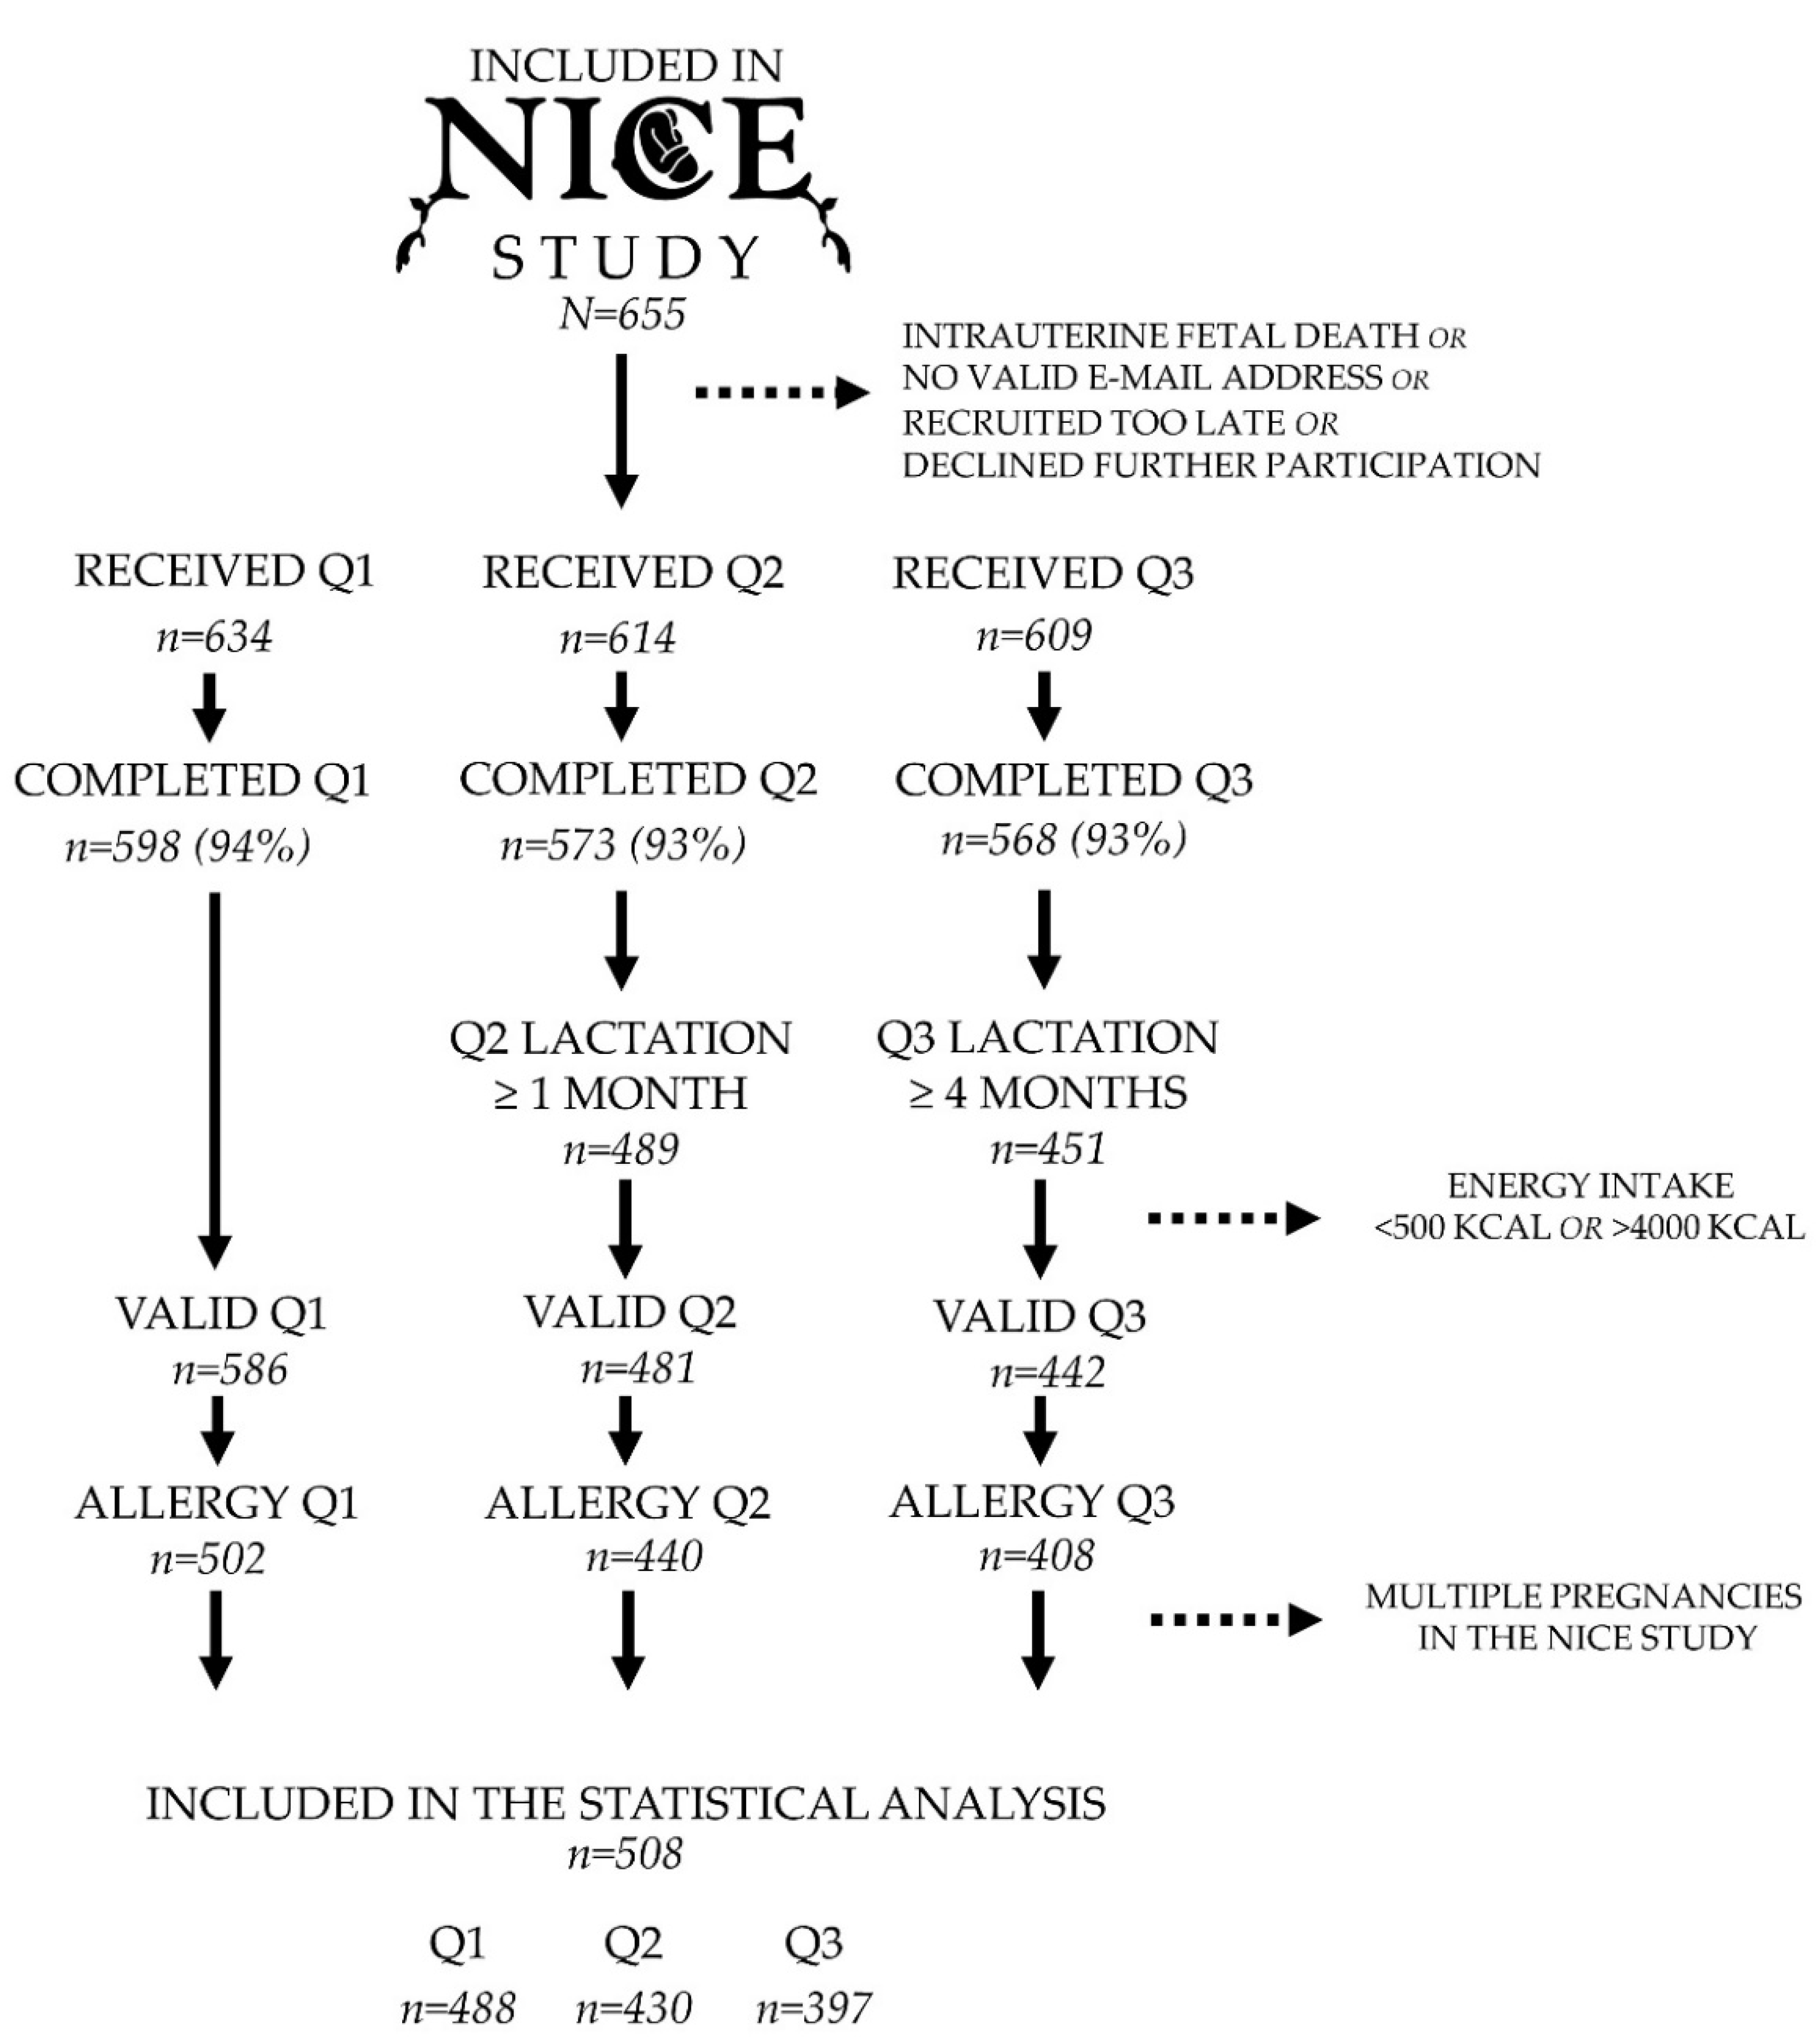
2.1. Study Population
2.2. Dietary Assessment
2.3. Allergy Diagnosis
2.4. Analysis of Fatty Acids in Erythrocytes
2.5. Analysis of Fatty Acids in Breast Milk
2.6. Selection of Subjects
2.7. Data Analysis
2.8. Confounders
2.9. Reverse Causation
3. Results
3.1. Food and Beverage Intake during Pregnancy and Lactation
3.2. Intake of Nutrients during Pregnancy and Lactation
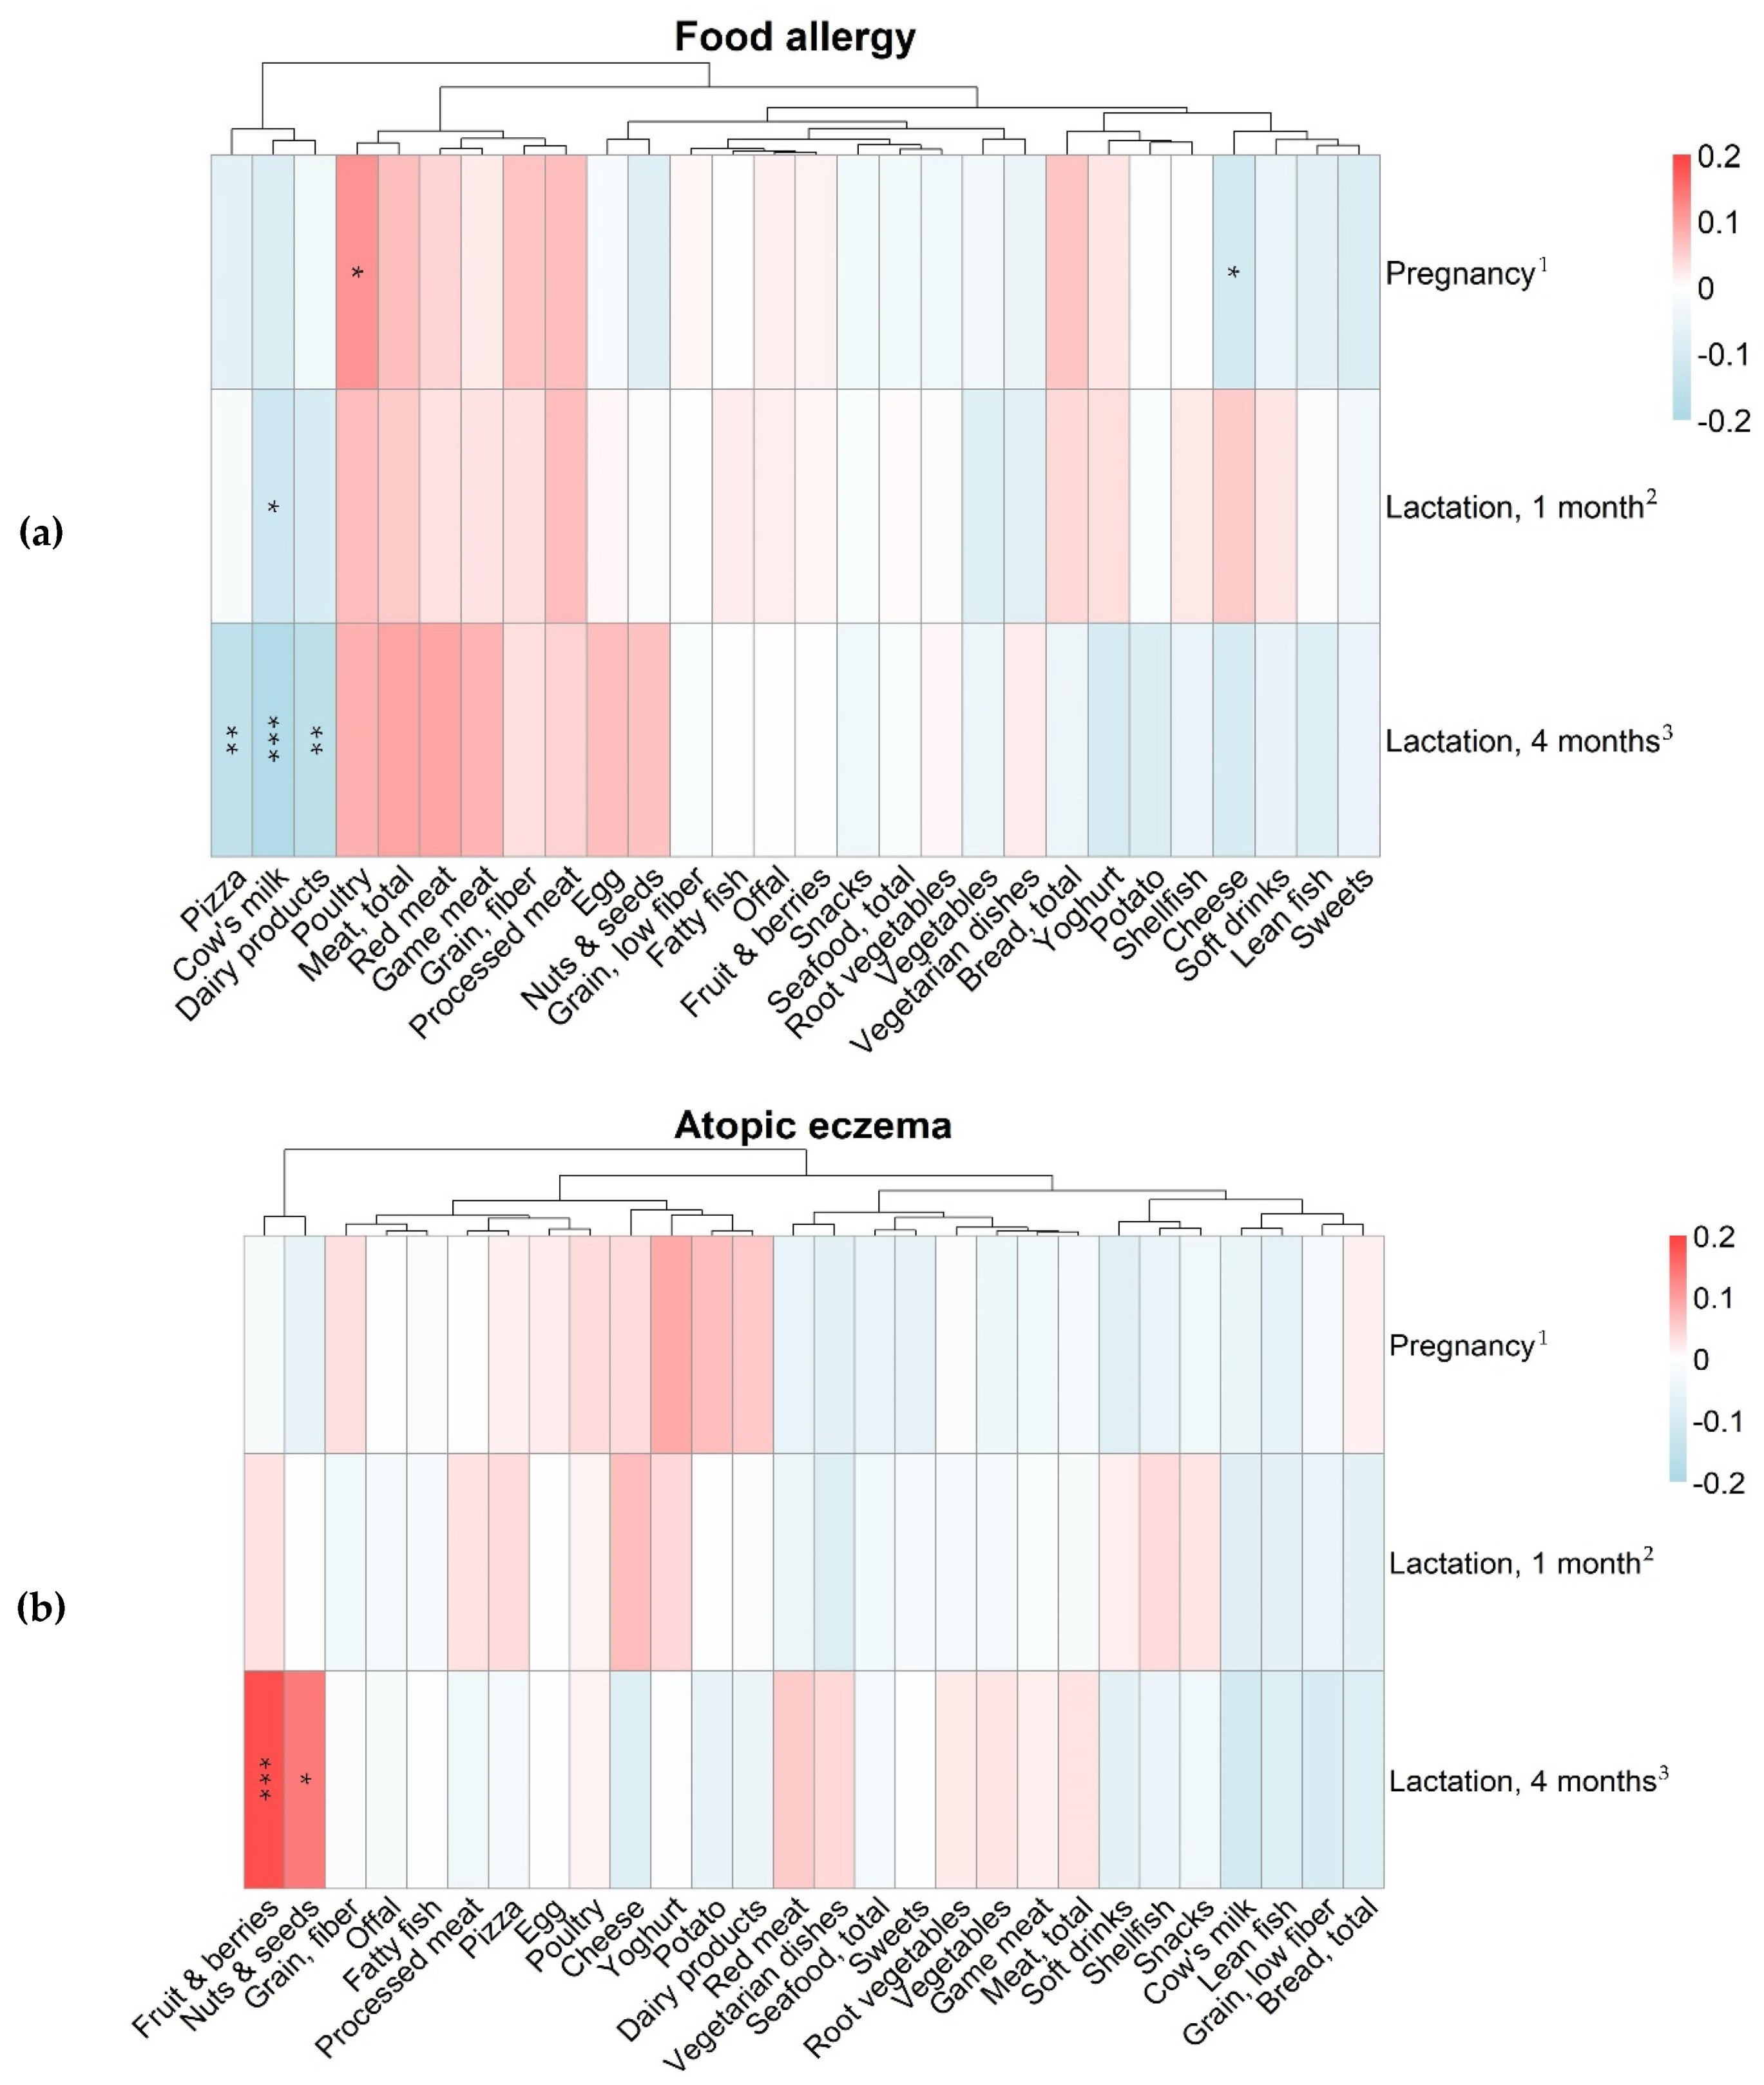
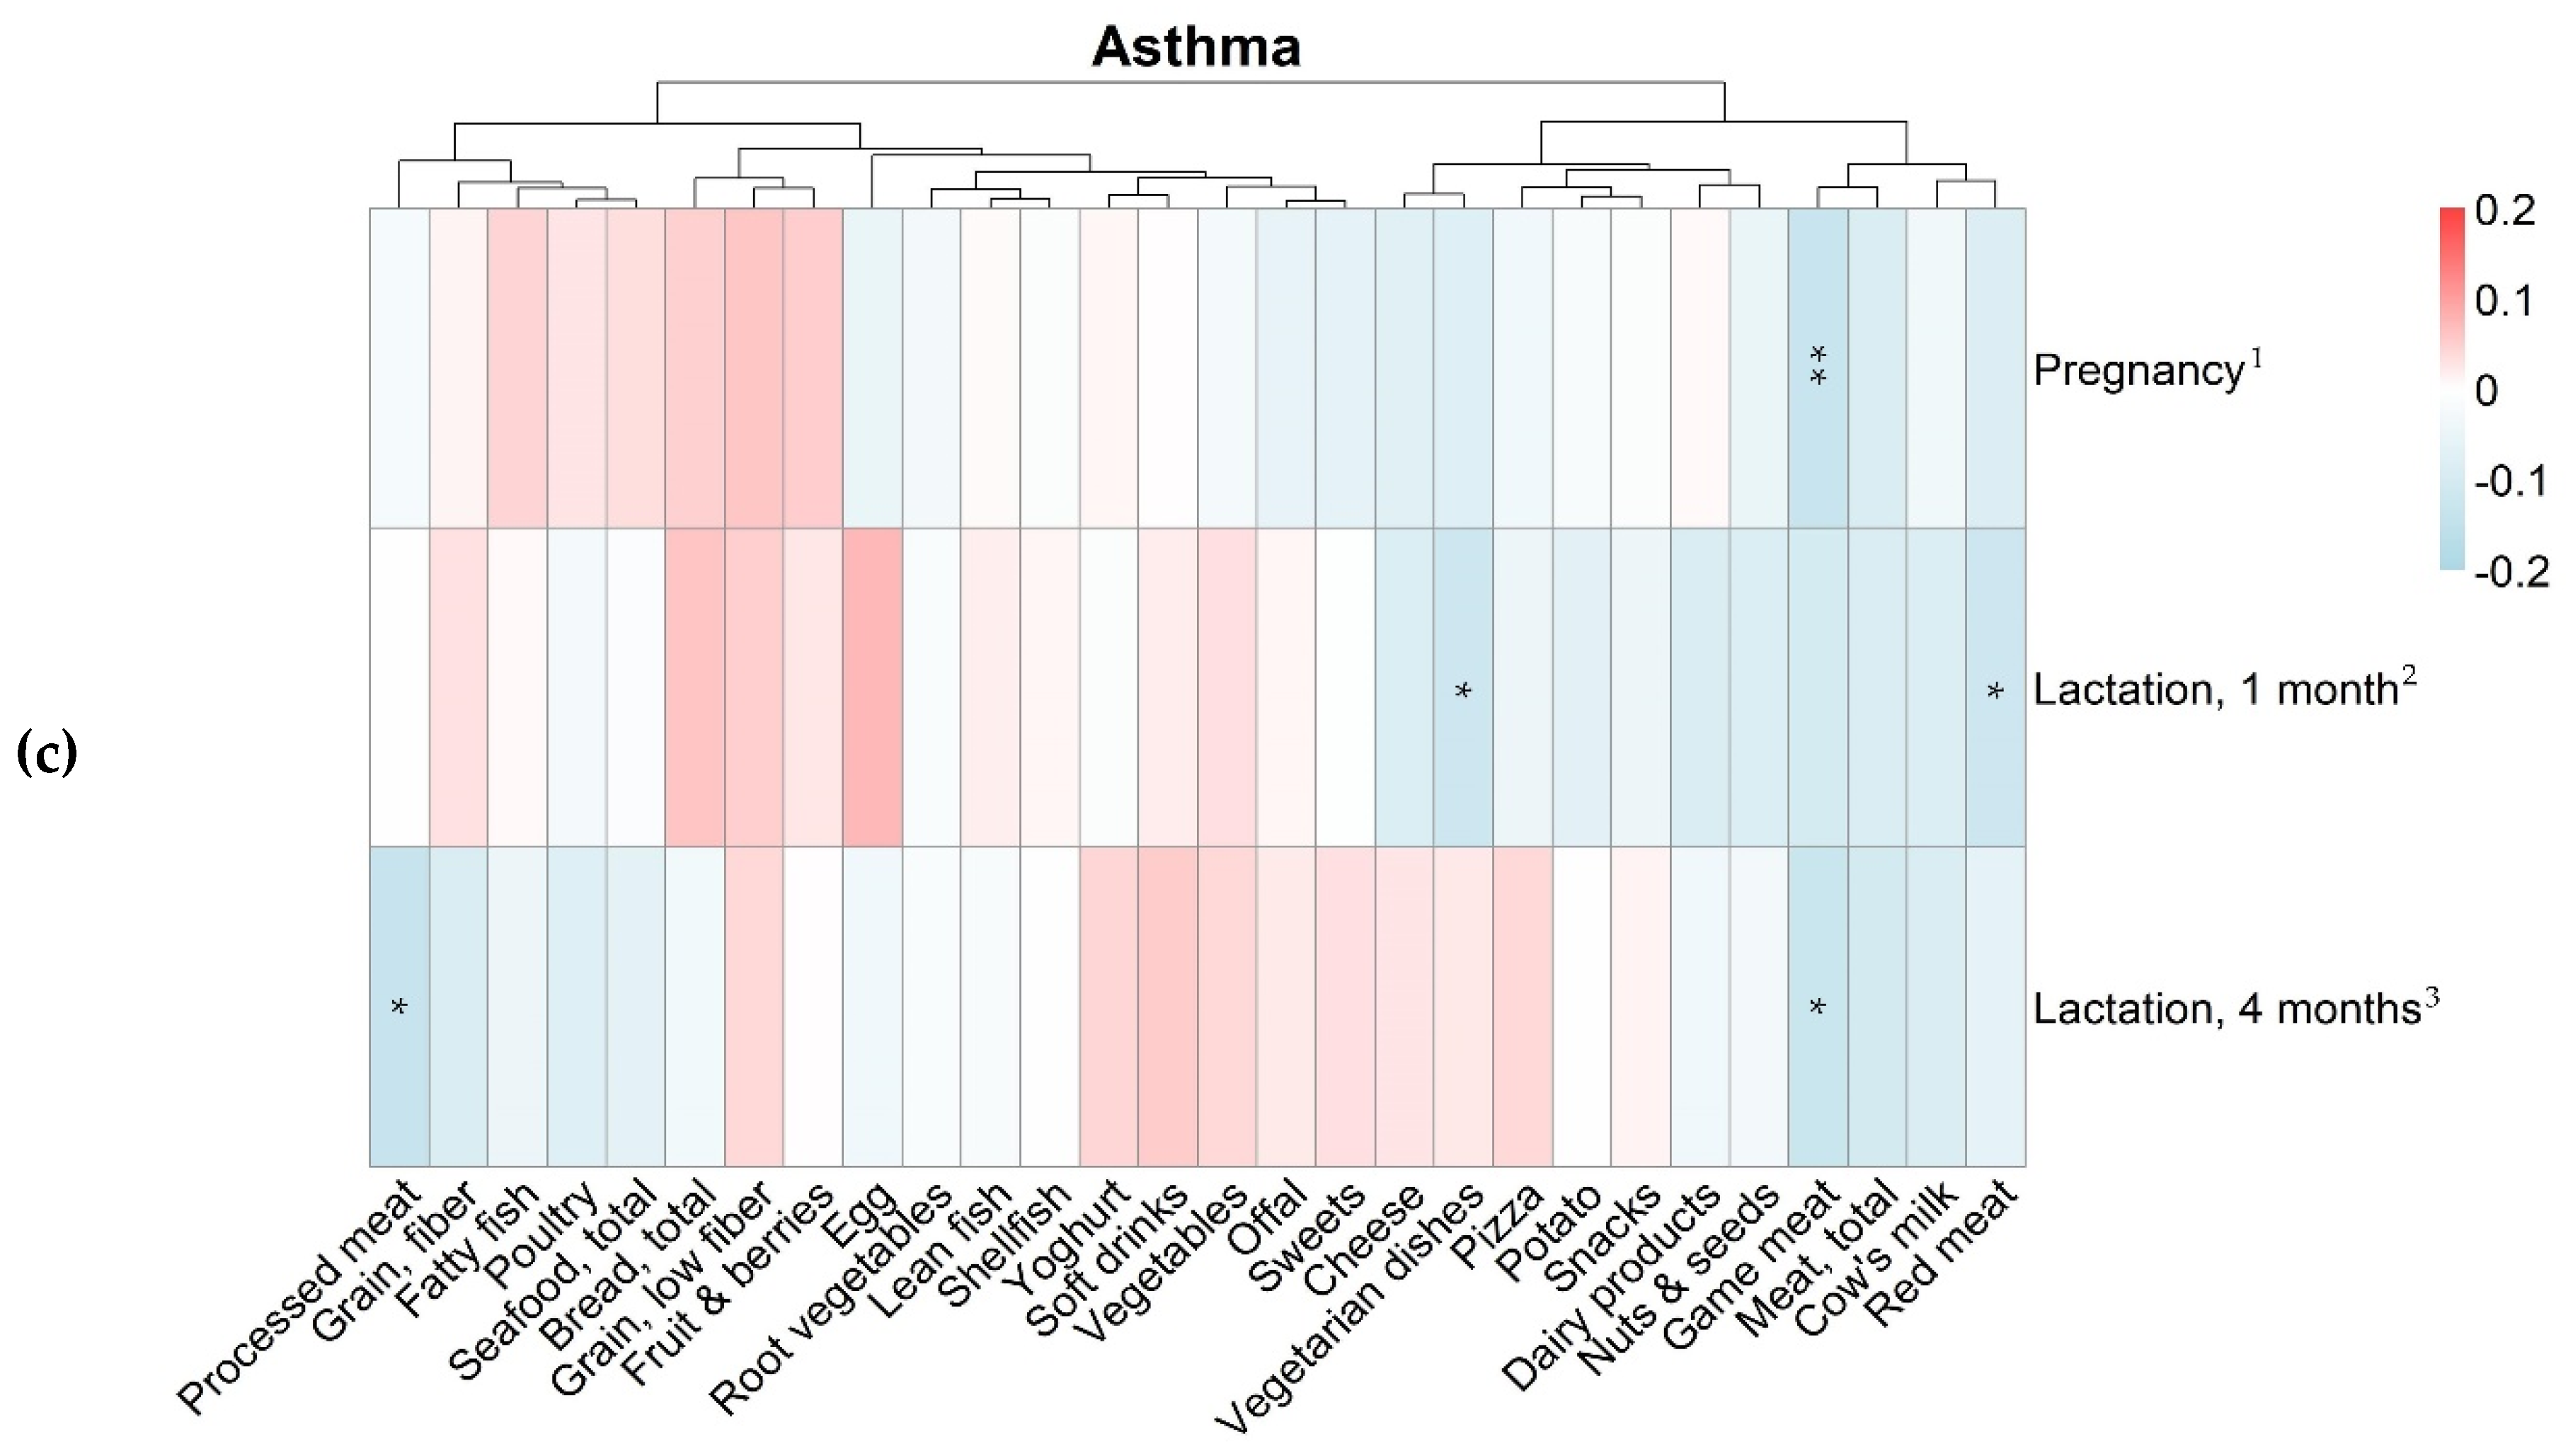
3.3. Maternal Food Intake and Allergy in the Offspring
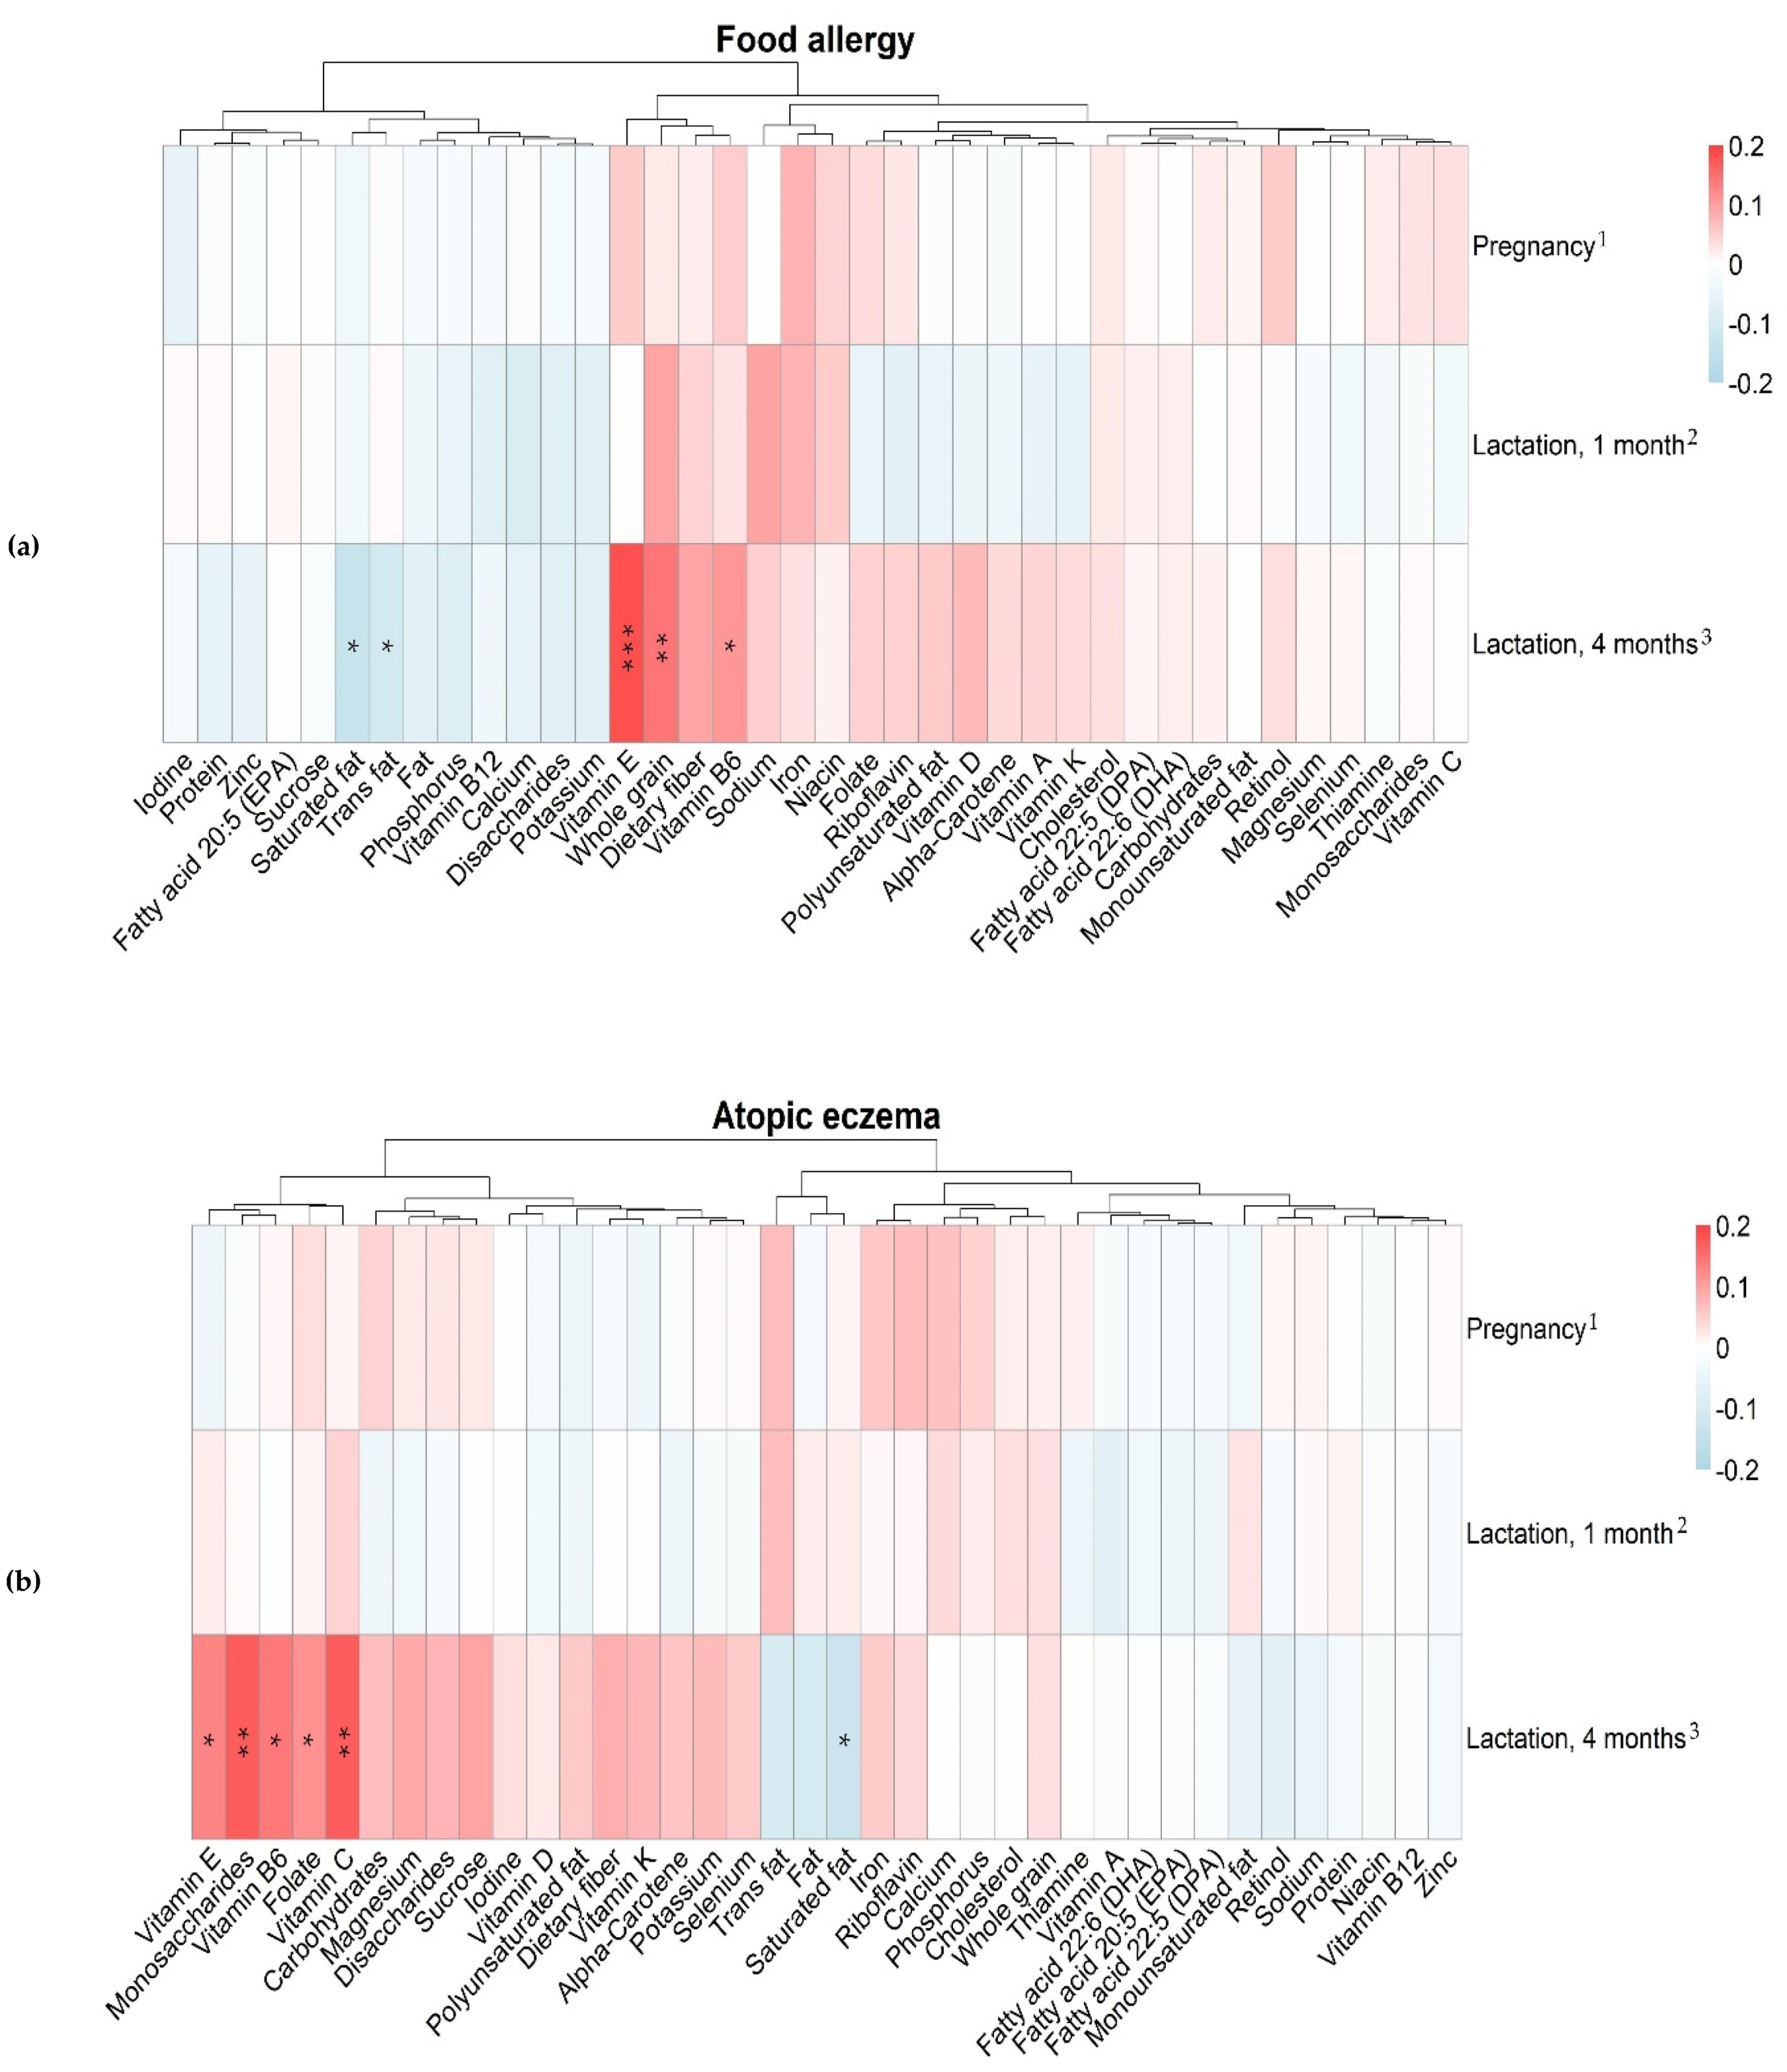
3.4. Maternal Intake of Nutrients and Allergy in the Offspring
3.5. Fatty Acid Proportions in Maternal Erythrocytes and Breast Milk in Relation to Diet
4. Discussion
5. Conclusions
Supplementary Materials
Author Contributions
Funding
Acknowledgments
Conflicts of Interest
Data Availability
References
- Institutet för Miljömedicin, Karolinska Institutet. Miljöhälsorapport 2013; Institutet för miljömedicin, Karolinska Institutet: Stockholm, Sweden, 2013. [Google Scholar]
- van der Hulst, A.E.; Klip, H.; Brand, P.L.P. Risk of developing asthma in young children with atopic eczema: A systematic review. J. Allergy Clin. Immunol. 2007, 120, 565–569. [Google Scholar] [CrossRef]
- Bekkers, M.B.; Aalberse, R.C.; Gehring, U.; Kerkhof, M.; Koppelman, G.H.; de Jongste, J.C.; Smit, H.A.; Brunekreef, B.; Wijga, A.H. Hen’s egg, not cow’s milk, sensitization in infancy is associated with asthma: 10-year follow-up of the PIAMA birth cohort. J. Allergy Clin. Immunol. 2013, 132, 1427–1428. [Google Scholar] [CrossRef] [PubMed]
- Netting, M.J.; Middleton, P.F.; Makrides, M. Does maternal diet during pregnancy and lactation affect outcomes in offspring? A systematic review of food-based approaches. Nutrition 2014, 30, 1225–1241. [Google Scholar] [CrossRef] [PubMed]
- Tuokkola, J.; Luukkainen, P.; Tapanainen, H.; Kaila, M.; Vaarala, O.; Kenward, M.G.; Virta, L.J.; Veijola, R.; Simell, O.; Ilonen, J.; et al. Maternal diet during pregnancy and lactation and cow’s milk allergy in offspring. Eur. J. Clin. Nutr. 2016, 70, 554–559. [Google Scholar] [CrossRef] [PubMed]
- Venter, C.; Agostoni, C.; Arshad, S.H.; Ben-Abdallah, M.; Du Toit, G.; Fleischer, D.M.; Greenhawt, M.; Glueck, D.H.; Groetch, M.; Lunjani, N.; et al. Dietary factors during pregnancy and atopic outcomes in childhood: A systematic review from the European Academy of Allergy and Clinical Immunology. Pediatric Allergy Immunol. 2020. [Google Scholar] [CrossRef]
- Sausenthaler, S.; Koletzko, S.; Schaaf, B.; Lehmann, I.; Borte, M.; Herbarth, O.; von Berg, A.; Wichmann, H.E.; Heinrich, J. Maternal diet during pregnancy in relation to eczema and allergic sensitization in the offspring at 2 y of age. Am. J. Clin. Nutr. 2007, 85, 530–537. [Google Scholar]
- Ramberg, J.E.; Nelson, E.D.; Sinnott, R.A. Immunomodulatory dietary polysaccharides: A systematic review of the literature. Nutr. J. 2010, 9, 54. [Google Scholar] [CrossRef]
- Venter, C.; Brown, K.R.; Maslin, K.; Palmer, D.J. Maternal dietary intake in pregnancy and lactation and allergic disease outcomes in offspring. Pediatric Allergy Immunol. 2017, 28, 135–143. [Google Scholar] [CrossRef]
- Baeke, F.; Takiishi, T.; Korf, H.; Gysemans, C.; Mathieu, C. Vitamin D: Modulator of the immune system. Curr. Opin. Pharmacol. 2010, 10, 482–496. [Google Scholar] [CrossRef]
- Carlsson, J.A.; Wold, A.E.; Sandberg, A.S.; Ostman, S.M. The Polyunsaturated Fatty Acids Arachidonic Acid and Docosahexaenoic Acid Induce Mouse Dendritic Cells Maturation but Reduce T-Cell Responses In Vitro. PLoS ONE 2015, 10, e0143741. [Google Scholar] [CrossRef]
- Soni, N.K.; Ross, A.B.; Scheers, N.; Savolainen, O.I.; Nookaew, I.; Gabrielsson, B.G.; Sandberg, A.S. Splenic Immune Response Is Down-Regulated in C57BL/6J Mice Fed Eicosapentaenoic Acid and Docosahexaenoic Acid Enriched High Fat Diet. Nutrients 2017, 9, 50. [Google Scholar] [CrossRef] [PubMed]
- Zurier, R.B.; Rossetti, R.G.; Seiler, C.M.; Laposata, M. Human peripheral blood T lymphocyte proliferation after activation of the T cell receptor: Effects of unsaturated fatty acids. Prostaglandins Leukot. Essential Fatty Acids 1999, 60, 371–375. [Google Scholar] [CrossRef]
- Barman, M.; Murray, F.; Bernardi, A.; Broberg, K.; Bölte, S.; Hesselmar, B.; Jacobsson, B.; Jonsson, K.; Kippler, M.; Rabe, H.; et al. Nutritional impact on Immunological maturation during Childhood in relation to the Environment (NICE): A prospective birth cohort in northern Sweden. BMJ Open 2018, 8, e022013. [Google Scholar] [CrossRef] [PubMed]
- Christensen, S.E.; Moller, E.; Bonn, S.E.; Ploner, A.; Balter, O.; Lissner, L.; Balter, K. Relative validity of micronutrient and fiber intake assessed with two new interactive meal- and Web-based food frequency questionnaires. J. Med. Internet Res. 2014, 16, e59. [Google Scholar] [CrossRef] [PubMed]
- Christensen, S.E.; Moller, E.; Bonn, S.E.; Ploner, A.; Wright, A.; Sjolander, A.; Balter, O.; Lissner, L.; Balter, K. Two new meal- and web-based interactive food frequency questionnaires: Validation of energy and macronutrient intake. J. Med. Internet Res. 2013, 15, e109. [Google Scholar] [CrossRef]
- Stråvik, M.; Jonsson, K.; Hartvigsson, O.; Sandin, A.; Wold, A.E.; Sandberg, A.-S.; Barman, M. Food and nutrient intake during pregnancy in relation to maternal characteristics: Results from the NICE Birth Cohort in Northern Sweden. Nutrients 2019, 11, 1680. [Google Scholar] [CrossRef]
- Swedish Food Agency. The Food Database Uppsala. 2020. Available online: https://www.livsmedelsverket.se/en/food-and-content/naringsamnen/livsmedelsdatabasen (accessed on 15 October 2020).
- Williams, H.C.; Jburney, P.G.; Hay, R.J.; Archer, C.B.; Shipley, M.J.; Ahunter, J.J.; Bingham, E.A.; Finlay, A.Y.; Pembroke, A.C.; Cgraham-Brown, R.A.; et al. The U.K. Working Party’s Diagnostic Criteria for Atopic Dermatitis. Br. J. Dermatol. 1994, 131, 383–396. [Google Scholar] [CrossRef]
- Williams, H.C.; Jburney, P.G.; Pembroke, A.C.; Hay, R.J. Atopic Dermatitis Diagnostic Criteria Working P. The U.K. Working Party’s Diagnostic Criteria for Atopic Dermatitis. III. Independent hospital validation. Br. J. Dermatol. 1994, 131, 406–416. [Google Scholar] [CrossRef]
- Williams, H.C.; Jburney, P.G.; Strachan, D.; Hay, R.J.; Atopic Dermatitis Diagnostic Criteria Working, P. The U.K. Working Party’s Diagnostic Criteria for Atopic Dermatitis II. Observer variation of clinical diagnosis and signs of atopic dermatitis. Br. J. Dermatol. 1994, 131, 397–405. [Google Scholar] [CrossRef]
- Lepage, G.; Roy, C.C. Improved recovery of fatty acid through direct transesterification without prior extraction or purification. J. Lipid Res. 1984, 25, 1391–1396. [Google Scholar]
- Pranger, I.G.; Joustra, M.L.; Corpeleijn, E.; Muskiet, F.A.J.; Kema, I.P.; Oude Elferink, S.J.W.H.; Singh-Povel, C.; Bakker, S.J.L. Fatty acids as biomarkers of total dairy and dairy fat intakes: A systematic review and meta-analysis. Nutr. Rev. 2018, 77, 46–63. [Google Scholar] [CrossRef] [PubMed]
- Norizoe, C.; Akiyama, N.; Segawa, T.; Tachimoto, H.; Mezawa, H.; Ida, H.; Urashima, M. Increased food allergy and vitamin D: Randomized, double-blind, placebo-controlled trial. Pediatrics Int. 2014, 56, 6–12. [Google Scholar] [CrossRef] [PubMed]
- Thijs, C.; Müller, A.; Rist, L.; Kummeling, I.; Snijders, B.E.P.; Huber, M.; Van Ree, R.; Simões-Wüst, A.P.; Dagnelie, P.C.; Van Den Brandt, P.A. Fatty acids in breast milk and development of atopic eczema and allergic sensitisation in infancy. Allergy 2011, 66, 58–67. [Google Scholar] [CrossRef] [PubMed]
- Barman, M.; Johansson, S.; Hesselmar, B.; Wold, A.E.; Sandberg, A.-S.; Sandin, A. High Levels of Both n-3 and n-6 Long-Chain Polyunsaturated Fatty Acids in Cord Serum Phospholipids Predict Allergy Development. PLoS ONE 2013, 8, e67920. [Google Scholar] [CrossRef]
- Black, P.; Sharpe, S. Dietary fat and asthma: Is there a connection? Eur. Respir. J. 1997, 10, 6–12. [Google Scholar] [CrossRef]
- Dunder, T.; Kuikka, L.; Turtinen, J.; Räsänen, L.; Uhari, M. Diet, serum fatty acids, and atopic diseases in childhood. Allergy 2001, 56, 425–428. [Google Scholar] [CrossRef]
- Zimecki, M.; Kruzel, M.L. Milk-derived proteins and peptides of potential therapeutic and nutritive value. J. Exp. Oncol. 2007, 6, 89–106. [Google Scholar]
- Lönnerdal, B. Biological Effects of Novel Bovine Milk Fractions. Nestlé Nutr. Inst. Workshop Ser. 2011, 67, 41–54. [Google Scholar]
- Järvinen, K.M.; Martin, H.; Oyoshi, M.K. Immunomodulatory effects of breast milk on food allergy. Ann. Allergy Asthma Immunol. 2019, 123, 133–143. [Google Scholar] [CrossRef]
- Chatzi, L.; Torrent, M.; Romieu, I.; Garcia-Esteban, R.; Ferrer, C.; Vioque, J.; Kogevinas, M.; Sunyer, J. Mediterranean diet in pregnancy is protective for wheeze and atopy in childhood. Thorax 2008, 63, 507–513. [Google Scholar] [CrossRef]
- Garcia-Larsen, V.; Ierodiakonou, D.; Jarrold, K.; Cunha, S.; Chivinge, J.; Robinson, Z.; Geoghegan, N.; Ruparelia, A.; Devani, P.; Trivella, M.; et al. Diet during pregnancy and infancy and risk of allergic or autoimmune disease: A systematic review and meta-analysis. PLoS Med. 2018, 15, e1002507. [Google Scholar] [CrossRef] [PubMed]
- Pretorius, R.A.; Bodinier, M.; Prescott, S.L.; Palmer, D.J. Maternal Fiber Dietary Intakes during Pregnancy and Infant Allergic Disease. Nutrients 2019, 11, 1767. [Google Scholar] [CrossRef] [PubMed]
- Tan, J.; McKenzie, C.; Vuillermin Peter, J.; Goverse, G.; Vinuesa Carola, G.; Mebius Reina, E.; Macia, L.; Mackay Charles, R. Dietary Fiber and Bacterial SCFA Enhance Oral Tolerance and Protect against Food Allergy through Diverse Cellular Pathways. Cell Rep. 2016, 15, 2809–2824. [Google Scholar] [CrossRef] [PubMed]


| Variables | Number (%) within Diagnostic Group | |||
|---|---|---|---|---|
| Non-Allergic (n = 389) | Food Allergy (n = 39) | Atopic Eczema (n = 33) | Asthma (n = 33) | |
| Age at delivery (years) | ||||
| <25 | 43 (11) | 4 (10) | 4 (12) | 5 (15) |
| 26–30 | 176 (45) | 17 (44) | 14 (42) | 10 (30) |
| 31–35 | 106 (27) | 14 (36) | 9 (27) | 14 (42) |
| >35 | 64 (16) | 4 (10) | 6 (18) | 4 (12) |
| Highest education level | ||||
| Elementary school (9 years) | 9 (2) | 1 (3) | 0 (0) | 0 (0) |
| Senior high school (12 years) | 99 (26) | 12 (31) | 12 (36) | 15 (47) |
| University/other education (>12 years) | 278 (72) | 26 (67) | 21 (64) | 17 (53) |
| Missing | 3 | - | - | 1 |
| Maternal nationality | ||||
| Swedish | 366 (95) | 38 (97) | 33 (100) | 32 (97) |
| Other | 21 (5) | 1 (3) | 0 (0) | 1 (3) |
| Missing | 2 | - | - | - |
| Maternal smoking before pregnancy | 22 (6) | 1 (3) | 0 (0) | 2 (6) |
| Missing | 4 | - | - | 1 |
| Paternal smoking during pregnancy | 6 (2) | 2 (7) | 1 (4) | 3 (14) * |
| Missing | 99 | 11 | 5 | 12 |
| Parity | ||||
| No previous child | 193 (50) | 21 (54) | 17 (52) | 11 (34) |
| ≥1 previous child | 194 (50) | 18 (46) | 16 (48) | 21 (66) |
| Missing | 2 | - | - | 1 |
| ≥1 older sibling at home full time | 190 (49) | 19 (49) | 16 (48) | 22 (67) * |
| Early pregnancy BMI | ||||
| Underweight (<18.5) | 5 (1) | 0 (0) | 0 (0) | 0 (0) |
| Normal weight (18.5–24.9) | 216 (57) | 20 (53) | 19 (59) | 21 (64) |
| Overweight (25–29.9) | 110 (29) | 9 (24) | 10 (31) | 8 (24) |
| Obese (≥30) | 48 (13) | 9 (24) | 3 (9) | 4 (12) |
| Missing | 10 | 1 | 1 | - |
| Residential address | ||||
| Town (central part) | 178 (46) | 16 (42) | 14 (42) | 15 (45) |
| Town (suburb) | 94 (24) | 14 (37) | 7 (21) | 9 (27) |
| Countryside | 112 (29) | 8 (21) | 12 (36) | 9 (27) |
| Missing | 5 | 1 | - | - |
| Pet ownership (first year of life) | ||||
| Dog | 125 (32) | 8 (21) | 7 (21) | 9 (27) |
| Cat | 90 (23) | 11 (28) | 6 (18) | 7 (21) |
| Other | 20 (5) | 0 (0) | 1 (3) | 1 (3) |
| Allergic heredity | ||||
| Maternal | 143 (37) | 23 (59) ** | 21 (64) ** | 16 (48) |
| Paternal | 165 (42) | 20 (51) | 21 (64) * | 12 (36) |
| Sibling | 63 (16) | 12 (31) ** | 8 (24) | 11 (33) |
| Any | 260 (67) | 33 (85) * | 32 (97) *** | 24 (73) |
| Season of birth | ||||
| Bright season | 211 (55) | 19 (49) | 13 (39) | 20 (63) |
| Dark season | 176 (45) | 20 (51) | 20 (61) | 12 (38) |
| Missing | 2 | - | - | 1 |
| Gender (boy) | 170 (44) | 24 (62) * | 17 (52) | 17 (52) |
| Birthweight in grams | ||||
| <2.500 | 11 (3) | 1 (3) | 1 (3) | 2 (6) |
| 2.500–4.500 | 359 (93) | 37 (95) | 31 (94) | 25 (78) * |
| >4.500 | 17 (4) | 1 (3) | 1 (3) | 5 (16) * |
| Missing | 2 | - | - | 1 |
| Gestational length | ||||
| Pre-term | 16 (4) | 1 (3) | 1 (3) | 2 (6) |
| Term | 340 (88) | 34 (87) | 29 (88) | 26 (81) |
| Post-term | 32 (8) | 4 (10) | 3 (9) | 4 (13) |
| Missing | 1 | - | - | 1 |
| Birth mode | ||||
| Vaginal delivery | 339 (87) | 33 (85) | 27 (82) | 27 (82) |
| Cesarean section | 50 (13) | 6 (15) | 6 (18) | 6 (18) |
| Lactation | ||||
| Never | 18 (5) | 2 (6) | 2 (6) | 0 (0) |
| <4 months | 35 (10) | 5 (14) | 4 (12) | 9 (30) ** |
| 4–5 months | 56 (15) | 8 (22) | 6 (18) | 8 (27) |
| ≥6 months | 253 (70) | 21 (58) | 21 (64) | 13 (43) ** |
| Missing | 27 | 3 | - | 3 |
| Variables | Food Intake in Gram per Day, Median (25th–75th Percentile) | ||
|---|---|---|---|
| Pregnancy Gestational Week 34 n = 488 | Lactation 1 Month Postpartum n = 430 | Lactation 4 Months Postpartum n = 397 | |
| Bread, total | 57 (38–85) | 57 (38–83) | 53 (30–82) |
| Cheese | 23 (3.9–45) | 23 (3.9–45) | 22 (3.9–49) |
| Cow’s milk | 100 (14–400) | 100 (0–200) | 43 (0–200) |
| Dairy products | 310 (190–520) | 270 (150–430) | 230 (110–390) |
| Egg | 11 (3.6–11) | 3.6 (3.6–11) | 11 (3.6–25) |
| Fatty fish | 9.1 (6.6–20) | 9.1 (6.6–20) | 11 (6.6–20) |
| Fruit and berries | 270 (170–410) | 200 (120–310) | 170 (95–300) |
| Game meat | 0 (0–13) | 0 (0–18) | 0 (0–13) |
| Grain, fiber | 40 (19–72) | 38 (16–70) | 38 (16–66) |
| Grain, low fiber | 55 (31–85) | 57 (32–92) | 55 (26–88) |
| Lean fish | 6.6 (6.6–20) | 6.6 (4.1–20) | 6.6 (6.6–20) |
| Meat, total | 97 (68–130) | 100 (70–140) | 100 (68–140) |
| Nuts and seeds | 2.9 (0–8.6) | 1.7 (0–8.6) | 2.9 (0–8.6) |
| Offal | 3.0 (0–9.6) | 1.0 (0–9.1) | 1.0 (0–7.6) |
| Pizza | 25 (25–25) | 25 (25–25) | 25 (0–25) |
| Potato | 31 (21–47) | 31 (21–54) | 31 (21–47) |
| Poultry | 20 (6.6–20) | 20 (6.6–20) | 20 (6.6–20) |
| Processed meat | 27 (16–40) | 30 (18–43) | 30 (16–43) |
| Red meat | 53 (36–73) | 54 (39–79) | 54 (39–79) |
| Root vegetables | 15 (5.5–30) | 13 (4.3–30) | 18 (6.4–35) |
| Seafood, total | 26 (17–39) | 26 (13–38) | 26 (18–39) |
| Shellfish | 4.1 (0–6.6) | 0 (0–6.6) | 0 (0–6.6) |
| Snacks | 4.3 (2.1–6.4) | 4.3 (2.1–8.6) | 4.3 (2.1–8.6) |
| Soft drinks | 43 (14–100) | 43 (14–100) | 14 (0–43) |
| Sweets | 40 (20–69) | 43 (20–73) | 37 (16–60) |
| Vegetables | 120 (58–210) | 110 (49–190) | 120 (58–200) |
| Vegetarian dishes | 18 (0–24) | 9.1 (0–24) | 18 (0–54) |
| Yoghurt | 100 (43–200) | 100 (14–200) | 100 (7.1–200) |
| Variables | Median (25th–75th Percentile) | ||
|---|---|---|---|
| Pregnancy Gestational Week 34 n = 488 | Lactation 1 Month Postpartum n = 430 | Lactation 4 Months Postpartum n = 397 | |
| Energy, kJ | 7200 (5600–8800) | 7000 (5500–9200) | 6800 (5300–8500) |
| Energy, kcal | 1700 (1300–2100) | 1700 (1300–2200) | 1600 (1300–2000) |
| Protein, g | 70 (55–86) | 69 (55–88) | 69 (55–85) |
| Fat, g | 67 (51–84) | 68 (53–91) | 65 (49–84) |
| Cholesterol, mg | 220 (170–280) | 220 (170–290) | 230 (180–290) |
| Monounsaturated fat, g | 23 (18–30) | 24 (19–32) | 24 (18–30) |
| Polyunsaturated fat, g | 8.1 (5.9–11) | 8.1 (6.0–11) | 8.3 (6.3–11) |
| Fatty acid 20:5 (EPA), mg | 79 (50–150) | 75 (52–150) | 77 (52–150) |
| Fatty acid 22:5 (DPA), mg | 46 (31–76) | 45 (32–74) | 46 (32–75) |
| Fatty acid 22:6 (DHA), mg | 170 (110–300) | 160 (110–290) | 170 (110–300) |
| Saturated fat, g | 30 (22–37) | 29 (22–40) | 27 (21–37) |
| Trans fat, g | 0.75 (0.52–1.0) | 0.76 (0.53–1.1) | 0.71 (0.45–1.0) |
| Carbohydrates, g | 200 (150–240) | 190 (140–250) | 180 (130–230) |
| Disaccharides, g | 61 (45–82) | 59 (43–83) | 54 (40–74) |
| Monosaccharides, g | 32 (22–43) | 28 (20–38) | 26 (18–35) |
| Fiber, g | 18 (12–25) | 17 (11–25) | 17 (12–24) |
| Sucrose, g | 36 (25–52) | 35 (23–51) | 30 (21–44) |
| Whole grain, g | 34 (16–63) | 38 (18–62) | 40 (20–61) |
| Alpha-Carotene, μg | 2500 (1500–4100) | 2300 (1400–4000) | 2700 (1600–4200) |
| Calcium, mg | 1000 (760–1300) | 1000 (760-1400) | 1000 (750–1300) |
| Folate, μg | 290 (220–380) | 280 (200–360) | 280 (210–350) |
| Iodine, μg | 99 (69–140) | 110 (69–150) | 110 (76–150) |
| Iron, mg | 10 (7.1–13) | 10 (7.1–14) | 9.5 (7.1–13) |
| Magnesium, mg | 290 (220–380) | 300 (210–380) | 290 (230–370) |
| Niacin, mg | 15 (11–19) | 15 (11–19) | 15 (12–19) |
| Phosphorus, mg | 1400 (1000–1700) | 1300 (1000–1700) | 1300 (1100–1600) |
| Potassium, mg | 2900 (2200–3400) | 2800 (2100–3600) | 2800 (2200–3400) |
| Retinol, μg | 380 (270–530) | 370 (260–530) | 350 (240–480) |
| Riboflavin, mg | 1.7 (1.2–2.1) | 1.6 (1.2–2.2) | 1.6 (1.2–2.0) |
| Selenium, μg | 40 (30–51) | 38 (29–52) | 39 (30–54) |
| Sodium, mg | 2200 (1700–2800) | 2200 (1800–2800) | 2300 (1800–2800) |
| Thiamine, mg | 1.2 (0.93–1.6) | 1.2 (0.87–1.6) | 1.1 (0.92–1.5) |
| Vitamin A, μg | 650 (480–850) | 640 (450–860) | 640 (470–870) |
| Vitamin B12, μg | 4.9 (3.6–6.5) | 4.9 (3.6–6.6) | 4.9 (3.8–6.2) |
| Vitamin B6, mg | 1.7 (1.3–2.1) | 1.6 (1.2–2.0) | 1.6 (1.2–2.0) |
| Vitamin C, mg | 97 (63–140) | 78 (53–110) | 74 (49–110) |
| Vitamin D, μg | 6.3 (4.2–8.8) | 6.3 (4.5–8.8) | 6.6 (4.8–8.7) |
| Vitamin E, mg | 8.0 (6.1–10) | 7.8 (5.9–10) | 8.4 (6.3–11) |
| Vitamin K, μg | 30 (22–40) | 30 (20–40) | 31 (21–40) |
| Zinc, mg | 9.3 (7.1–12) | 9.5 (7.4–12) | 9.2 (7.5–11) |
| Variables | Breast Milk | Erythrocytes | ||||||
|---|---|---|---|---|---|---|---|---|
| 1 Month | 4 Months | Pregnancy | 4 Months | |||||
| Rho | p | Rho | p | Rho | p | Rho | p | |
| Dairy products | ||||||||
| Pentadecanoic acid (15:0) | 0.229 | <0.001 | 0.328 | <0.001 | 0.194 | <0.001 | 0.272 | <0.001 |
| Heptadecanoic acid (17:0) | 0.161 | 0.006 | 0.287 | <0.001 | - | NS 1 | 0.144 | 0.021 |
| Cow’s milk | ||||||||
| Pentadecanoic acid (15:0) | 0.192 | <0.001 | 0.251 | <0.001 | 0.152 | <0.001 | 0.170 | 0.006 |
| Heptadecanoic acid (17:0) | 0.167 | 0.004 | 0.238 | <0.001 | - | NS | 0.132 | 0.034 |
| Cheese | ||||||||
| Pentadecanoic acid (15:0) | 0.284 | <0.001 | 0.278 | <0.001 | 0.158 | <0.001 | 0.266 | <0.001 |
| Heptadecanoic acid (17:0) | 0.219 | <0.001 | 0.154 | 0.009 | - | NS | 0.140 | 0.025 |
Publisher’s Note: MDPI stays neutral with regard to jurisdictional claims in published maps and institutional affiliations. |
© 2020 by the authors. Licensee MDPI, Basel, Switzerland. This article is an open access article distributed under the terms and conditions of the Creative Commons Attribution (CC BY) license (http://creativecommons.org/licenses/by/4.0/).
Share and Cite
Stråvik, M.; Barman, M.; Hesselmar, B.; Sandin, A.; Wold, A.E.; Sandberg, A.-S. Maternal Intake of Cow’s Milk during Lactation Is Associated with Lower Prevalence of Food Allergy in Offspring. Nutrients 2020, 12, 3680. https://doi.org/10.3390/nu12123680
Stråvik M, Barman M, Hesselmar B, Sandin A, Wold AE, Sandberg A-S. Maternal Intake of Cow’s Milk during Lactation Is Associated with Lower Prevalence of Food Allergy in Offspring. Nutrients. 2020; 12(12):3680. https://doi.org/10.3390/nu12123680
Chicago/Turabian StyleStråvik, Mia, Malin Barman, Bill Hesselmar, Anna Sandin, Agnes E. Wold, and Ann-Sofie Sandberg. 2020. "Maternal Intake of Cow’s Milk during Lactation Is Associated with Lower Prevalence of Food Allergy in Offspring" Nutrients 12, no. 12: 3680. https://doi.org/10.3390/nu12123680
APA StyleStråvik, M., Barman, M., Hesselmar, B., Sandin, A., Wold, A. E., & Sandberg, A.-S. (2020). Maternal Intake of Cow’s Milk during Lactation Is Associated with Lower Prevalence of Food Allergy in Offspring. Nutrients, 12(12), 3680. https://doi.org/10.3390/nu12123680