Effects of High and Low Protein Diets on Inflammatory Profiles in People with Morbid Obesity: A 3-Week Intervention Study

 and
and
Abstract
:1. Introduction
2. Materials and Methods
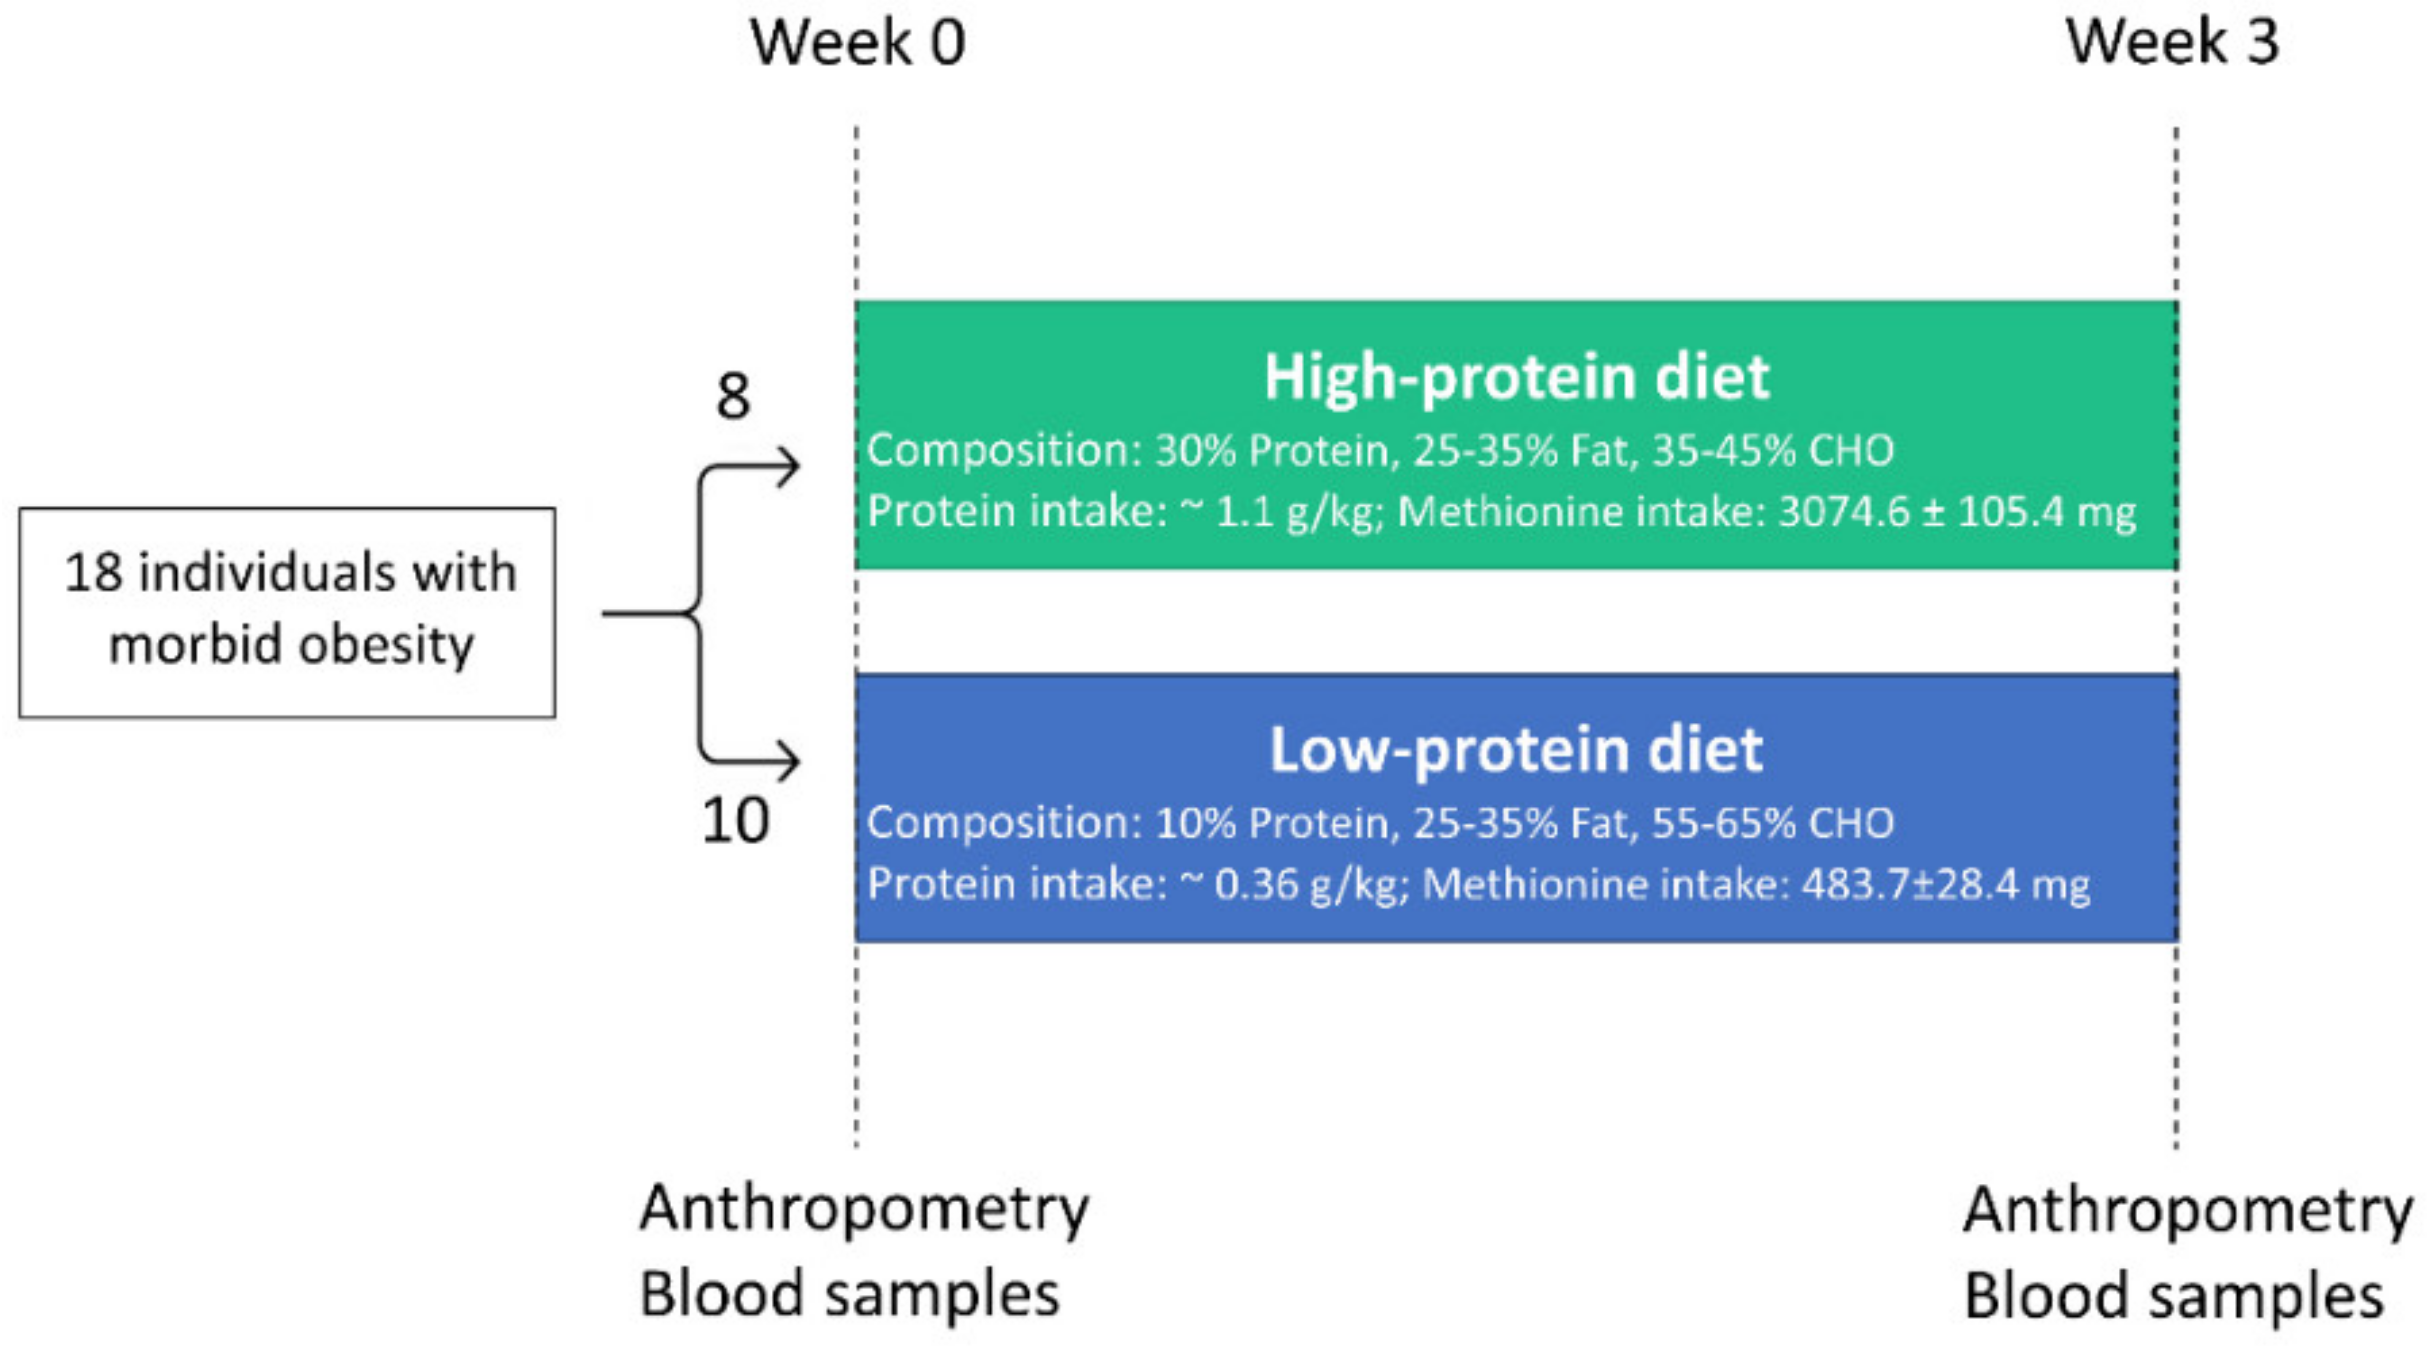
2.1. Study Design and Dietary Intervention
2.2. Biomarker Measurements
2.3. Statistics
3. Results
4. Discussion
5. Conclusions
Supplementary Materials
Author Contributions
Funding
Acknowledgments
Conflicts of Interest
References
- WHO. Obesity and Overweight. Available online: https://www.who.int/news-room/fact-sheets/detail/obesity-and-overweight (accessed on 5 January 2020).
- Andreyeva, T.; Sturm, R.; Ringel, J.S. Moderate and severe obesity have large differences in health care costs. Obes. Res. 2004, 12, 1936–1943. [Google Scholar] [CrossRef] [PubMed] [Green Version]
- Sturm, R.; Hattori, A. Morbid obesity rates continue to rise rapidly in the United States. Int. J. Obes. 2013, 37, 889–891. [Google Scholar] [CrossRef] [PubMed] [Green Version]
- Pi-Sunyer, X. The medical risks of obesity. Postgrad. Med. 2009, 121, 21–33. [Google Scholar] [CrossRef] [PubMed]
- Nigro, E.; Scudiero, O.; Monaco, M.L.; Palmieri, A.; Mazzarella, G.; Costagliola, C.; Bianco, A.; Daniele, A. New insight into adiponectin role in obesity and obesity-related diseases. BioMed Res. Int. 2014, 2014, 658913. [Google Scholar] [CrossRef] [PubMed]
- Greenberg, A.S.; Obin, M.S. Obesity and the role of adipose tissue in inflammation and metabolism. Am. J. Clin. Nutr. 2006, 83, 461s–465s. [Google Scholar] [CrossRef] [PubMed] [Green Version]
- Nijhuis, J.; Rensen, S.S.; Slaats, Y.; Van Dielen, F.M.; Buurman, W.A.; Greve, J.W. Neutrophil activation in morbid obesity, chronic activation of acute inflammation. Obesity 2009, 17, 2014–2018. [Google Scholar] [CrossRef] [PubMed]
- Fildes, A.; Charlton, J.; Rudisill, C.; Littlejohns, P.; Prevost, A.T.; Gulliford, M.C. Probability of an obese person attaining normal body weight: Cohort study using electronic health records. Am. J. Public Health 2015, 105, e54–e59. [Google Scholar] [CrossRef] [PubMed] [Green Version]
- Gulliford, M.C.; Charlton, J.; Prevost, T.; Booth, H.; Fildes, A.; Ashworth, M.; Littlejohns, P.; Reddy, M.; Khan, O.; Rudisill, C. Costs and outcomes of increasing access to bariatric surgery: Cohort study and cost-effectiveness analysis using electronic health records. Value Health 2017, 20, 85–92. [Google Scholar] [CrossRef] [PubMed] [Green Version]
- Jouan, Y.; Blasco, H.; Bongrani, A.; Couet, C.; Dupont, J.; Maillot, F. Preoperative chemerin level is predictive of inflammatory status 1 year after bariatric surgery. Obes. Surg. 2020, 30, 3852–3861. [Google Scholar] [CrossRef] [PubMed]
- Courcoulas, A.P.; Christian, N.J.; Belle, S.H.; Berk, P.D.; Flum, D.R.; Garcia, L.; Horlick, M.; Kalarchian, M.A.; King, W.C.; Mitchell, J.E.; et al. Weight change and health outcomes at 3 years after bariatric surgery among individuals with severe obesity. JAMA 2013, 310, 2416–2425. [Google Scholar] [CrossRef] [PubMed] [Green Version]
- You, T.; Arsenis, N.C.; Disanzo, B.L.; Lamonte, M.J. Effects of exercise training on chronic inflammation in obesity: Current evidence and potential mechanisms. Sports Med. 2013, 43, 243–256. [Google Scholar] [CrossRef] [PubMed]
- Williamson, K.; Nimegeer, A.; Lean, M. Rising prevalence of BMI ≥40 kg/m2: A high-demand epidemic needing better documentation. Obes. Rev. 2020, 21, e12986. [Google Scholar] [CrossRef] [PubMed] [Green Version]
- Kiecolt-Glaser, J.K. Stress, food, and inflammation: Psychoneuroimmunology and nutrition at the cutting edge. Psychosom. Med. 2010, 72, 365–369. [Google Scholar] [CrossRef] [PubMed] [Green Version]
- Minihane, A.M.; Vinoy, S.; Russell, W.R.; Baka, A.; Roche, H.M.; Tuohy, K.M.; Teeling, J.L.; Blaak, E.E.; Fenech, M.; Vauzour, D.; et al. Low-grade inflammation, diet composition and health: Current research evidence and its translation. Br. J. Nutr. 2015, 114, 999–1012. [Google Scholar] [CrossRef] [PubMed] [Green Version]
- Clifton, P.M.; Keogh, J. Metabolic effects of high-protein diets. Curr. Atheroscler. Rep. 2007, 9, 472–478. [Google Scholar] [CrossRef]
- Batterham, R.L.; Cowley, M.A.; Small, C.J.; Herzog, H.; Cohen, M.A.; Dakin, C.L.; Wren, A.M.; Brynes, A.E.; Low, M.J.; Ghatei, M.A.; et al. Gut hormone PYY3-36 physiologically inhibits food intake. Nature 2002, 418, 650–654. [Google Scholar] [CrossRef] [PubMed]
- Dong, J.Y.; Zhang, Z.L.; Wang, P.Y.; Qin, L.Q. Effects of high-protein diets on body weight, glycaemic control, blood lipids and blood pressure in type 2 diabetes: Meta-analysis of randomised controlled trials. Br. J. Nutr. 2013, 110, 781–789. [Google Scholar] [CrossRef]
- Pivovarova-Ramich, O.; Markova, M.; Weber, D.; Sucher, S.; Hornemann, S.; Rudovich, N.; Raila, J.; Sunaga-Franze, D.; Sauer, S.; Rohn, S.; et al. Effects of diets high in animal or plant protein on oxidative stress in individuals with type 2 diabetes: A randomized clinical trial. Redox Biol. 2020, 29, 101397. [Google Scholar] [CrossRef]
- Draganidis, D.; Karagounis, L.G.; Athanailidis, I.; Chatzinikolaou, A.; Jamurtas, A.Z.; Fatouros, I.G. Inflammaging and skeletal muscle: Can protein intake make a difference? J. Nutr. 2016, 146, 1940–1952. [Google Scholar] [CrossRef]
- Hruby, A.; Jacques, P.F. Dietary protein and changes in biomarkers of inflammation and oxidative stress in the framingham heart study offspring cohort. Curr. Dev. Nutr. 2019, 3, nzz019. [Google Scholar] [CrossRef] [Green Version]
- Castaño-Martinez, T.; Schumacher, F.; Schumacher, S.; Kochlik, B.; Weber, D.; Grune, T.; Biemann, R.; McCann, A.; Abraham, K.; Weikert, C.; et al. Methionine restriction prevents onset of type 2 diabetes in NZO mice. FASEB J. 2019, 33, 7092–7102. [Google Scholar] [CrossRef] [PubMed]
- Roy, D.G.; Chen, J.; Mamane, V.; Ma, E.H.; Muhire, B.M.; Sheldon, R.D.; Shorstova, T.; Koning, R.; Johnson, R.M.; Esaulova, E.; et al. Methionine metabolism shapes T helper cell responses through regulation of epigenetic reprogramming. Cell Metab. 2020, 31, 250–266.e259. [Google Scholar] [CrossRef] [PubMed]
- Gögebakan, O.; Kohl, A.; Osterhoff, M.A.; van Baak, M.A.; Jebb, S.A.; Papadaki, A.; Martinez, J.A.; Handjieva-Darlenska, T.; Hlavaty, P.; Weickert, M.O.; et al. Effects of weight loss and long-term weight maintenance with diets varying in protein and glycemic index on cardiovascular risk factors: The diet, obesity, and genes (DiOGenes) study: A randomized, controlled trial. Circulation 2011, 124, 2829–2838. [Google Scholar] [CrossRef] [PubMed] [Green Version]
- Markova, M.; Koelman, L.; Hornemann, S.; Pivovarova, O.; Sucher, S.; Machann, J.; Rudovich, N.; Thomann, R.; Schneeweiss, R.; Rohn, S.; et al. Effects of plant and animal high protein diets on immune-inflammatory biomarkers: A 6-week intervention trial. Clin. Nutr. 2020, 39, 862–869. [Google Scholar] [CrossRef] [PubMed]
- Xu, C.; Markova, M.; Seebeck, N.; Loft, A.; Hornemann, S.; Gantert, T.; Kabisch, S.; Herz, K.; Loske, J.; Ost, M.; et al. High-protein diet more effectively reduces hepatic fat than low-protein diet despite lower autophagy and FGF21 levels. Liver Int. 2020. [CrossRef]
- Roy, J. SAS for Mixed Models, Second Edition. R. C.Littell, G.A.; Milliken, W.W.; Stroup, R.D. Wolfinger, and O. Schabenberger. J. Biopharm. Stat. 2007, 17, 188. [Google Scholar] [CrossRef]
- Bárcena, C.; Quirós, P.M.; Durand, S.; Mayoral, P.; Rodríguez, F.; Caravia, X.M.; Mariño, G.; Garabaya, C.; Fernández-García, M.T.; Kroemer, G.; et al. Methionine restriction extends lifespan in progeroid mice and alters lipid and bile acid metabolism. Cell Rep. 2018, 24, 2392–2403. [Google Scholar] [CrossRef] [Green Version]
- Mladenović, D.; Radosavljević, T.; Hrnčić, D.; Rasic-Markovic, A.; Stanojlović, O. The effects of dietary methionine restriction on the function and metabolic reprogramming in the liver and brain–implications for longevity. Rev. Neurosci. 2019, 30, 581–593. [Google Scholar] [CrossRef]
- Sharma, S.; Dixon, T.; Jung, S.; Graff, E.C.; Forney, L.A.; Gettys, T.W.; Wanders, D. Dietary methionine restriction reduces inflammation independent of FGF21 action. Obesity 2019, 27, 1305–1313. [Google Scholar] [CrossRef]
- Wanders, D.; Ghosh, S.; Stone, K.P.; Van, N.T.; Gettys, T.W. Transcriptional impact of dietary methionine restriction on systemic inflammation: Relevance to biomarkers of metabolic disease during aging. BioFactors 2014, 40, 13–26. [Google Scholar] [CrossRef] [Green Version]
- Malloy, V.L.; Krajcik, R.A.; Bailey, S.J.; Hristopoulos, G.; Plummer, J.D.; Orentreich, N. Methionine restriction decreases visceral fat mass and preserves insulin action in aging male Fischer 344 rats independent of energy restriction. Aging Cell 2006, 5, 305–314. [Google Scholar] [CrossRef] [PubMed]
- Hasek, B.E.; Stewart, L.K.; Henagan, T.M.; Boudreau, A.; Lenard, N.R.; Black, C.; Shin, J.; Huypens, P.; Malloy, V.L.; Plaisance, E.P.; et al. Dietary methionine restriction enhances metabolic flexibility and increases uncoupled respiration in both fed and fasted states. Am. J. Physiol. Regul. Integr. Comp. Physiol. 2010, 299, R728–R739. [Google Scholar] [CrossRef] [PubMed] [Green Version]
- Martínez, Y.; Li, X.; Liu, G.; Bin, P.; Yan, W.; Más, D.; Valdivié, M.; Hu, C.A.; Ren, W.; Yin, Y. The role of methionine on metabolism, oxidative stress, and diseases. Amino Acids 2017, 49, 2091–2098. [Google Scholar] [CrossRef] [PubMed]
- Ables, G.P.; Perrone, C.E.; Orentreich, D.; Orentreich, N. Methionine-restricted C57BL/6J mice are resistant to diet-induced obesity and insulin resistance but have low bone density. PLoS ONE 2012, 7, e51357. [Google Scholar] [CrossRef] [PubMed] [Green Version]
- Miller, R.A.; Buehner, G.; Chang, Y.; Harper, J.M.; Sigler, R.; Smith-Wheelock, M. Methionine-deficient diet extends mouse lifespan, slows immune and lens aging, alters glucose, T4, IGF-I and insulin levels, and increases hepatocyte MIF levels and stress resistance. Aging Cell 2005, 4, 119–125. [Google Scholar] [CrossRef]
- Dong, Z.; Sinha, R.; Richie, J.P., Jr. Disease prevention and delayed aging by dietary sulfur amino acid restriction: Translational implications. Ann. N. Y. Acad. Sci. 2018, 1418, 44–55. [Google Scholar] [CrossRef]
- Plaisance, E.P.; Greenway, F.L.; Boudreau, A.; Hill, K.L.; Johnson, W.D.; Krajcik, R.A.; Perrone, C.E.; Orentreich, N.; Cefalu, W.T.; Gettys, T.W. Dietary methionine restriction increases fat oxidation in obese adults with metabolic syndrome. J. Clin. Endocrinol. Metab. 2011, 96, E836–E840. [Google Scholar] [CrossRef]
- King, D.E. Dietary fiber, inflammation, and cardiovascular disease. Mol. Nutr. Food Res. 2005, 49, 594–600. [Google Scholar] [CrossRef]
- Ma, Y.; Hébert, J.R.; Li, W.; Bertone-Johnson, E.R.; Olendzki, B.; Pagoto, S.L.; Tinker, L.; Rosal, M.C.; Ockene, I.S.; Ockene, J.K.; et al. Association between dietary fiber and markers of systemic inflammation in the Women’s Health Initiative Observational Study. Nutrition 2008, 24, 941–949. [Google Scholar] [CrossRef] [Green Version]
- Halton, T.L.; Hu, F.B. The effects of high protein diets on thermogenesis, satiety and weight loss: A critical review. J. Am. Coll. Nutr. 2004, 23, 373–385. [Google Scholar] [CrossRef]
- Eisenstein, J.; Roberts, S.B.; Dallal, G.; Saltzman, E. High-protein weight-loss diets: Are they safe and do they work? A review of the experimental and epidemiologic data. Nutr. Rev. 2002, 60, 189–200. [Google Scholar] [CrossRef] [PubMed]
- Zemel, M.B.; Sun, X.; Sobhani, T.; Wilson, B. Effects of dairy compared with soy on oxidative and inflammatory stress in overweight and obese subjects. Am. J. Clin. Nutr. 2010, 91, 16–22. [Google Scholar] [CrossRef] [PubMed] [Green Version]
- Silveira, B.K.S.; Oliveira, T.M.S.; Andrade, P.A.; Hermsdorff, H.H.M.; Rosa, C.O.B.; Franceschini, S. Dietary pattern and macronutrients profile on the variation of inflammatory biomarkers: Scientific update. Cardiol. Res. Pr. 2018, 2018, 4762575. [Google Scholar] [CrossRef] [Green Version]
- Gonzalez, S.; Fernandez-Navarro, T.; Arboleya, S.; De Los Reyes-Gavilan, C.G.; Salazar, N.; Gueimonde, M. Fermented dairy foods: Impact on intestinal microbiota and health-linked biomarkers. Front. Microbiol. 2019, 10, 1046. [Google Scholar] [CrossRef] [PubMed]
- Bordoni, A.; Danesi, F.; Dardevet, D.; Dupont, D.; Fernandez, A.S.; Gille, D.; Nunes dos Santos, C.; Pinto, P.; Re, R.; Rémond, D.; et al. Dairy products and inflammation: A review of the clinical evidence. Crit. Rev. Food Sci. Nutr. 2017, 57, 2497–2525. [Google Scholar] [CrossRef] [PubMed]
- Lomax, A.R.; Calder, P.C. Probiotics, immune function, infection and inflammation: A review of the evidence from studies conducted in humans. Curr. Pharm. Des. 2009, 15, 1428–1518. [Google Scholar] [CrossRef] [PubMed]
- Ceapa, C.; Wopereis, H.; Rezaïki, L.; Kleerebezem, M.; Knol, J.; Oozeer, R. Influence of fermented milk products, prebiotics and probiotics on microbiota composition and health. Best Pr. Res. Clin. Gastroenterol. 2013, 27, 139–155. [Google Scholar] [CrossRef]
- Calder, P.C.; Ahluwalia, N.; Brouns, F.; Buetler, T.; Clement, K.; Cunningham, K.; Esposito, K.; Jönsson, L.S.; Kolb, H.; Lansink, M.; et al. Dietary factors and low-grade inflammation in relation to overweight and obesity. Br. J. Nutr. 2011, 106 (Suppl. 3), S5–S78. [Google Scholar] [CrossRef]
- Rocha, V.Z.; Libby, P. Obesity, inflammation, and atherosclerosis. Nat. Rev. Cardiol. 2009, 6, 399–409. [Google Scholar] [CrossRef]
- Forrester, J.S.; Libby, P. The inflammation hypothesis and its potential relevance to statin therapy. Am. J. Cardiol. 2007, 99, 732–738. [Google Scholar] [CrossRef]
- Trepanowski, J.F.; Mey, J.; Varady, K.A. Fetuin-A: A novel link between obesity and related complications. Int. J. Obes. 2015, 39, 734–741. [Google Scholar] [CrossRef] [PubMed]
- Fritsche, K.L. The science of fatty acids and inflammation. Adv. Nutr. 2015, 6, 293s–301s. [Google Scholar] [CrossRef] [PubMed]
- Calder, P.C.; Ahluwalia, N.; Albers, R.; Bosco, N.; Bourdet-Sicard, R.; Haller, D.; Holgate, S.T.; Jönsson, L.S.; Latulippe, M.E.; Marcos, A.; et al. A consideration of biomarkers to be used for evaluation of inflammation in human nutritional studies. Br. J. Nutr. 2013, 109 (Suppl. 1), S1–S34. [Google Scholar] [CrossRef] [Green Version]


| Characteristics | High Protein (n = 8) | Low Protein (n = 10) | p-Value |
|---|---|---|---|
| Demographics | |||
| Age (years) | 48.4 (44.9–55.7) | 48.7 (38.1–56.0) | 0.859 |
| Female-n (%) | 5 (62.5) | 6 (60.0) | 0.916 |
| Anthropometrics | |||
| Weight (kg) | 154.2 (121.4–160.4) | 126.8 (117.0–157.1) | 0.424 |
| Waist circumference (cm) | 135.0 (123.1–150.8) | 134.5 (124.3–145.0) | 0.756 |
| Waist-to-hip ratio | 0.9 (0.9–1.1) | 0.9 (0.9–1.1) | 0.688 |
| Body mass index (kg/m2) | 45.1 (42.3–47.9) | 43.5 (43.1–47.4) | 0.722 |
| Fat mass (%) | 55.4 (51.4–61.1) | 54.4 (50.8–56.2) | 0.643 |
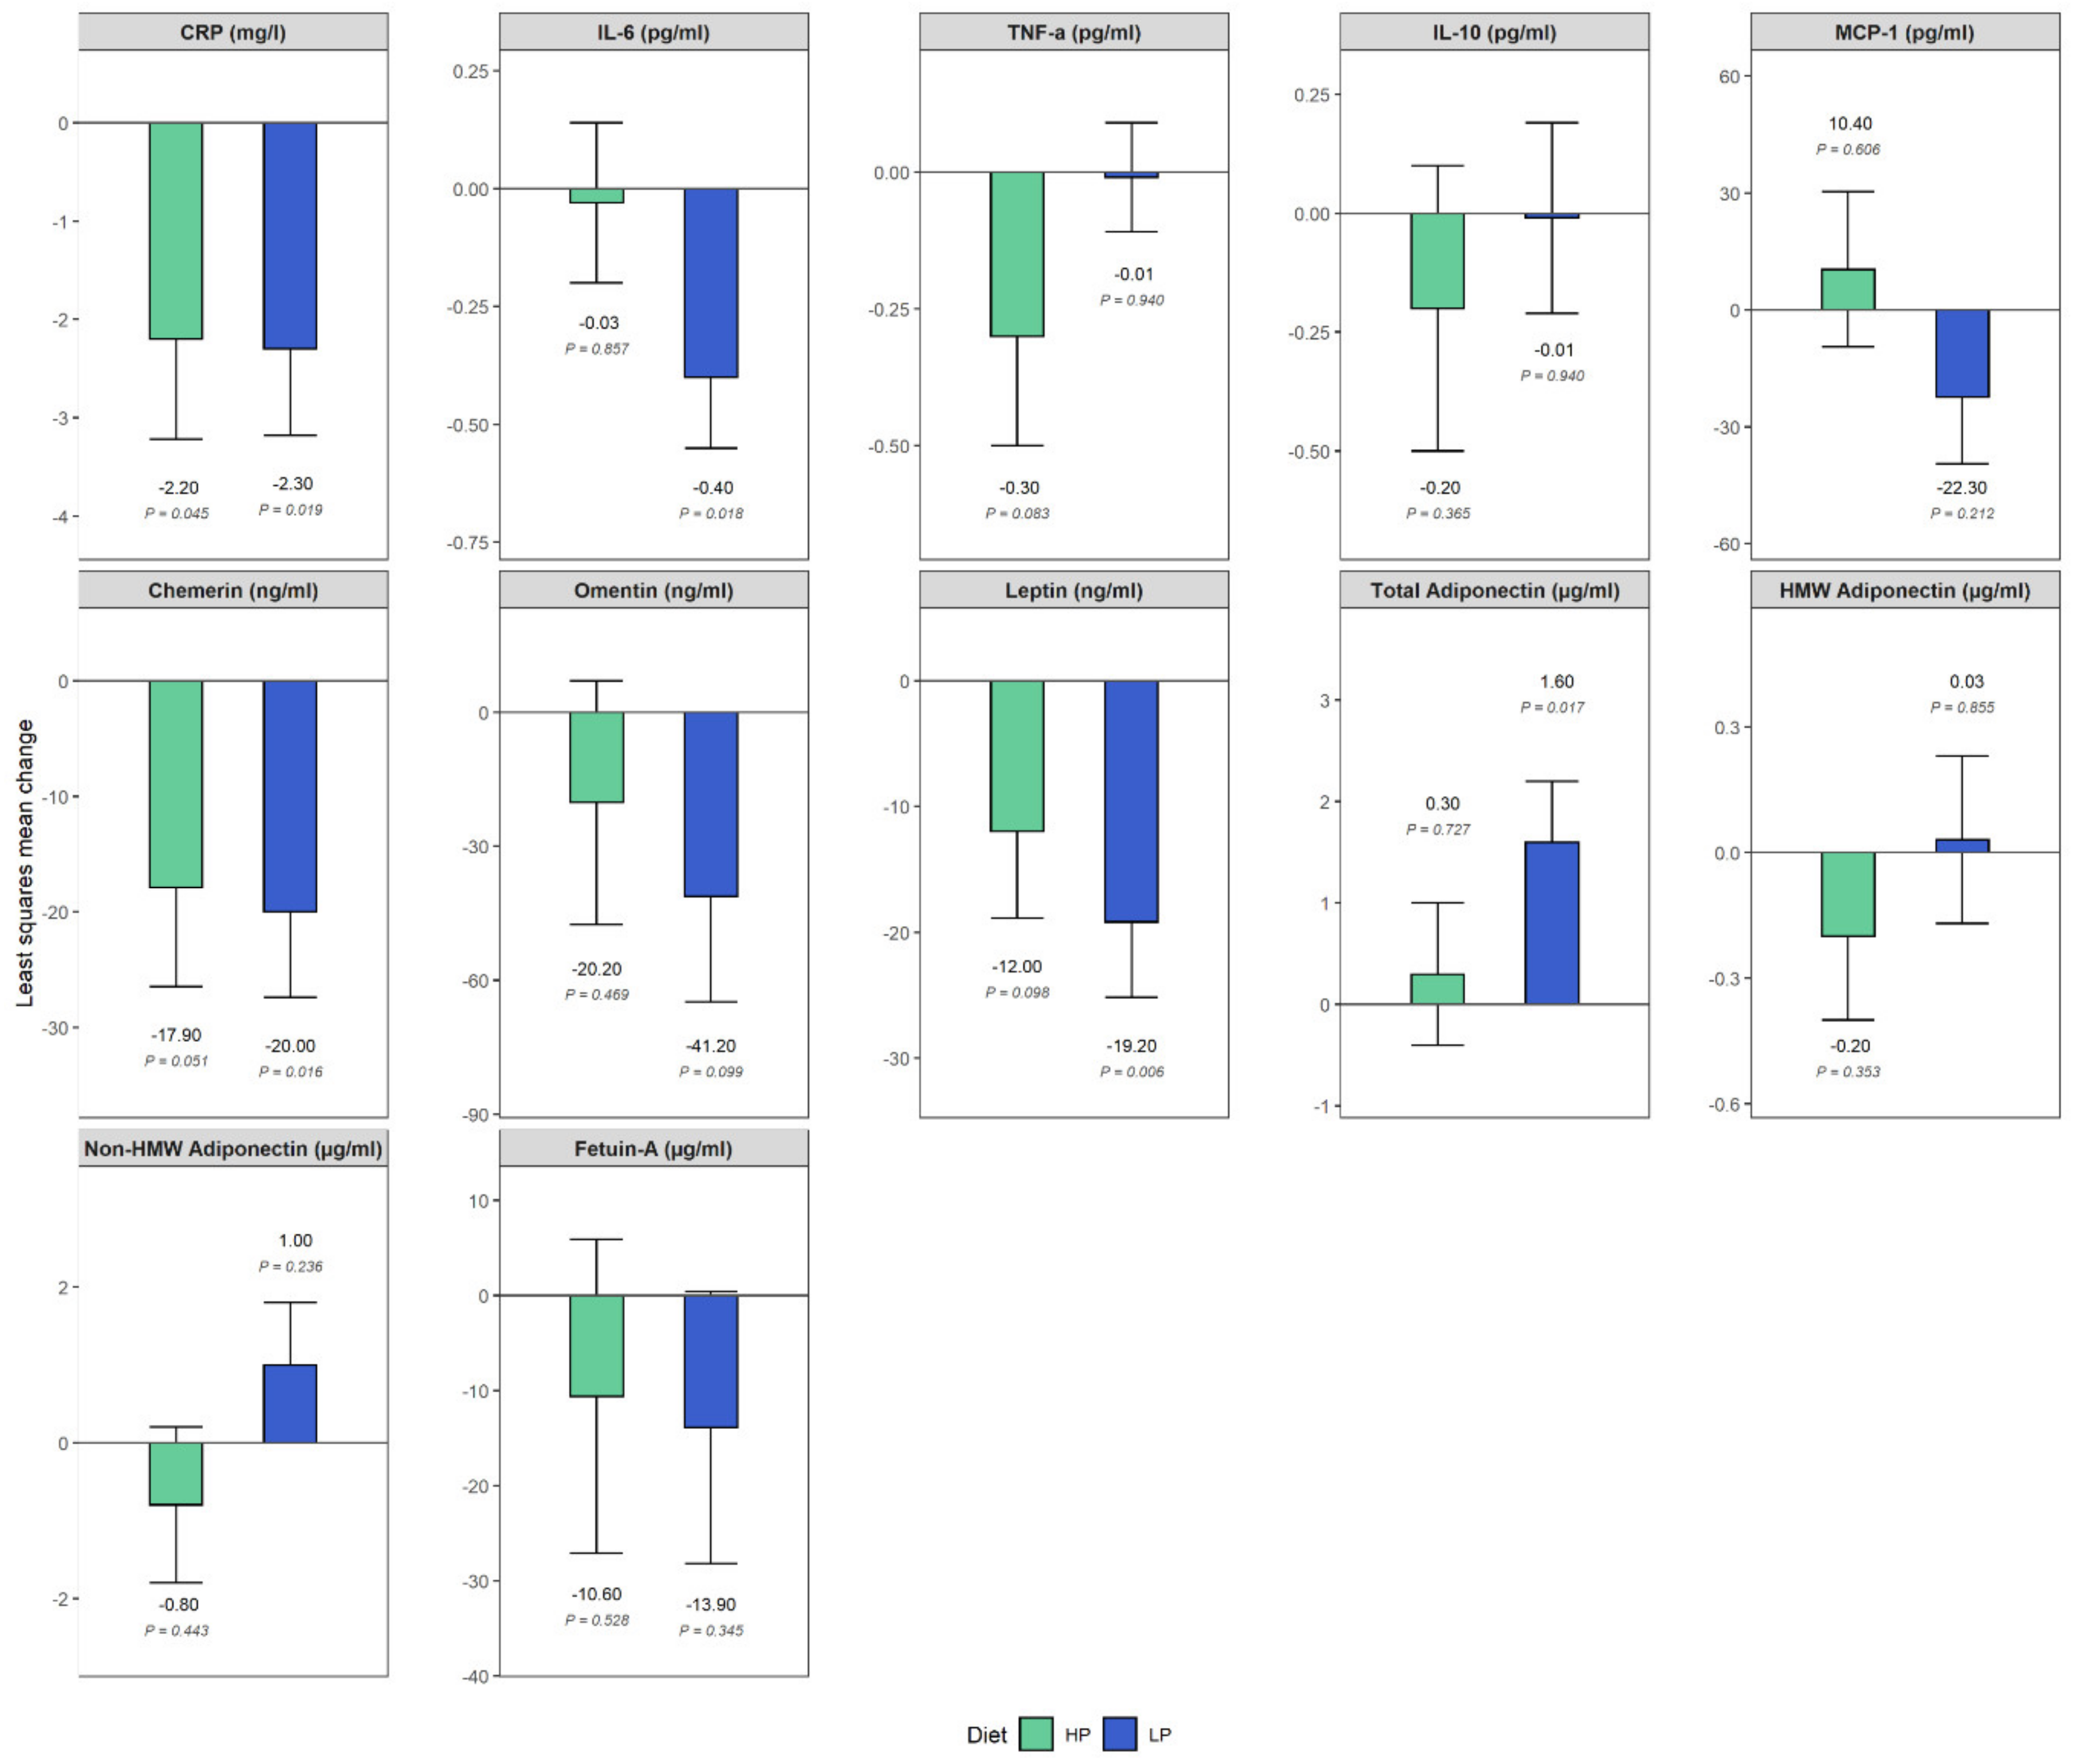
| Assessment Period | Time Effect ß (95% CI) 1 | Group-by-Time Interaction ß (95% CI) 1 | ||||
|---|---|---|---|---|---|---|
| Baseline | Week 3 | Ref: Baseline | Ref: LP*Baseline | |||
| Median (95% CI) | n | Median (95% CI) | n | |||
| CRP (mg/L) | ||||||
| HP | 10.0 (3.9–16.2) | 8 | 3.5 (2.5–11.8) | 7 | −2.3 (−4.1, −0.4) | 0.08 (−2.7–2.9) |
| LP | 10.5 (4.1–14.2) | 10 | 6.4 (2.7–11.4) | 10 | ||
| p value | 0.019 | 0.955 | ||||
| IL-6 (pg/mL) | ||||||
| HP | 1.7 (0.8–2.3) | 8 | 1.4 (0.9–2.1) | 7 | −0.4 (−0.7, −0.08) | 0.4 (−0.1–0.8) |
| LP | 2.3 (1.4–3.2) | 10 | 1.8 (1.1–2.8) | 10 | ||
| p value | 0.018 | 0.130 | ||||
| TNF-a (pg/mL) | ||||||
| HP | 2.5 (2.3–2.6) | 8 | 2.3 (1.8–2.7) | 7 | −0.0 (−0.3, 0.3) | −0.3 (−0.8–0.2) |
| LP | 3.1 (2.4–3.4) | 10 | 3.0 (2.6–3.1) | 10 | ||
| p value | 0.940 | 0.191 | ||||
| IL-10 (pg/mL) | ||||||
| HP | 0.2 (0.1–0.4) | 8 | 0.3 (0.2–0.4) | 7 | −0.0 (−0.5, 0.5) | −0.2 (−1.0–0.5) |
| LP | 0.4 (0.3–0.4) | 10 | 0.3 (0.2–0.5) | 10 | ||
| p value | 0.936 | 0.528 | ||||
| MCP-1 (pg/mL) | ||||||
| HP | 325.7 (265.0–347.5) | 8 | 355.4 (305.0–362.8) | 7 | −22.3 (−58.6, 14.0) | 32.8 (−22.0–87.5) |
| LP | 332.8 (239.0–409.2) | 10 | 322.9 (232.7–371.4) | 10 | ||
| p value | 0.212 | 0.223 | ||||
| Chemerin (ng/mL) | ||||||
| HP | 208.7 (178.5–219.7) | 8 | 177.9 (155.2–225.9) | 7 | −20.0 (−35.7, −4.3) | 2.1 (−21.6–25.8) |
| LP | 187.8 (147.0–221.4) | 10 | 163.0 (152.8–186.0) | 10 | ||
| p value | 0.016 | 0.854 | ||||
| Omentin (ng/mL) | ||||||
| HP | 346.0 (301.0–416.4) | 8 | 333.9 (296.9–405.5) | 7 | −41.2 (−91.1, 8.7) | 21.0 (−54.4–96.4) |
| LP | 384.5 (248.9–491.4) | 10 | 324.1 (221.6–491.3) | 10 | ||
| p value | 0.100 | 0.564 | ||||
| Leptin (ng/mL) | ||||||
| HP | 56.8 (43.1–77.9) | 8 | 50.3 (33.0–53.4) | 7 | −19.2 (−31.9, −6.4) | 7.2 (−12.0–26.4) |
| LP | 54.9 (41.8–76.0) | 10 | 36.4 (24.4–45.7) | 10 | ||
| p value | 0.006 | 0.440 | ||||
| Total adiponectin (µg/mL) | ||||||
| HP | 5.3 (4.4–7.1) | 8 | 6.4 (5.2–7.1) | 7 | 1.6 (0.3, 2.9) | −1.3 (−3.3–0.6) |
| LP | 4.4 (3.9–6.3) | 10 | 5.6 (4.4–8.9) | 10 | ||
| p value | 0.017 | 0.157 | ||||
| HMW 2 adiponectin (µg/mL) | ||||||
| HP | 1.3 (0.9–1.9) | 5 | 2.5 (1.6–2.7) | 5 | 0.0 (−0.3, 0.4) | −0.2 (−0.8–0.3) |
| LP | 0.7 (0.4–1.5) | 7 | 1.0 (0.8–2.0) | 9 | ||
| p value | 0.855 | 0.351 | ||||
| Non-HMW adiponectin (µg/mL) | ||||||
| HP | 4.7 (3.5–6.9) | 8 | 4.4 (2.3–6.4) | 7 | 1.0 (−0.7, 2.8) | −1.8 (−4.4–0.9) |
| LP | 4.3 (3.7–4.8) | 10 | 4.3 (3.5–8.1) | 10 | ||
| p value | 0.236 | 0.173 | ||||
| Fetuin-A (µg/mL) | ||||||
| HP | 254.5 (230.0–300.0) | 8 | 243.0 (194.0–302.0) | 7 | −13.9 (−44.0, 16.3) | 3.2 (−42.3–48.8) |
| LP | 253.0 (228.0–299.0) | 10 | 236.5 (207.0–250.0) | 10 | ||
| p value | 0.345 | 0.882 | ||||
Publisher’s Note: MDPI stays neutral with regard to jurisdictional claims in published maps and institutional affiliations. |
© 2020 by the authors. Licensee MDPI, Basel, Switzerland. This article is an open access article distributed under the terms and conditions of the Creative Commons Attribution (CC BY) license (http://creativecommons.org/licenses/by/4.0/).
Share and Cite
Koelman, L.; Markova, M.; Seebeck, N.; Hornemann, S.; Rosenthal, A.; Lange, V.; Pivovarova-Ramich, O.; Aleksandrova, K. Effects of High and Low Protein Diets on Inflammatory Profiles in People with Morbid Obesity: A 3-Week Intervention Study. Nutrients 2020, 12, 3636. https://doi.org/10.3390/nu12123636
Koelman L, Markova M, Seebeck N, Hornemann S, Rosenthal A, Lange V, Pivovarova-Ramich O, Aleksandrova K. Effects of High and Low Protein Diets on Inflammatory Profiles in People with Morbid Obesity: A 3-Week Intervention Study. Nutrients. 2020; 12(12):3636. https://doi.org/10.3390/nu12123636
Chicago/Turabian StyleKoelman, Liselot, Mariya Markova, Nicole Seebeck, Silke Hornemann, Anke Rosenthal, Volker Lange, Olga Pivovarova-Ramich, and Krasimira Aleksandrova. 2020. "Effects of High and Low Protein Diets on Inflammatory Profiles in People with Morbid Obesity: A 3-Week Intervention Study" Nutrients 12, no. 12: 3636. https://doi.org/10.3390/nu12123636