Trajectories of Body Composition during Advanced Aging in Consideration of Diet and Physical Activity: A 20-Year Longitudinal Study


Abstract
1. Introduction
2. Subjects and Methods
2.1. Study Design
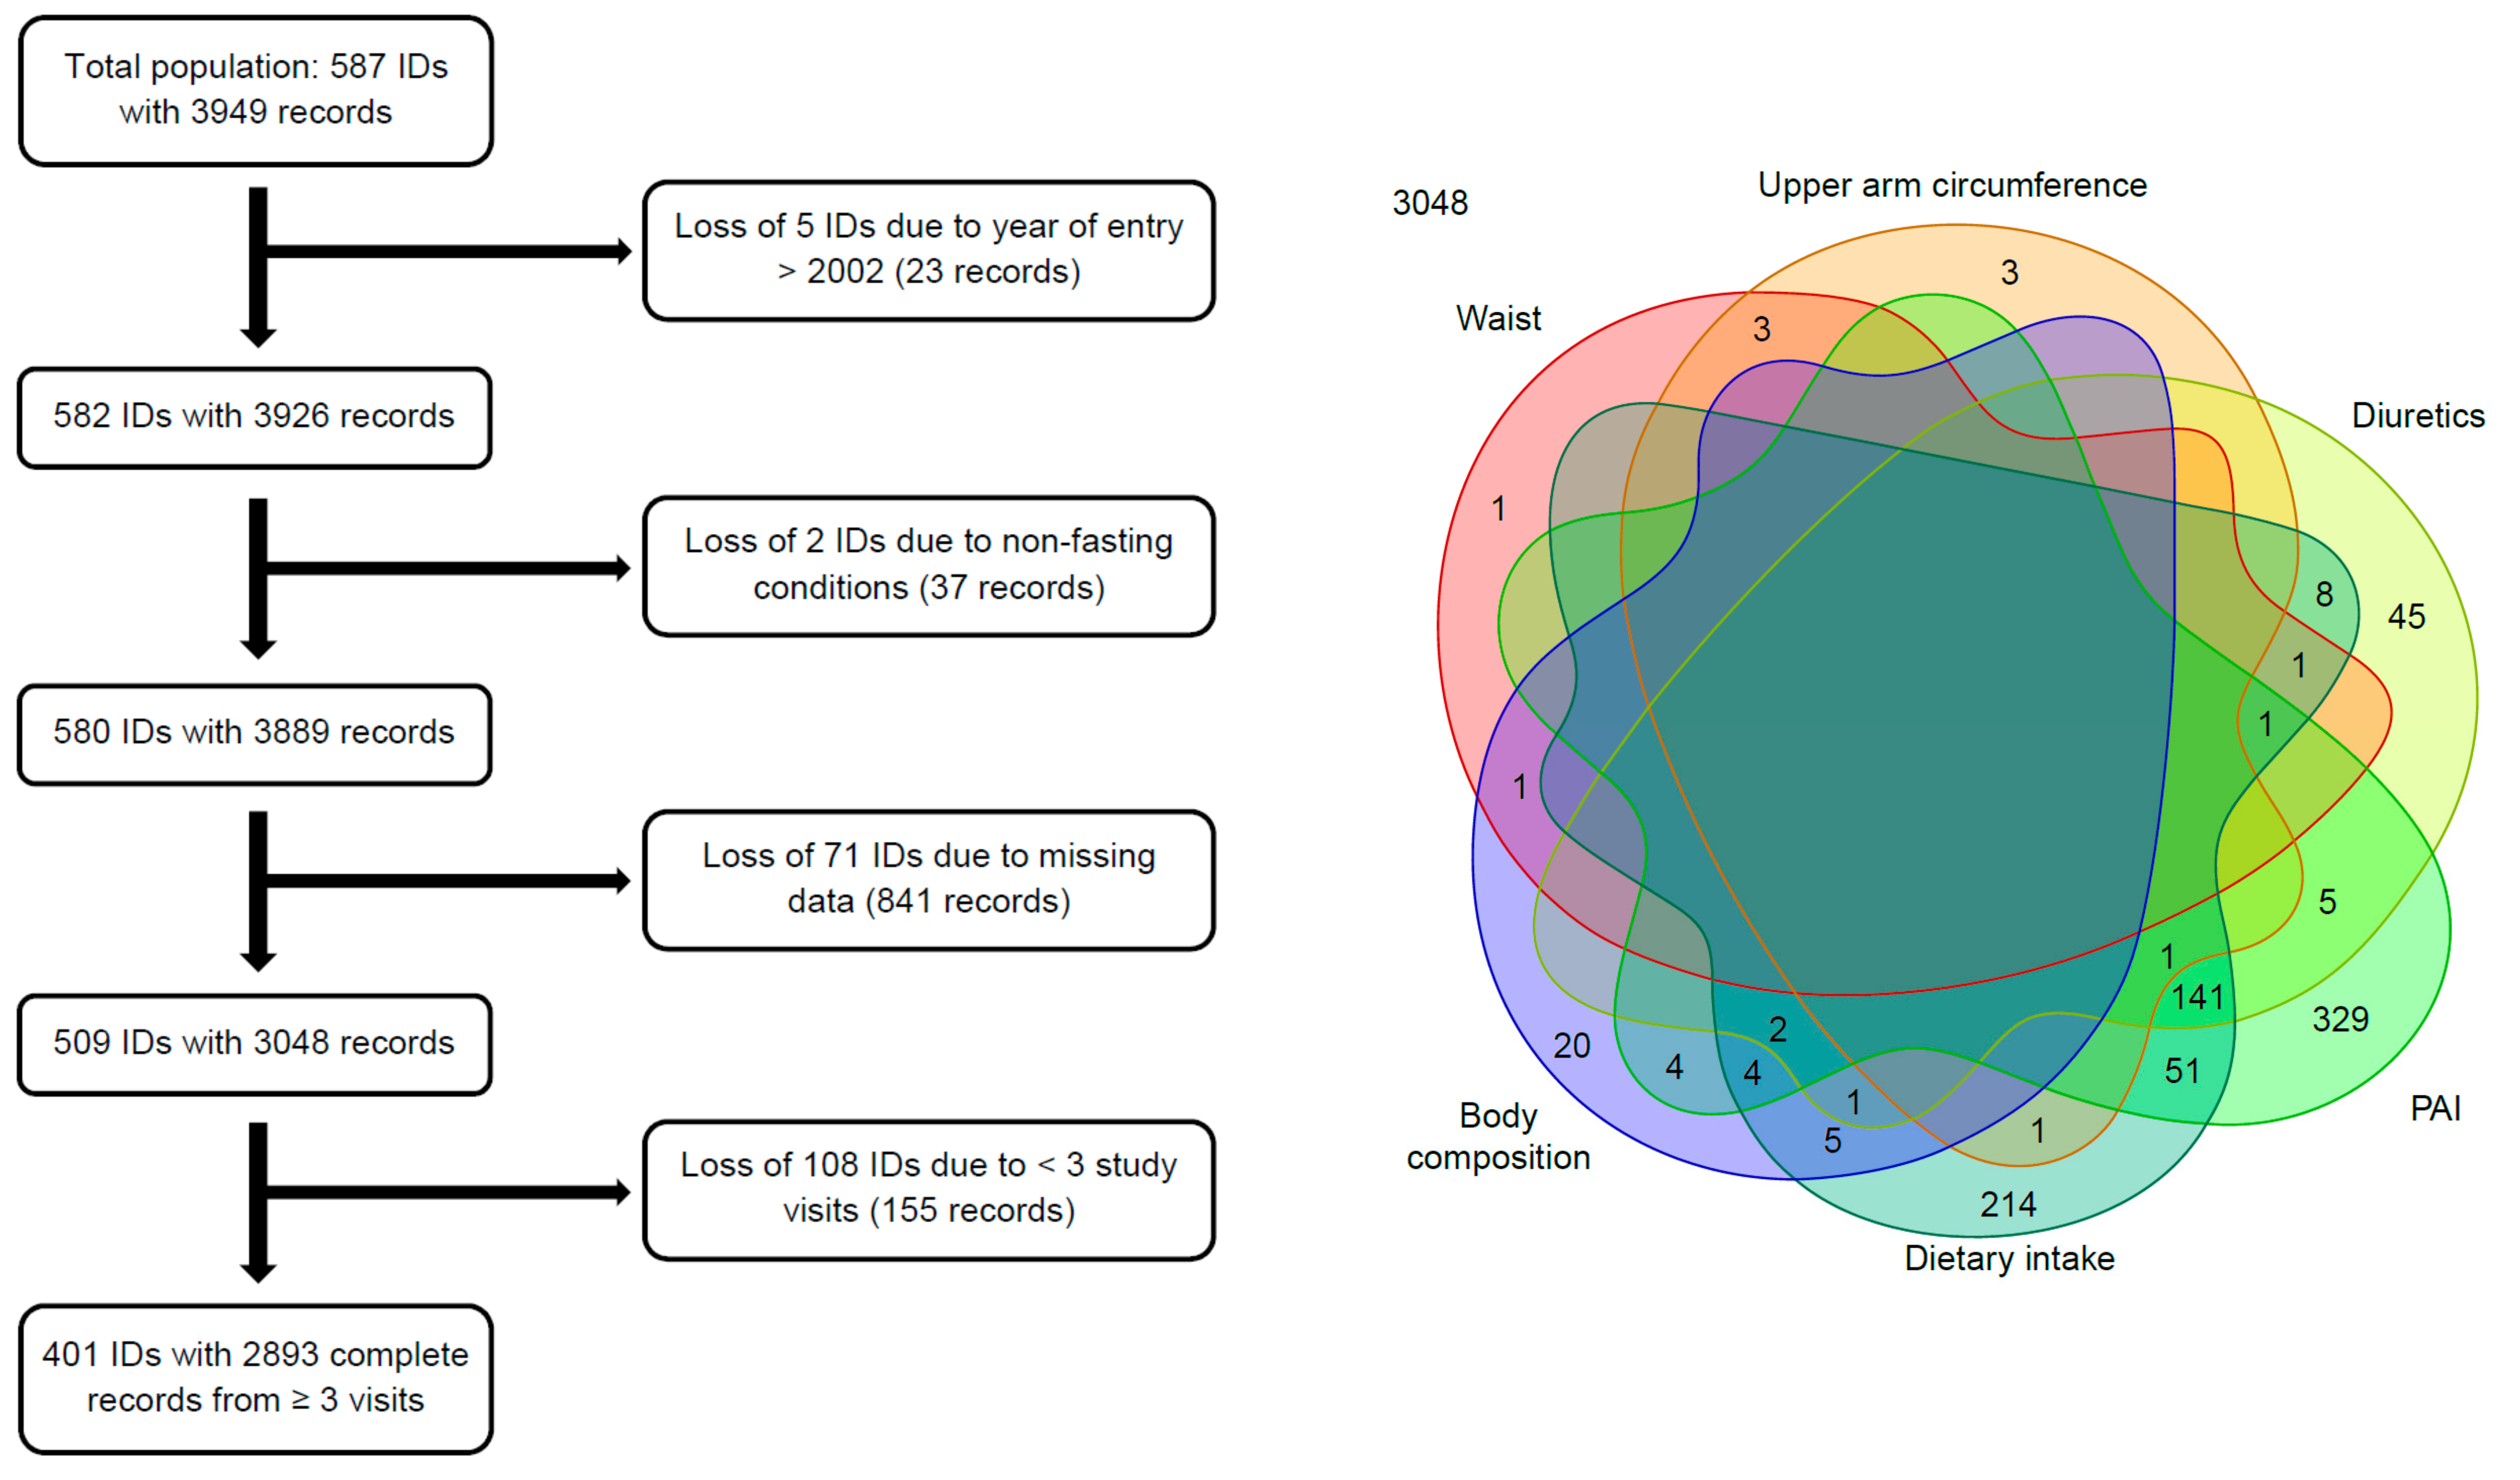
2.2. Study Subjects
2.3. Anthropometric Data
2.4. Body Composition
2.5. Physical Activity Index
2.6. Energy and Protein Intake
2.7. Use of Diuretics and Diagnosis of Selected Diseases
2.8. Statistical Analyses
- (1)
- Each initial model, which included only the age effects, was compared with its corresponding full model including all random and fixed effects using the Kenward-Roger method [46].
- (2)
- All model-fits and analyses were repeated without model-wise detected unduly influential observations (based on Cook distances, i.e., >1) and outliers (based on Bonferroni-adjusted P-values (<0.05) from testing each observation in turn to be a mean-shift outlier with respect to the Studentized residuals). For each model in turn the detected “outlying” observations were eliminated. This could result in a slight reduction of the sample size, if a subject was left with fewer than three complete data records.
- (3)
- Whether a history of selected diseases influenced age-related changes in anthropometric and body composition data was investigated by including two additional fixed effects: disease diagnosis (no vs. yes) and the interaction between disease diagnosis and linear age.
- (4)
- All full models were rebuilt with protein intake being replaced by total energy intake (centered around 9.1 megajoule (MJ) per day) to study, whether the inclusion of energy intake affects the results.
- (5)
- Finally, the analyses were repeated with the restriction to subjects with complete data records on at least seven visits (leaving 226 individuals with 2087 records) to investigate the robustness of the findings with respect to the number of follow-ups.
3. Results
3.1. Baseline Characteristics
3.2. Age-Related Changes in Lifestyle Factors
3.3. Age-Related Changes in Anthropometry and Body Composition before Adjusting for Cofactors
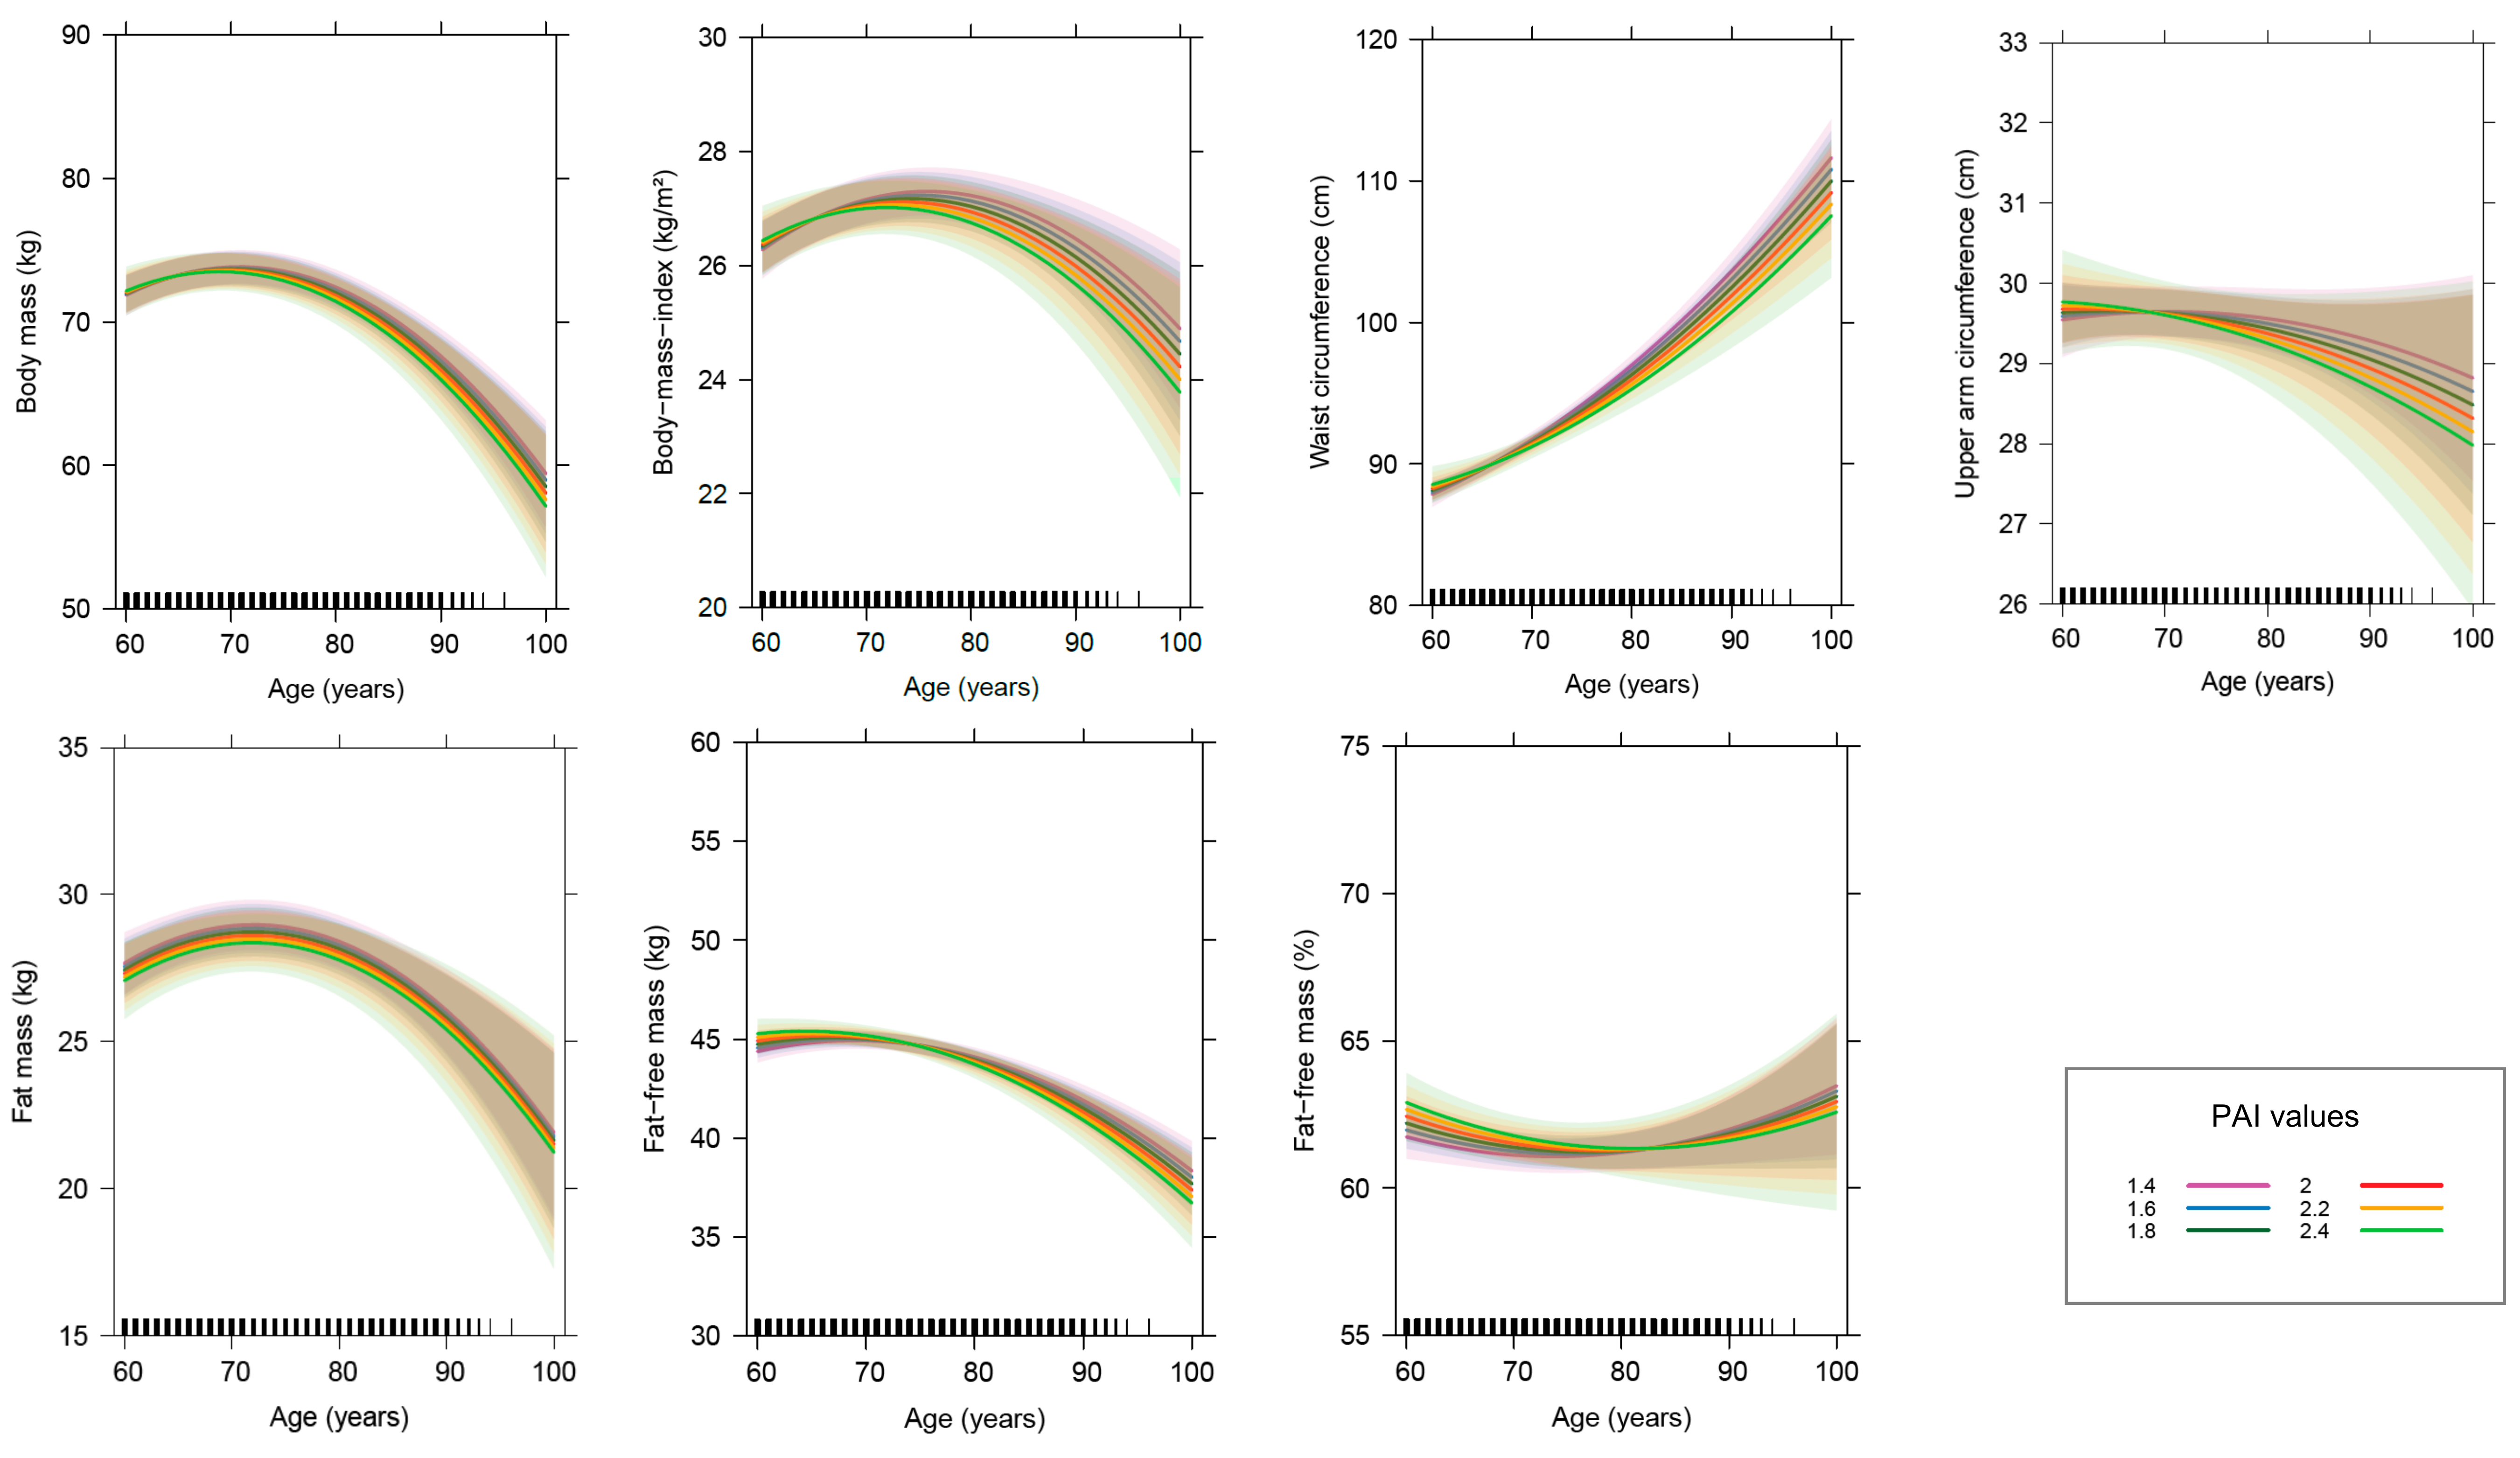
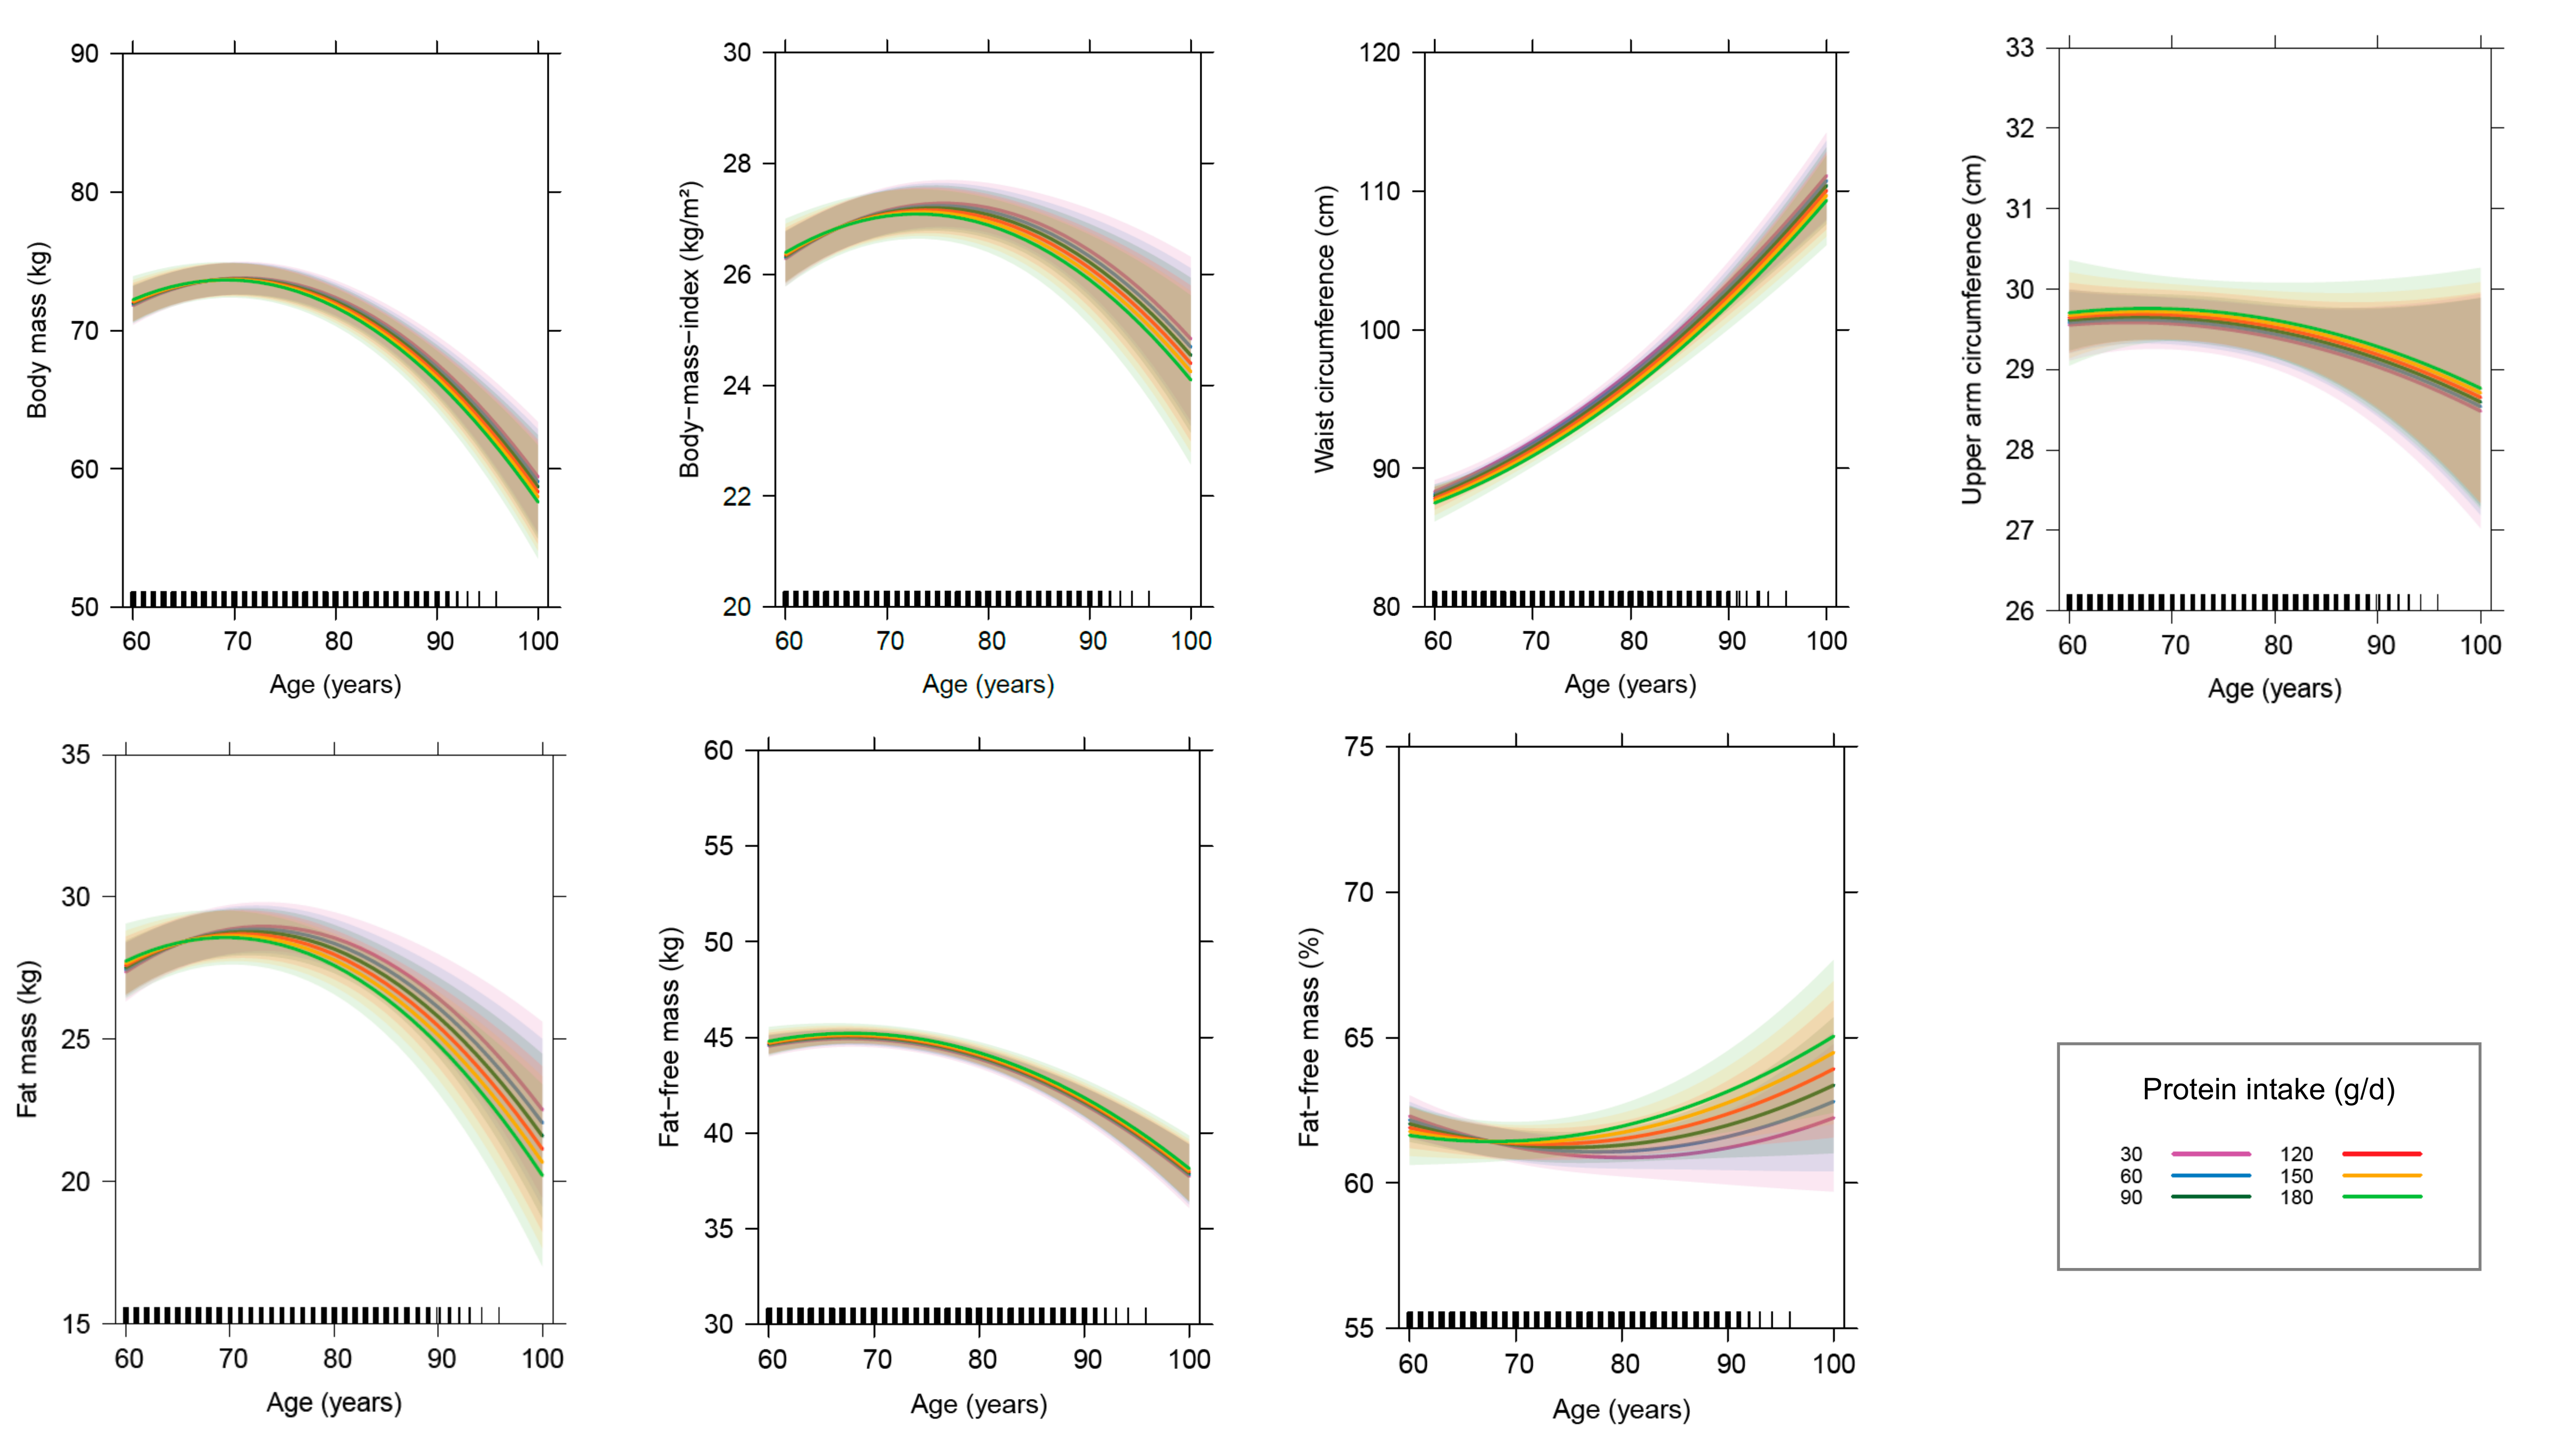
3.4. Age-Related Changes in Anthropometry and Body Composition by Considering Cofactors
3.5. Sensitivity Analyses
3.5.1. Relevance of Other Factors Besides Advancing Age
3.5.2. Analyses without Unduly Influential Observations and Outliers
3.5.3. Analyses with the History of Chronic Diseases as Additional Fixed Effect
3.5.4. Analyses with Different Dietary Factors as Fixed Effect
3.5.5. Analyses Restricted to Subjects with at Least Seven Complete Data Records
4. Discussion
5. Conclusions
Supplementary Materials
Author Contributions
Funding
Acknowledgments
Conflicts of Interest
Abbreviations
| 95% CI | 95% confidence interval |
| BIA | bioelectrical impedance analysis |
| BMI | body mass index |
| CE | coefficient estimate |
| FFM | fat-free mass |
| FM | fat mass |
| MJ | megajoule |
| GISELA | longitudinal study on nutrition and health status of senior citizens in Giessen |
| PAI | physical activity index |
References
- Charlier, R.; Knaeps, S.; Mertens, E.; van Roie, E.; Delecluse, C.; Lefevre, J.; Thomis, M. Age-related decline in muscle mass and muscle function in Flemish Caucasians: A 10-year follow-up. Age 2016, 38, 36. [Google Scholar] [CrossRef] [PubMed]
- Kennedy, B.K.; Berger, S.L.; Brunet, A.; Campisi, J.; Cuervo, A.M.; Epel, E.S.; Franceschi, C.; Lithgow, G.J.; Morimoto, R.I.; Pessin, J.E.; et al. Aging: A common driver of chronic diseases and a target for novel interventions. Cell 2014, 159, 709–713. [Google Scholar] [CrossRef] [PubMed]
- Shlisky, J.; Bloom, D.E.; Beaudreault, A.R.; Tucker, K.L.; Keller, H.H.; Freund-Levi, Y.; Fielding, R.A.; Cheng, F.W.; Jensen, G.L.; Wu, D.; et al. Nutritional Considerations for Healthy Aging and Reduction in Age-Related Chronic Disease. Adv. Nutr. 2017, 8, 17–26. [Google Scholar] [CrossRef] [PubMed]
- De Groot, C.P.; Enzi, G.; Matthys, C.; Moreiras, O.; Roszkowski, W.; Schroll, M. Ten-year changes in anthropometric characteristics of elderly Europeans. J. Nutr. Health Aging 2002, 6, 4–8. [Google Scholar]
- Dey, D.K.; Bosaeus, I.; Lissner, L.; Steen, B. Changes in body composition and its relation to muscle strength in 75-year-old men and women: A 5-year prospective follow-up study of the NORA cohort in Göteborg, Sweden. Nutrition 2009, 25, 613–619. [Google Scholar] [CrossRef] [PubMed]
- Dey, D.K.; Rothenberg, E.; Sundh, V.; Bosaeus, I.; Steen, B. Height and body weight in the elderly. I. A 25-year longitudinal study of a population aged 70 to 95 years. Eur. J. Clin. Nutr. 1999, 53, 905–914. [Google Scholar] [CrossRef]
- Genton, L.; Karsegard, V.L.; Chevalley, T.; Kossovsky, M.P.; Darmon, P.; Pichard, C. Body composition changes over 9 years in healthy elderly subjects and impact of physical activity. Clin. Nutr. 2011, 30, 436–442. [Google Scholar] [CrossRef]
- Guo, S.S.; Zeller, C.; Chumlea, W.C.; Siervogel, R.M. Aging, body composition, and lifestyle: The Fels Longitudinal Study. Am. J. Clin. Nutr. 1999, 70, 405–411. [Google Scholar] [CrossRef]
- Hughes, V.A.; Roubenoff, R.; Wood, M.; Frontera, W.R.; Evans, W.J.; Singh, M.A.F. Anthropometric assessment of 10-y changes in body composition in the elderly. Am. J. Clin. Nutr. 2004, 80, 475–482. [Google Scholar] [CrossRef]
- Jackson, A.S.; Janssen, I.; Sui, X.; Church, T.S.; Blair, S.N. Longitudinal changes in body composition associated with healthy ageing: Men, aged 20–96 years. Br. J. Nutr. 2012, 107, 1085–1091. [Google Scholar] [CrossRef]
- Kyle, U.G.; Melzer, K.; Kayser, B.; Picard-Kossovsky, M.; Gremion, G.; Pichard, C. Eight-year longitudinal changes in body composition in healthy Swiss adults. J. Am. Coll. Nutr. 2006, 25, 493–501. [Google Scholar] [CrossRef] [PubMed]
- Newman, A.B.; Lee, J.S.; Visser, M.; Goodpaster, B.H.; Kritchevsky, S.B.; Tylavsky, F.A.; Nevitt, M.; Harris, T.B. Weight change and the conservation of lean mass in old age: The Health, Aging and Body Composition Study. Am. J. Clin. Nutr. 2005, 82, 872–878. [Google Scholar] [CrossRef] [PubMed]
- Gallagher, D.; Ruts, E.; Visser, M.; Heshka, S.; Baumgartner, R.N.; Wang, J.; Pierson, R.N.; Pi-Sunyer, F.X.; Heymsfield, S.B. Weight stability masks sarcopenia in elderly men and women. Am. J. Physiol. Endocrinol. Metab. 2000, 279, E366–E375. [Google Scholar] [CrossRef] [PubMed]
- Goodpaster, B.H.; Park, S.W.; Harris, T.B.; Kritchevsky, S.B.; Nevitt, M.; Schwartz, A.V.; Simonsick, E.M.; Tylavsky, F.A.; Visser, M.; Newman, A.B.; et al. The Loss of Skeletal Muscle Strength, Mass, and Quality in Older Adults: The Health, Aging and Body Composition Study. J. Gerontol. A Biol. Sci. Med. Sci. 2006, 61, 1059–1064. [Google Scholar] [CrossRef]
- Xie, W.Q.; Xiao, G.; Fan, Y.B.; He, M.; Lv, S.T.; Li, Y. Sarcopenic obesity: Research advances in pathogenesis and diagnostic criteria. Aging Clin. Exp. Res. 2019, 1–6. [Google Scholar] [CrossRef]
- Batsis, J.A.; Villareal, D.T. Sarcopenic obesity in older adults: Aetiology, epidemiology and treatment strategies. Nat. Rev. Endocrinol. 2018, 14, 513–537. [Google Scholar] [CrossRef]
- Koster, A.; Visser, M.; Simonsick, E.M.; Yu, B.; Allison, D.B.; Newman, A.B.; van Eijk, J.T.M.; Schwartz, A.V.; Satterfield, S.; Harris, T.B. Association between fitness and changes in body composition and muscle strength. J. Am. Geriatr. Soc. 2010, 58, 219–226. [Google Scholar] [CrossRef]
- Campbell, W.W.; Haub, M.D.; Wolfe, R.R.; Ferrando, A.A.; Sullivan, D.H.; Apolzan, J.W.; Iglay, H.B. Resistance Training Preserves Fat-free Mass Without Impacting Changes in Protein Metabolism after Weight Loss in Older Women. Obesity 2009, 17, 1332–1339. [Google Scholar] [CrossRef]
- Coelho-Junior, H.J.; Teixeira, L.F.M.; Rodrigues, B.; Bacurau, R.; Marzetti, E.; Uchida, M. Relative Protein Intake and Physical Function in Older Adults: A Systematic Review and Meta-Analysis of Observational Studies. Nutrition 2018, 10, 1330. [Google Scholar] [CrossRef]
- Houston, D.K.; Nicklas, B.J.; Ding, J.; Harris, T.B.; Tylavsky, F.A.; Newman, A.B.; Lee, J.S.; Sahyoun, N.R.; Visser, M.; Kritchevsky, S.B.; et al. Dietary protein intake is associated with lean mass change in older, community-dwelling adults: The Health, Aging, and Body Composition (Health ABC) Study. Am. J. Clin. Nutr. 2008, 87, 150–155. [Google Scholar] [CrossRef]
- Gray-Donald, K.; Arnaud-McKenzie, D.S.; Gaudreau, P.; Morais, J.A.; Shatenstein, B.; Payette, H. Protein Intake Protects against Weight Loss in Healthy Community-Dwelling Older Adults. J. Nutr. 2014, 144, 321–326. [Google Scholar] [CrossRef] [PubMed][Green Version]
- Stookey, J.D.; Adair, L.S.; Popkin, B.M. Do protein and energy intakes explain long-term changes in body composition? J. Nutr. Health Aging 2005, 9, 5–17. [Google Scholar] [PubMed]
- Breen, L.; Phillips, S.M. Skeletal muscle protein metabolism in the elderly: Interventions to counteract the ’anabolic resistance’ of ageing. Nutr. Metab. 2011, 8, 68. [Google Scholar] [CrossRef] [PubMed]
- Bhasin, S.; Apovian, C.M.; Travison, T.G.; Pencina, K.; Moore, L.L.; Huang, G.; Campbell, W.W.; Li, Z.; Howland, A.S.; Chen, R.; et al. Effect of protein intake on lean body mass in functionally limited older men: A randomized clinical trial. JAMA Intern. Med. 2018, 178, 530–541. [Google Scholar] [CrossRef]
- Chan, R.; Leung, J.; Woo, J.; Kwok, T. Associations of dietary protein intake on subsequent decline in muscle mass and physical functions over four years in ambulant older Chinese people. J. Nutr. Health Aging 2014, 18, 171–177. [Google Scholar] [CrossRef]
- Raguso, C.A.; Kyle, U.; Kossovsky, M.P.; Roynette, C.; Paoloni-Giacobino, A.; Hans, D.; Genton, L.; Pichard, C. A 3-year longitudinal study on body composition changes in the elderly: Role of physical exercise. Clin. Nutr. 2006, 25, 573–580. [Google Scholar] [CrossRef]
- Verreijen, A.M.; Engberink, M.F.; Houston, D.K.; Brouwer, I.A.; Cawthon, P.M.; Newman, A.B.; Tylavsky, F.A.; Harris, T.B.; Weijs, P.J.M.; Visser, M. Dietary protein intake is not associated with 5-y change in mid-thigh muscle cross-sectional area by computed tomography in older adults: The Health, Aging, and Body Composition (Health ABC) Study. Am. J. Clin. Nutr. 2019, 109, 535–543. [Google Scholar] [CrossRef]
- Hofer, S.M.; Sliwinski, M.J. Understanding ageing. An evaluation of research designs for assessing the interdependence of ageing-related changes. Gerontology 2001, 47, 341–352. [Google Scholar] [CrossRef]
- Krems, C.; Lührmann, P.M.; Neuhäuser-Berthold, M. Physical activity in young and elderly subjects. J. Sports Med. Phys. Fit. 2004, 44, 71–76. [Google Scholar]
- Lührmann, P.M.; Bender, R.; Edelmann-Schäfer, B.; Neuhäuser-Berthold, M. Longitudinal changes in energy expenditure in an elderly German population: A 12-year follow-up. Eur. J. Clin. Nutr. 2009, 63, 986–992. [Google Scholar] [CrossRef]
- Lührmann, P.M.; Herbert, B.M.; Gaster, C.; Neuhäuser-Berthold, M. Validation of a self-administered 3-day estimated dietary record for use in the elderly. Eur. J. Nutr. 1999, 38, 235–240. [Google Scholar] [CrossRef] [PubMed]
- Roubenoff, R.; Baumgartner, R.N.; Harris, T.B.; Dallal, G.E.; Hannan, M.T.; Economos, C.D.; Stauber, P.M.; Wilson, P.W.; Kiel, D.P. Application of bioelectrical impedance analysis to elderly populations. J. Gerontol. Ser. A Biol. Sci. Med. Sci. 1997, 52, M129–M136. [Google Scholar] [CrossRef] [PubMed]
- World Health Organization (WHO). Energy and Protein Requirements. Report of a Joint FAO/WHO/UNU Expert Consultation; Technical Report Series 724; WHO: Geneva, Switzerland, 1985. [Google Scholar]
- Brooks, G.A.; Butte, N.F.; Rand, W.M.; Flatt, J.P.; Caballero, B. Chronicle of the Institute of Medicine physical activity recommendation: How a physical activity recommendation came to be among dietary recommendations. Am. J. Clin. Nutr. 2004, 79, 921S–930S. [Google Scholar] [CrossRef] [PubMed]
- Kyle, U.G.; Bosaeus, I.; de Lorenzo, A.D.; Deurenberg, P.; Elia, M.; Gómez, J.M.; Heitmann, B.L.; Kent-Smith, L.; Melchior, J.C.; Pirlich, M.; et al. Bioelectrical impedance analysis—Part II: Utilization in clinical practice. Clin. Nutr. 2004, 23, 1430–1453. [Google Scholar] [CrossRef] [PubMed]
- R Core Team. R: A Language and Environment for Statistical Computing; R Foundation for Statistical Computing: Vienna, Austria, 2019; Available online: https://www.R-project.org/ (accessed on 18 August 2019).
- Dusa, A. Venn: Draw Venn Diagrams. R Package Version 1.7. 2018. Available online: https://CRAN.R-project.org/package=venn (accessed on 17 May 2019).
- Gordon, M. Gmisc: Descriptive Statistics, Transition Plots, and More. R Package Version 1.9.0. 2019. Available online: https://CRAN.R-project.org/package=Gmisc (accessed on 11 November 2019).
- Deepayan, S. Lattice: Multivariate Data Visualization with R; Springer: New York, NY, USA, 2008; Available online: http://lmdvr.r-forge.r-project.org (accessed on 17 May 2019).
- Fox, J.; Weisberg, S. An R Companion to Applied Regression, 3rd ed.; SAGE Publications, Inc.: Thousand Oaks, CA, USA, 2019; Available online: http://tinyurl.com/carbook (accessed on 11 November 2019).
- Friedrich, S.; Konietschke, F.; Pauly, M. MANOVA.RM: Analysis of Multivariate Data and Repeated Measures Designs. R Package Version 0.3.4. 2019. Available online: https://CRAN.R-project.org/package=MANOVA.RM (accessed on 11 November 2019).
- Bates, D.; Mächler, M.; Bolker, B.; Walker, S. Fitting Linear Mixed-Effects Models Usinglme4. J. Stat. Softw. 2015, 67, 1–48. [Google Scholar] [CrossRef]
- Varadhan, R.; Borchers, H.W. Dfoptim: Derivative-Free Optimization. R Package Version 2018.2-1. 2018. Available online: https://CRAN.R-project.org/package=dfoptim (accessed on 18 August 2019).
- Nash, J.C.; Varadhan, R. Unifying Optimization Algorithms to Aid Software System Users: Optimx for R. J. Stat. Softw. 2011, 43, 1–14. [Google Scholar] [CrossRef]
- Gilbert, P.; Varadhan, R. Numderiv: Accurate Numerical Derivatives. R Package Version 2016.8-1.1. 2019. Available online: https://CRAN.R-project.org/package=numDeriv (accessed on 18 August 2019).
- Halekoh, U.; Højsgaard, S. A Kenward-Roger Approximation and Parametric Bootstrap Methods for Tests in Linear Mixed Models—The R Package pbkrtest. J. Stat. Softw. 2014, 59, 1–32. [Google Scholar] [CrossRef]
- Hothorn, T.; Bretz, F.; Westfall, P. Simultaneous Inference in General Parametric Models. Biom. J. 2008, 50, 346–363. [Google Scholar] [CrossRef]
- Woo, J.; Ho, S.C.; Sham, A. Longitudinal changes in body mass index and body composition over 3 years and relationship to health outcomes in Hong Kong Chinese age 70 and older. J. Am. Geriatr. Soc. 2001, 49, 737–746. [Google Scholar] [CrossRef]
- Hughes, V.A.; Frontera, W.R.; Roubenoff, R.; Evans, W.J.; Singh, M.A.F. Longitudinal changes in body composition in older men and women: Role of body weight change and physical activity. Am. J. Clin. Nutr. 2002, 76, 473–481. [Google Scholar] [CrossRef]
- Pulit, S.L.; Karaderi, T.; Lindgren, C.M. Sexual dimorphisms in genetic loci linked to body fat distribution. Biosci. Rep. 2017, 37. [Google Scholar] [CrossRef] [PubMed]
- Roghani, T.; Zavieh, M.K.; Manshadi, F.D.; King, N.; Katzman, W. Age-related hyperkyphosis: Update of its potential causes and clinical impacts—Narrative review. Aging Clin. Exp. Res. 2017, 29, 567–577. [Google Scholar] [CrossRef] [PubMed]
- Stephen, W.C.; Janssen, I. Influence of Physical Activity on Age-Related Weight Loss in the Elderly. J. Phys. Act. Health 2010, 7, 78–86. [Google Scholar] [CrossRef] [PubMed]
- Do Nascimento, M.A.; Gerage, A.M.; Januário, R.S.; Pina, F.L.; Gobbo, L.A.; Mayhew, J.L.; Cyrino, E.S. Resistance training with dietary intake maintenance increases strength without altering body composition in older women. J. Sports Med. Phys. Fit. 2018, 58, 457–464. [Google Scholar]
- Gray, M.; Powers, M.; Boyd, L.; Garver, K. Longitudinal comparison of low- and high-velocity resistance training in relation to body composition and functional fitness of older adults. Aging Clin. Exp. Res. 2018, 30, 1465–1473. [Google Scholar] [CrossRef] [PubMed]
- Bowman, K.; Atkins, J.L.; Delgado, J.; Kos, K.; Kuchel, G.A.; Ble, A.; Ferrucci, L.; Melzer, D. Central adiposity and the overweight risk paradox in aging: Follow-up of 130,473 UK Biobank participants. Am. J. Clin. Nutr. 2017, 106, 130–135. [Google Scholar] [CrossRef] [PubMed]
- Janssen, I.; Heymsfield, S.B.; Ross, R. Low Relative Skeletal Muscle Mass (Sarcopenia) in Older Persons Is Associated with Functional Impairment and Physical Disability. J. Am. Geriatr. Soc. 2002, 50, 889–896. [Google Scholar] [CrossRef]
- Tchernof, A.; Després, J.P. Pathophysiology of Human Visceral Obesity: An Update. Physiol. Rev. 2013, 93, 359–404. [Google Scholar] [CrossRef]
- Nagel, A.; Jungert, A.; Spinneker, A.; Neuhäuser-Berthold, M. The impact of multimorbidity on resting metabolic rate in community-dwelling women over a ten-year period: A cross-sectional and longitudinal study. J. Nutr. Health Aging 2017, 21, 781–786. [Google Scholar] [CrossRef]
- Cartee, G.D.; Hepple, R.T.; Bamman, M.M.; Zierath, J.R. Exercise Promotes Healthy Aging of Skeletal Muscle. Cell Metab. 2016, 23, 1034–1047. [Google Scholar] [CrossRef]
- Bartke, A. Growth hormone and aging. Rev. Endocr. Metab. Disord. 2020, 1–10. [Google Scholar] [CrossRef] [PubMed]
- He, Z.; Rankinen, T.; Leon, A.S.; Skinner, J.S.; Tchernof, A.; Bouchard, C. Plasma steroids, body composition, and fat distribution: Effects of age, sex, and exercise training. Int. J. Obes. 2018, 42, 1366–1377. [Google Scholar] [CrossRef] [PubMed]
- Nagel, A.; Spinneker, A.; Neuhäuser-Berthold, M. Association of Thyroid-Stimulating Hormone with Resting Energy Expenditure in Euthyroid Elderly Subjects: A Cross-Sectional Study. Ann. Nutr. Metab. 2016, 68, 12–18. [Google Scholar] [CrossRef] [PubMed]
- Salminen, A. Increased immunosuppression impairs tissue homeostasis with aging and age-related diseases. J. Mol. Med. 2020, 1–20. [Google Scholar] [CrossRef]


| Variable | Total (n = 401) | Women (n = 278) | Men (n = 123) | ||||||
|---|---|---|---|---|---|---|---|---|---|
| Median | P25 | P75 | Median | P25 | P75 | Median | P25 | P75 | |
| Age (years) | 66 | 62 | 70 | 67 | 62 | 71 | 66 | 63 | 70 |
| Body height (cm) | 164 | 159 | 171 | 162 | 158 | 165 | 174 | 170 | 178 |
| Body mass (kg) | 72 | 64 | 80 | 68 | 62 | 77 | 79 | 73 | 87 |
| Body mass index (kg/m2) | 26 | 24 | 29 | 26 | 24 | 29 | 26 | 24 | 28 |
| Waist circumference (cm) | 90 | 83 | 97 | 87 | 81 | 94 | 96 | 91 | 103 |
| Upper arm circumference (cm) | 30 | 28 | 31 | 29 | 28 | 31 | 30 | 28 | 31 |
| Fat mass (kg) | 27 | 23 | 33 | 28 | 24 | 35 | 23 | 19 | 29 |
| Fat-free mass (kg) | 42 | 38 | 52 | 39 | 38 | 42 | 54 | 53 | 58 |
| Fat-free mass (%) | 61 | 56 | 67 | 58 | 54 | 62 | 70 | 67 | 73 |
| Physical activity index | 1.7 | 1.6 | 1.8 | 1.7 | 1.6 | 1.8 | 1.7 | 1.6 | 1.8 |
| Energy intake (MJ/day) | 8.5 | 7.1 | 10 | 8.1 | 6.8 | 9.6 | 9.9 | 8.0 | 12 |
| Protein intake (g/day) | 81 | 65 | 96 | 75 | 62 | 92 | 86 | 74 | 103 |
| n | % | n | % | n | % | ||||
| Female sex | 278 | 69 | |||||||
| Use of diuretics | 42 | 11 | 32 | 12 | 10 | 8.1 | |||
| Year of entry after 1996 | 126 | 31 | 95 | 34 | 31 | 25 | |||
| Disease diagnosis 1 | 334 | 83 | 244 | 88 | 90 | 73 | |||
| Age | Age2 | |||
|---|---|---|---|---|
| CE | (95% CI) | CE | (95% CI) | |
| Body mass (kg) | −0.59 | (−1.06, −0.13) | −1.64 | (−2.09, −1.19) |
| Body mass index (kg/m2) | 0.23 | (0.06, 0.40) | −0.39 | (−0.56, −0.23) |
| Upper arm circumference (cm) | −0.07 | (−0.23, 0.08) | −0.09 | (−0.24, 0.07) |
| Waist circumference (cm) | 4.23 | (3.75, 4.71) | −0.32 | (−0.86, 0.21) |
| Fat mass (kg) | 0.05 | (−0.30, 0.39) | −0.92 | (−1.28, −0.57) |
| Fat-free mass (kg) | −0.62 | (−0.80, −0.44) | −0.64 | (−0.82, −0.46) |
| Fat-free mass (%) | −0.40 | (−0.65, −0.14) | 0.42 | (0.14, 0.70) |
| Predictor | Body Mass (kg) | Body Mass Index (kg/m2) | Upper Arm Circumference (cm) | Waist Circumference (cm) | ||||
|---|---|---|---|---|---|---|---|---|
| CE | (95% CI) | CE | (95% CI) | CE | (95% CI) | CE | (95% CI) | |
| Intercept | 7.1 × 10+1 *** | (6.9 × 10+1, 7.3 × 10+1) | 2.7 × 10+1 *** | (2.7 × 10+1, 2.8 × 10+1) | 3.0 × 10+1 *** | (2.9 × 10+1, 3.0 × 10+1) | 8.9 × 10+1 *** | (8.9 × 10+1, 9.0 × 10+1) |
| Age (years) | −4.8 × 10⁻² | (−1.3 × 10⁻¹, 3.9 × 10⁻²) | 3.2 × 10⁻² * | (5.7 × 10⁻⁴, 6.4 × 10⁻²) | 7.3 × 10⁻³ | (−2.2 × 10⁻², 3.7 × 10⁻²) | 5.0 × 10⁻¹ *** | (4.4 × 10⁻¹, 5.6 × 10⁻¹) |
| Age (years)2 | −1.7 × 10⁻¹ *** | (−2.5 × 10⁻¹, −8.6 × 10⁻²) | −4.3 × 10⁻² *** | (−7.3 × 10⁻², −1.3 × 10⁻²) | −1.3 × 10⁻² | (−4.1 × 10⁻², 1.4 × 10⁻²) | 9.9 × 10⁻² *** | (4.0 × 10⁻², 1.6 × 10⁻¹) |
| Male sex | 9.9 × 10+0 *** | (6.2 × 10+0, 1.4 × 10+1) | −4.2 × 10⁻¹ | (−1.7 × 10+0, 8.9 × 10⁻¹) | 9.2 × 10⁻² | (−8.6 × 10⁻¹, 1.0 × 10+0) | 2.1 × 10+0 ** | (3.6 × 10⁻¹, 3.8 × 10+0) |
| PAI | −2.1 × 10⁻¹ | (−1.7 × 10+0, 1.3 × 10+0) | −1.0 × 10⁻¹ | (−6.5 × 10⁻¹, 4.4 × 10⁻¹) | 7.7 × 10⁻² | (−6.7 × 10⁻¹, 8.3 × 10⁻¹) | −2.6 × 10⁻¹ | (−1.9 × 10+0, 1.4 × 10+0) |
| Protein intake (g/day) | −2.2 × 10⁻³ | (−1.1 × 10⁻², 7.1 × 10⁻³) | −1.3 × 10⁻³ | (−4.7 × 10⁻³, 2.2 × 10⁻³) | 1.9 × 10⁻³ | (−2.9 × 10⁻³, 6.6 × 10⁻³) | −8.3 × 10⁻³ | (−1.9 × 10⁻², 2.0 × 10⁻³) |
| Year of entry (year) | 8.5 × 10⁻¹ ** | (1.9 × 10⁻¹, 1.5 × 10+0) | 2.3 × 10⁻¹ ‡ | (−4.9 × 10⁻³, 4.7 × 10⁻¹) | 1.8 × 10⁻¹ * | (1.2 × 10⁻², 3.6 × 10⁻¹) | 1.3 × 10⁻¹ | (−1.7 × 10⁻¹, 4.2 × 10⁻¹) |
| Use of diuretics | −5.5 × 10⁻² | (−6.1 × 10⁻¹, 5.0 × 10⁻¹) | 3.1 × 10⁻² | (−1.7 × 10⁻¹, 2.4 × 10⁻¹) | 1.2 × 10⁻¹ | (−1.5 × 10⁻¹, 3.9 × 10⁻¹) | 3.1 × 10⁻¹ | (−2.7 × 10⁻¹, 9.0 × 10⁻¹) |
| I (PAI:age) | −6.4 × 10⁻² | (−2.5 × 10⁻¹, 1.2 × 10⁻¹) | −3.2 × 10⁻² | (−1.0 × 10⁻¹, 3.7 × 10⁻²) | −2.7 × 10⁻² | (−1.2 × 10⁻¹, 6.4 × 10⁻²) | −1.2 × 10⁻¹ | (−3.1 × 10⁻¹, 7.5 × 10⁻²) |
| I (protein intake:age) | −3.7 × 10⁻⁴ | (−1.4 × 10⁻³, 6.8 × 10⁻⁴) | −1.4 × 10⁻⁴ | (−5.3 × 10⁻⁴, 2.5 × 10⁻⁴) | 2.2 × 10⁻⁵ | (−4.9 × 10⁻⁴, 5.3 × 10⁻⁴) | −1.6 × 10⁻⁴ | (−1.3 × 10⁻³, 9.5 × 10⁻⁴) |
| I (year of entry:age) | −1.9 × 10⁻² | (−4.7 × 10⁻², 9.5 × 10⁻³) | −3.8 × 10⁻³ | (−1.4 × 10⁻², 6.4 × 10⁻³) | 7.4 × 10⁻³ | (−2.1 × 10⁻³, 1.7 × 10⁻²) | 3.0 × 10⁻² *** | (1.1 × 10⁻², 5.0 × 10⁻²) |
| I (male sex:age) | −4.2 × 10⁻³ | (−1.5 × 10⁻¹, 1.4 × 10⁻¹) | −1.6 × 10⁻² | (−7.0 × 10⁻², 3.8 × 10⁻²) | −4.6 × 10⁻² ‡ | (−9.5 × 10⁻², 2.7 × 10⁻³) | −9.8 × 10⁻² * | (−2.0 × 10⁻¹, −8.0 × 10⁻⁴) |
| I (male sex:age2) | −9.5 × 10⁻³ | (−1.5 × 10⁻¹, 1.3 × 10⁻¹) | 5.8 × 10⁻³ | (−4.7 × 10⁻², 5.9 × 10⁻²) | 1.2 × 10⁻² | (−3.7 × 10⁻², 6.0 × 10⁻²) | −9.5 × 10⁻² | (−2.0 × 10⁻¹, 8.6 × 10⁻³) |
| I (male sex:PAI) | −8.4 × 10⁻¹ | (−3.7 × 10+0, 2.0 × 10+0) | −3.7 × 10⁻¹ | (−1.4 × 10+0, 6.7 × 10⁻¹) | −5.4 × 10⁻¹ | (−2.0 × 10+0, 8.7 × 10⁻¹) | −1.5 × 10+0 | (−4.6 × 10+0, 1.5 × 10+0) |
| I (male sex:protein intake) | 1.6 × 10⁻³ | (−1.3 × 10⁻², 1.6 × 10⁻²) | 9.6 × 10⁻⁴ | (−4.5 × 10⁻³, 6.5 × 10⁻³) | −1.8 × 10⁻³ | (−9.3 × 10⁻³, 5.7 × 10⁻³) | 2.8 × 10⁻³ | (−1.4 × 10⁻², 1.9 × 10⁻²) |
| Body mass (kg) | 7.9 × 10⁻¹ *** | (7.5 × 10⁻¹, 8.4 × 10⁻¹) | ||||||
| Predictor | Fat Mass (kg) | Fat-Free Mass (kg) | Fat-Free Mass (%) | |||
|---|---|---|---|---|---|---|
| CE | (95% CI) | CE | (95% CI) | CE | (95% CI) | |
| Intercept | 3.1 × 10+1 *** | (2.9 × 10+1, 3.2 × 10+1) | 4.0 × 10+1 *** | (3.9 × 10+1, 4.1 × 10+1) | 5.7 × 10+1 *** | (5.6 × 10+1, 5.8 × 10+1) |
| Age (years) | 7.9 × 10⁻³ | (−5.7 × 10⁻², 7.3 × 10⁻²) | −5.8 × 10⁻² *** | (−9.2 × 10⁻², −2.3 × 10⁻²) | −3.9 × 10⁻² | (−8.8 × 10⁻², 9.5 × 10⁻³) |
| Age (years)2 | −1.0 × 10⁻¹ *** | (−1.6 × 10⁻¹, −3.7 × 10⁻²) | −5.4 × 10⁻² *** | (−8.6 × 10⁻², −2.2 × 10⁻²) | 4.1 × 10⁻² | (−8.6 × 10⁻³, 9.1 × 10⁻²) |
| Male sex | −5.7 × 10+0 *** | (−8.4 × 10+0, −3.1 × 10+0) | 1.6 × 10+1 *** | (1.4 × 10+1, 1.7 × 10+1) | 1.2 × 10+1 *** | (1.1 × 10+1, 1.4 × 10+1) |
| PAI | −3.1 × 10⁻¹ | (−1.6 × 10+0, 9.4 × 10⁻¹) | 4.9 × 10⁻² | (−7.3 × 10⁻¹, 8.3 × 10⁻¹) | 2.0 × 10⁻¹ | (−9.1 × 10⁻¹, 1.3 × 10+0) |
| Protein intake (g/day) | −3.0 × 10⁻³ | (−1.1 × 10⁻², 4.9 × 10⁻³) | 1.6 × 10⁻³ | (−3.4 × 10⁻³, 6.5 × 10⁻³) | 2.0 × 10⁻³ | (−5.0 × 10⁻³, 9.0 × 10⁻³) |
| Year of entry (year) | 5.5 × 10⁻¹ * | (7.7 × 10⁻², 1.0 × 10+0) | 2.5 × 10⁻¹ * | (2.0 × 10⁻², 4.9 × 10⁻¹) | −2.3 × 10⁻¹ | (−5.3 × 10⁻¹, 7.7 × 10⁻²) |
| Use of diuretics | 2.0 × 10⁻¹ | (−2.7 × 10⁻¹, 6.6 × 10⁻¹) | −2.1 × 10⁻¹ | (−4.9 × 10⁻¹, 7.9 × 10⁻²) | −3.8 × 10⁻¹ ‡ | (−7.9 × 10⁻¹, 2.9 × 10⁻²) |
| I (PAI:age) | −1.9 × 10⁻³ | (−1.6 × 10⁻¹, 1.6 × 10⁻¹) | −6.3 × 10⁻² | (−1.6 × 10⁻¹, 3.3 × 10⁻²) | −5.1 × 10⁻² | (−1.9 × 10⁻¹, 8.5 × 10⁻²) |
| I (protein intake:age) | −4.5 × 10⁻⁴ | (−1.3 × 10⁻³, 4.4 × 10⁻⁴) | 2.4 × 10⁻⁵ | (−5.2 × 10⁻⁴, 5.7 × 10⁻⁴) | 5.8 × 10⁻⁴ | (−2.1 × 10⁻⁴, 1.4 × 10⁻³) |
| I (year of entry:age) | −4.5 × 10⁻³ | (−2.6 × 10⁻², 1.6 × 10⁻²) | −1.2 × 10⁻² * | (−2.3 × 10⁻², −1.0 × 10⁻³) | −5.5 × 10⁻³ | (−2.1 × 10⁻², 1.0 × 10⁻²) |
| I (male sex:age) | 2.2 × 10⁻³ | (−1.1 × 10⁻¹, 1.1 × 10⁻¹) | 2.1 × 10⁻³ | (−5.6 × 10⁻², 6.0 × 10⁻²) | 1.1 × 10⁻² | (−7.0 × 10⁻², 9.3 × 10⁻²) |
| I (male sex:age2) | 3.2 × 10⁻² | (−8.1 × 10⁻², 1.4 × 10⁻¹) | −4.5 × 10⁻² | (−1.0 × 10⁻¹, 1.0 × 10⁻²) | −1.9 × 10⁻² | (−1.1 × 10⁻¹, 6.8 × 10⁻²) |
| I (male sex:PAI) | −9.3 × 10⁻¹ | (−3.3 × 10+0, 1.5 × 10+0) | 2.8 × 10⁻¹ | (−1.2 × 10+0, 1.8 × 10+0) | 1.1 × 10+0 | (−1.0 × 10+0, 3.2 × 10+0) |
| I (male sex:protein intake) | 5.3 × 10⁻⁴ | (−1.2 × 10⁻², 1.3 × 10⁻²) | 1.2 × 10⁻³ | (−6.6 × 10⁻³, 9.0 × 10⁻³) | 1.7 × 10⁻³ | (−9.5 × 10⁻³, 1.3 × 10⁻²) |
Publisher’s Note: MDPI stays neutral with regard to jurisdictional claims in published maps and institutional affiliations. |
© 2020 by the authors. Licensee MDPI, Basel, Switzerland. This article is an open access article distributed under the terms and conditions of the Creative Commons Attribution (CC BY) license (http://creativecommons.org/licenses/by/4.0/).
Share and Cite
Jungert, A.; Eichner, G.; Neuhäuser-Berthold, M. Trajectories of Body Composition during Advanced Aging in Consideration of Diet and Physical Activity: A 20-Year Longitudinal Study. Nutrients 2020, 12, 3626. https://doi.org/10.3390/nu12123626
Jungert A, Eichner G, Neuhäuser-Berthold M. Trajectories of Body Composition during Advanced Aging in Consideration of Diet and Physical Activity: A 20-Year Longitudinal Study. Nutrients. 2020; 12(12):3626. https://doi.org/10.3390/nu12123626
Chicago/Turabian StyleJungert, Alexandra, Gerrit Eichner, and Monika Neuhäuser-Berthold. 2020. "Trajectories of Body Composition during Advanced Aging in Consideration of Diet and Physical Activity: A 20-Year Longitudinal Study" Nutrients 12, no. 12: 3626. https://doi.org/10.3390/nu12123626
APA StyleJungert, A., Eichner, G., & Neuhäuser-Berthold, M. (2020). Trajectories of Body Composition during Advanced Aging in Consideration of Diet and Physical Activity: A 20-Year Longitudinal Study. Nutrients, 12(12), 3626. https://doi.org/10.3390/nu12123626