Stunting and Anemia in Children from Urban Poor Environments in 28 Low and Middle-income Countries: A Meta-analysis of Demographic and Health Survey Data


Abstract
1. Introduction
2. Data and Methods
2.1. Data
2.2. Variables
2.3. Methods
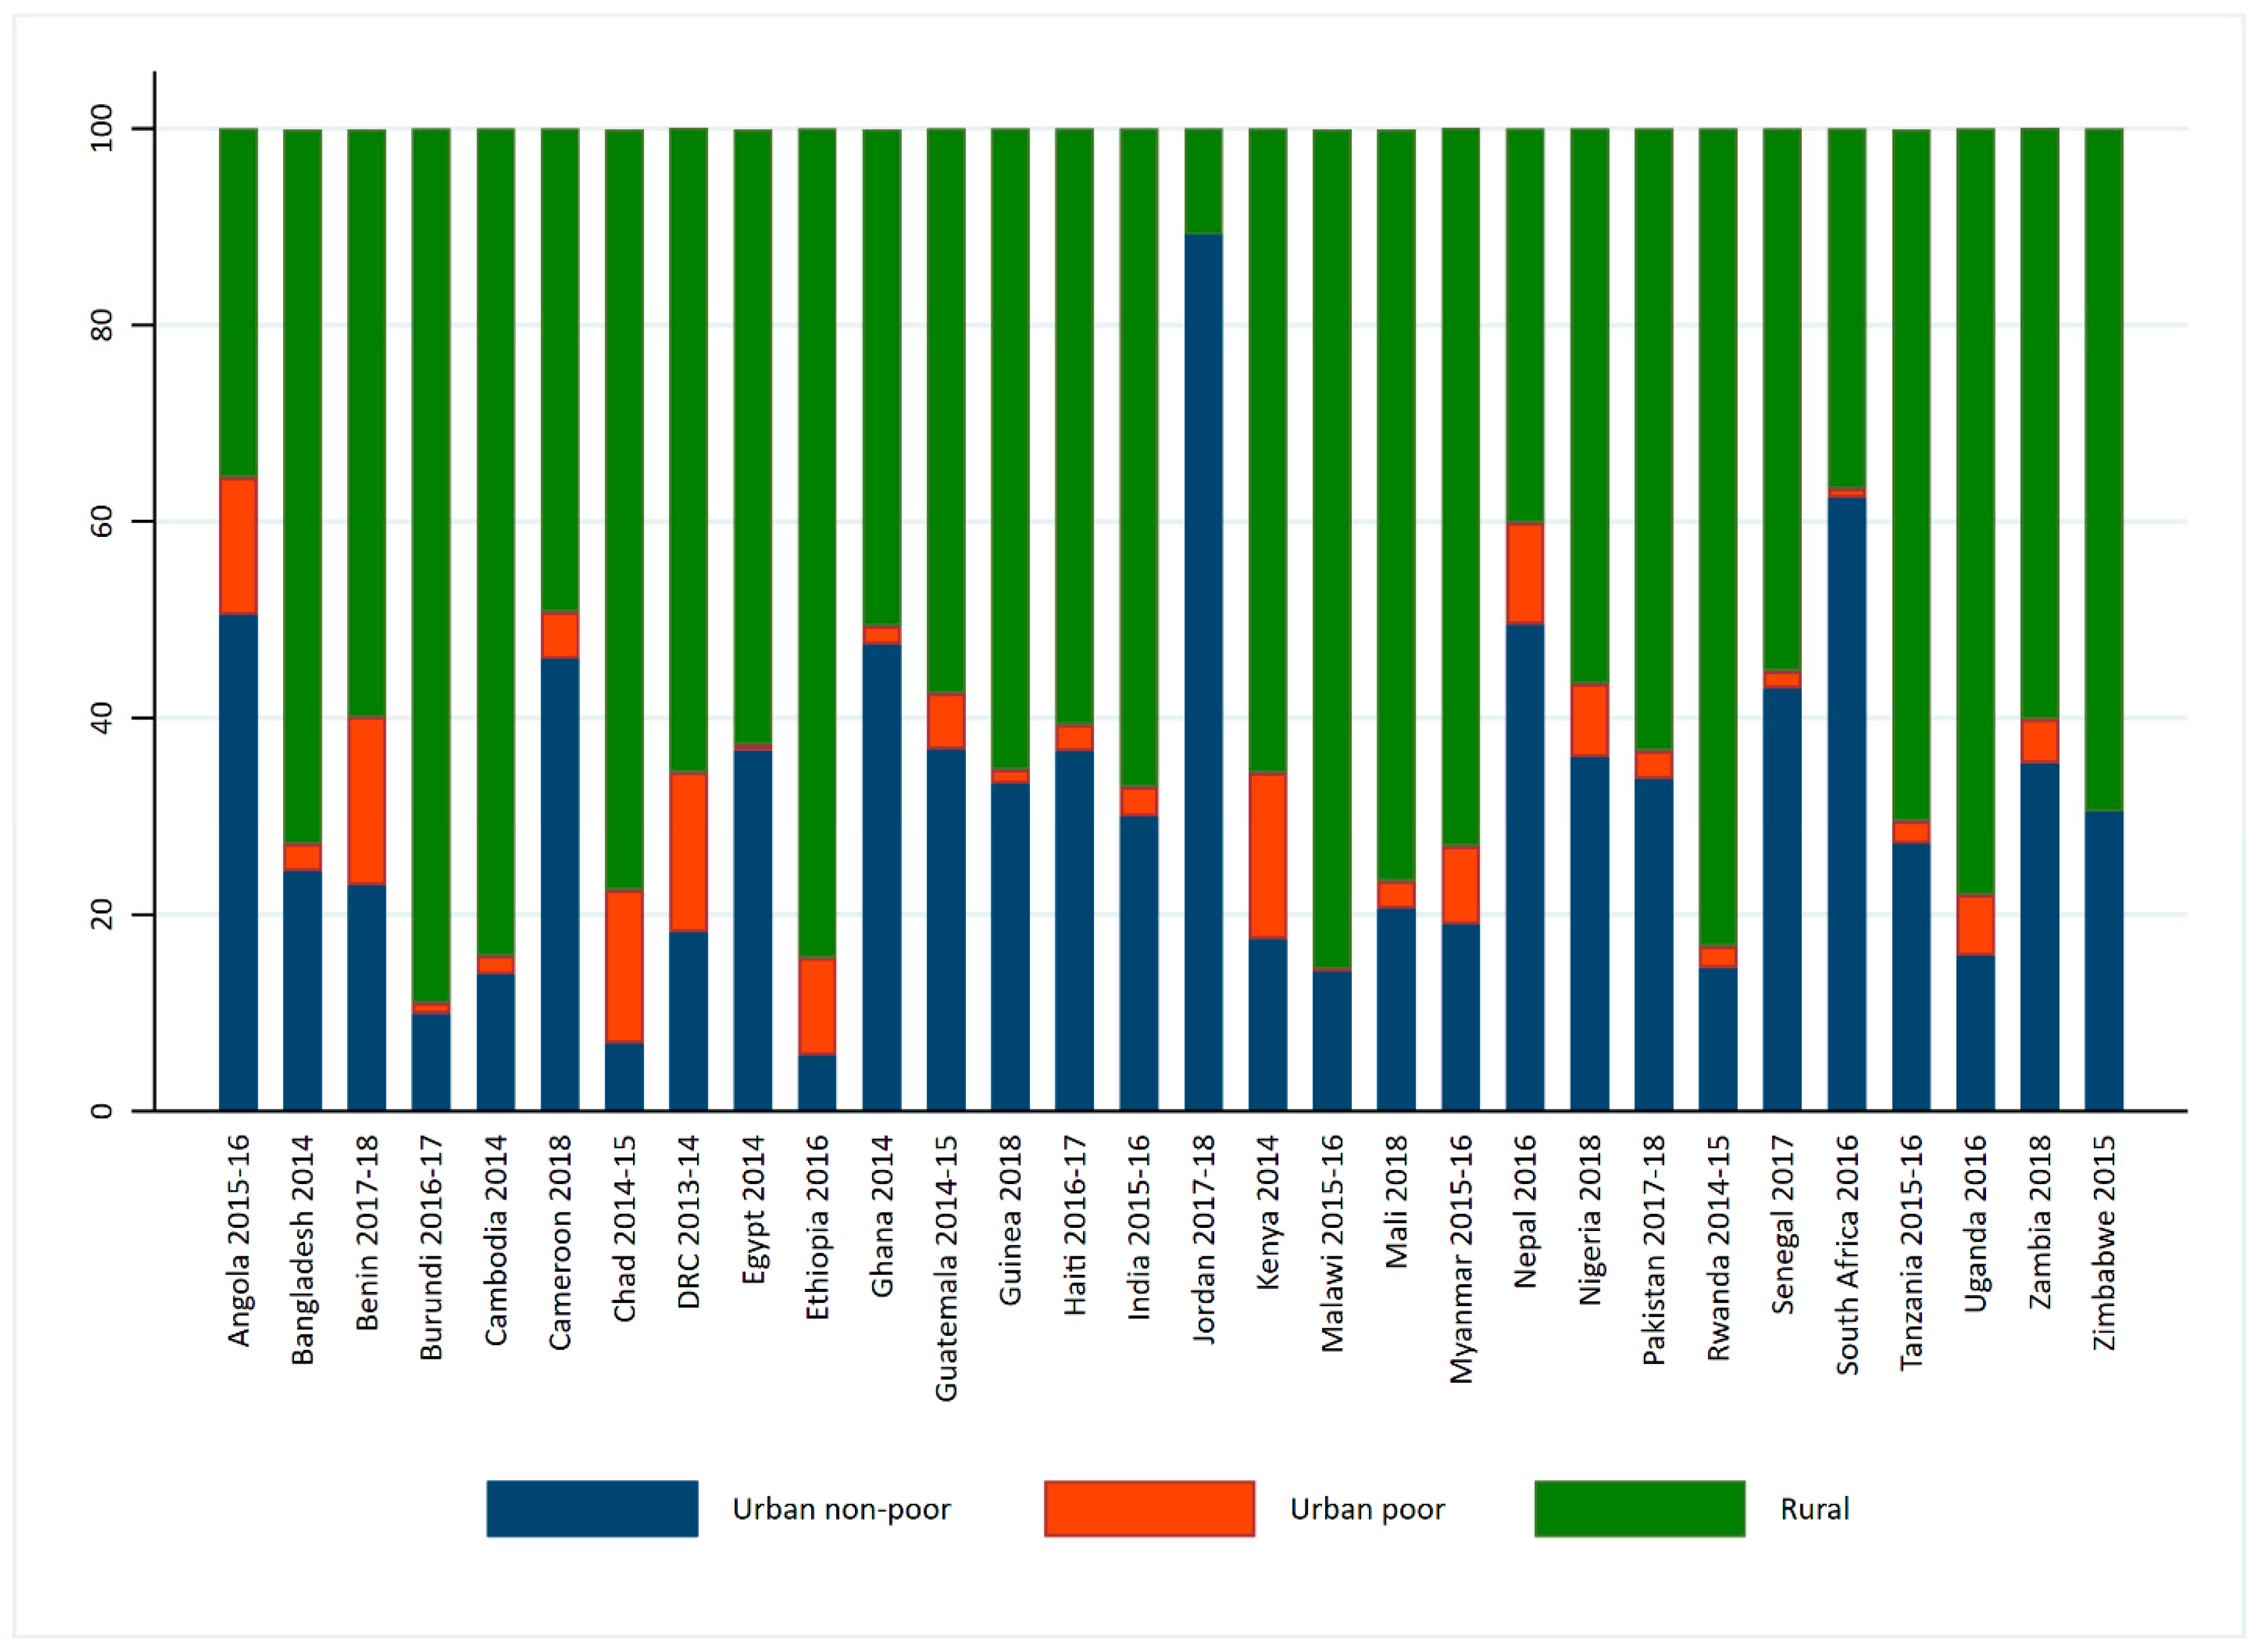
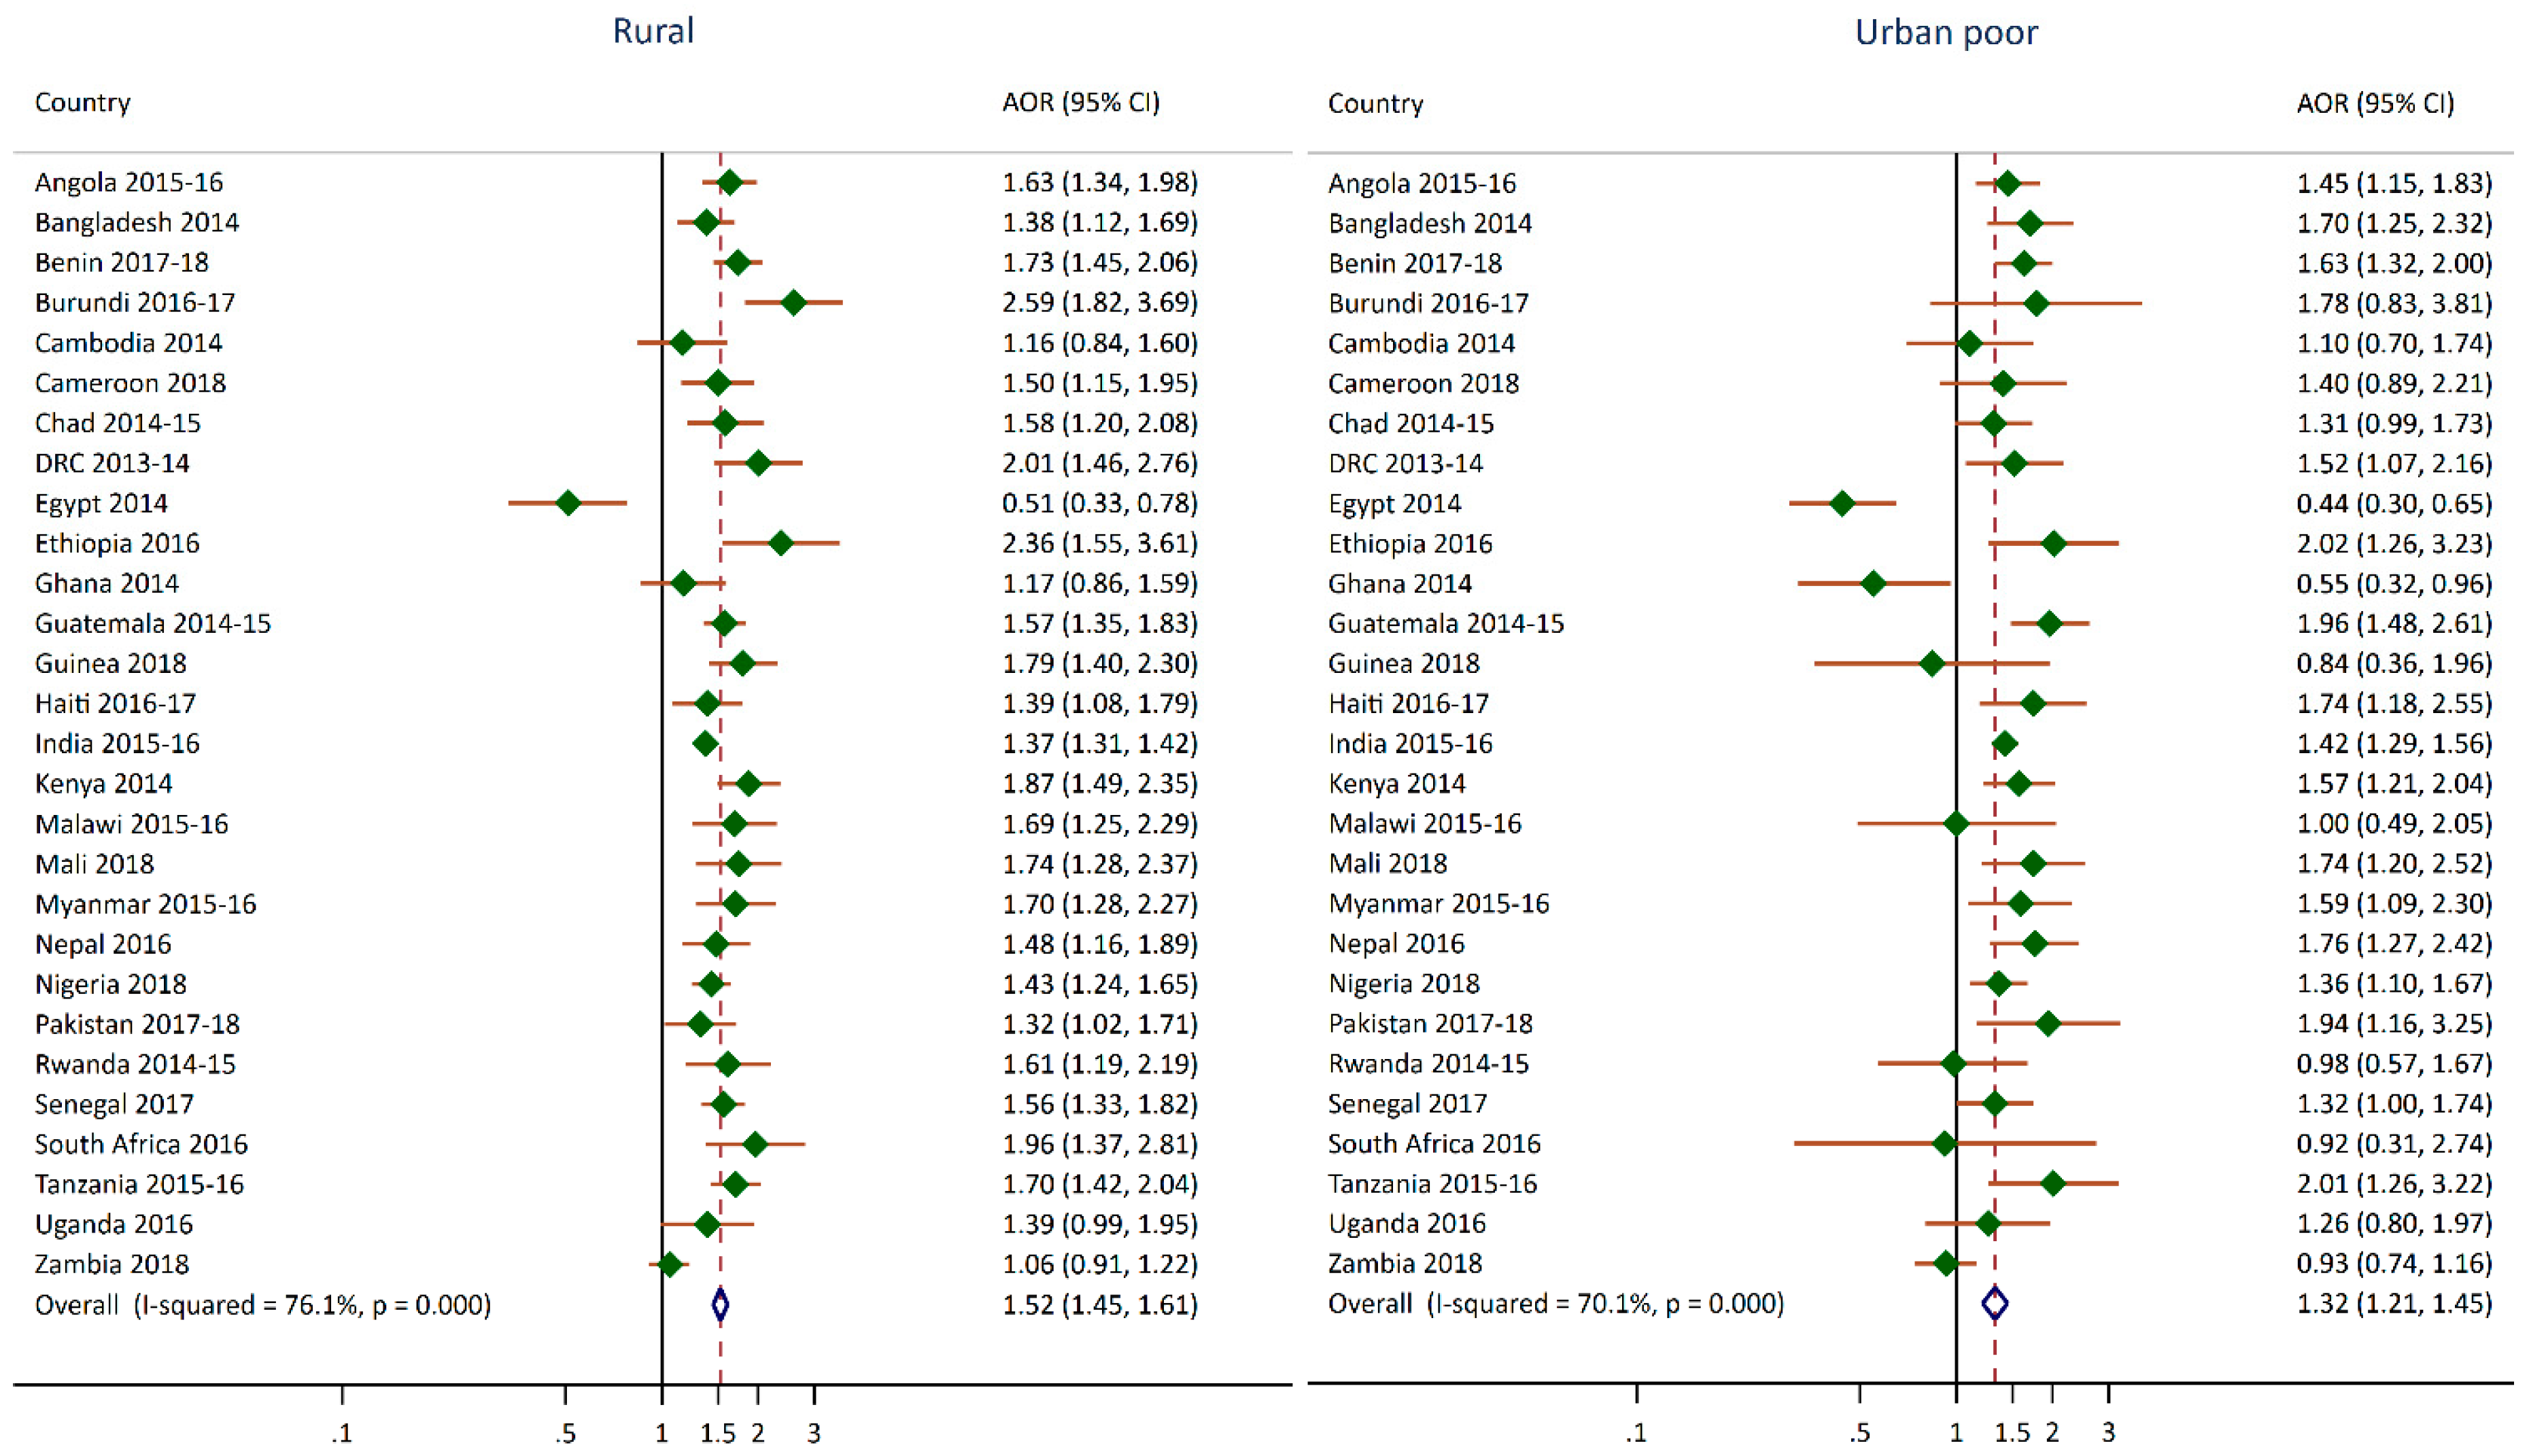
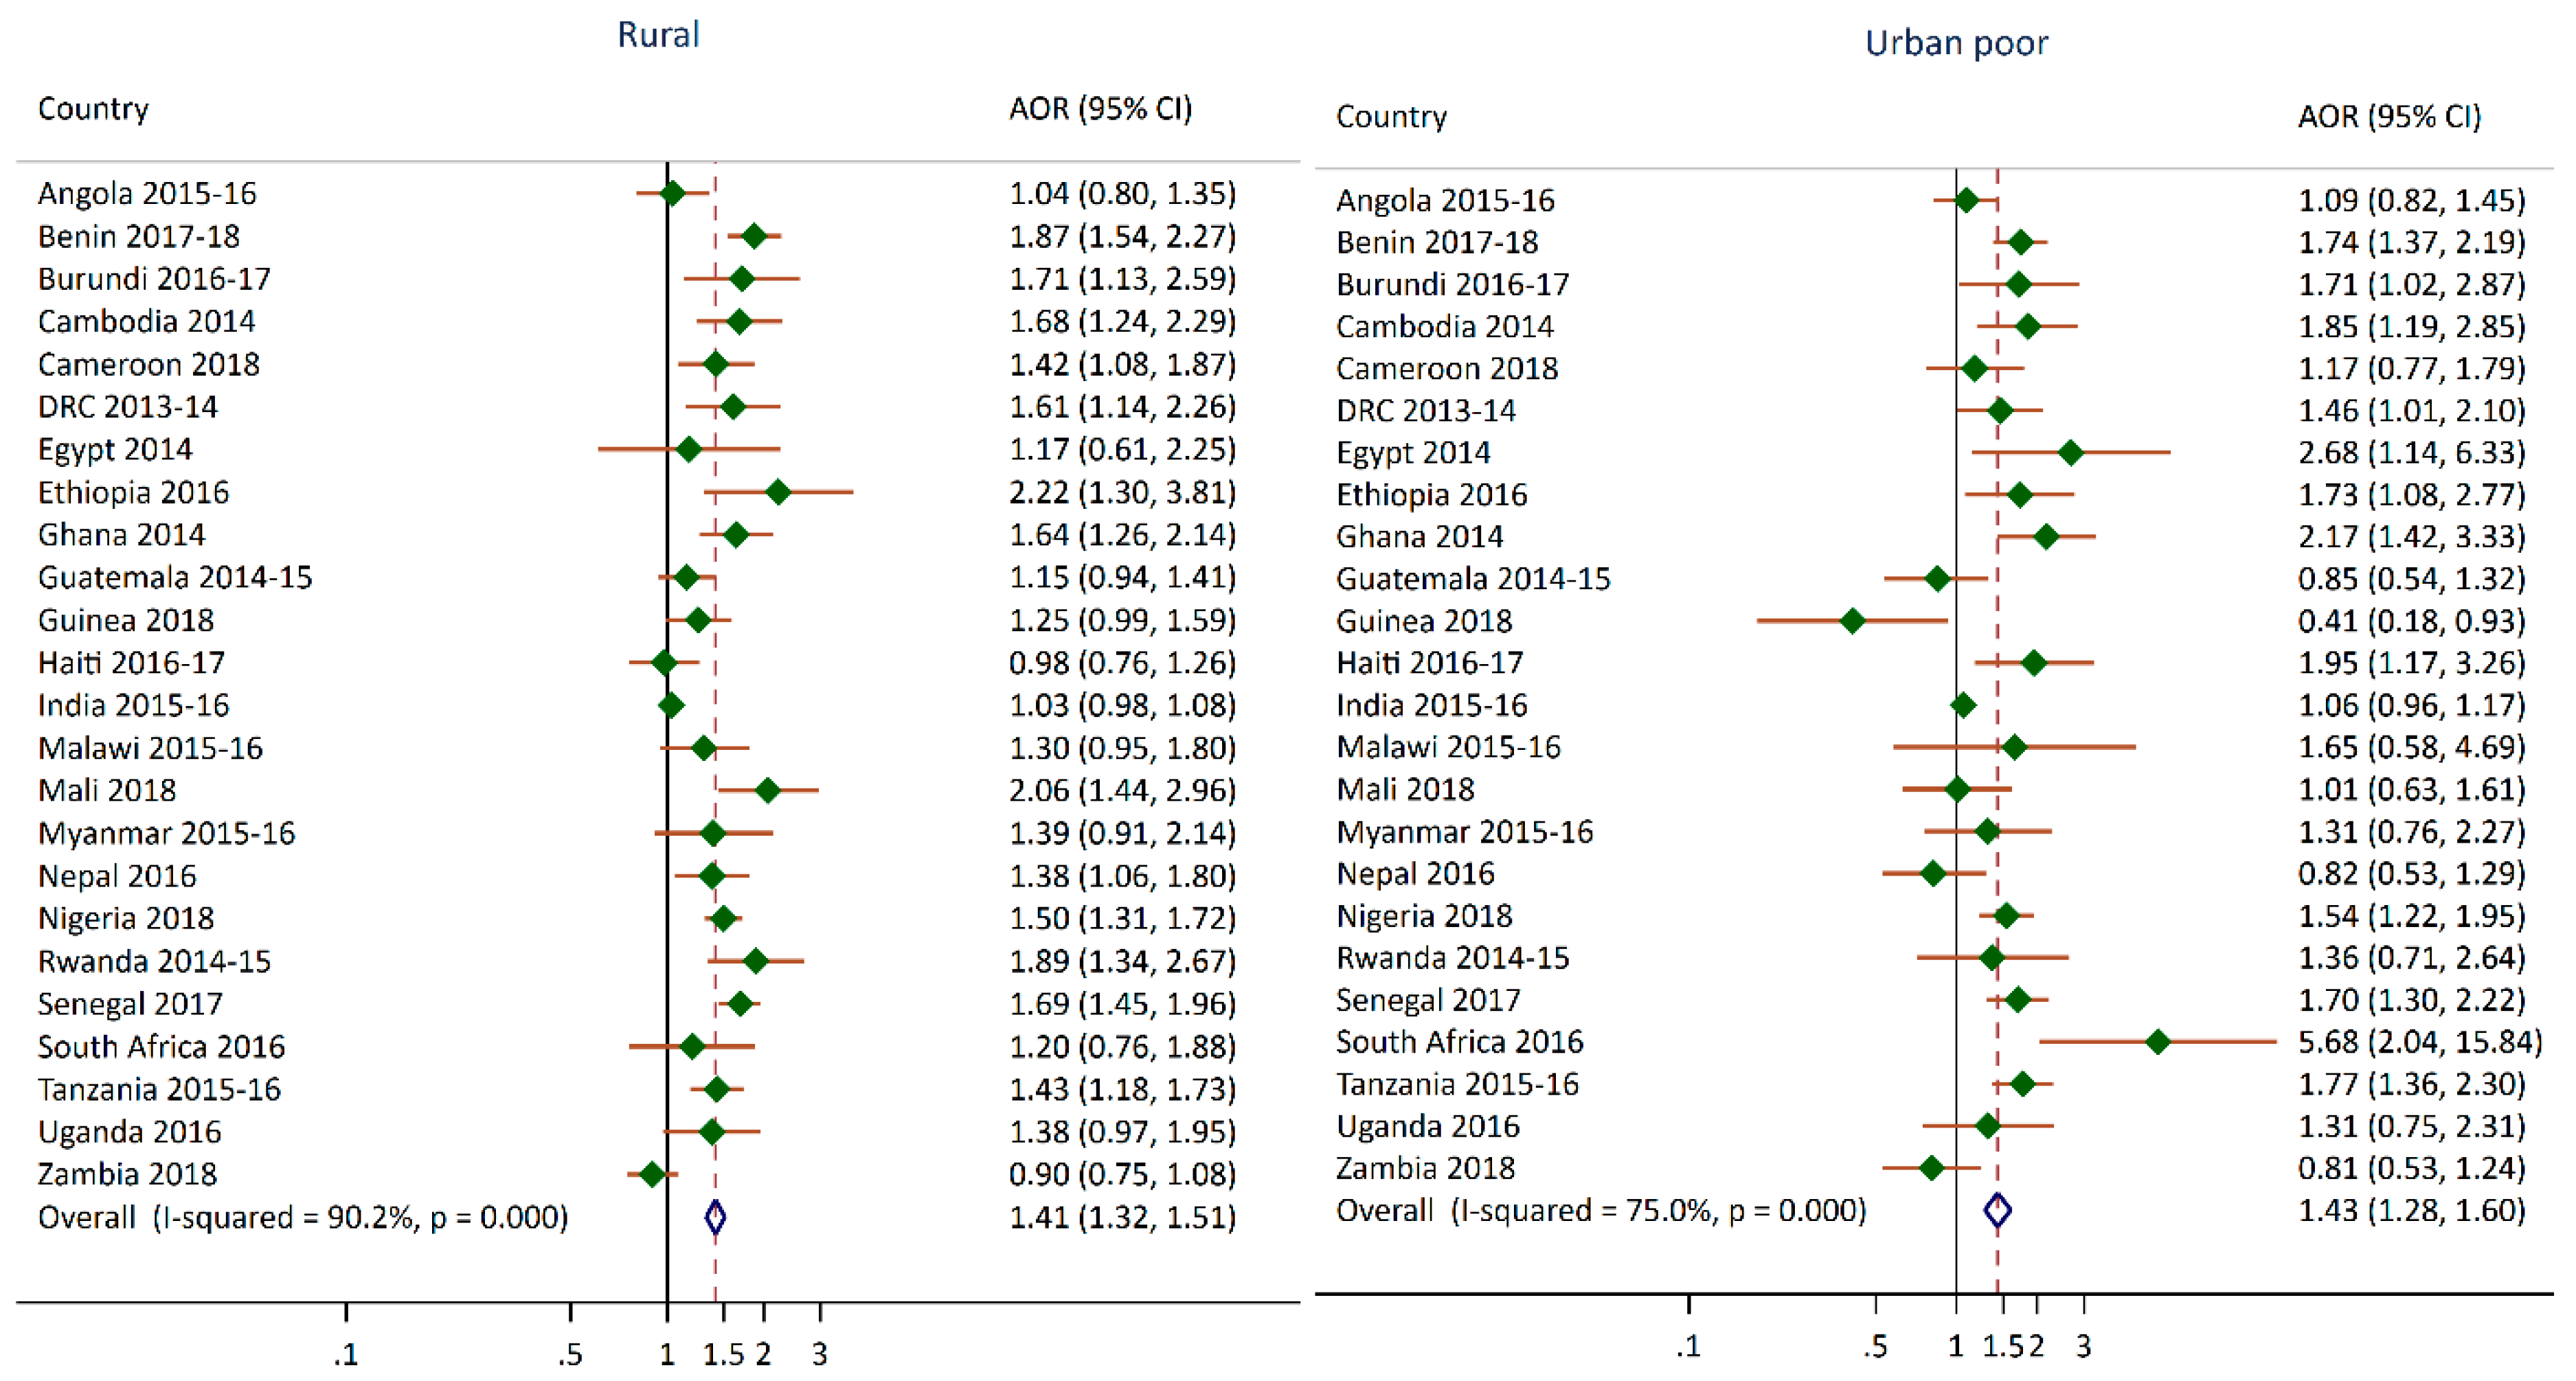
3. Results

4. Discussion
5. Conclusions
Author Contributions
Funding
Conflicts of Interest
Appendix A

| Survey | Rural | Urban Poor |
|---|---|---|
| Angola 2015–2016 | 1.63 *** (1.34,1.98) | 1.45 ** (1.15,1.83) |
| Bangladesh 2014 | 1.38 ** (1.12,1.69) | 1.70 ** (1.25,2.32) |
| Benin 2017–2018 | 1.73 *** (1.45,2.06) | 1.63 *** (1.32,2) |
| Burundi 2016–2017 | 2.59 *** (1.82,3.69) | 1.78 (0.83,3.81) |
| Cameroon 2018 | 1.5 ** (1.15,1.95) | 1.40 (0.89,2.21) |
| Cambodia 2014 | 1.16 (0.84,1.6) | 1.10 (0.7,1.74) |
| Chad 2014–2015 | 1.58 ** (1.2,2.08) | 1.31 (0.99,1.73) |
| Congo Democratic Republic 2013–2014 | 2.01 *** (1.46,2.76) | 1.52 * (1.07,2.16) |
| Egypt 2014 | 0.51 ** (0.33,0.78) | 0.44 *** (0.3,0.65) |
| Ethiopia 2016 | 2.36 *** (1.55,3.61) | 2.02 ** (1.26,3.23) |
| Ghana 2014 | 1.17 (0.86,1.59) | 0.55 * (0.32,0.96) |
| Guatemala 2014–2015 | 1.57 *** (1.35,1.83) | 1.96 *** (1.48,2.61) |
| Guinea 2018 | 1.79 *** (1.4,2.3) | 0.84 (0.36,1.96) |
| Haiti 2016–2017 | 1.39 * (1.08,1.79) | 1.74 ** (1.18,2.55) |
| India 2015–2016 | 1.37 *** (1.31,1.42) | 1.42 *** (1.29,1.56) |
| Kenya 2014 | 1.87 *** (1.49,2.35) | 1.57 ** (1.21,2.04) |
| Malawi 2015–2016 | 1.69 ** (1.25,2.29) | 1.00 (0.49,2.05) |
| Mali 2018 | 1.74 *** (1.28,2.37) | 1.74 ** (1.2,2.52) |
| Myanmar 2015–2016 | 1.7 *** (1.28,2.27) | 1.59 * (1.09,2.3) |
| Nepal 2016 | 1.48 ** (1.16,1.89) | 1.76 ** (1.27,2.42) |
| Nigeria 2018 | 1.43 *** (1.24,1.65) | 1.36 ** (1.1,1.67) |
| Pakistan 2017–2018 | 1.32 * (1.02,1.71) | 1.94 * (1.16,3.25) |
| Rwanda 2014–2015 | 1.61 ** (1.19,2.19) | 0.98 (0.57,1.67) |
| Senegal 2017 | 1.56 *** (1.33,1.82) | 1.32 * (1,1.74) |
| South Africa 2016 | 1.96 *** (1.37,2.81) | 0.92 (0.31,2.74) |
| Tanzania 2015–2016 | 1.7 *** (1.42,2.04) | 2.01 ** (1.26,3.22) |
| Uganda 2016 | 1.39 (0.99,1.95) | 1.26 (0.8,1.97) |
| Zambia 2018 | 1.06 (0.91,1.22) | 0.93 (0.74,1.16) |
Appendix B
| Survey | Rural | Urban Poor |
|---|---|---|
| Angola 2015–2016 | 1.04 (0.8,1.35) | 1.09 (0.82,1.45) |
| Bangladesh 2014 | NA | NA |
| Benin 2017–2018 | 1.87 *** (1.54,2.27) | 1.74 *** (1.37,2.19) |
| Burundi 2016–2017 | 1.71 * (1.13,2.59) | 1.71 * (1.02,2.87) |
| Cameroon 2018 | 1.42 * (1.08,1.87) | 1.17 (0.77,1.79) |
| Cambodia 2014 | 1.68 ** (1.24,2.29) | 1.85 ** (1.19,2.85) |
| Chad 2014–2015 | NA | NA |
| Congo Democratic Republic 2013–2014 | 1.61 ** (1.14,2.26) | 1.46 * (1.01,2.1) |
| Egypt 2014 | 1.17 (0.61,2.25) | 2.68 * (1.14,6.33) |
| Ethiopia 2016 | 2.22 ** (1.3,3.81) | 1.73 * (1.08,2.77) |
| Ghana 2014 | 1.64 *** (1.26,2.14) | 2.17 *** (1.42,3.33) |
| Guatemala 2014–2015 | 1.15 (0.94,1.41) | 0.85 (0.54,1.32) |
| Guinea 2018 | 1.25 (0.99,1.59) | 0.41 * (0.18,0.93) |
| Haiti 2016–2017 | 0.98 (0.76,1.26) | 1.95 * (1.17,3.26) |
| India 2015–2016 | 1.03 (0.98,1.08) | 1.06 (0.96,1.17) |
| Kenya 2014 | NA | NA |
| Malawi 2015–2016 | 1.3 (0.95,1.8) | 1.65 (0.58,4.69) |
| Mali 2018 | 2.06 *** (1.44,2.96) | 1.01 (0.63,1.61) |
| Myanmar 2015–2016 | 1.39 (0.91,2.14) | 1.31 (0.76,2.27) |
| Nepal 2016 | 1.38 * (1.06,1.8) | 0.82 (0.53,1.29) |
| Nigeria 2018 | 1.5 *** (1.31,1.72) | 1.54 *** (1.22,1.95) |
| Pakistan 2017–2018 | NA | NA |
| Rwanda 2014–2015 | 1.89 *** (1.34,2.67) | 1.36 (0.71,2.64) |
| Senegal 2017 | 1.69 *** (1.45,1.96) | 1.7 *** (1.3,2.22) |
| South Africa 2016 | 1.2 (0.76,1.88) | 5.68 ** (2.04,15.84) |
| Tanzania 2015–2016 | 1.43 *** (1.18,1.73) | 1.77 *** (1.36,2.3) |
| Uganda 2016 | 1.38 (0.97,1.95) | 1.31 (0.75,2.31) |
| Zambia 2018 | 0.9 (0.75,1.08) | 0.81 (0.53,1.24) |
References
- UNICEF. The State of the World’s Children 2019. Children, Food and Nutrition: Growing Well in a Changing World; UNICEF: New York, NY, USA, 2019. [Google Scholar]
- Global Nutrition Report. 2020 Global Nutrition Report: Action on Equity to End Malnutrition; Development Initiatives: Bristol, UK, 2020. [Google Scholar]
- Gardner, W.; Kassebaum, N. Global, Regional, and National Prevalence of Anemia and Its Causes in 204 Countries and Territories, 1990–2019. Curr. Dev. Nutr. 2020, 4, 830. [Google Scholar] [CrossRef]
- Stevens, G.A.; Finucane, M.M.; De-Regil, L.M.; Paciorek, C.J.; Flaxman, S.R.; Branca, F.; Peña-Rosas, J.P.; Bhutta, Z.A.; Ezzati, M.; Nutrition Impact Model Study Group. Global, regional, and national trends in haemoglobin concentration and prevalence of total and severe anaemia in children and pregnant and non-pregnant women for 1995–2011: A systematic analysis of population-representative data. Lancet Glob. Health 2013, 1, e16–e25. [Google Scholar] [CrossRef]
- Grantham-McGregor, S.; Cheung, Y.B.; Cueto, S.; Glewwe, P.; Richter, L.; Strupp, B.; International Child Development Steering Group. Developmental potential in the first 5 years for children in developing countries. Lancet 2007, 369, 60–70. [Google Scholar] [CrossRef]
- WHO. Stunted Growth and Development: Context, Causes and Consequences; World Health Organization: Geneva, Switzerland, 2017. [Google Scholar]
- Grantham-McGregor, S.; Smith, J. The Effect of Malnutrition and Micronutrient Deficiency on Children’s Mental Health. Ment. Health Illn. Child. Adolesc. 2020, 1–20. [Google Scholar] [CrossRef]
- Prado, E.L.; Dewey, K.G. Nutrition and brain development in early life. Nutr. Rev. 2014, 72, 267–284. [Google Scholar] [CrossRef] [PubMed]
- United Nations Human Settlements Programme. State of the World’s Cities 2008/2009: Harmonious Cities; UN-HABITAT: Sterling, VA, USA, 2008. [Google Scholar]
- Lucci, P.; Bhatkal, T.; Khan, A. Are we underestimating urban poverty? World Dev. 2018, 103, 297–310. [Google Scholar] [CrossRef]
- DESA. World Urbanization Prospects: The 2018 Revision; Department of Economic and Social Affairs, Population Division, United Nations: New York, NY, USA, 2018. [Google Scholar]
- Assaf, S.; Kothari, M.T.; Pullum, T. An Assessment of the Quality of DHS Anthropometric Data, 2005-2014; ICF International: Rockville, MA, USA, 2015. [Google Scholar]
- Assaf, S.; Pullum, T. Levels and Trends in Maternal and Child Health Disparities by Wealth and Region in Eleven Countries with DHS Surveys; ICF International: Rockville, MA, USA, 2016. [Google Scholar]
- Eckert, S.; Kohler, S. Urbanization and health in developing countries: A systematic review. World Health Popul. 2014, 15, 7–20. [Google Scholar] [CrossRef]
- Rutstein, S.O.; Staveteig, S.; Winter, R.; Yourkavitch, J. Urban Child Poverty, Health, and Survival in Low- and Middle-Income Countries; ICF International: Rockville, MA, USA, 2016. [Google Scholar]
- Van de Poel, E.; Hosseinpoor, A.R.; Speybroeck, N.; Van Ourti, T.; Vega, J. Socioeconomic inequality in malnutrition in developing countries. Bull. World Health Organ. 2008, 86, 282–291. [Google Scholar] [CrossRef]
- Baye, K.; Laillou, A.; Chitweke, S. Socio-Economic Inequalities in Child Stunting Reduction in Sub-Saharan Africa. Nutrients 2020, 12, 253. [Google Scholar] [CrossRef]
- Van de Poel, E.; O’Donnell, O.; Van Doorslaer, E. Are urban children really healthier? Evidence from 47 developing countries. Soc. Sci. Med. 2007, 65, 1986–2003. [Google Scholar] [CrossRef]
- Ezeh, A.; Oyebode, O.; Satterthwaite, D.; Chen, Y.-F.; Ndugwa, R.; Sartori, J.; Mberu, B.; Melendez-Torres, G.J.; Haregu, T.; Watson, S.I. The history, geography, and sociology of slums and the health problems of people who live in slums. Lancet 2017, 389, 547–558. [Google Scholar] [CrossRef]
- Fink, G.; Günther, I.; Hill, K. Slum residence and child health in developing countries. Demography 2014, 51, 1175–1197. [Google Scholar] [CrossRef] [PubMed]
- Kyu, H.H.; Shannon, H.S.; Georgiades, K.; Boyle, M.H. Association of urban slum residency with infant mortality and child stunting in low and middle income countries. Biomed Res. Int. 2013. [Google Scholar] [CrossRef] [PubMed]
- UNICEF; WHO; World Bank. Levels and Trends in Child Malnutrition: Key Findings of the 2018 Edition of the Joint Child Malnutrition Estimates; World Health Organization: Geneva, Switzerland, 2018. [Google Scholar]
- WHO. The Double Burden of Malnutrition: Policy Brief; World Health Organization: Geneva, Switzerland, 2017. [Google Scholar]
- WHO. Report of the Commission on Ending Childhood Obesity; World Health Organization: Geneva, Switzerland, 2016. [Google Scholar]
- Akombi, B.J.; Chitekwe, S.; Sahle, B.W.; Renzaho, A. Estimating the Double Burden of Malnutrition among 595,975 Children in 65 Low-and Middle-Income Countries: A Meta-Analysis of Demographic and Health Surveys. Int. J. Environ. Res. Public Health 2019, 16, 2886. [Google Scholar] [CrossRef]
- Popkin, B.M.; Corvalan, C.; Grummer-Strawn, L.M. Dynamics of the double burden of malnutrition and the changing nutrition reality. Lancet 2020, 395, 65–74. [Google Scholar] [CrossRef]
- Tzioumis, E.; Kay, M.C.; Bentley, M.E.; Adair, L.S. Prevalence and trends in the childhood dual burden of malnutrition in low-and middle-income countries, 1990–2012. Public Health Nutr. 2016, 19, 1375–1388. [Google Scholar] [CrossRef]
- Popkin, B.M. Nutrition transition and the global diabetes epidemic. Curr. Diabetes Rep. 2015, 15, 64. [Google Scholar] [CrossRef]
- Ruel, M.T.; Garrett, J.; Yosef, S.; Olivier, M. Urbanization, food security and nutrition. In Nutrition and Health in a Developing World; Springer: New York, NY, USA, 2017; pp. 705–735. [Google Scholar]
- United Nations, Department of Economic and Social Affairs Population Dynamics, Population Division. World Population Prospects 2019, Online Edition. Rev. 1. Available online: https://population.un.org/wpp/ (accessed on 11 September 2020).
- United Nations Human Settlements Programme. UN-HABITAT State of the World’s Cities 2006/7; UN-HABITAT: Nairobi, Kenya, 2007. [Google Scholar]
- UN-Habitat. Slum Almanac 2015/2016. Tracking Improvement in the Lives of Slum Dwellers; UN-Habitat: Nairobi, Kenya, 2016. [Google Scholar]
- Harris, R.J.; Deeks, J.J.; Altman, D.G.; Bradburn, M.J.; Harbord, R.M.; Sterne, J.A. Metan: Fixed-and random-effects meta-analysis. Stata J. 2008, 8, 3–28. [Google Scholar] [CrossRef]
- Higgins, J.P.; Thompson, S.G.; Deeks, J.J.; Altman, D.G. Measuring inconsistency in meta-analyses. BMJ 2003, 327, 557–560. [Google Scholar] [CrossRef]
- Assaf, S.; Juan, C. Variations in Health Outcomes with Alternative Measures of Urbanicity, Using Demographic and Health Surveys 2013-18; ICF: Rockville, MA, USA, 2020. [Google Scholar]
- Menon, P.; Ruel, M.T.; Morris, S.S. Socio-economic differentials in child stunting are consistently larger in urban than in rural areas. Food Nutr. Bull. 2000, 21, 282–289. [Google Scholar] [CrossRef]
- Mberu, B.U.; Haregu, T.N.; Kyobutungi, C.; Ezeh, A.C. Health and health-related indicators in slum, rural, and urban communities: A comparative analysis. Glob. Health Action 2016, 9, 33163. [Google Scholar] [CrossRef] [PubMed]
- World Bank Group. Scaling Up Nutrition in the Arab Republic of Egypt: Investing in a Healthy Future; Herbst, C.H., Elshalakani, A., Kakietek, J., Hafiz, A., Petrovic, O., Eds.; World Bank: Washington, DC, USA, 2020. [Google Scholar]
- Hassan, H.; Moussa, W.; Ismail, I. Assessment of dietary changes and their health implications in countries facing the double burden of malnutrition: Egypt, 1980 to 2005. Double Burd. Malnutrition 2006, 43, 22. [Google Scholar]
- Atsu, B.K.; Guure, C.; Laar, A.K. Determinants of overweight with concurrent stunting among Ghanaian children. BMC Pediatrics 2017, 17, 177. [Google Scholar] [CrossRef] [PubMed]
- Cyril, S.; Oldroyd, J.C.; Renzaho, A. Urbanisation, urbanicity, and health: A systematic review of the reliability and validity of urbanicity scales. BMC Public Health 2013, 13, 513. [Google Scholar] [CrossRef]
- Unger, A.; Riley, L.W. Slum health: From understanding to action. PLoS Med. 2007, 4, e295. [Google Scholar] [CrossRef]
- Tacoli, C. Food security in rapidly urbanising, low-income contexts. Int. J. Environ. Res. Public Health 2017, 14, 1554. [Google Scholar] [CrossRef]
- Fish, T.D.; Janocha, B.; Dontamsetti, T.; Mayala, B.K. Geospatial Covariates: Proxies for Mapping Urban-Related Indicators; ICF: Rockville, MA, USA, 2020. [Google Scholar]
- Jones, A.D.; Acharya, Y.; Galway, L.P. Urbanicity gradients are associated with the household-and individual-level double burden of malnutrition in sub-Saharan Africa. J. Nutr. 2016, 146, 1257–1267. [Google Scholar] [CrossRef]


| Country | DHS Survey | Number of Households Interviewed | Projected Population in 2020 (Thousands) * |
|---|---|---|---|
| Angola | 2015–2016 | 16,109 | 32,866 |
| Bangladesh | 2014 | 17,300 | 164,689 |
| Benin | 2017–2018 | 14,156 | 12,123 |
| Burundi | 2016–2017 | 15,977 | 11,891 |
| Cameroon | 2018 | 11,710 | 26,546 |
| Cambodia | 2014 | 15,825 | 16,719 |
| Chad | 2014–2015 | 17,233 | 16,426 |
| DRC | 2013–2014 | 18,171 | 89,561 |
| Egypt | 2014 | 28,175 | 102,334 |
| Ethiopia | 2016 | 16,650 | 114,964 |
| Ghana | 2014 | 11,835 | 31,073 |
| Guatemala | 2014–2015 | 21,383 | 17,916 |
| Guinea | 2018 | 7912 | 13,133 |
| Haiti | 2016–2017 | 13,405 | 11,403 |
| India | 2015–2016 | 601,509 | 1,380,004 |
| Jordan | 2017–2018 | 18,802 | 10,203 |
| Kenya | 2014 | 36,430 | 53,771 |
| Malawi | 2015–2016 | 26,361 | 19,130 |
| Mali | 2018 | 9510 | 20,251 |
| Myanmar | 2015–2016 | 12,500 | 54,410 |
| Nepal | 2016 | 11,040 | 29,137 |
| Nigeria | 2018 | 40,427 | 206,140 |
| Pakistan | 2017–2018 | 11,869 | 220,892 |
| Philippines | 2017 | 27,496 | 109,581 |
| Rwanda | 2014–2015 | 12,699 | 12,952 |
| Senegal | 2017 | 8380 | 16,744 |
| South Africa | 2016 | 11,083 | 59,309 |
| Tanzania | 2015–2016 | 12,563 | 59,734 |
| Uganda | 2016 | 19,588 | 45,741 |
| Zambia | 2018 | 12,831 | 18,384 |
| Zimbabwe | 2015 | 10,534 | 14,863 |
| Survey | Total | Urban non-Poor | Urban Poor | Rural | p-Value |
|---|---|---|---|---|---|
| Angola 2015–2016 | 37.6 (35.7,39.5) | 28.2 (24.5,32.3) | 41.4 (37.8,45.0) | 45.7 (43.5,47.9) | 0.001 |
| Bangladesh 2014 | 36.1 (34.4,37.9) | 28.5 (25.0,32.2) | 47.6 (40.1,55.2) | 37.9 (35.9,39.9) | 0.001 |
| Benin 2017–2018 | 32.2 (30.9,33.4) | 21.7 (19.6,23.9) | 33.9 (31.2,36.8) | 35.2 (33.7,36.8) | 0.001 |
| Burundi 2016–2017 | 55.9 (54.2,57.7) | 25.7 (20.1,32.2) | 45.1 (24.8,67.1) | 58.8 (57.0,60.5) | 0.001 |
| Cameroon 2018 | 28.9 (27.1,30.8) | 18.1 (15.7,20.8) | 32.7 (23.0,44.2) | 36.2 (33.7,38.8) | 0.001 |
| Cambodia 2014 | 32.4 (30.6,34.3) | 22.5 (18.9,26.6) | 30.9 (24.2,38.5) | 33.8 (31.8,35.9) | 0.001 |
| Chad 2014–2015 | 39.9 (38.4,41.3) | 25.0 (21.3,29.1) | 35.0 (31.7,38.5) | 41.6 (39.9,43.4) | 0.001 |
| Democratic Republic of the Congo 2013–2014 | 42.7 (40.9,44.5) | 25.1 (20.5,30.3) | 39.0 (35.3,42.9) | 47.1 (44.9,49.4) | 0.001 |
| Egypt 2014 | 21.4 (20.1,22.9) | 23.1 (20.5,26.0) | 15.9 (12.3,20.4) | 20.7 (19.1,22.4) | 0.112 |
| Ethiopia 2016 | 38.4 (36.5,40.3) | 14.6 (11.5,18.4) | 29.8 (23.6,36.7) | 39.9 (37.9,42.0) | 0.001 |
| Ghana 2014 | 18.8 (17.0,20.6) | 14.8 (12.4,17.6) | 15.1 (11.4,19.8) | 22.1 (19.7,24.7) | 0.001 |
| Guatemala 2014–2015 | 46.5 (44.8,48.2) | 30.0 (27.8,32.3) | 55.1 (47.5,62.4) | 53.0 (50.8,55.1) | 0.001 |
| Guinea 2018 | 30.3 (28.6,32.1) | 21.7 (18.9,24.9) | 21.3 (10.5,38.5) | 33.8 (31.8,35.9) | 0.001 |
| Haiti 2016–2017 | 21.9 (20.5,23.5) | 16.8 (14.6,19.2) | 29.4 (22.0,38.1) | 23.9 (22.0,25.9) | 0.001 |
| India 2015–2016 | 38.4 (38.1,38.7) | 29.4 (28.6,30.2) | 42.6 (40.8,44.5) | 41.2 (40.8,41.5) | 0.001 |
| Kenya 2014 | 26.0 (25.1,27.0) | 16.3 (13.6,19.4) | 23.2 (21.1,25.4) | 29.1 (27.9,30.2) | 0.001 |
| Malawi 2015–2016 | 37.1 (35.6,38.7) | 25.0 (20.7,29.8) | (24.3) (16.0,35.2) | 38.9 (37.2,40.6) | 0.001 |
| Mali 2018 | 26.9 (25.6,28.2) | 15.4 (13.6,17.5) | 27.8 (21.2,35.5) | 29.4 (27.9,30.9) | 0.001 |
| Myanmar 2015–2016 | 29.2 (27.3,31.1) | 17.0 (13.9,20.6) | 25.1 (19.8,31.3) | 31.6 (29.5,33.9) | 0.001 |
| Nepal 2016 | 35.8 (33.5,38.3) | 28.3 (25.0,31.7) | 44.1 (37.6,50.8) | 40.2 (36.6,43.9) | 0.001 |
| Nigeria 2018 | 36.8 (35.6,38.1) | 24.2 (22.3,26.3) | 39.6 (35.7,43.6) | 44.8 (43.2,46.3) | 0.001 |
| Pakistan 2017–2018 | 37.6 (34.8,40.6) | 28.4 (24.9,32.2) | 55.7 (44.5,66.4) | 40.9 (37.1,44.9) | 0.001 |
| Rwanda 2014–2015 | 37.9 (36.1,39.6) | 22.7 (19.0,26.9) | 28.9 (15.8,47.0) | 40.6 (38.6,42.6) | 0.001 |
| Senegal 2017 | 16.5 (15.6,17.5) | 9.5 (8.3,10.8) | 23.3 (18.6,28.8) | 20.2 (19.0,21.4) | 0.001 |
| South Africa 2016 | 27.4 (24.3,30.7) | 26.0 (20.9,31.7) | ND | 29.2 (25.8,32.8) | 0.338 |
| Tanzania 2015–2016 | 34.4 (33.0,35.9) | 22.8 (20.5,25.3) | 39.5 (24.1,57.3) | 37.8 (36.1,39.4) | 0.001 |
| Uganda 2016 | 28.9 (27.3,30.5) | 20.0 (16.5,24.1) | 31.6 (25.6,38.2) | 30.2 (28.4,32.0) | 0.001 |
| Zambia 2018 | 34.6 (33.4,35.8) | 31.9 (29.6,34.4) | 33.8 (28.9,39.1) | 35.9 (34.4,37.3) | 0.016 |
| Survey | Total | Urban non-Poor | Urban Poor | Rural | p-Value |
|---|---|---|---|---|---|
| Angola 2015–2016 | 34.1 (32.2,36.1) | 32.6 (29.7,35.7) | 35.3 (31.1,39.7) | 35.1 (32.0,38.3) | 0.419 |
| Bangladesh 2014 | NA | NA | NA | NA | |
| Benin 2017–2018 | 43.9 (42.2,45.6) | 28.9 (26.1,31.9) | 47.5 (43.5,51.6) | 47.8 (45.6,50.0) | 0.001 |
| Burundi 2016–2017 | 36.3 (34.6,38.1) | 23.6 (17.8,30.7) | 31.7 (26.2,37.9) | 37.5 (35.6,39.3) | 0.001 |
| Cameroon 2018 | 31.0 (29.1,33.0) | 25.5 (22.8,28.5) | 30.7 (23.9,38.5) | 34.8 (32.0,37.8) | 0.001 |
| Cambodia 2014 | 25.7 (24.0,27.5) | 15.7 (12.6,19.3) | 29.2 (24.2,34.9) | 27.0 (25.0,29.0) | 0.001 |
| Chad 2014–2015 | NA | NA | NA | NA | |
| Democratic Republic of the Congo 2013–2014 | 34.8 (32.5,37.1) | 26.6 (23.3,30.1) | 35.5 (30.3,41.1) | 36.2 (33.1,39.3) | 0.005 |
| Egypt 2014 | 9.5 (8.3,10.7) | 6.2 (4.8,7.9) | (14.0) (4.0,38.7) | 11.0 (9.5,12.7) | 0.001 |
| Ethiopia 2016 | 32.0 (29.5,34.6) | 21.7 (16.1,28.5) | 26.2 (20.8,32.4) | 32.8 (30.0,35.6) | 0.011 |
| Ghana 2014 | 39.1 (36.3,41.9) | 29.6 (25.9,33.6) | 52.2 (37.5,66.5) | 46.2 (42.6,49.8) | 0.001 |
| Guatemala 2014–2015 | 12.1 (11.3,13.0) | 9.3 (8.1,10.6) | 9.1 (6.8,12.1) | 13.6 (12.5,14.8) | 0.001 |
| Guinea 2018 | 43.8 (41.6,46.0) | 40.4 (36.7,44.3) | 23.9 (14.3,37.2) | 45.7 (43.0,48.3) | 0.001 |
| Haiti 2016–2017 | 37.5 (35.7,39.3) | 36.4 (33.0,40.0) | 54.4 (42.1,66.2) | 37.2 (35.1,39.3) | 0.005 |
| India 2015–2016 | 30.7 (30.4,31.0) | 28.7 (27.9,29.5) | 32.8 (31.0,34.7) | 31.3 (30.9,31.7) | 0.001 |
| Kenya 2014 | NA | NA | NA | NA | |
| Malawi 2015–2016 | 36.1 (34.2,38.1) | 29.4 (23.9,35.6) | ND | 37.1 (35.0,39.2) | 0.020 |
| Mali 2018 | 56.7 (54.6,58.8) | 45.1 (41.2,49.2) | 43.1 (31.4,55.5) | 59.7 (57.2,62.1) | 0.001 |
| Myanmar 2015–2016 | 26.7 (24.7,28.9) | 20.3 (15.5,26.2) | 27.4 (19.9,36.4) | 27.6 (25.3,30.1) | 0.087 |
| Nepal 2016 | 26.4 (24.0,29.1) | 21.5 (18.4,24.9) | 24.0 (17.3,32.2) | 31.2 (27.5,35.2) | 0.001 |
| Nigeria 2018 | 41.1 (39.7,42.5) | 31.6 (29.5,33.9) | 48.6 (43.4,53.8) | 46.4 (44.5,48.2) | 0.001 |
| Pakistan 2017–2018 | NA | NA | NA | NA | |
| Rwanda 2014–2015 | 15.8 (14.4,17.2) | 9.0 (7.0,11.6) | 13.4 (5.8,27.8) | 16.9 (15.4,18.5) | 0.001 |
| Senegal 2017 | 41.8 (40.2,43.4) | 29.7 (27.3,32.2) | 48.9 (42.9,54.8) | 48.1 (46.2,50.0) | 0.001 |
| South Africa 2016 | 37.0 (32.9,41.3) | 41.2 (34.0,48.9) | ND | 32.9 (29.1,36.9) | 0.108 |
| Tanzania 2015–2016 | 31.3 (29.6,33.0) | 26.0 (23.8,28.3) | 38.8 (25.1,54.6) | 32.6 (30.6,34.7) | 0.001 |
| Uganda 2016 | 29.1 (27.3,31.1) | 24.2 (20.1,28.8) | 25.4 (17.9,34.6) | 30.2 (28.1,32.4) | 0.060 |
| Zambia 2018 | 29.5 (28.1,30.9) | 30.3 (27.8,32.9) | 29.9 (24.1,36.5) | 29.1 (27.4,30.8) | 0.694 |
Publisher’s Note: MDPI stays neutral with regard to jurisdictional claims in published maps and institutional affiliations. |
© 2020 by the authors. Licensee MDPI, Basel, Switzerland. This article is an open access article distributed under the terms and conditions of the Creative Commons Attribution (CC BY) license (http://creativecommons.org/licenses/by/4.0/).
Share and Cite
Assaf, S.; Juan, C. Stunting and Anemia in Children from Urban Poor Environments in 28 Low and Middle-income Countries: A Meta-analysis of Demographic and Health Survey Data. Nutrients 2020, 12, 3539. https://doi.org/10.3390/nu12113539
Assaf S, Juan C. Stunting and Anemia in Children from Urban Poor Environments in 28 Low and Middle-income Countries: A Meta-analysis of Demographic and Health Survey Data. Nutrients. 2020; 12(11):3539. https://doi.org/10.3390/nu12113539
Chicago/Turabian StyleAssaf, Shireen, and Christina Juan. 2020. "Stunting and Anemia in Children from Urban Poor Environments in 28 Low and Middle-income Countries: A Meta-analysis of Demographic and Health Survey Data" Nutrients 12, no. 11: 3539. https://doi.org/10.3390/nu12113539
APA StyleAssaf, S., & Juan, C. (2020). Stunting and Anemia in Children from Urban Poor Environments in 28 Low and Middle-income Countries: A Meta-analysis of Demographic and Health Survey Data. Nutrients, 12(11), 3539. https://doi.org/10.3390/nu12113539