Evaluation of the Accurateness of the Nutritional Labels of Processed and Ultra-Processed Products Available in Supermarkets of Ecuador

 ,
,  ,
,  and
and 
Abstract
1. Introduction
2. Methods and Materials
2.1. Consistency of the Information Reported on the Nutrition Labels
2.2. Statistical Analysis
3. Results
4. Discussion
5. Conclusions
Author Contributions
Funding
Acknowledgments
Conflicts of Interest
References
- Organización Mundial de la Salud. Available online: https://www.who.int/es/news-room/fact-sheets/detail/obesity-and-overweight (accessed on 30 May 2020).
- Shekar, M. Why This Report Now? In Obesity Health and Economic Consequences of an Impending Global Challenge; Development Perspectives Series; Shekar, M., Popkin, B., Eds.; World Bank: Washington, DC, USA, 2020; pp. 20–26. Available online: https://openknowledge.worldbank.org/bitstream/handle/10986/32383/9781464814914.pdf (accessed on 30 May 2020).
- Instituto Nacional de Estadísticas y Censos (INEC). Available online: https://www.ecuadorencifras.gob.ec/salud-salud-reproductiva-y-nutricion/ (accessed on 3 July 2020).
- Freire, W.B.; Ramírez Luzuriaga, M.J.; Belmont, P.; Mendieta, M.J.; Silva-Jaramillo, K.; Romero, N.; Sáenz, K.; Piñeiros, P.; Gómez, L.F.; Monge, R. Tomo 1: Encuesta Nacional de Salud y Nutrición de La Población Ecuatoriana de 0 a 59 Años. ENSANUT-ECU 2012; Ministerio de Salud Pública/Instituto Nacional de Estadísticas y Censos: Quito, Ecuador, 2014. [Google Scholar]
- Organización Panamericana de la Salud; Organización Mundial de la Salud. Alimentos y Bebidas Ultraprocesados En América Latina: Tendencias, Efecto Sobre La Obesidad e Implicaciones Para Las Políticas Públicas; Organización Panamericana de la Salud/Organización Mundial de la Salud: Washington, DC, USA, 2015; Available online: https://www.paho.org/hq/index.php?option=com_content&view=article&id=11153:ultra-processed-food-and-drink-products&Itemid=1969&lang=es (accessed on 17 July 2019).
- Monteiro, C.A.; Cannon, G.; Moubarac, J.-C.; Levy, R.B.; Louzada, M.L.C.; Jaime, P.C. The UN Decade of Nutrition, the NOVA Food Classification and the Trouble with Ultra-Processing. Public Health Nutr. 2018, 21, 5–17. [Google Scholar] [CrossRef]
- Organización Panamericana de la Salud Ecuador. Alimentos y Bebidas Ultraprocesados En América Latina: Ventas, Fuentes, Perfiles de Nutrientes e Implicaciones normativas; Organización Panamericana de la Salud Ecuador: Washington, DC, USA, 2019; Available online: https://iris.paho.org/handle/10665.2/51523 (accessed on 10 September 2019).
- Mora-Plazas, M.; Gómez, L.F.; Miles, D.R.; Parra, D.C.; Taillie, L.S. Nutrition Quality of Packaged Foods in Bogotá, Colombia: A Comparison of Two Nutrient Profile Models. Nutrients 2019, 11, 1011. [Google Scholar] [CrossRef]
- Instituto Nacional de Estadísticas y Censos (INEC). Available online: https://www.ecuadorencifras.gob.ec/documentos/web-inec/Sitios/Defunciones/ (accessed on 20 July 2020).
- Mendis, S.; Armstrong, T.; Bettcher, D.; Branca, F.; Lauer, J.; Mace, C.; Poznyak, V.; Riley, L.; Da Costa, V.; Stevens, G. Informe de La Situación Mundial de Las Enfermedades No Trasmisibles 2014 “Cumplimiento de Las Nueve Metas Mundiales Relativas a Las Enfermedades No Transmisibles: Una Responsabilidad Compartida”; Organización Mundial de la Salud: Ginebra, Switzerland, 2014; Available online: https://www.who.int/nmh/publications/ncd-status-report-2014/es/ (accessed on 17 July 2020).
- Kaufer-Horwitz, M.; Tolentino-Mayo, L.; Jáuregui, A.; Sánchez-Bazán, K.; Bourges, H.; Martínez, S.; Perichart, O.; Rojas-Russell, M.; Moreno, L.; Hunot, C.; et al. Sistema de etiquetado frontal de alimentos y bebidas para México: Una estrategia para la toma de decisiones saludables. Salud Pública Mex. 2018, 60, 479–486. [Google Scholar] [CrossRef] [PubMed]
- UNICEF. El Etiquetado Frontal de Alimentos y Bebidas Aprobado en México, “de los Mejores del Mundo”. Available online: https://www.unicef.org/mexico/comunicados-prensa/unicef-el-etiquetado-frontal-de-alimentos-y-bebidas-aprobado-en-m%C3%A9xico-de-los (accessed on 11 June 2020).
- Díaz, A.A.; Veliz, P.M.; Rivas-Mariño, G.; Mafla, C.V.; Altamirano, L.M.M.; Jones, C.V. Etiquetado de alimentos en Ecuador: Implementación, resultados y acciones pendientes. Rev. Panam. Salud Pública 2017, 41, e54. [Google Scholar] [CrossRef]
- Freire, W.B.; Waters, W.F.; Rivas-Mariño, G.; Nguyen, T.; Rivas, P. A qualitative study of consumer perceptions and use of traffic light food labelling in Ecuador. Public Health Nutr. 2016, 20, 805–813. [Google Scholar] [CrossRef] [PubMed]
- Padilla, P.D.R.; Arias, T.V.C.; López, V.C.D.; Barriga, V.D.V.; Andrade, C.E.; Fernández-Sáez, J. Actitudes y prácticas de la población en relación al etiquetado de tipo “semáforo nutricional” en Ecuador. Rev. Esp. Nutr. Hum. Diet. 2017, 21, 121–129. [Google Scholar] [CrossRef][Green Version]
- Guevara, A.F.P. Impacto del sistema de alertas “semáforo” de contenido de azúcar, sal y grasa en etiquetas de alimentos procesados: Enfoque cualitativo. Univ. Rev. Cienc. Soc. Hum. 2016, 25, 175–186. [Google Scholar]
- Agencia Nacional de Regulación, Control y Vigilancia Sanitaria. Reglamento Técnico Ecuatoriano RTE INEN 022 (2R) “Rotulado de Productos Alimenticios Procesados, Envasados y Empaquetados”. Available online: https://www.controlsanitario.gob.ec/documentos-vigentes/ (accessed on 16 July 2019).
- Organización Mundial de la Salud; Organización de las Naciones Unidas para la Alimentación y la Agricultura. Etiquetado de Alimentos, 5th ed.; Organización de las Naciones Unidas para la Alimentación y la Agricultura (FAO): Roma, Italy, 2007; Available online: http://www.fao.org/3/a-a1390s.pdf (accessed on 16 July 2019).
- Obesity Evidence Hub. Front-of-Pack Nutrition Labelling. Available online: https://www.obesityevidencehub.org.au/collections/prevention/front-of-pack-nutrition-labelling (accessed on 19 October 2020).
- Jáuregui, A.; Vargas-Meza, J.; Nieto, C.; Contreras-Manzano, A.; Alejandro, N.Z.; Tolentino-Mayo, L.; Hall, M.G.; Barquera, S. Impact of Front-of-Pack Nutrition Labels on Consumer Purchasing Intentions: A Randomized Experiment in Low- and Middle-Income Mexican Adults. BMC Public Health 2020, 20, 463. [Google Scholar] [CrossRef]
- Egnell, M.; Talati, Z.; Hercberg, S.; Pettigrew, S.; Julia, C. Objective Understanding of Front-of-Package Nutrition Labels: An International Comparative Experimental Study across 12 Countries. Nutrients 2018, 10, 1542. [Google Scholar] [CrossRef] [PubMed]
- Organización Panamericana de la Salud; Organización Mundial de la Salud. Modelo del Perfil de Nutrientes de la Organización Panamericana de la Salud; Organización Panamericana de la Salud/Organización Mundial de la Salud: Washington, DC, USA, 2016. [Google Scholar]
- Fundación Iberoamericana de Nutrición (FINUT). Perfiles Nutricionales: Intencionalidad Científica Versus Impacto Real En Salud Pública; científico-técnico; FINUT: Granada, Spain, 2016; Available online: https://www.finut.org/wp-content/uploads/2016/03/Perfiles-Nutricionales_FINAL_con_portadas_15032016_pdf.pdf (accessed on 15 October 2020).
- Scarborough, P.; Matthews, A.; Eyles, H.; Kaur, A.; Hodgkins, C.; Raats, M.M.; Rayner, M. Reds Are More Important than Greens: How UK Supermarket Shoppers Use the Different Information on a Traffic Light Nutrition Label in a Choice Experiment. Int. J. Behav. Nutr. Phys. Act. 2015, 12, 151. [Google Scholar] [CrossRef] [PubMed]
- INFORMAS|International Network for Food and Obesity/Non-Communicable Disease Research, Monitoring and Action Support. Available online: https://www.informas.org/ (accessed on 23 August 2020).
- Rayner, D.M.; Vandevijvere, S. INFORMAS Protocol: Food Labelling Module; The University of Auckland: Auckland, New Zealand, 6 December 2017. [Google Scholar] [CrossRef]
- Yusta-Boyo, M.J.; Bermejo, L.M.; García-Solano, M.; López-Sobaler, A.M.; Ortega, R.M.; García-Pérez, M.; Dal-Re Saavedra, M.Á.; on behalf of the SUCOPROFS Study Researchers. Sugar Content in Processed Foods in Spain and a Comparison of Mandatory Nutrition Labelling and Laboratory Values. Nutrients 2020, 12, 1078. [Google Scholar] [CrossRef] [PubMed]
- Ahuja, J.K.C.; Li, Y.; Nickle, M.S.; Haytowitz, D.B.; Roseland, J.; Nguyen, Q.; Khan, M.; Wu, X.; Somanchi, M.; Williams, J.; et al. Comparison of Label and Laboratory Sodium Values in Popular Sodium-Contributing Foods in the United States. J. Acad. Nutr. Diet. 2019, 119, 293–300.e17. [Google Scholar] [CrossRef] [PubMed]
- Fitzpatrick, L.; Arcand, J.; L’Abbé, M.R.; Deng, M.; Duhaney, T.; Campbell, N.R.C. Accuracy of Canadian Food Labels for Sodium Content of Food. Nutrients 2014, 6, 3326–3335. [Google Scholar] [CrossRef] [PubMed]
- Kanter, R.; Reyes, M.; Corvalán, C. Photographic Methods for Measuring Packaged Food and Beverage Products in Supermarkets. Curr. Dev. Nutr. 2017, 1, e001016. [Google Scholar] [CrossRef]
- Viera, A.J.; Garrett, J.M. Understanding interobserver agreement: The kappa statistic. Fam. Med. 2005, 37, 360–363. [Google Scholar]
- Agencia Nacional de Regulación, Control y Vigilancia Sanitaria. Rotulado de Productos Alimenticios Para Consumo Humano. Parte 2. Rotulado Nutricional. Requisitos. Available online: https://www.controlsanitario.gob.ec/documentos-vigentes/ (accessed on 16 July 2019).
- Cruz-Casarrubias, C.; Tolentino-Mayo, L.; Nieto, C.; Théodore, F.L.; Monterrubio-Flores, E. Use of advertising strategies to target children in sugar-sweetened beverages packaging in Mexico and the nutritional quality of those beverages. Pediatr. Obes. 2020, e12710. [Google Scholar] [CrossRef]
- Camacho, N.A.S.; De Sonora, U.E.; Hurtado, S.V.; Zavala, G.L.; Ibarra, L.I.F. Consumo de edulcorantes no nutritivos: Efectos a nivel celular y metabólico. Perspect. Nutr. Hum. 2018, 20, 185–202. [Google Scholar] [CrossRef]
- Toews, I.; Lohner, S.; De Gaudry, D.K.; Sommer, H.; Meerpohl, J.J. Association between intake of non-sugar sweeteners and health outcomes: Systematic review and meta-analyses of randomised and non-randomised controlled trials and observational studies. BMJ 2019, 364, k4718. [Google Scholar] [CrossRef]
- Talati, Z.; Egnell, M.; Hercberg, S.; Julia, C.; Pettigrew, S. Consumers’ Perceptions of Five Front-of-Package Nutrition Labels: An Experimental Study across 12 Countries. Nutrients 2019, 11, 1934. [Google Scholar] [CrossRef]
- Valverde-Aguilar, M.; Espadín-Alemán, C.C.; Ramos, N.E.T.; Liria-Domínguez, R. Preferencia de etiquetado nutricional frontal: Octógono frente a semáforo GDA en mercados de Lima, Perú. Acta Med. Peru. 2019, 35, 145–152. [Google Scholar] [CrossRef]
- Carrillo, E.P.; Flores, N.; Fornasini, M.; Baldeón, M.E. Identificación, Uso e Impacto Potencial Del Sistema Gráfico de Rotulado de Alimentos Tipo Semáforo En Quito. Rev. Ecu. Med. Eugenio Espejo 2017, 7, 34–44. [Google Scholar]
- Agencia Nacional de Regulación, Control y Vigilancia Sanitaria. Available online: http://permisosfuncionamiento.controlsanitario.gob.ec/publico/calculadora_etiquetado/ (accessed on 6 July 2020).
- Carrillo, P.; Fornasini, M.; Flores, N.; Cordero, J.; Villacís, A.; Baldeón, M. Cumplimiento del reglamento de rotulado gráfico de alimentos en Ecuador. Rev. Ecu. Med. Eugenio Espejo 2019, 7, 1–4. [Google Scholar]
- Presidencia del Congreso Nacional. 76 Ley del Sistema Ecuatoriano de la Calidad. Available online: https://www.gob.ec/regulaciones/76-ley-sistema-ecuatoriano-calidad (accessed on 24 October 2020).
- World Cancer Research Fund International. Nourishing and Moving Policy Databases. Available online: https://policydatabase.wcrf.org/level_one?page=nourishing-level-one#step2=0#step3=309 (accessed on 24 October 2020).
- Secretaria de Economía. Modificación a la Norma Oficial Mexicana NOM-051-SCFI/SSA1-2010, Especificaciones Generales de Etiquetado para Alimentos y Bebida No Alcohólicas Preenvasados—Información Comercial y Sanitaria, Publicada el 5 de Abril de 2010. Available online: https://www.dof.gob.mx/2020/SEECO/NOM_051.pdf (accessed on 24 October 2020).
- Ministerio de Salud. Manual de Etiquetado Nutricional de Alimentos. 2019. Available online: http://www.indap.gob.cl/docs/default-source/default-document-library/manual-de-etiquetado-minsal-vf.pdf?sfvrsn=0 (accessed on 24 October 2020).
- Ministerio de Salud. Resolución Ministerial N° 683-2017-MINSA. Available online: https://www.gob.pe/institucion/minsa/normas-legales/188830-683-2017-minsa (accessed on 24 October 2020).
- Tapia Álvarez, M.; Campillo Carrete, B.; Cruickshank Soria, S.; Morales Sotomayor, G. Manual de Incidencia de Las Políticas Públicas, 1st ed.; Alternativas y Capacidades A.C.: Ciudad de México, Mexico, 2010; Available online: https://alternativasycapacidades.org/wp-content/uploads/2019/04/Manual-Incidencia-en-Politicas-Publicas.pdf (accessed on 17 October 2020).
- Rosentreter, S.C.; Eyles, H.; Mhurchu, C.N. Traffic Lights and Health Claims: A Comparative Analysis of the Nutrient Profile of Packaged Foods Available for Sale in New Zealand Supermarkets. Aust. N. Z. J. Public Health 2013, 37, 278–283. [Google Scholar] [CrossRef] [PubMed]
- Agencia Nacional de Regulación, Control y Vigilancia Sanitaria. Rotulado de Productos Alimenticios Para Consumo Humano. Parte 3. Requisitos Para Declaraciones Nutricionales y Declaraciones Saludables. Available online: https://www.controlsanitario.gob.ec/documentos-vigentes/ (accessed on 31 August 2020).
- Nieto, C.; Rincon-Gallardo Patiño, S.; Tolentino-Mayo, L.; Carriedo, A.; Barquera, S. Characterization of Breakfast Cereals Available in the Mexican Market: Sodium and Sugar Content. Nutrients 2017, 9, 884. [Google Scholar] [CrossRef]
- Reyes, M.; Taillie, L.S.; Popkin, B.; Kanter, R.; Vandevijvere, S.; Corvalán, C. Changes in the Amount of Nutrient of Packaged Foods and Beverages after the Initial Implementation of the Chilean Law of Food Labelling and Advertising: A Nonexperimental Prospective Study. PLoS Med. 2020, 17, e1003220. [Google Scholar] [CrossRef]
- Peñaherrera, V.; Carpio, C.; Sandoval, L.; Sánchez, M.; Cabrera, T.; Guerrero, P.; Borja, I. Efecto Del Etiquetado de Semáforo En El Contenido Nutricional y El Consumo de Bebidas Gaseosas En Ecuador. Rev. Panam. Salud Pública 2018, 42. [Google Scholar] [CrossRef] [PubMed]


| Components | Level | ||
|---|---|---|---|
| “Low” Concentration | “Medium” Concentration | “High” Concentration | |
| Total Fat | ≤3 g per 100 g | >3 g and <20 g per 100 g | ≥20 g per 100 g |
| ≤1.5 g per 100 mL | >1.5 g and <10 g per 100 mL | ≥10 g per 100 mL | |
| Sugar | ≤5 g per 100 g | >5 g and <15 g per 100 g | ≥15 g per 100 g |
| ≤2.5 g per 100 mL | >2.5 g and <7.5 g per 100 mL | ≥7.5 g per 100 mL | |
| Salt (Sodium) | ≤120 mg per 100 g | >120 mg and <600 mg per 100 g | ≥600 mg per 100 g |
| ≤120 mg per 100 mL | >120 mg and <600 mg per 100 mL | ≥600 mg per 100 mL | |
| Total Products n % | Statement on Sweeteners % | Traffic Light Label % | Ingredient List % | Nutrition Table % | ||
|---|---|---|---|---|---|---|
| Sugar-sweetened beverages | 265 | 15.4 | 58.1 | 94.3 | 100.0 | 100.0 |
| Breakfast cereals and granola | 137 | 7.9 | 5.8 | 89.8 | 100.0 | 100.0 |
| Sausages | 61 | 3.5 | 0.0 | 100.0 | 100.0 | 100.0 |
| Canned foods | 179 | 10.4 | 0.0 | 100.0 | 100.0 | 100.0 |
| Cookies and crackers | 207 | 12.0 | 5.8 | 100.0 | 99.5 | 100.0 |
| Fats and dressings | 210 | 12.2 | 1.4 | 93.3 | 100.0 | 100.0 |
| Dairy products | 133 | 7.7 | 15.8 | 91.0 | 100.0 | 100.0 |
| Bread and bakery products | 160 | 9.3 | 4.4 | 97.5 | 100.0 | 100.0 |
| Sweet snacks | 173 | 10.0 | 16.2 | 94.2 | 100.0 | 100.0 |
| Salty snacks | 125 | 7.3 | 0.0 | 98.4 | 97.6 | 100.0 |
| Other | 75 | 4.4 | 17.3 | 42.7 | 88.0 | 100.0 |
| Total | 1725 | 100.0 | 14.3 | 93.4 | 99.3 | 100.0 |
| Low | Medium | High | ||||
|---|---|---|---|---|---|---|
| Indicator Reported % | Indicator Expected % | Indicator Reported % | Indicator Expected % | Indicator Reported % | Indicator Expected % | |
| Sugar indicator | ||||||
| Sugar-sweetened beverages | 33.9 | 31.0 | 49.0 | 41.6 | 17.1 | 27.4 |
| Breakfast cereals and granola | 11.6 | 10.7 | 27.3 | 30.6 | 61.2 | 58.7 |
| Sausages | 100.0 | 100.0 | 0.0 | 0.0 | 0.0 | 0.0 |
| Canned foods | 97.5 | 97.5 | 2.5 | 1.3 | 0.0 | 1.3 |
| Cookies and crackers | 11.4 | 16.3 | 19.3 | 16.8 | 69.3 | 66.8 |
| Fats and dressings | 40.4 | 39.8 | 19.3 | 24.6 | 40.4 | 35.7 |
| Dairy products | 41.2 | 42.2 | 23.5 | 24.5 | 35.3 | 33.3 |
| Bread and bakery products | 30.2 | 33.8 | 37.5 | 35.3 | 32.4 | 30.9 |
| Sweet snacks | 2.6 | 2.6 | 9.0 | 3.9 | 88.4 | 93.6 |
| Salty snacks | 87.4 | 85.4 | 7.8 | 9.7 | 4.9 | 4.9 |
| Other | 43.5 | 43.5 | 26.1 | 4.4 | 30.4 | 52.2 |
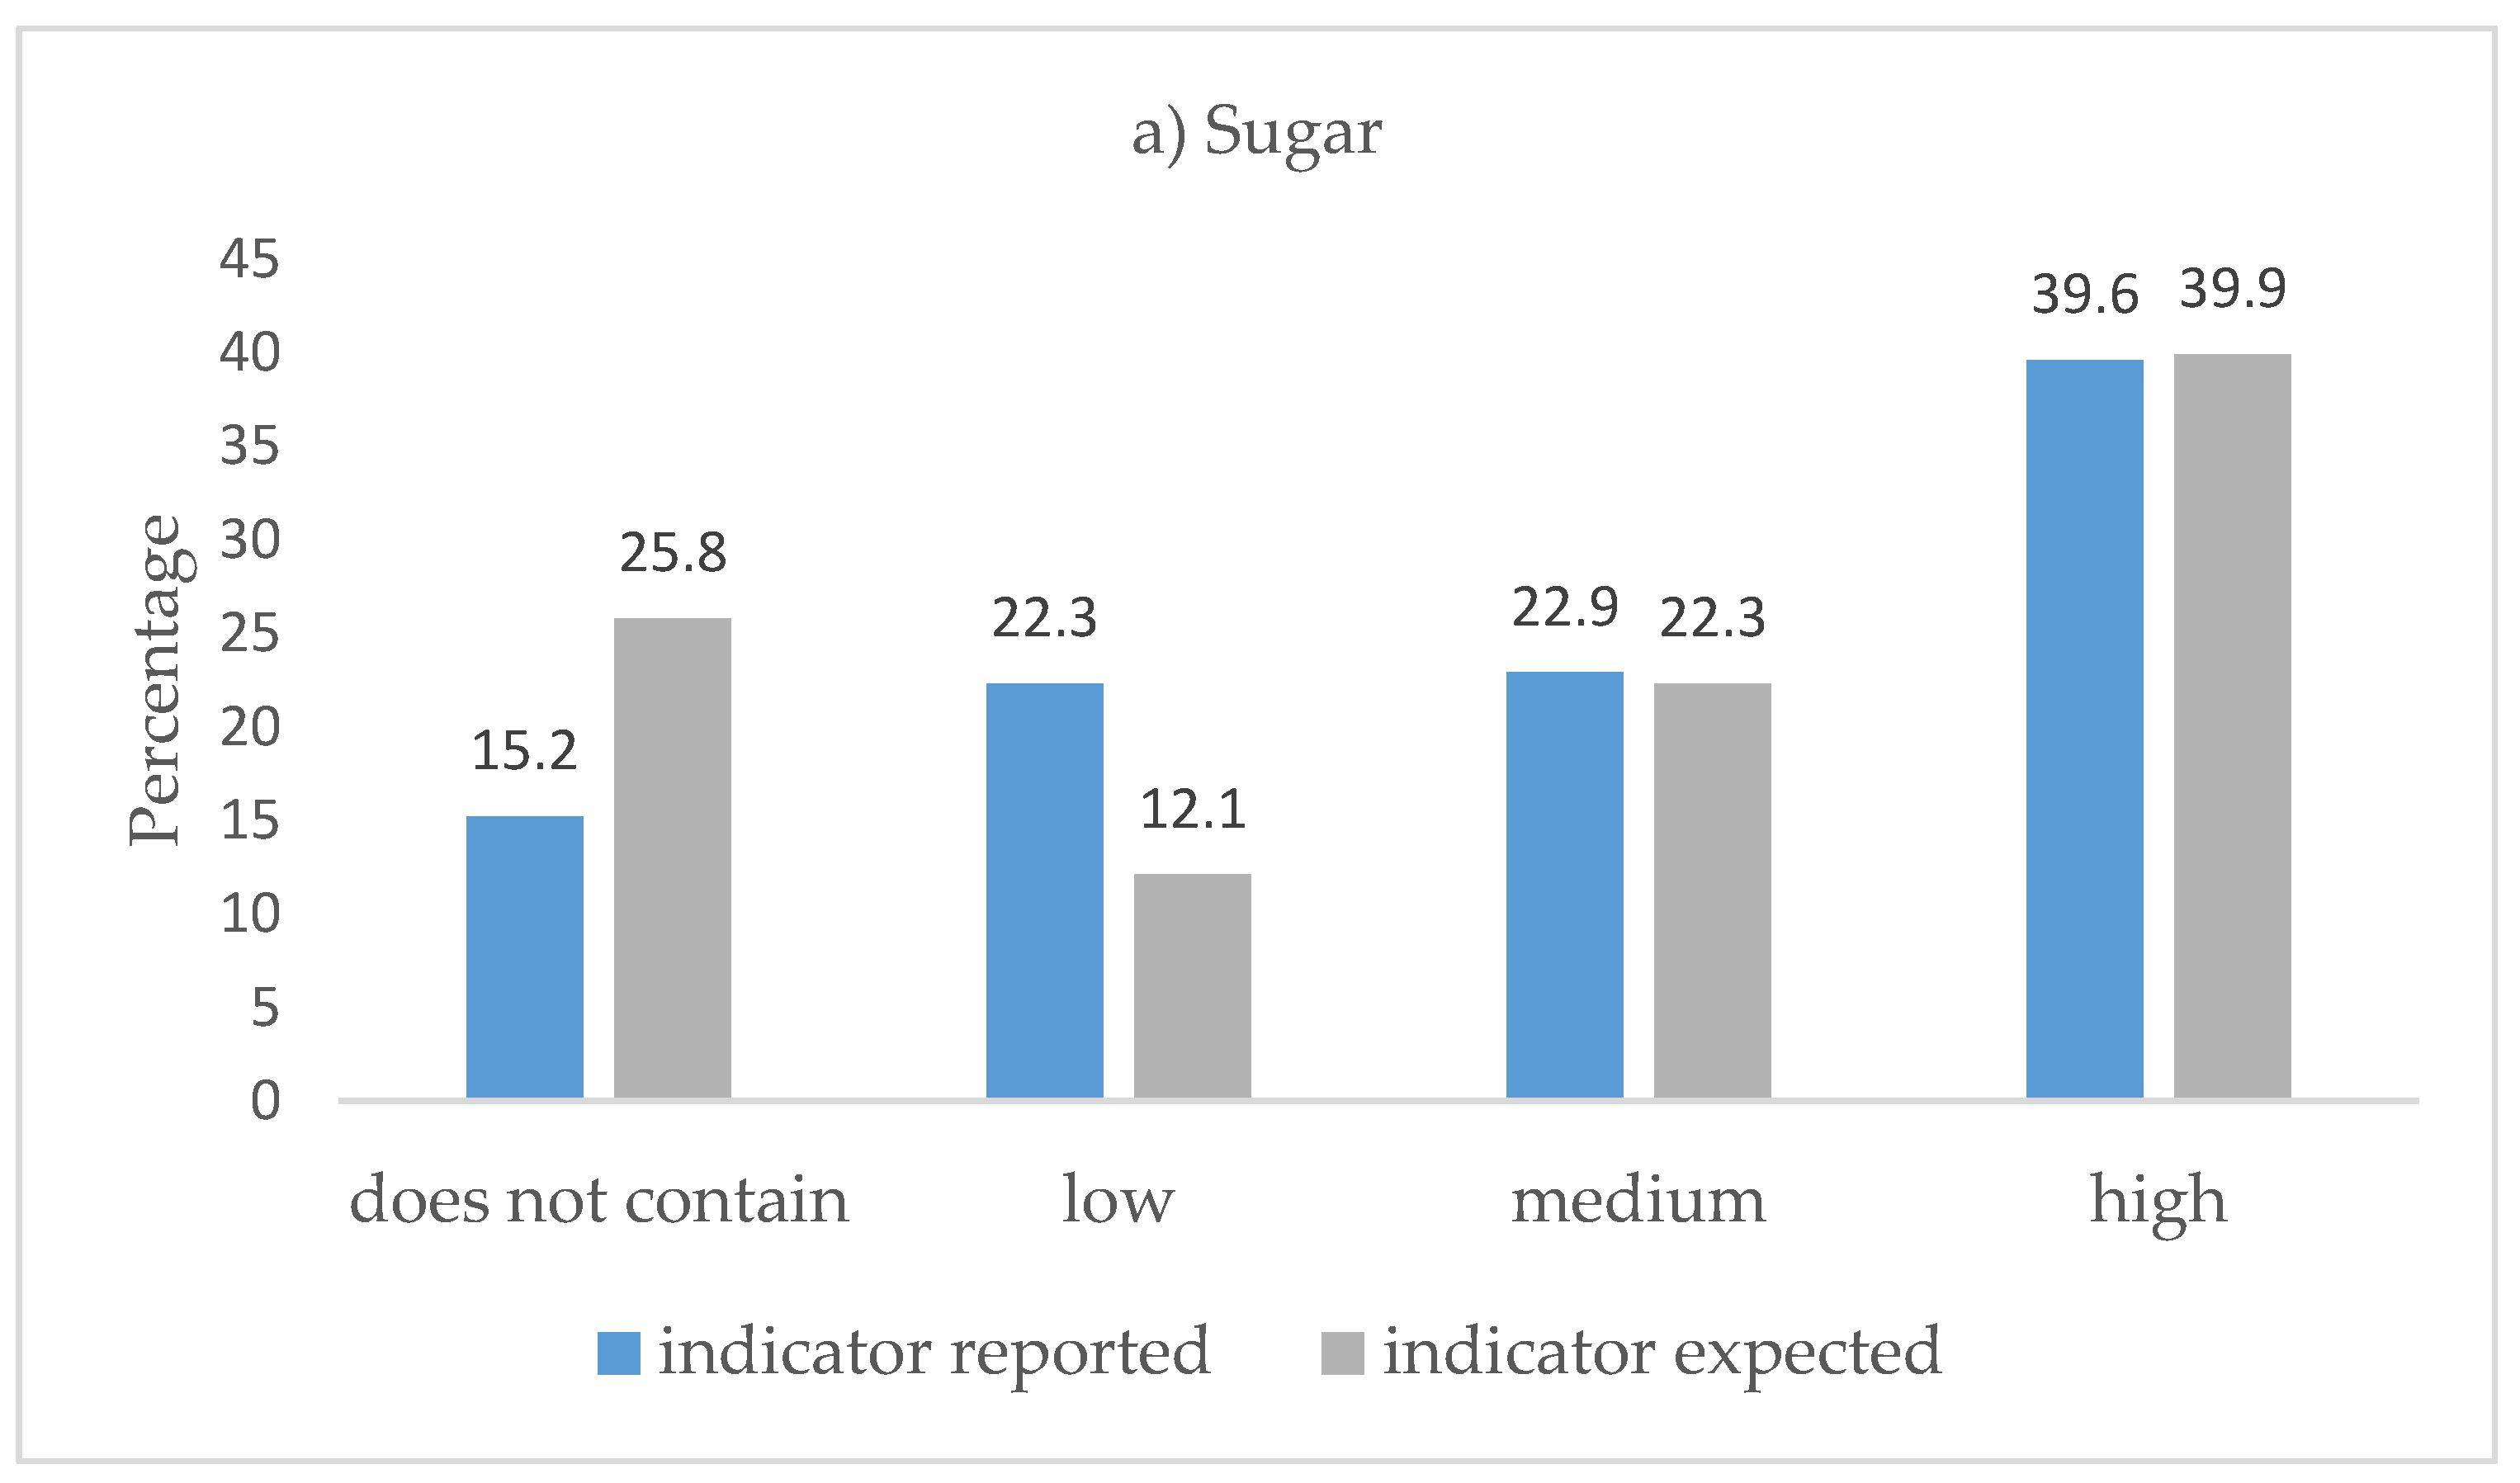
| Total | 38.1 | 38.4 | 23.2 | 21.5 | 38.7 | 40.1 |
| Total fat indicator | ||||||
| Sugar-sweetened beverages | 77.6 | 78.8 | 22.0 | 20.8 | 0.4 | 0.4 |
| Breakfast cereals and granola | 33.1 | 29.8 | 63.6 | 62.0 | 3.3 | 8.3 |
| Sausages | 6.7 | 6.7 | 80.0 | 86.7 | 13.3 | 6.7 |
| Canned foods | 44.9 | 41.8 | 48.1 | 50.6 | 7.0 | 7.6 |
| Cookies and crackers | 0.0 | 0.5 | 55.5 | 50.0 | 44.6 | 49.5 |
| Fats and dressings | 52.6 | 56.7 | 19.3 | 15.2 | 28.1 | 28.1 |
| Dairy products | 13.7 | 24.5 | 63.7 | 46.1 | 22.6 | 29.4 |
| Bread and bakery products | 14.0 | 19.1 | 70.6 | 66.9 | 15.4 | 14.0 |
| Sweet snacks | 38.1 | 39.4 | 14.2 | 14.2 | 47.7 | 46.5 |
| Salty snacks | 0.0 | 0.0 | 20.4 | 12.6 | 79.6 | 87.4 |
| Other | 39.1 | 43.5 | 56.5 | 47.8 | 4.4 | 8.7 |
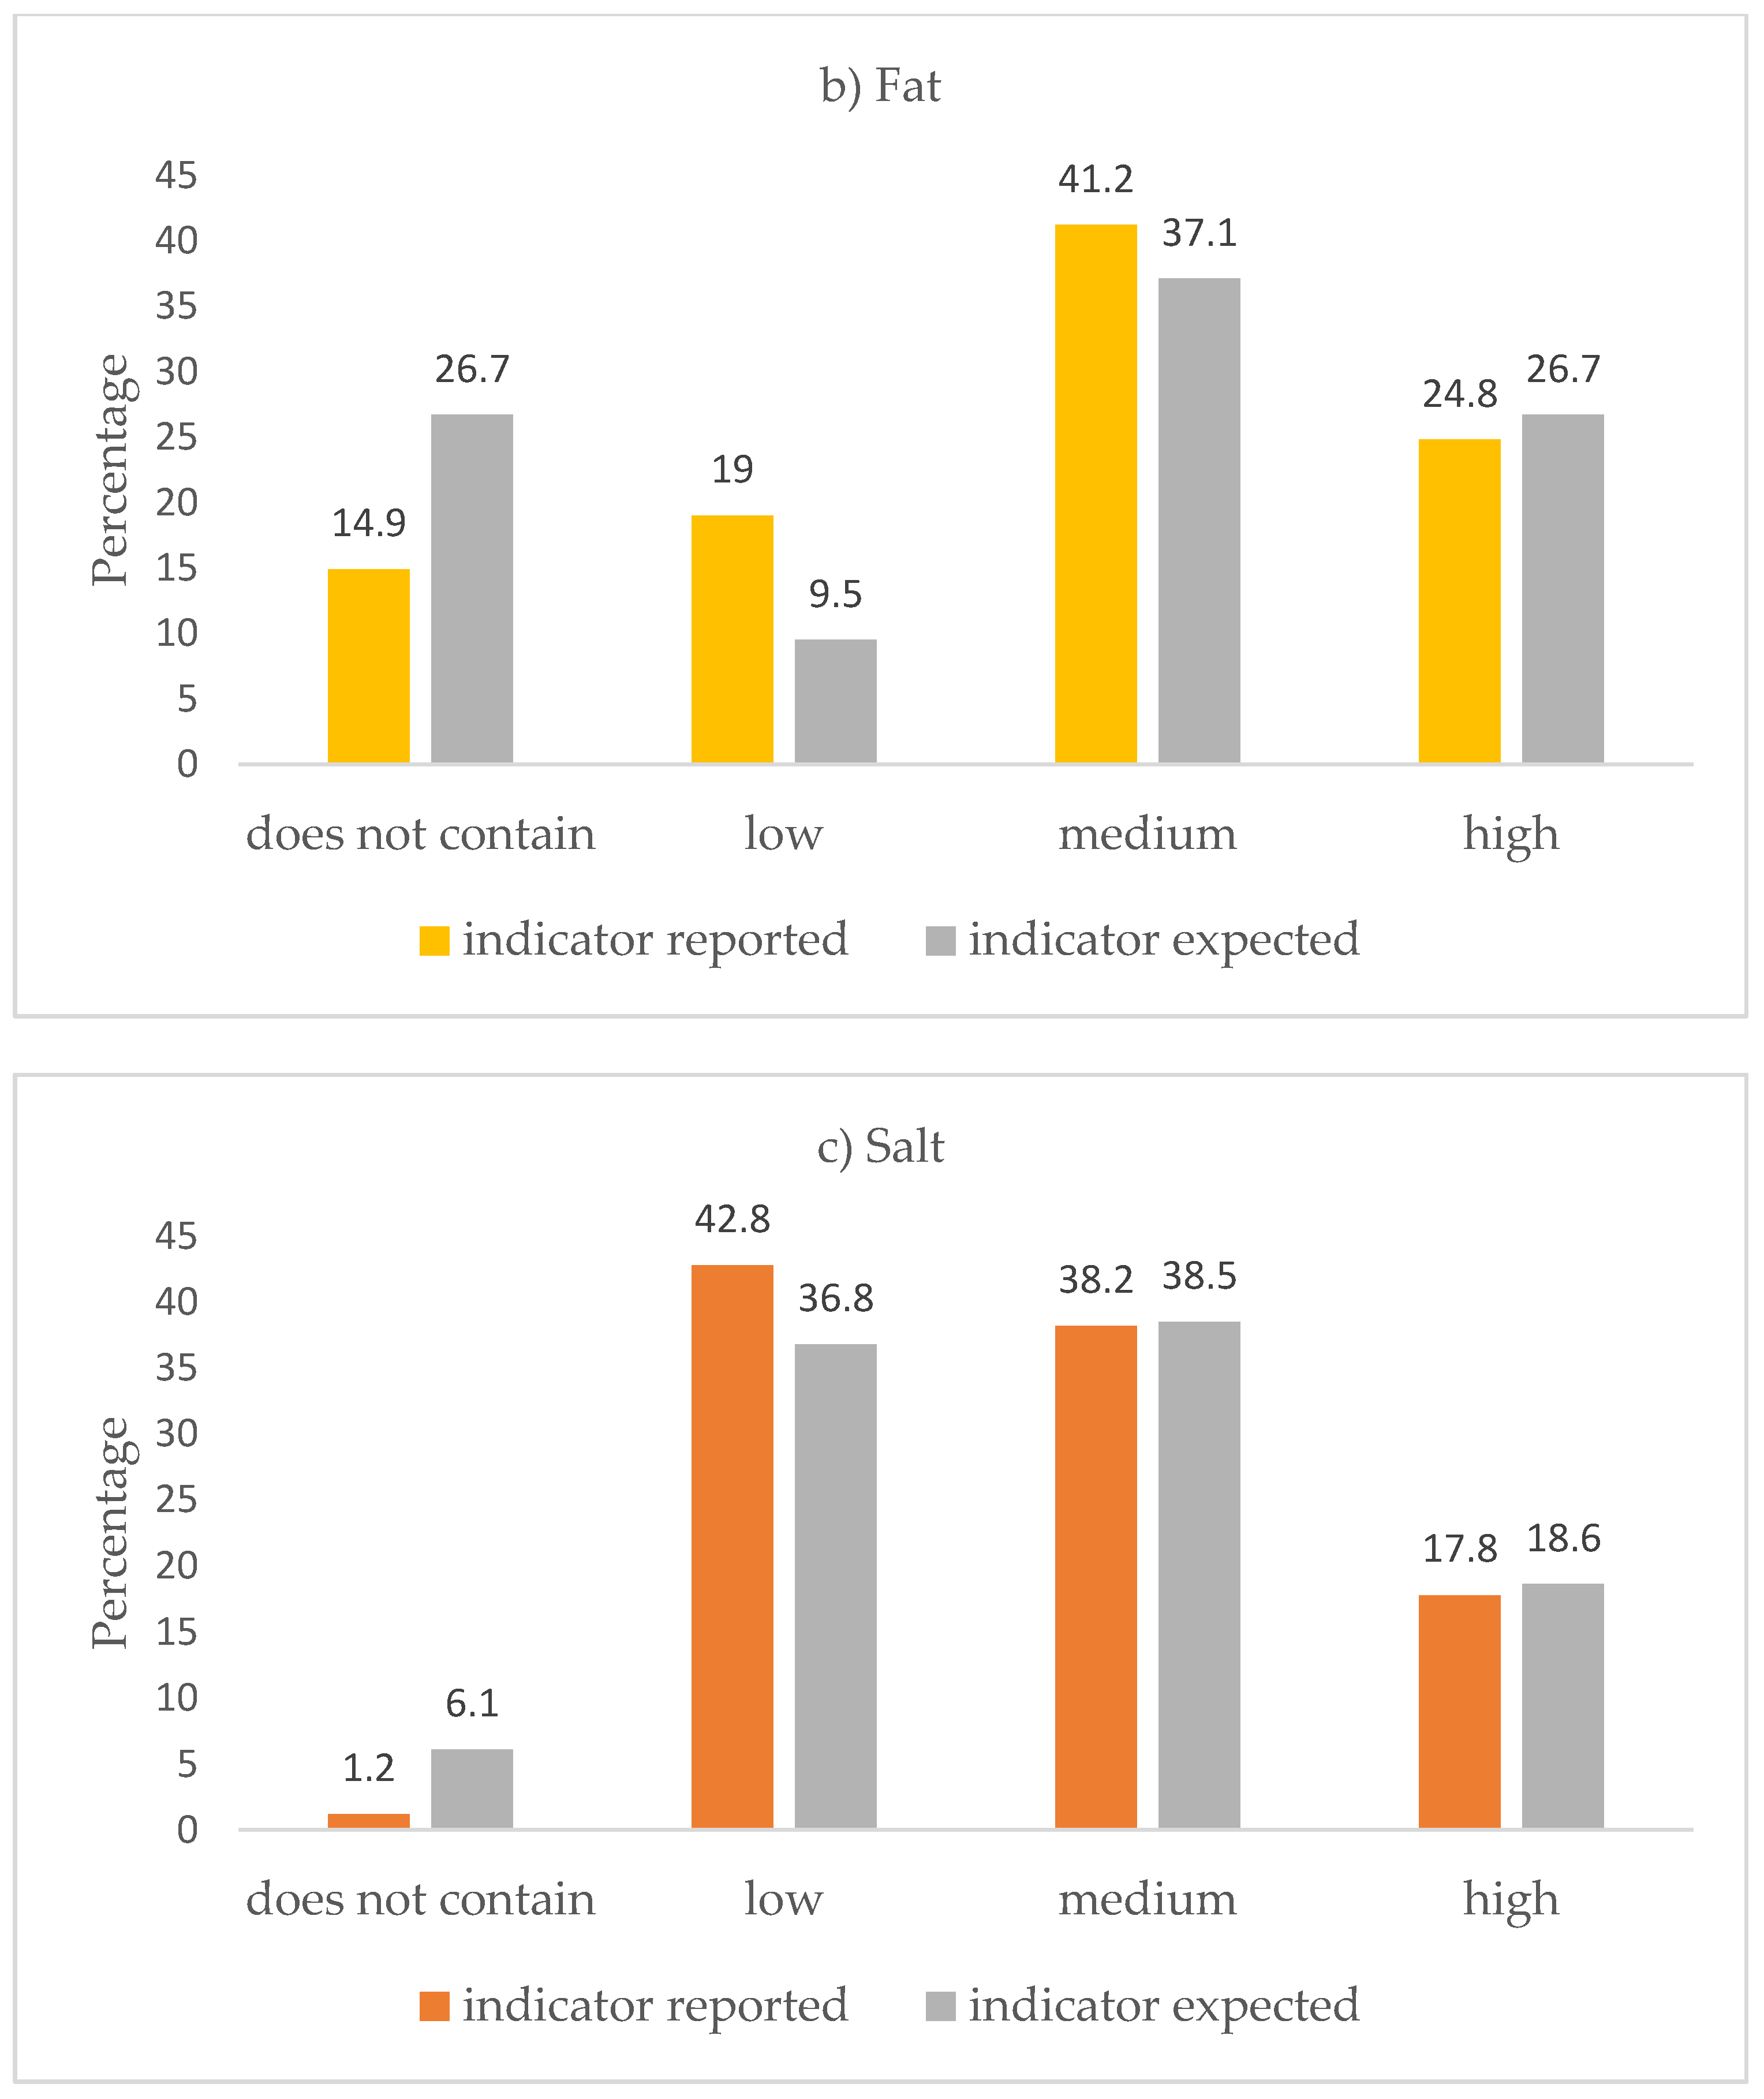
| Total | 34.5 | 36.1 | 40.6 | 37.0 | 25.0 | 26.9 |
| Salt indicator | ||||||
| Sugar-sweetened beverages | 99.2 | 97.6 | 0.8 | 2.5 | 0.0 | 0.0 |
| Breakfast cereals and granola | 43.8 | 44.6 | 52.9 | 52.1 | 3.3 | 3.3 |
| Sausages | 0.0 | 0.0 | 0.0 | 13.3 | 100.0 | 86.7 |
| Canned foods | 6.3 | 3.8 | 63.9 | 66.5 | 29.8 | 29.8 |
| Cookies and crackers | 19.8 | 14.9 | 65.8 | 65.4 | 14.4 | 19.8 |
| Fats and dressings | 14.6 | 17.0 | 26.3 | 24.6 | 59.1 | 58.5 |
| Dairy products | 65.7 | 62.8 | 23.5 | 25.5 | 10.8 | 11.8 |
| Bread and bakery products | 14.0 | 14.7 | 75.7 | 71.3 | 10.3 | 14.0 |
| Sweet snacks | 93.6 | 87.7 | 6.5 | 12.3 | 0.0 | 0.0 |
| Salty snacks | 11.7 | 13.6 | 53.4 | 54.4 | 35.0 | 32.0 |
| Other | 52.2 | 43.5 | 39.1 | 47.8 | 8.7 | 8.7 |
| Total | 43.8 | 42.1 | 38.2 | 39.1 | 18.1 | 18.9 |
| Inconsistency in the TL Indicator | ||||||||
|---|---|---|---|---|---|---|---|---|
| Total n % | TL Not Shown * % | Statement on Sweeteners % | TL Indicators ** % | Sugar % | Fat % | Salt % | ||
| Sugar-sweetened beverages | 265 | 21.1 | 0.4 | 4.9 | 17.6 | 13.9 | 1.6 | 1.5 |
| Breakfast cereals and granola | 137 | 24.8 | 0.0 | 6.6 | 23.1 | 5.0 | 7.4 | 6.6 |
| Sausages | 61 | 36.1 | 0.0 | 0.0 | 20.0 | 0.0 | 13.3 | 23.0 |
| Canned foods | 179 | 15.1 | 0.0 | 0.0 | 14.6 | 1.9 | 6.3 | 7.3 |
| Cookies and crackers | 207 | 28.5 | 0.0 | 3.4 | 24.8 | 8.9 | 10.9 | 12.1 |
| Fats and dressings | 210 | 32.9 | 0.5 | 1.4 | 31.6 | 17.5 | 9.9 | 10.0 |
| Dairy products | 133 | 30.1 | 1.5 | 0.0 | 34.3 | 22.6 | 3.9 | 3.8 |
| Bread and bakery products | 160 | 46.9 | 1.3 | 3.8 | 37.5 | 16.9 | 10.3 | 11.3 |
| Sweet snacks | 173 | 21.4 | 0.6 | 3.5 | 15.5 | 6.5 | 9.7 | 9.8 |
| Salty snacks | 125 | 24.0 | 0.0 | 0.8 | 17.5 | 3.9 | 8.7 | 13.6 |
| Other | 75 | 25.3 | 0.0 | 5.3 | 60.9 | 21.7 | 34.8 | 10.7 |
| Total | 1725 | 27.1 | 0.4 | 2.8 | 24.0 | 10.9 | 10.0 | 8.8 |
| Calculated Indicator | |||||
|---|---|---|---|---|---|
| Low | Medium | High | Consistency | ||
| Reported Indicator | n | % | % | % | K |
| Sugar | |||||
| Low | 545 | 93.6 | 5.1 | 1.3 | 0.8888 |
| Medium | 334 | 10.5 | 74.6 | 15.0 | 0.6858 |
| High | 576 | 1.0 | 8.2 | 90.8 | 0.8421 |
| Fat | |||||
| Low | 494 | 93.3 | 6.5 | 0.2 | 0.8599 |
| Medium | 599 | 10.7 | 80.8 | 8.5 | 0.7537 |
| High | 362 | 0.6 | 6.6 | 92.8 | 0.8599 |
| Salt | |||||
| Low | 640 | 92.5 | 6.6 | 0.9 | 0.8867 |
| Medium | 556 | 4.7 | 90.5 | 4.9 | 0.8401 |
| High | 259 | 2.7 | 5.8 | 91.5 | 0.8729 |
| Sugar | Fat | Salt | ||||
|---|---|---|---|---|---|---|
| Reported indicator | OR | CI 95% | OR | CI 95% | OR | CI 95% |
| Low | 1.0 | - | 1.0 | - | 1.0 | - |
| Medium | 1.98 * | [1.15, 3.39] | 3.95 *** | [2.42, 6.45] | 0.50 * | [0.29, 0.85] |
| High | 1.23 | [0.65, 2.35] | 0.71 | [0.34, 1.50] | 0.31 ** | [0.14, 0.68] |
| Expected indicator | ||||||
| Low | 1.0 | - | 1.0 | - | 1.0 | - |
| Medium | 1.05 | [0.61, 1.81] | 0.28 *** | [1.72, 0.45] | 1.92 * | [1.12, 3.28] |
| High | 0.91 | [0.48, 1.72] | 0.94 | [0.48, 1.87] | 4.16 *** | [1.96, 8.42] |
Publisher’s Note: MDPI stays neutral with regard to jurisdictional claims in published maps and institutional affiliations. |
© 2020 by the authors. Licensee MDPI, Basel, Switzerland. This article is an open access article distributed under the terms and conditions of the Creative Commons Attribution (CC BY) license (http://creativecommons.org/licenses/by/4.0/).
Share and Cite
Morales-Avilez, D.; Cruz-Casarrubias, C.; Tolentino-Mayo, L.; Encalada-Torres, L.; Abril-Ulloa, V. Evaluation of the Accurateness of the Nutritional Labels of Processed and Ultra-Processed Products Available in Supermarkets of Ecuador. Nutrients 2020, 12, 3481. https://doi.org/10.3390/nu12113481
Morales-Avilez D, Cruz-Casarrubias C, Tolentino-Mayo L, Encalada-Torres L, Abril-Ulloa V. Evaluation of the Accurateness of the Nutritional Labels of Processed and Ultra-Processed Products Available in Supermarkets of Ecuador. Nutrients. 2020; 12(11):3481. https://doi.org/10.3390/nu12113481
Chicago/Turabian StyleMorales-Avilez, Diana, Carlos Cruz-Casarrubias, Lizbeth Tolentino-Mayo, Lorena Encalada-Torres, and Victoria Abril-Ulloa. 2020. "Evaluation of the Accurateness of the Nutritional Labels of Processed and Ultra-Processed Products Available in Supermarkets of Ecuador" Nutrients 12, no. 11: 3481. https://doi.org/10.3390/nu12113481
APA StyleMorales-Avilez, D., Cruz-Casarrubias, C., Tolentino-Mayo, L., Encalada-Torres, L., & Abril-Ulloa, V. (2020). Evaluation of the Accurateness of the Nutritional Labels of Processed and Ultra-Processed Products Available in Supermarkets of Ecuador. Nutrients, 12(11), 3481. https://doi.org/10.3390/nu12113481