Impacts of Acute Sucralose and Glucose on Brain Activity during Food Decisions in Humans


Abstract
1. Introduction
Present Study
2. Materials and Methods
2.1. Participants
2.2. Stimuli
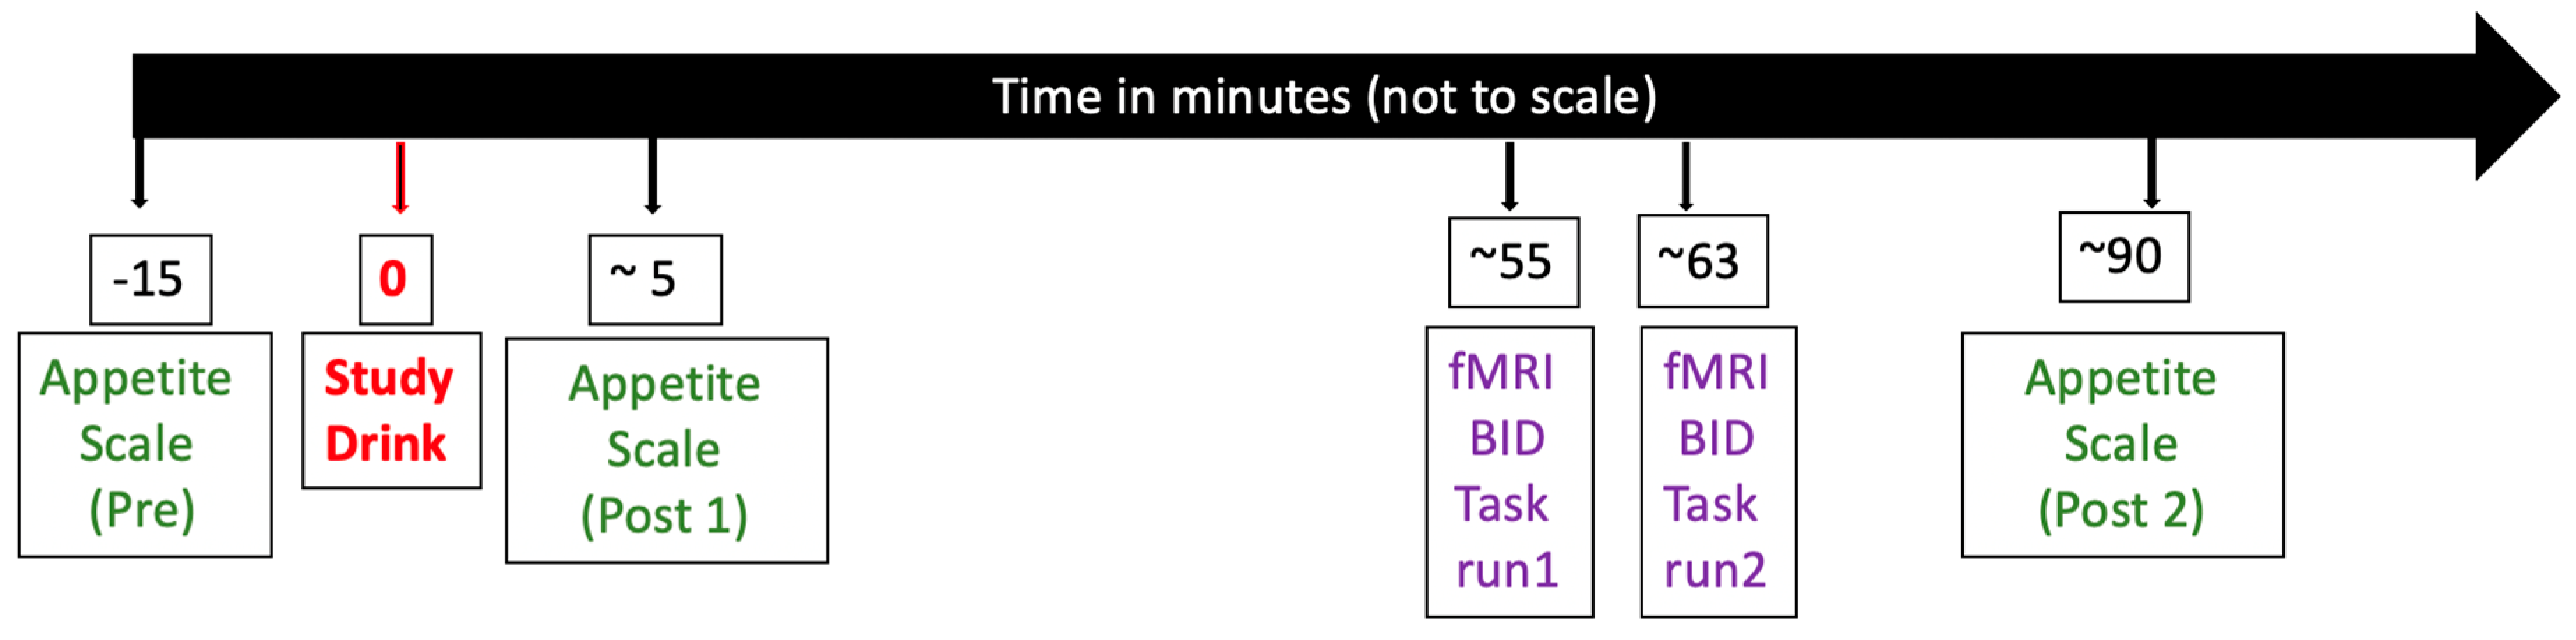
2.3. Procedures
2.4. Appetite Rating
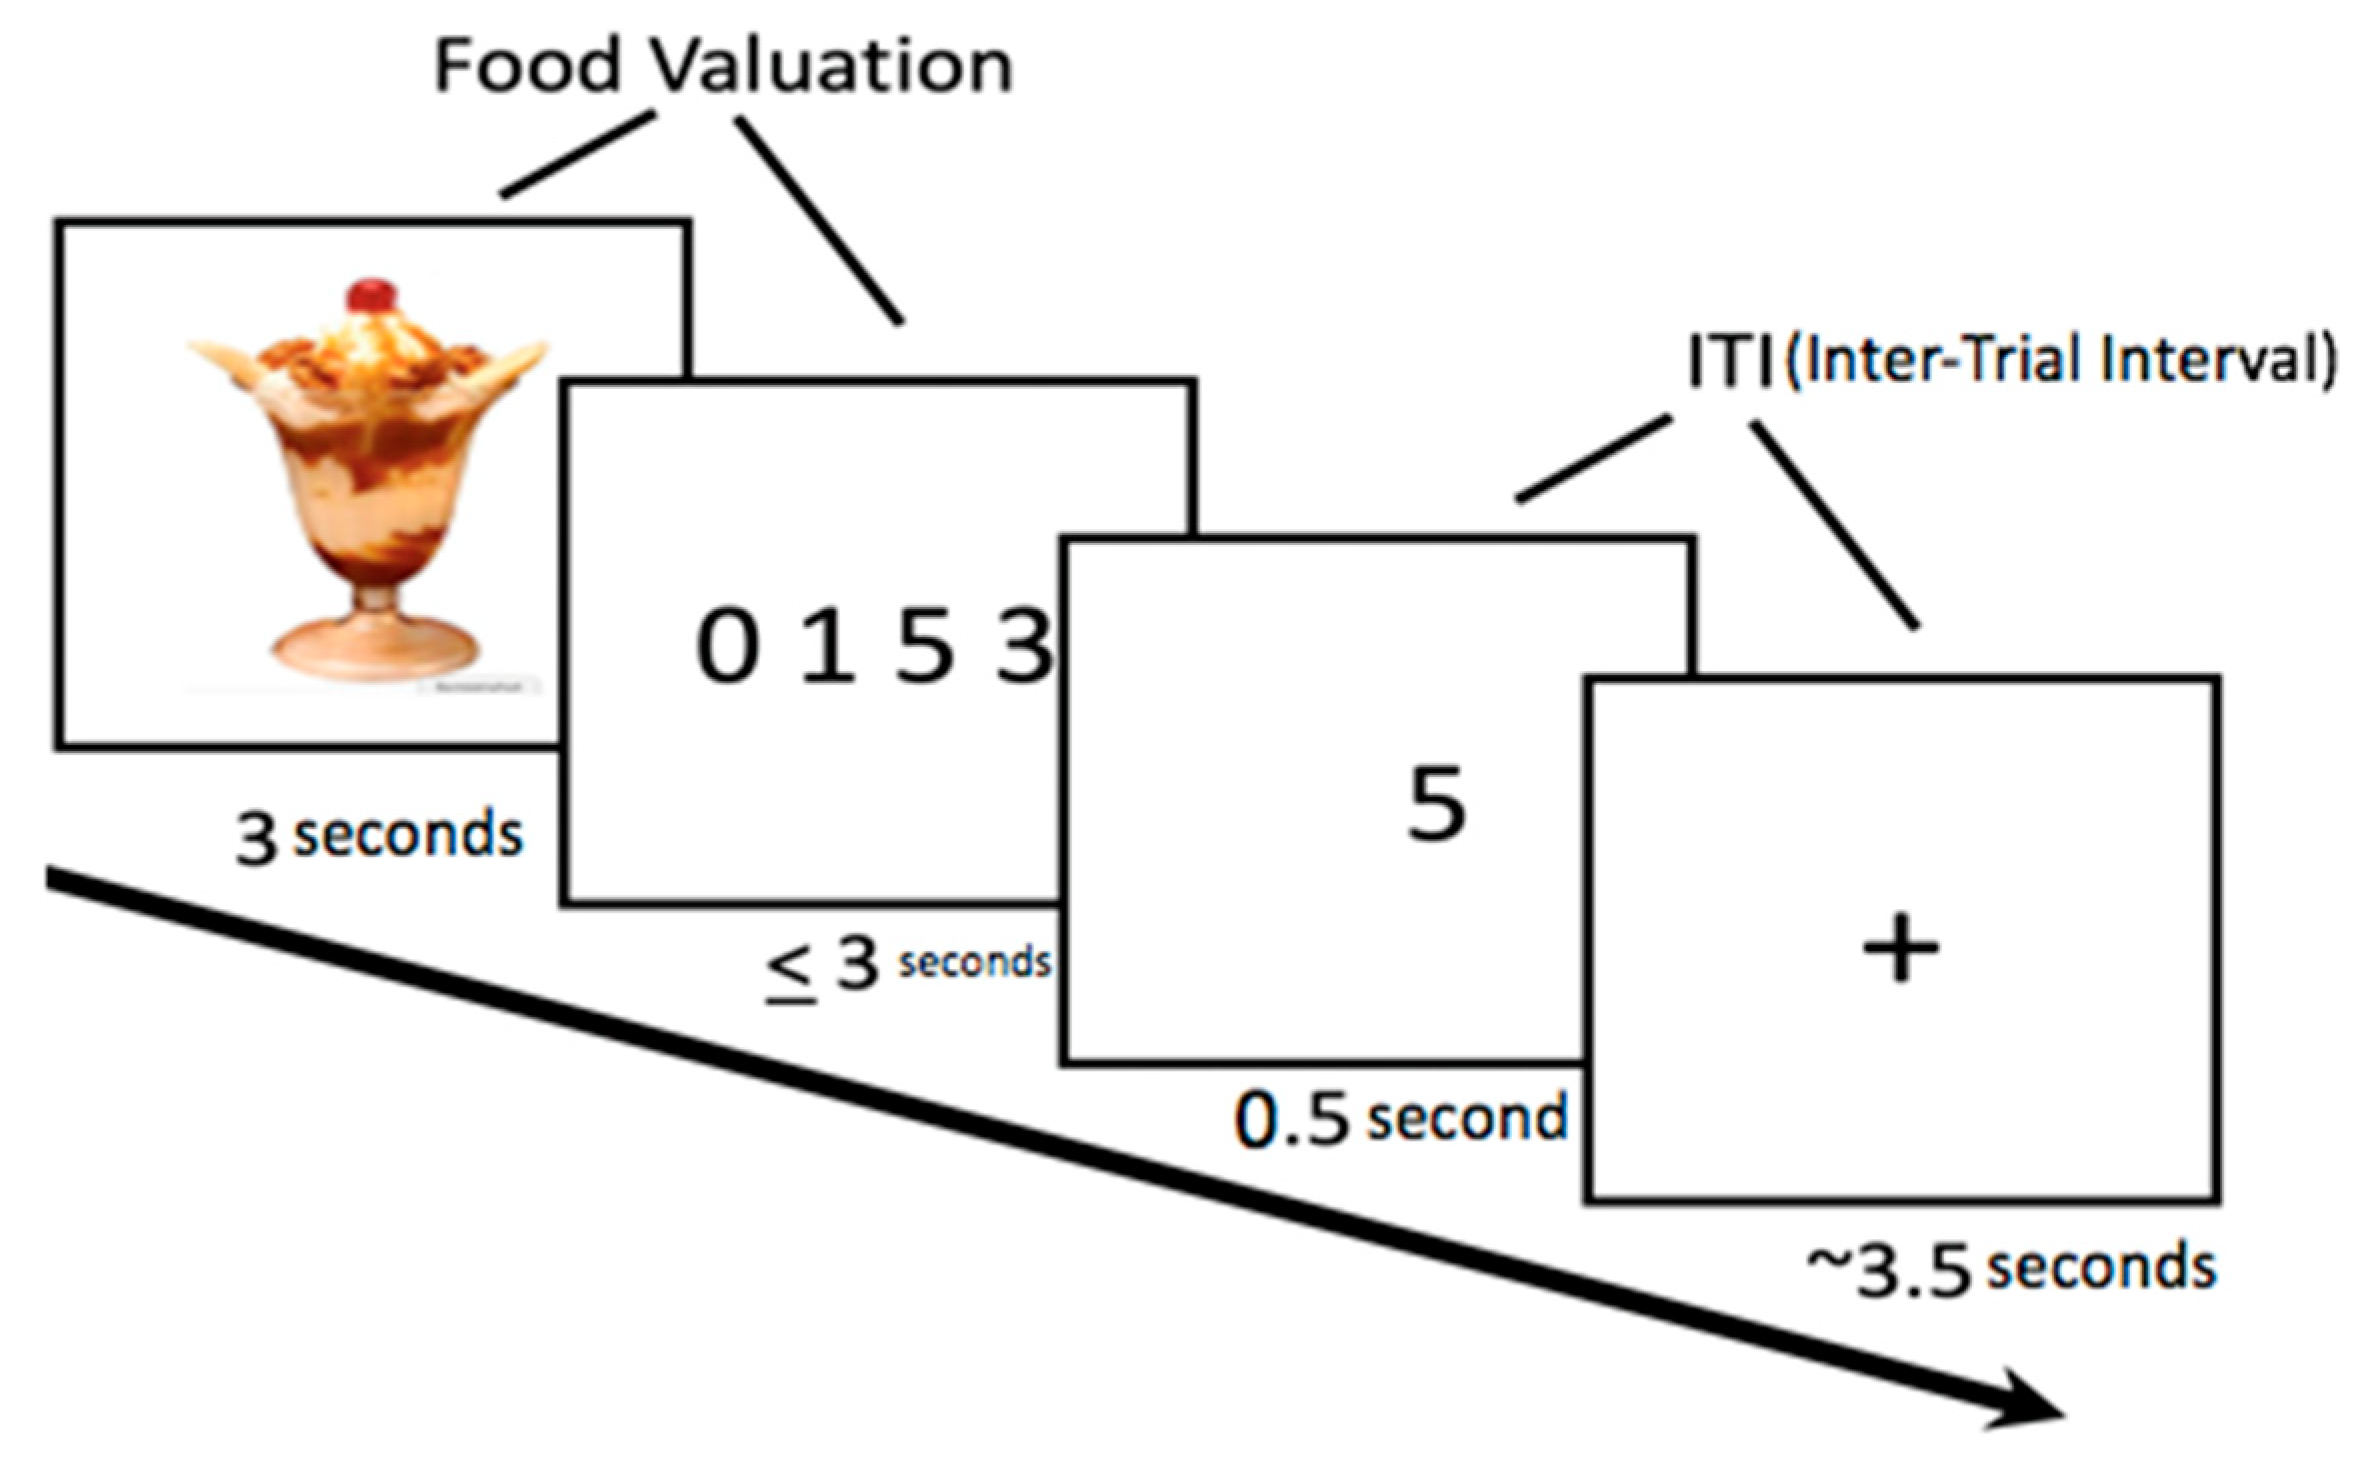
2.5. Food Bid Task
2.6. Attribute-Rating Task (Outside the MRI Scanner)
2.7. Data Analyses
2.7.1. Appetite Analysis
2.7.2. BID Task Data Analysis
2.7.3. Neuroimaging Data Analyses
Region of Interest (ROI) Analyses
Whole-Brain Analyses
3. Results
3.1. Participants Characteristics
3.2. Study Drink Rating
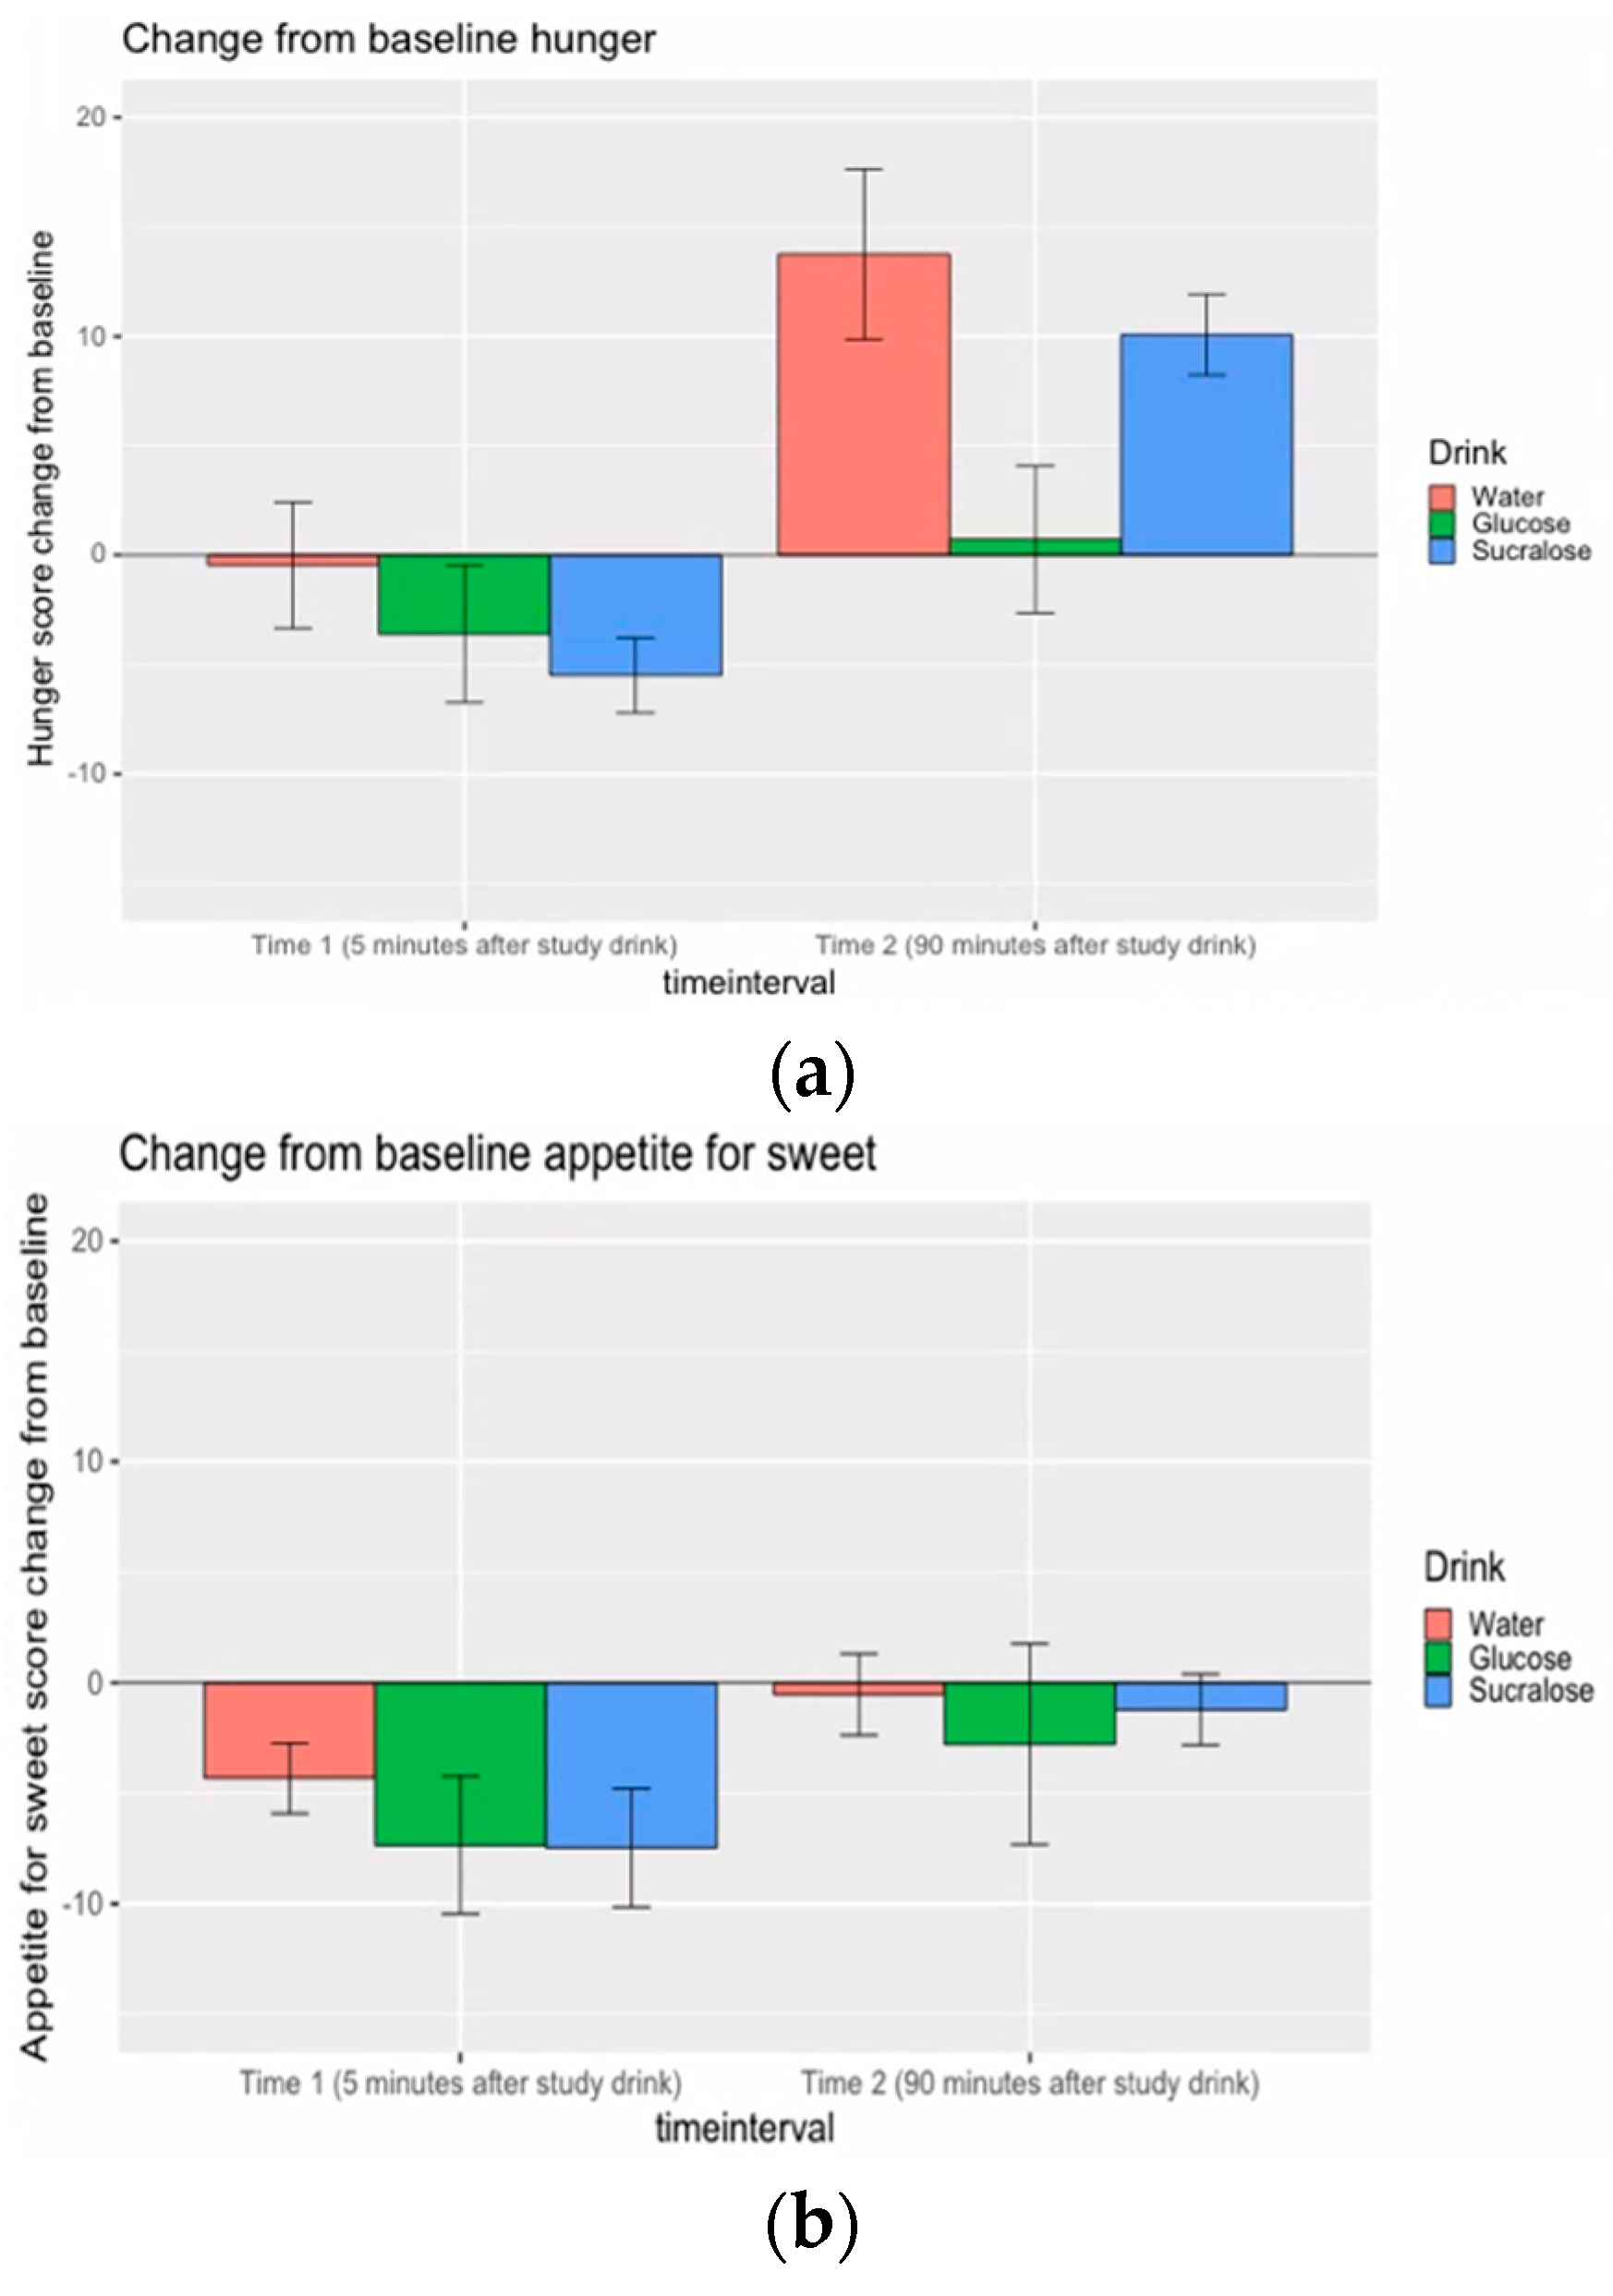
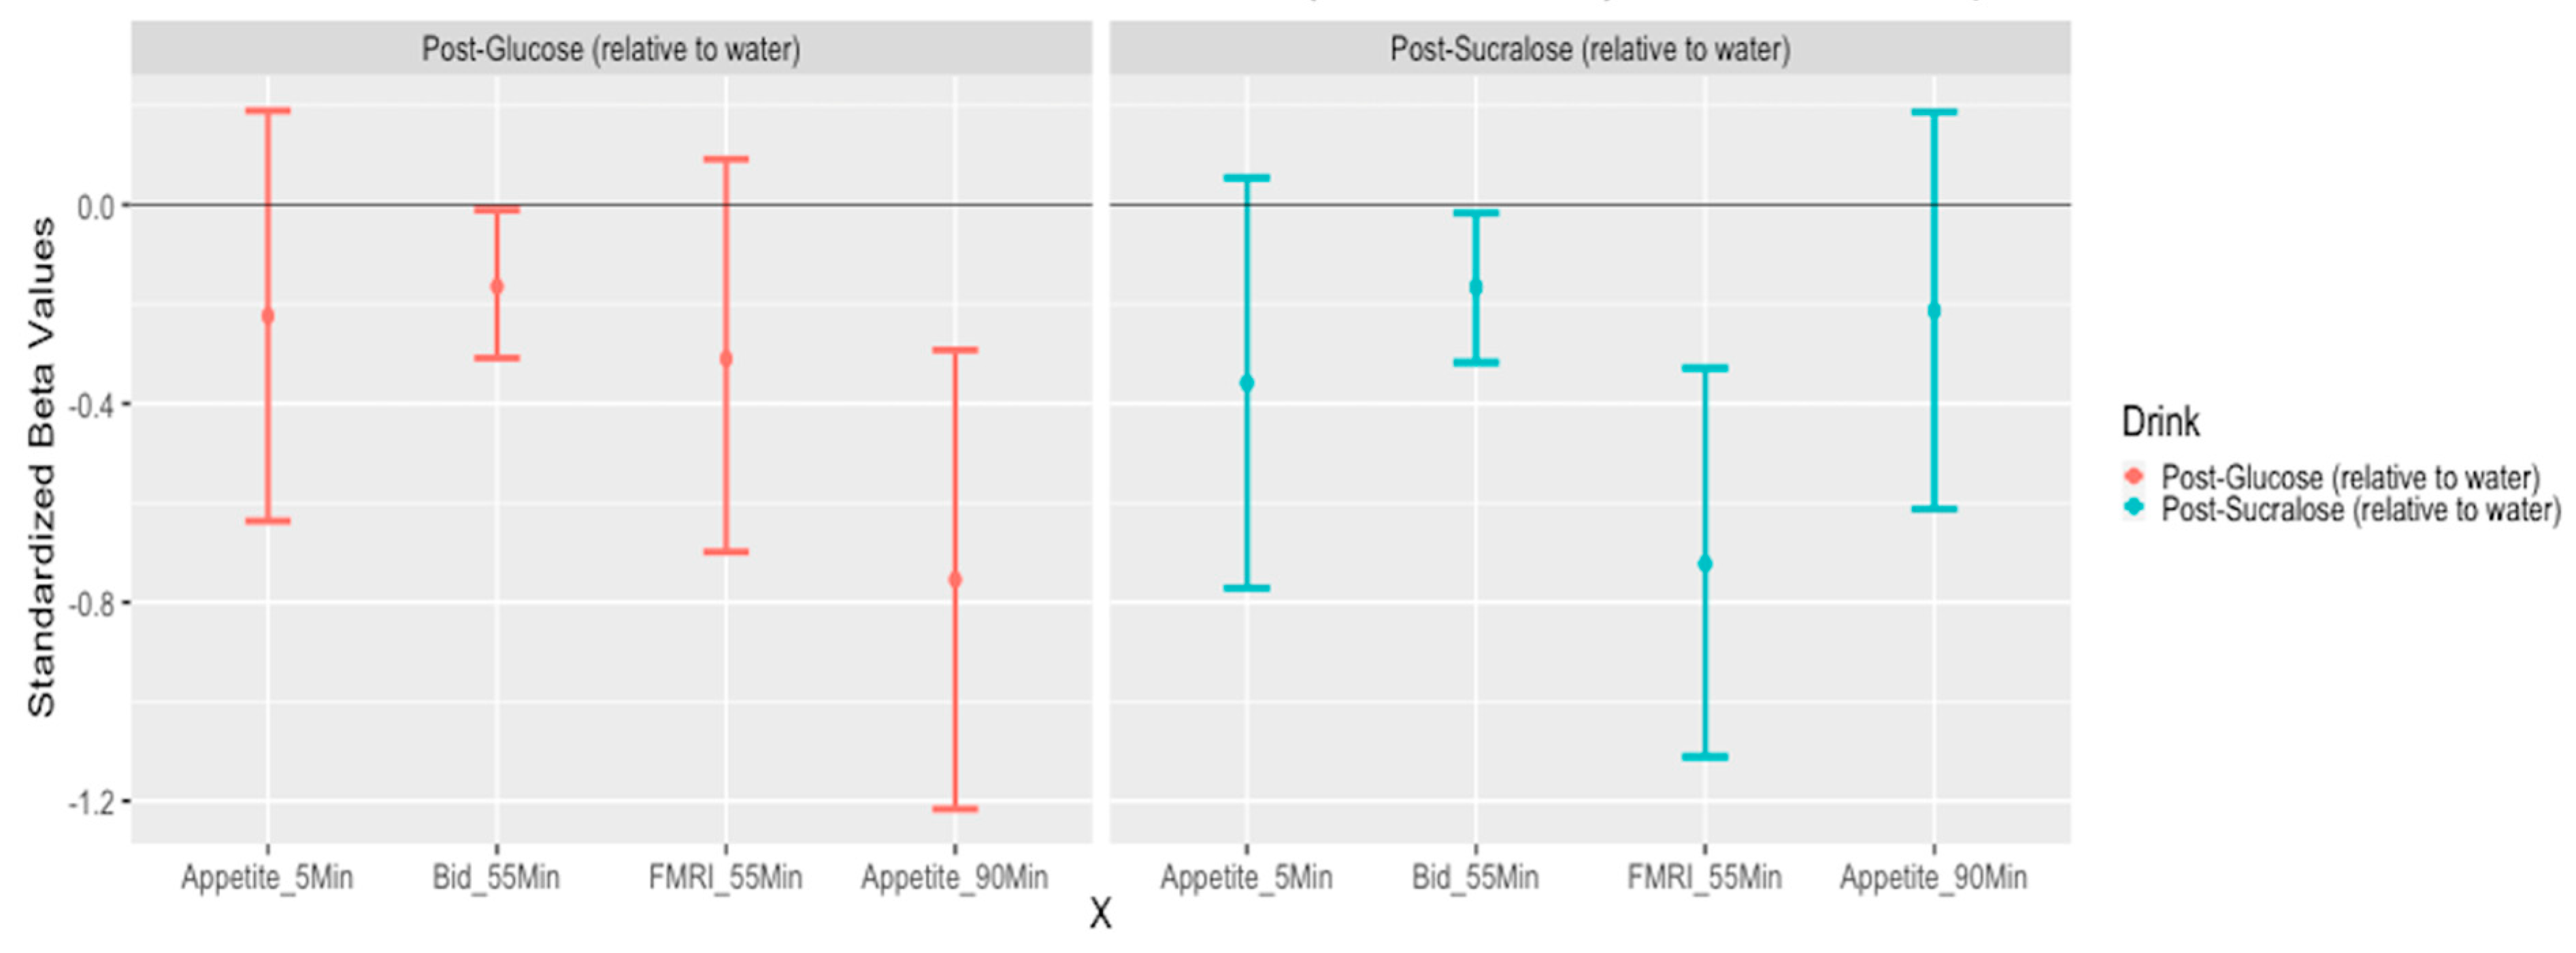
3.3. Appetite Rating
3.4. Food Bid Task
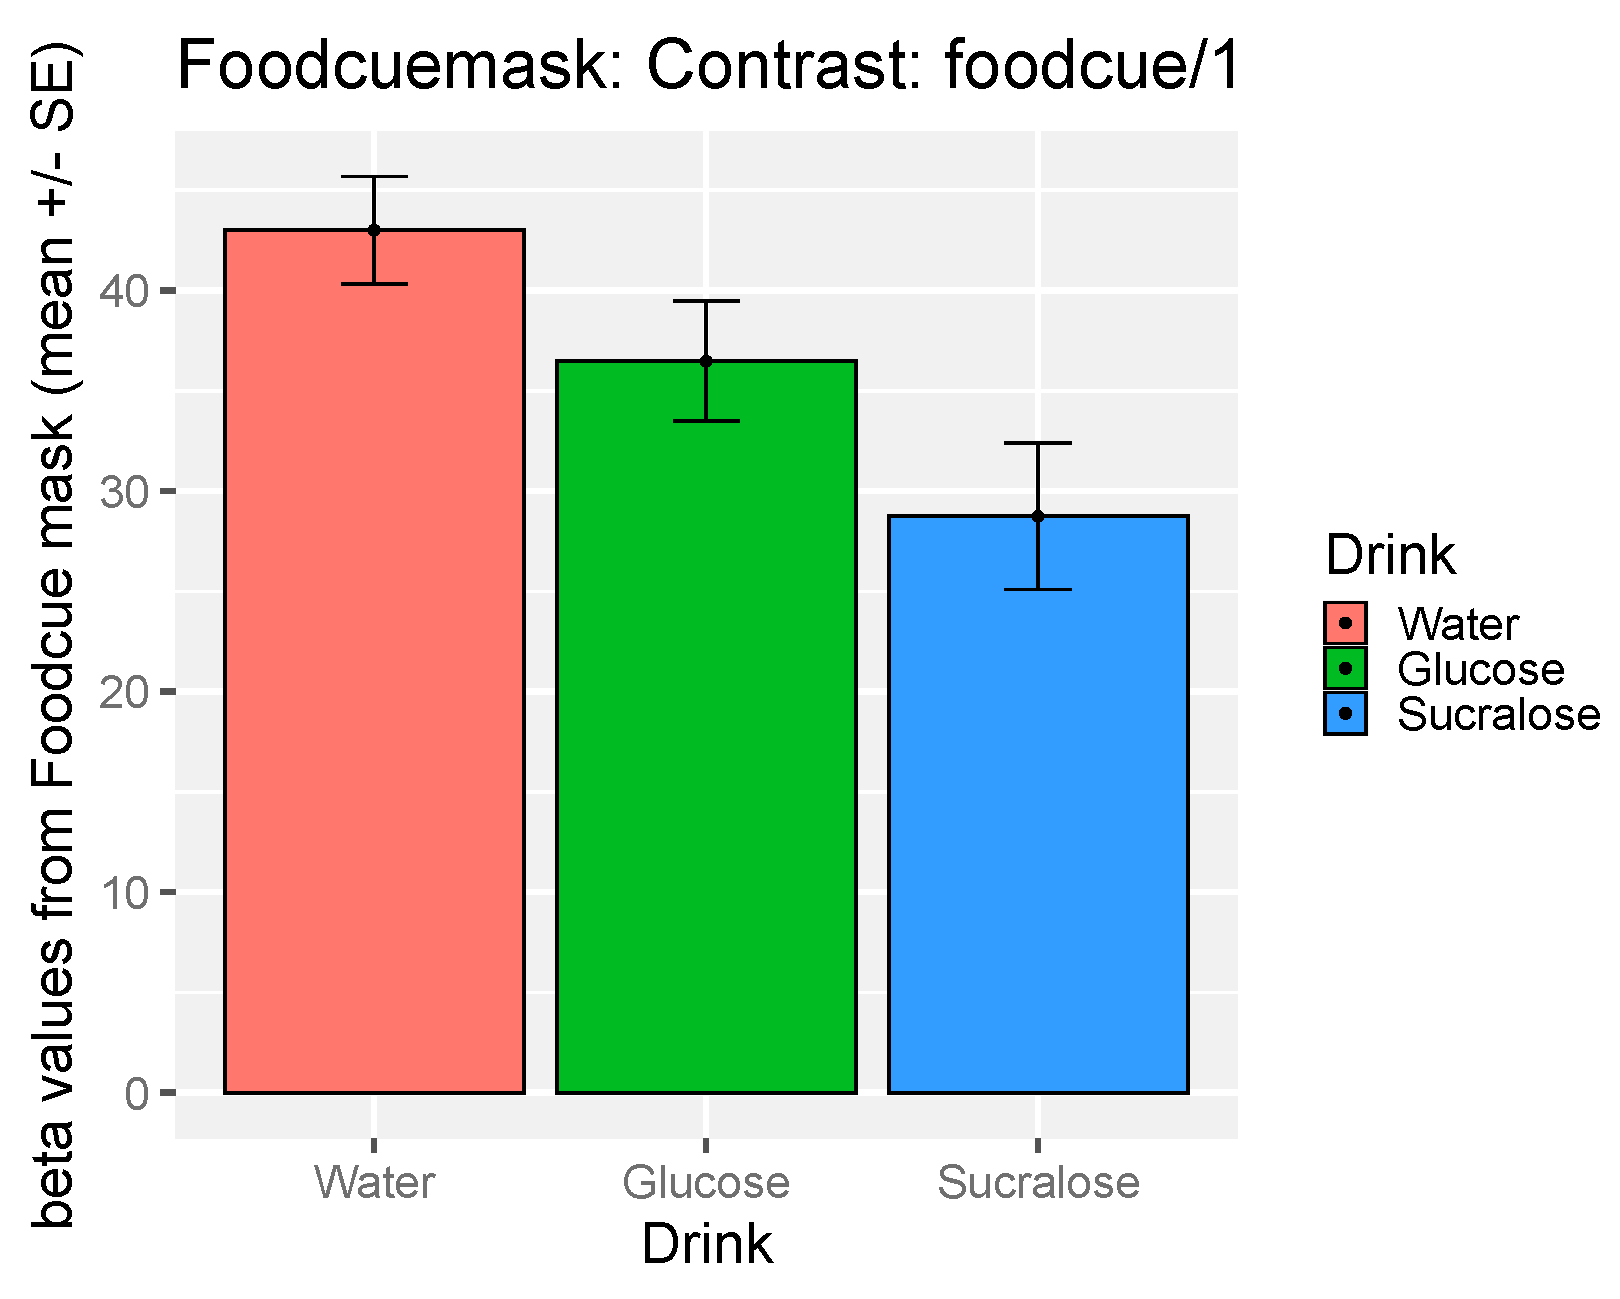
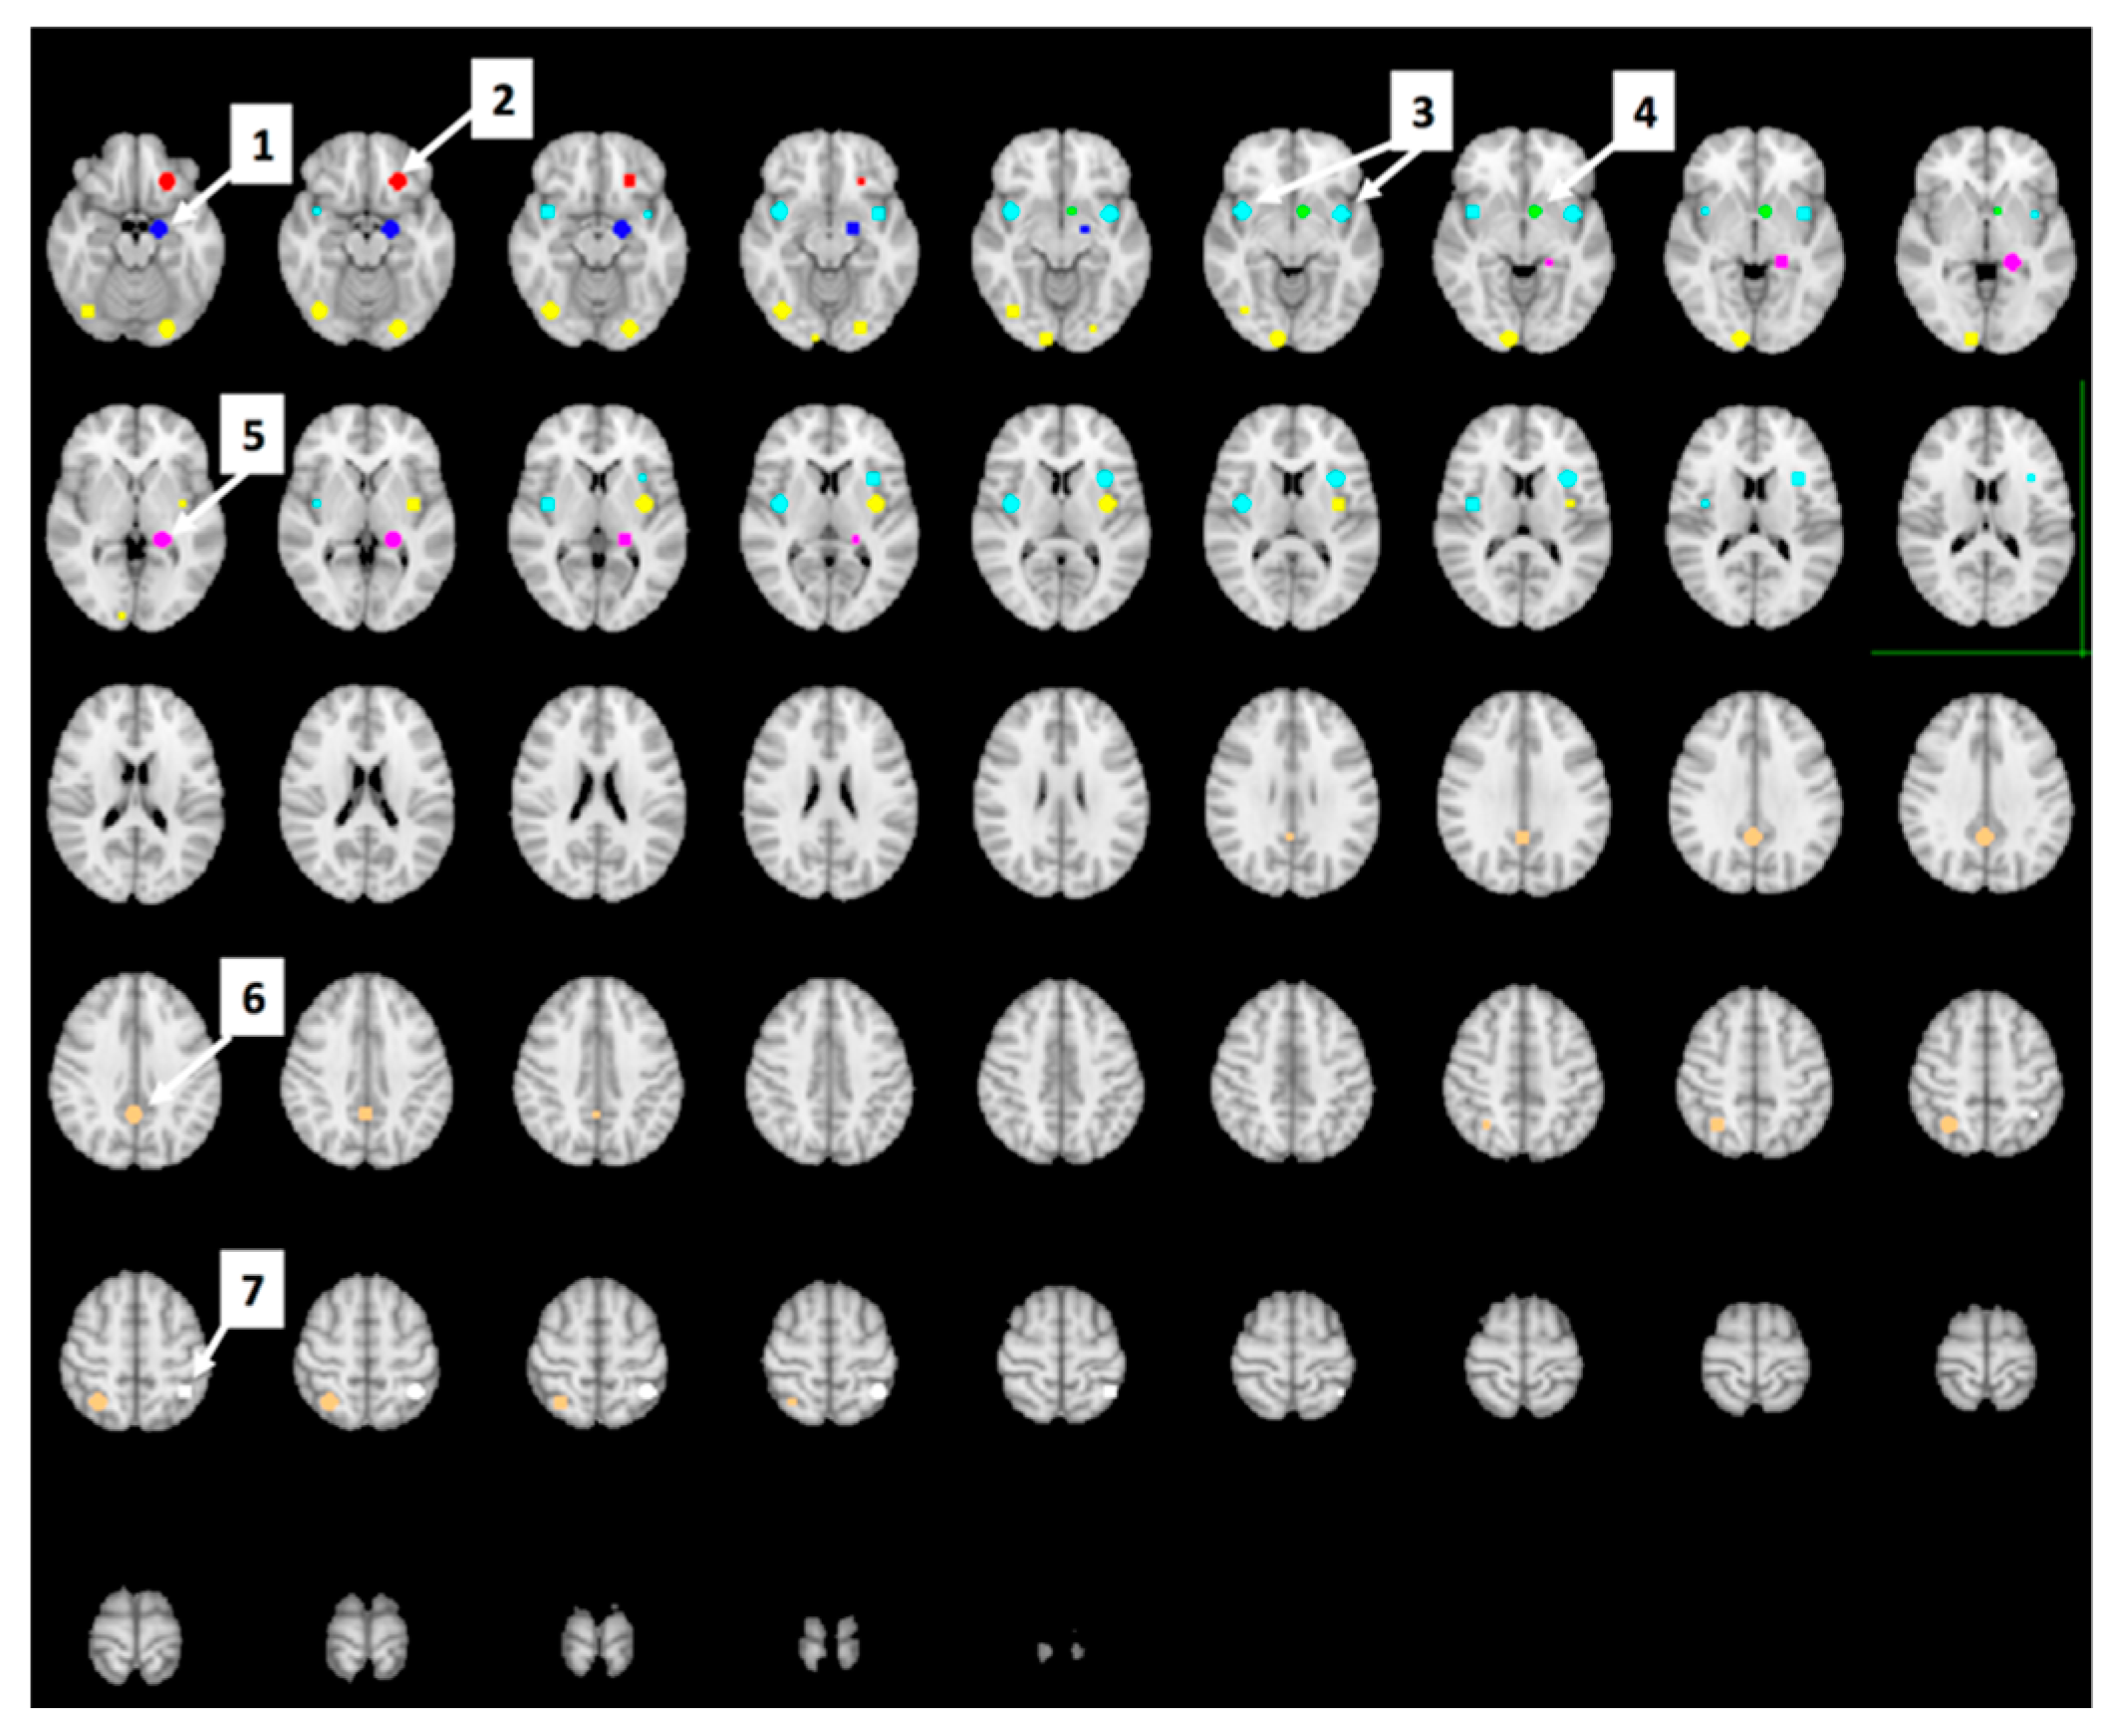
3.5. The Effect of Study Drink on Food-Cue Network ROI Activity during Food Valuation
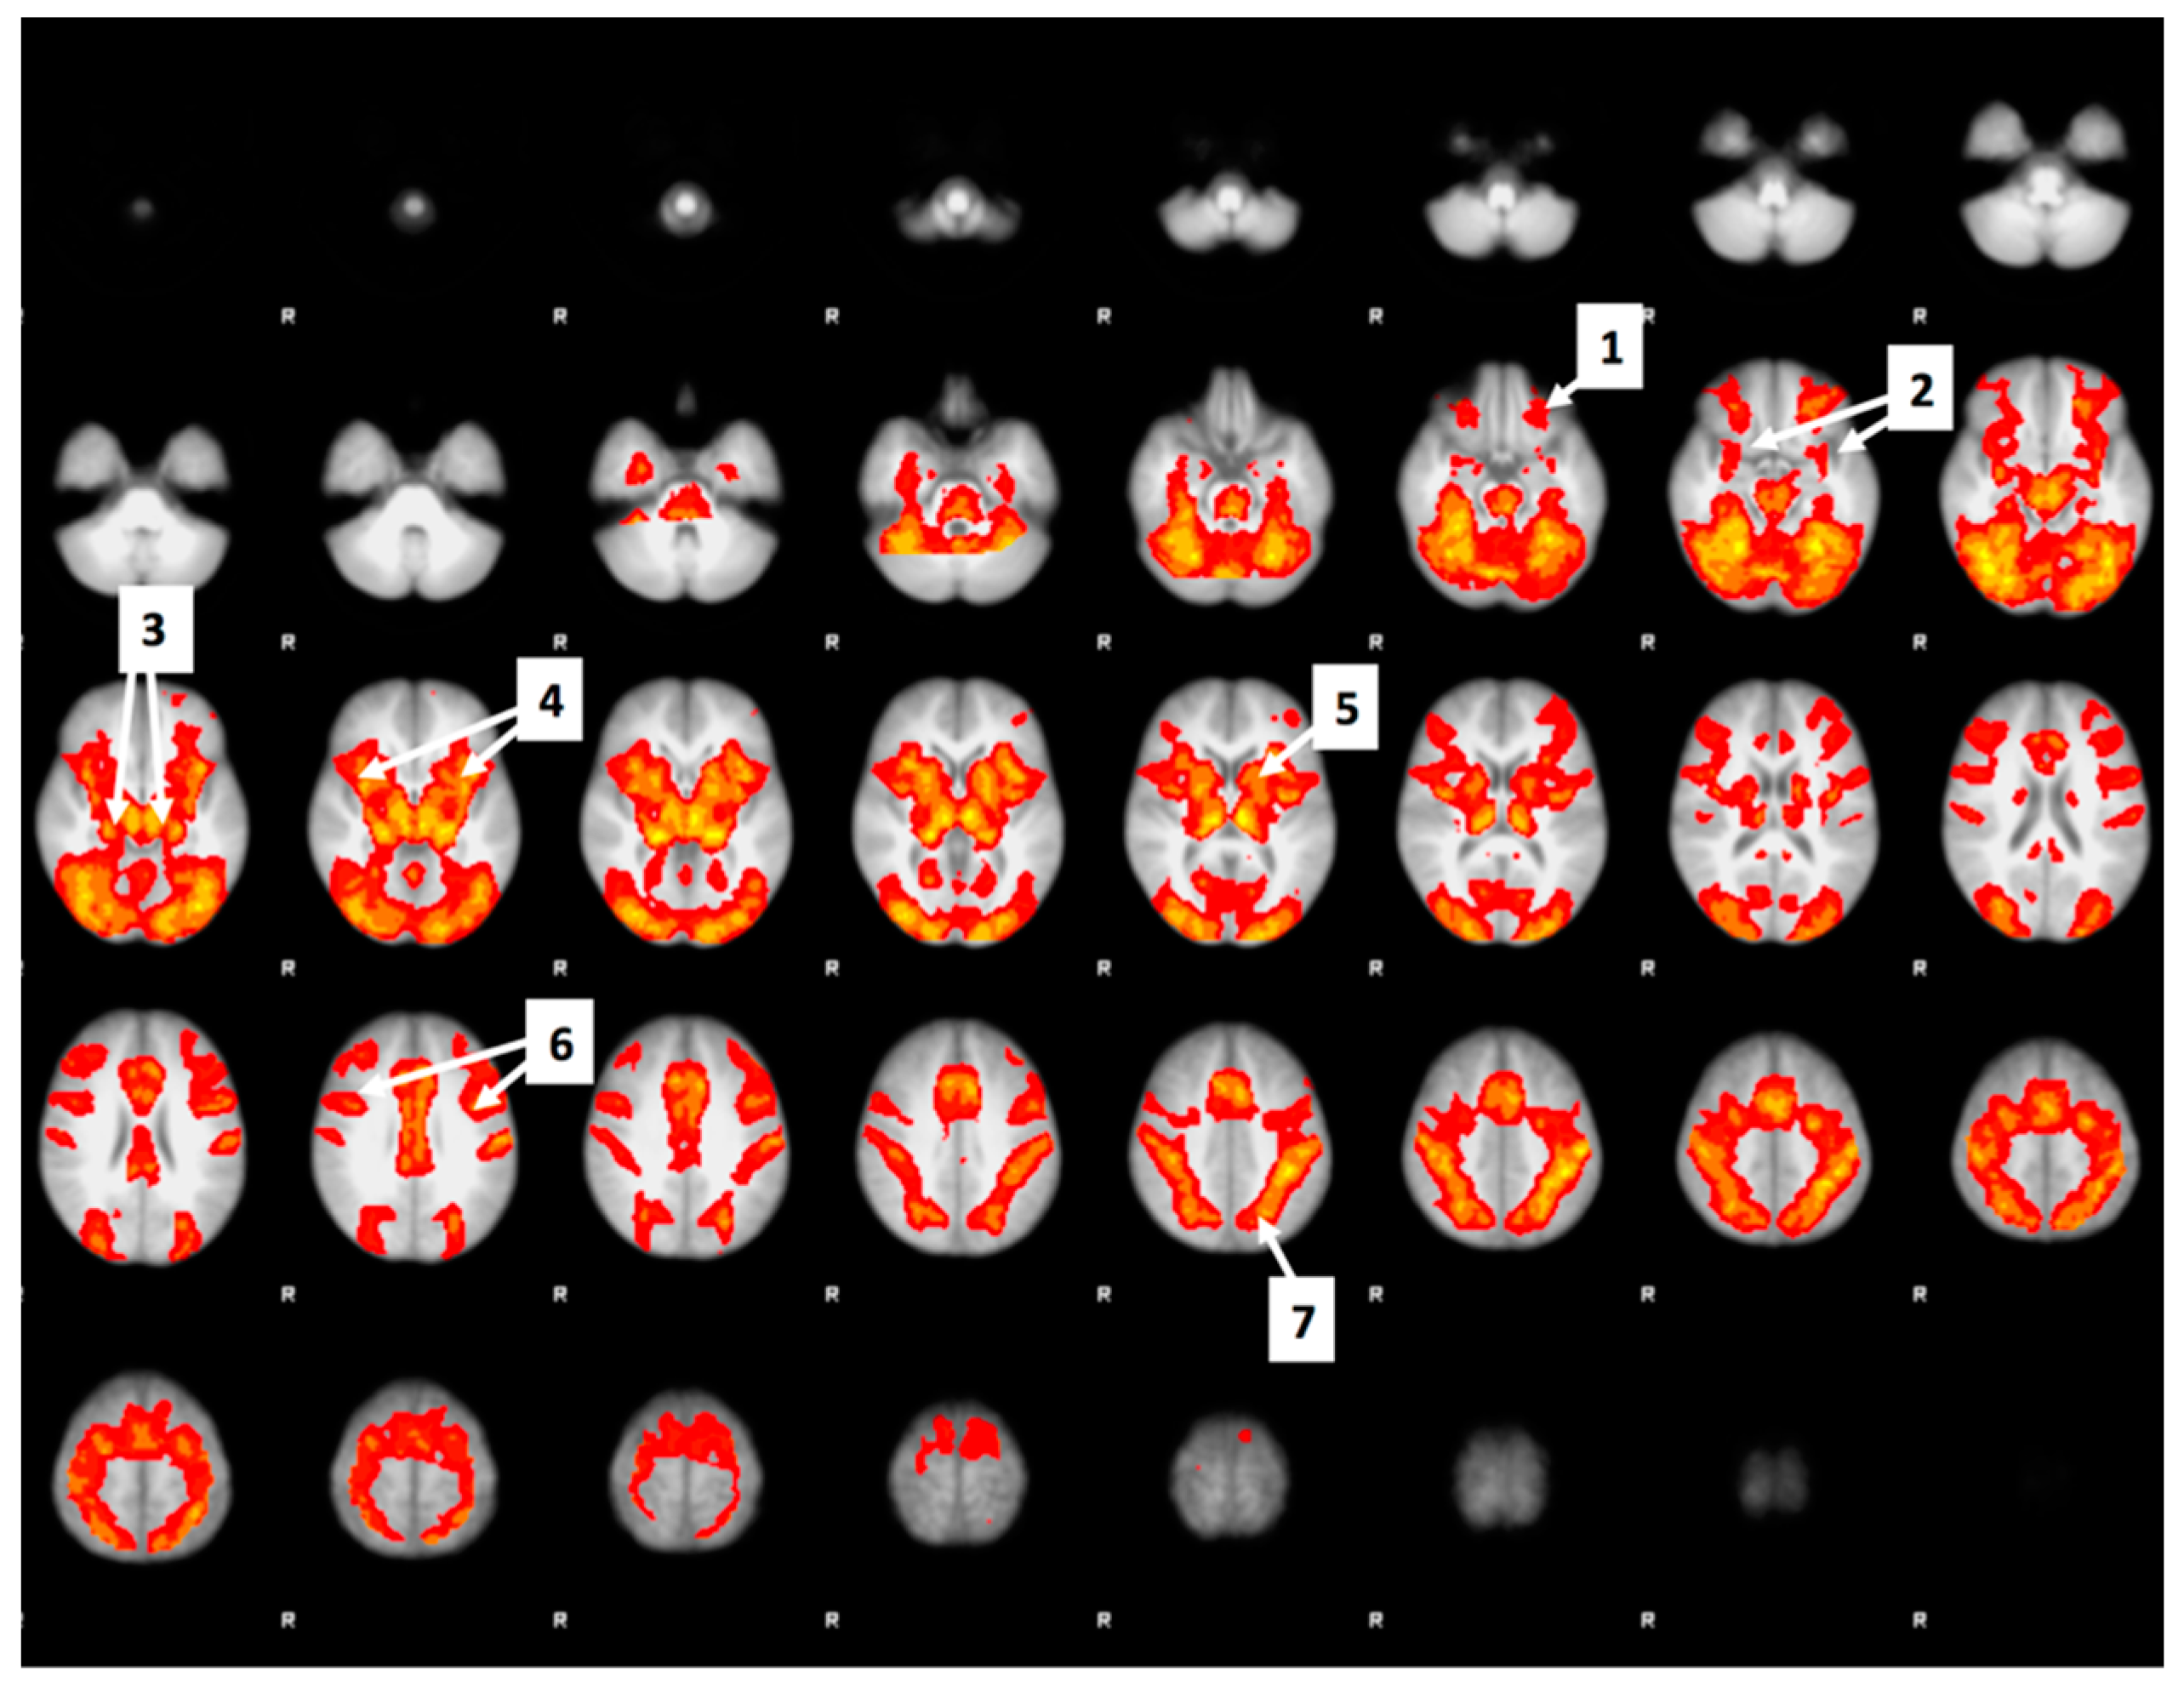
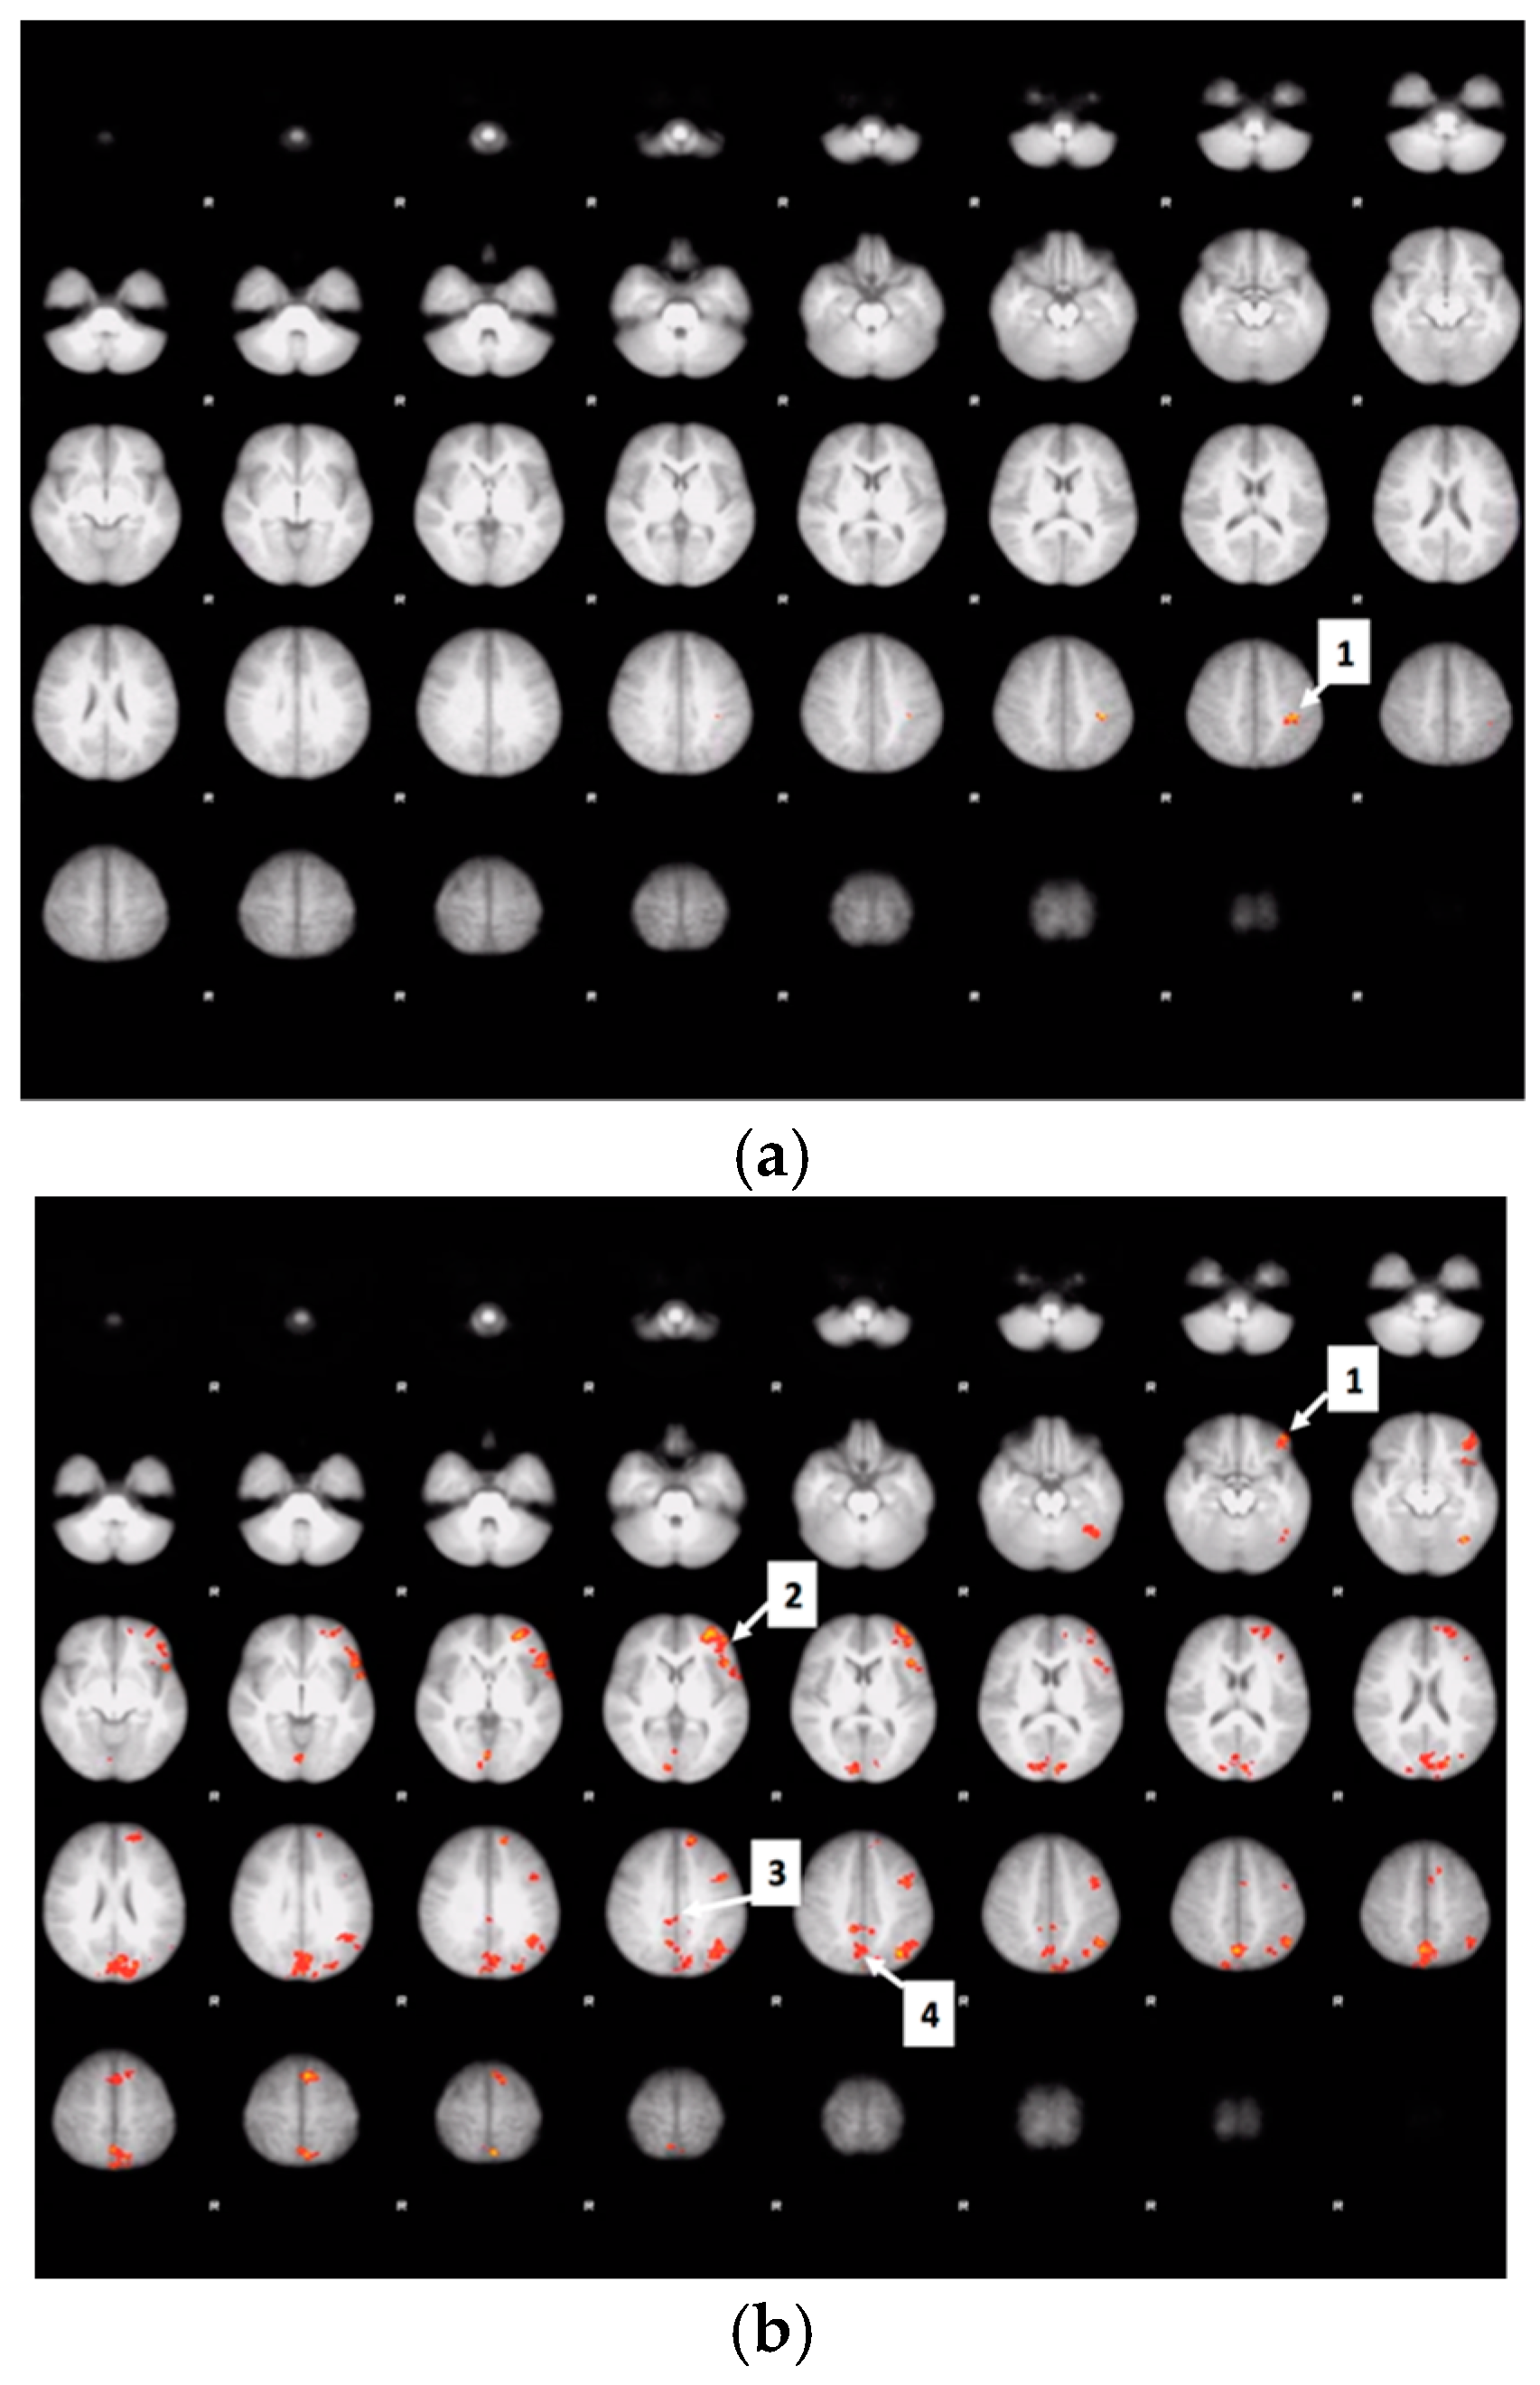
3.6. Whole Brain Analyses of Activity during Food Valuation Period
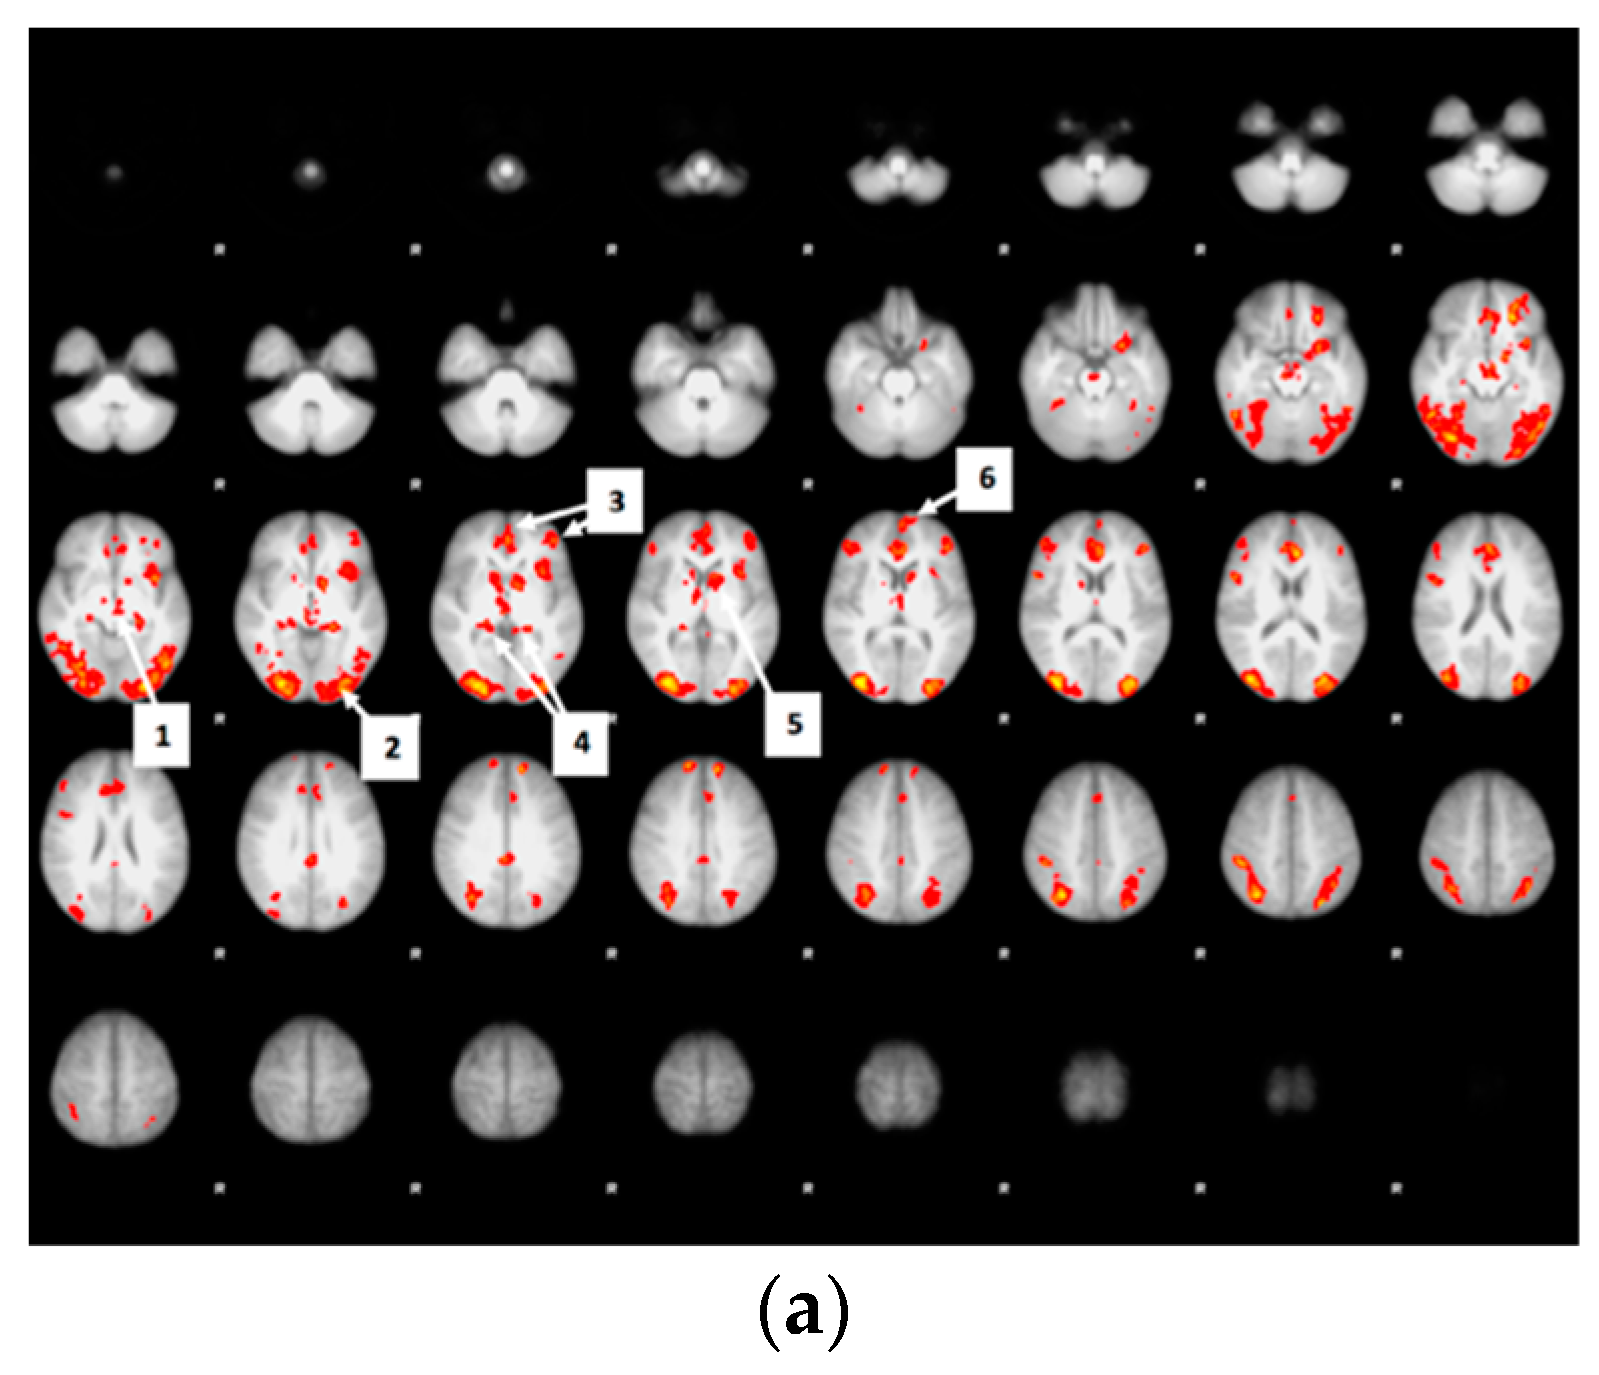
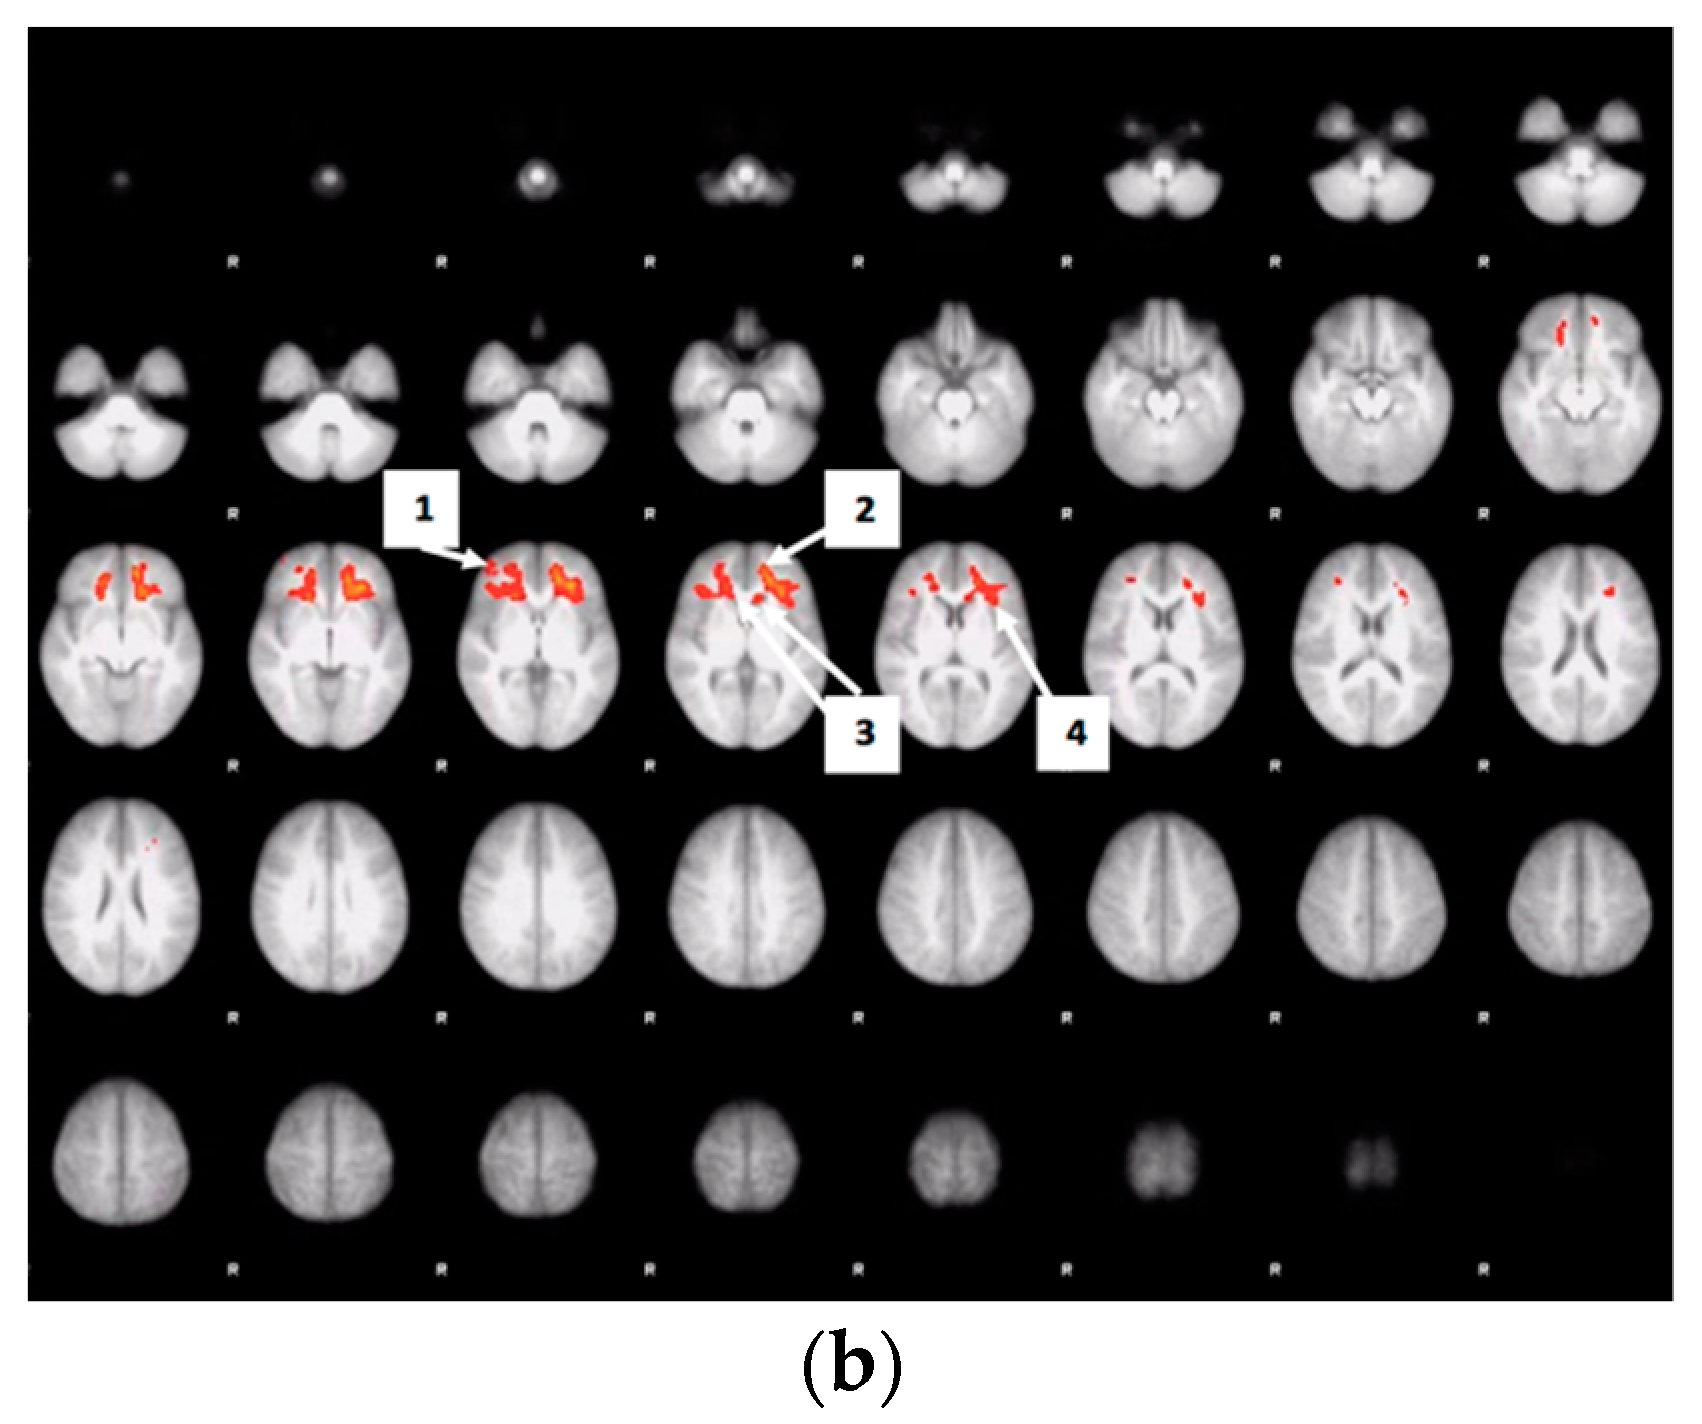
3.7. Drink Effects on Whole Brain Activity Associated with Food Valuation
3.8. Bid-Correlated Brain Activity during Food Valuation Period
4. Discussion
4.1. Primary Findings Related to Acute Glucose Consumption
4.2. Primary Findings Related to Acute Sucralose Consumption
4.3. Comparison of Acute Sucralose vs. Acute Glucose Consumption
4.4. Food Decisions and the Orbitofrontal Cortex
4.5. Limitation
5. Conclusions
Author Contributions
Funding
Acknowledgments
Conflicts of Interest
Appendix A
Appendix A.1. Attribute-Rating Task, Magnetic Resonance Imaging Parameters and Preprocessing Procedures, and Brain Regions with Significant Decreased Activity after Glucose or Sucralose
- (1)
- how high is the item in fat?
- (2)
- how high is the item in carbohydrates?
- (3)
- how high is the item in protein?
- (4)
- how high is the item in vitamins?
- (5)
- how high is the item in sugar?
- (6)
- how high is the item in sodium (salt)?
- (7)
- how high is the item in calories?
- (8)
- how familiar is the item?
- (9)
- how healthy is the item?
- (10)
- how palatable is the item?


Appendix A.2. Subliminal Priming Data Analyses
References
- Page, K.A.; Melrose, A.J. Brain, hormone and appetite responses to glucose versus fructose. Curr. Opin. Behav. Sci. 2016, 9, 111–117. [Google Scholar] [CrossRef]
- Page, K.A.; Seo, N.; Belfort-DeAguiar, R.; Lacadie, C.; Dzuira, J.; Naik, S.; Amarnath, S.; Constable, R.T.; Sherwin, R.S.; Sinha, R. Circulating glucose levels modulate neural control of desire for high-calorie foods in humans. J. Clin. Investig. 2011, 121, 4161–4169. [Google Scholar] [CrossRef]
- Van Vugt, D.A.; Krzemień, A.; Alsaadi, H.; Frank, T.C.; Reid, R.L. Glucose-induced inhibition of the appetitive brain response to visual food cues in polycystic ovary syndrome patients. Brain Res. 2014, 1558, 44–56. [Google Scholar] [CrossRef]
- Kroemer, N.B.; Krebs, L.; Kobiella, A.; Grimm, O.; Vollstädt-Klein, S.; Wolfensteller, U.; Kling, R.; Bidlingmaier, M.; Zimmermann, U.S.; Smolka, M.N. (Still) longing for food: Insulin reactivity modulates response to food pictures. Hum. Brain Mapp. 2013, 34, 2367–2380. [Google Scholar] [CrossRef]
- Heni, M.; Kullmann, S.; Ketterer, C.; Guthoff, M.; Bayer, M.D.; Staiger, H.; Machicao, F.; Häring, H.-U.; Preissl, H.; Veit, R.; et al. Differential effect of glucose ingestion on the neural processing of food stimuli in lean and overweight adults. Hum. Brain Mapp. 2014, 35, 918–928. [Google Scholar] [CrossRef] [PubMed]
- Nehrling, J.K.; Kobe, P.; McLane, M.P.; Olson, R.E.; Kamath, S.; Horwitz, D.L. Aspartame use by persons with diabetes. Diabetes Care 1985, 8, 415–417. [Google Scholar] [CrossRef]
- de Ruyter, J.C.; Olthof, M.R.; Kuijper, L.D.J.; Katan, M.B. Effect of sugar-sweetened beverages on body weight in children: Design and baseline characteristics of the Double-blind, Randomized INtervention study in Kids. Contemp. Clin. Trials 2012, 33, 247–257. [Google Scholar] [CrossRef]
- Higgins, K.A.; Mattes, R.D. A randomized controlled trial contrasting the effects of 4 low-calorie sweeteners and sucrose on body weight in adults with overweight or obesity. Am. J. Clin. Nutr. 2019, 109, 1288–1301. [Google Scholar] [CrossRef]
- Pepino, M.Y. Metabolic effects of non-nutritive sweeteners. Physiol. Behav. 2015, 152, 450–455. [Google Scholar] [CrossRef]
- Porikos, K.P.; Pi-Sunyer, F.X. Regulation of food intake in human obesity: Studies with caloric dilution and exercise. Clin. Endocrinol. Metab. 1984, 13, 547–561. [Google Scholar] [CrossRef]
- Raben, A.; Vasilaras, T.H.; Møller, A.C.; Astrup, A. Sucrose compared with artificial sweeteners: Different effects on ad libitum food intake and body weight after 10 wk of supplementation in overweight subjects. Am. J. Clin. Nutr. 2002, 76, 721–729. [Google Scholar] [CrossRef]
- Rogers, P.J.; Hogenkamp, P.; De Graaf, C.; Higgs, S.; Lluch, A.; Ness, A.R.; Penfold, C.; Perry, R.; Putz, P.; Yeomans, M.R.; et al. Does low-energy sweetener consumption affect energy intake and body weight? A systematic review, including meta-analyses, of the evidence from human and animal studies. Int. J. Obes. 2016, 40, 381–394. [Google Scholar] [CrossRef]
- Swithers, S.E. Artificial sweeteners produce the counterintuitive effect of inducing metabolic derangements. Trends Endocrinol. Metab. 2013, 24, 431–441. [Google Scholar] [CrossRef]
- Swithers, S.E.; Laboy, A.F.; Clark, K.; Cooper, S.; Davidson, T.L. Experience with the high-intensity sweetener saccharin impairs glucose homeostasis and GLP-1 release in rats. Behav. Brain Res. 2012, 233, 1–14. [Google Scholar] [CrossRef]
- Fernstrom, J.D. Non-nutritive sweeteners and obesity. Annu. Rev. Food Sci. Technol. 2015, 6, 119–136. [Google Scholar] [CrossRef]
- Grotz, V.L.; Munro, I.C. An overview of the safety of sucralose. Regul. Toxicol. Pharmacol. 2009, 55, 1–5. [Google Scholar] [CrossRef]
- Dalenberg, J.R.; Patel, B.P.; Denis, R.; Veldhuizen, M.G.; Nakamura, Y.; Vinke, P.C.; Luquet, S.; Small, D.M. Short-Term Consumption of Sucralose with, but Not without, Carbohydrate Impairs Neural and Metabolic Sensitivity to Sugar in Humans. Cell Metab. 2020, 31, 493–502.e7. [Google Scholar] [CrossRef]
- van Opstal, A.M.; Kaal, I.; Berg-Huysmans, A.V.D.; Hoeksma, M.; Blonk, C.; Pijl, H.; Rombouts, S.; Van Der Grond, J. Dietary sugars and non-caloric sweeteners elicit different homeostatic and hedonic responses in the brain. Nutr. Burbank Los Angel. Cty. Calif 2019, 60, 80–86. [Google Scholar] [CrossRef]
- Sato, W.; Sawada, R.; Kubota, Y.; Toichi, M.; Fushiki, T. Homeostatic modulation on unconscious hedonic responses to food. BMC Res. Notes 2017, 10, 511. [Google Scholar] [CrossRef]
- Sato, W.; Kochiyama, T.; Minemoto, K.; Sawada, R.; Fushiki, T. Amygdala activation during unconscious visual processing of food. Sci. Rep. 2019, 9, 7277. [Google Scholar] [CrossRef] [PubMed]
- Childress, A.R.; Ehrman, R.N.; Wang, Z.; Li, Y.; Sciortino, N.; Hakun, J.; Jens, W.; Suh, J.; Listerud, J.; Marquez, K.; et al. Prelude to passion: Limbic activation by ‘unseen’ drug and sexual cues. PLoS ONE 2008, 3, e1506. [Google Scholar] [CrossRef] [PubMed]
- Schienle, A.; Schäfer, A.; Hermann, A.; Vaitl, D. Binge-eating disorder: Reward sensitivity and brain activation to images of food. Biol. Psychiatry 2009, 65, 654–661. [Google Scholar] [CrossRef] [PubMed]
- Schur, E.N.; Kleinhans, N.M.; Goldberg, J.; Buchwald, D.; Schwartz, M.W.; Maravilla, K. Activation in brain energy regulation and reward centers by food cues varies with choice of visual stimulus. Int. J. Obes. 2009, 33, 653. [Google Scholar] [CrossRef] [PubMed]
- Stoeckel, L.E.; Weller, R.E.; Cook, E.W.; Twieg, D.B.; Knowlton, R.C.; Cox, J.E. Widespread reward-system activation in obese women in response to pictures of high-calorie foods. NeuroImage 2008, 41, 636–647. [Google Scholar] [CrossRef] [PubMed]
- Killgore, W.D.; Young, A.D.; Femia, L.A.; Bogorodzki, P.; Rogowska, J.; Yurgelun-Todd, D.A. Cortical and limbic activation during viewing of high-versus low-calorie foods. NeuroImage 2003, 19, 1381–1394. [Google Scholar] [CrossRef]
- Führer, D.; Zysset, S.; Stumvoll, M. Brain activity in hunger and satiety: An exploratory visually stimulated FMRI study. Obes. Silver Spring Md 2008, 16, 945–950. [Google Scholar] [CrossRef]
- Simmons, W.K.; Martin, A.; Barsalou, L.W. Pictures of appetizing foods activate gustatory cortices for taste and reward. Cereb. Cortex 2005, 15, 1602–1608. [Google Scholar] [CrossRef]
- Malik, S.; McGlone, F.; Dagher, A. State of expectancy modulates the neural response to visual food stimuli in humans. Appetite 2011, 56, 302–309. [Google Scholar] [CrossRef]
- Tang, D.W.; Fellows, L.K.; Small, D.M.; Dagher, A. Food and drug cues activate similar brain regions: A meta-analysis of functional MRI studies. Physiol. Behav. 2012, 106, 317–324. [Google Scholar] [CrossRef]
- Dye, L.; Blundell, J.E. Menstrual cycle and appetite control: Implications for weight regulation. Hum. Reprod. Oxf. Engl. 1997, 12, 1142–1151. [Google Scholar] [CrossRef]
- Krishnan, S.; Tryon, R.; Welch, L.C.; Horn, W.F.; Keim, N.L. Menstrual cycle hormones, food intake, and cravings. FASEB J. 2016, 30, 418.6. [Google Scholar] [CrossRef]
- Blechert, J.; Emeule, A.; Busch, N.A.; Ohla, K. Food-pics: An image database for experimental research on eating and appetite. Front. Psychol. 2014, 5, 617. [Google Scholar] [CrossRef] [PubMed]
- Suzuki, S.; Cross, L.; O’Doherty, J.P. Elucidating the underlying components of food valuation in the human orbitofrontal cortex. Nat. Neurosci. 2017, 20, 1780–1786. [Google Scholar] [CrossRef] [PubMed]
- Becker, G.M.; DeGroot, M.H.; Marschak, J. Measuring utility by a single-response sequential method. Behav. Sci. 1964, 9, 226–232. [Google Scholar] [CrossRef]
- Baayen, R.H.; Davidson, D.J.; Bates, D.M. Mixed-effects modeling with crossed random effects for subjects and items. J. Mem. Lang. 2008, 59, 390–412. [Google Scholar] [CrossRef]
- Kuznetsova, A.; Brockhoff, P.B.; Christensen, R.H. lmerTest package: Tests in linear mixed effects models. J. Stat. Softw. 2017, 82, 1–26. [Google Scholar] [CrossRef]
- Lenth, R. Emmeans: Estimated Marginal Means, Aka Least-Squares Means. R Package Version 1.4.2. Vienna, Austria, 2019. Available online: https://CRAN.R-project.org/package=emmeans (accessed on 1 September 2019).
- van Buuren, S.; Groothuis-Oudshoorn, K. mice: Multivariate imputation by chained equations in RJ. Stat. Softw. 2010, 45, 1–68. [Google Scholar]
- Field, M.; Duka, T. Cue reactivity in smokers: The effects of perceived cigarette availability and gender. Pharmacol. Biochem. Behav. 2004, 78, 647–652. [Google Scholar] [CrossRef]
- Tetley, A.; Brunstrom, J.; Griffiths, P. Individual differences in food-cue reactivity. The role of BMI and everyday portion-size selections. Appetite 2009, 52, 614–620. [Google Scholar] [CrossRef]
- Plassmann, H.; O’Doherty, J.; Rangel, A. Orbitofrontal cortex encodes willingness to pay in everyday economic transactions. J. Neurosci. 2007, 27, 9984–9988. [Google Scholar] [CrossRef] [PubMed]
- Padoa-Schioppa, C.; Cai, X. Orbitofrontal cortex and the computation of subjective value: Consolidated concepts and new perspectives. Ann. N. Y. Acad. Sci. 2011, 1239, 130. [Google Scholar] [CrossRef] [PubMed]
- Peters, J.; Büchel, C. Neural representations of subjective reward value. Behav. Brain Res. 2010, 213, 135–141. [Google Scholar] [CrossRef]
- Walton, M.E.; Behrens, T.E.; Noonan, M.P.; Rushworth, M.F. Giving credit where credit is due: Orbitofrontal cortex and valuation in an uncertain world. Ann. N. Y. Acad. Sci. 2011, 1239, 14–24. [Google Scholar] [CrossRef] [PubMed]
- Tzourio-Mazoyer, N.; Landeau, B.; Papathanassiou, D.; Crivello, F.; Etard, O.; Delcroix, N.; Mazoyer, B.; Joliot, M. Automated anatomical labeling of activations in SPM using a macroscopic anatomical parcellation of the MNI MRI single-subject brain. NeuroImage 2002, 15, 273–289. [Google Scholar] [CrossRef]
- Kriegeskorte, N.; Simmons, W.K.; Bellgowan, P.S.; Baker, C.I. Circular analysis in systems neuroscience—The dangers of double dipping. Nat. Neurosci. 2009, 12, 535–540. [Google Scholar] [CrossRef] [PubMed]
- World Health Organization. Obesity: Preventing and Managing the Global Epidemic: Report of a WHO Consultation. World Health Organ. Tech. Rep. Ser. 2000, 894, 1–253. [Google Scholar]
- Andersen, R.A.; Cui, H. Intention, action planning, and decision making in parietal-frontal circuits. Neuron 2009, 63, 568–583. [Google Scholar] [CrossRef]
- Chaisangmongkon, W.; Swaminathan, S.K.; Freedman, D.J.; Wang, X.-J. Computing by robust transience: How the fronto-parietal network performs sequential, category-based decisions. Neuron 2017, 93, 1504–1517. [Google Scholar] [CrossRef]
- Chand, G.B.; Dhamala, M. Interactions between the anterior cingulate-insula network and the fronto-parietal network during perceptual decision-making. NeuroImage 2017, 152, 381–389. [Google Scholar] [CrossRef]
- Luo, S.; Monterosso, J.R.; Sarpelleh, K.; Page, K.A. Differential effects of fructose versus glucose on brain and appetitive responses to food cues and decisions for food rewards. Proc. Natl. Acad. Sci. USA 2015, 112, 6509–6514. [Google Scholar] [CrossRef]
- Orquin, J.L.; Kurzban, R. A meta-analysis of blood glucose effects on human decision making. Psychol. Bull. 2016, 142, 546–567. [Google Scholar] [CrossRef]
- Page, K.A.; Chan, O.; Arora, J.; Belfort-DeAguiar, R.; Dzuira, J.; Roehmholdt, B.; Cline, G.W.; Naik, S.; Sinha, R.; Constable, R.T.; et al. Effects of fructose vs glucose on regional cerebral blood flow in brain regions involved with appetite and reward pathways. JAMA 2013, 309, 63–70. [Google Scholar] [CrossRef] [PubMed]
- Smeets, P.A.M.; de Graaf, C.; Stafleu, A.; van Osch, M.J.; van der Grond, J. Functional MRI of human hypothalamic responses following glucose ingestion. NeuroImage 2005, 24, 363–368. [Google Scholar] [CrossRef] [PubMed]
- Fan, J.; McCandliss, B.D.; Sommer, T.; Raz, A.; Posner, M.I. Testing the efficiency and independence of attentional networks. J. Cogn. Neurosci. 2002, 14, 340–347. [Google Scholar] [CrossRef]
- Yokum, S.; Ng, J.; Stice, E. Attentional bias to food images associated with elevated weight and future weight gain: An fMRI study. Obesity 2011, 19, 1775–1783. [Google Scholar] [CrossRef]
- Nitschke, J.B.; Dixon, G.E.; Sarinopoulos, I.; Short, S.J.; Cohen, J.D.; E Smith, E.; Kosslyn, S.M.; Rose, R.M.; Davidson, R.J. Altering expectancy dampens neural response to aversive taste in primary taste cortex. Nat. Neurosci. 2006, 9, 435–442. [Google Scholar] [CrossRef]
- Damak, S.; Rong, M.; Yasumatsu, K.; Kokrashvili, Z.; Varadarajan, V.; Zou, S.; Jiang, P.; Ninomiya, Y.; Margolskee, R.F. Detection of sweet and umami taste in the absence of taste receptor T1r3. Science 2003, 301, 850–853. [Google Scholar] [CrossRef]
- Nie, Y.; Vigues, S.; Hobbs, J.R.; Conn, G.L.; Munger, S.D. Distinct Contributions of T1R2 and T1R3 Taste Receptor Subunits to the Detection of Sweet Stimuli. Curr. Biol. 2005, 15, 1948–1952. [Google Scholar] [CrossRef]
- Jang, H.-J.; Kokrashvili, Z.; Theodorakis, M.J.; Carlson, O.D.; Kim, B.-J.; Zhou, J.; Kim, H.H.; Xu, X.; Chan, S.L.; Juhaszova, M.; et al. Gut-expressed gustducin and taste receptors regulate secretion of glucagon-like peptide-1. Proc. Natl. Acad. Sci. USA 2007, 104, 15069–15074. [Google Scholar] [CrossRef]
- Kohno, D.; Koike, M.; Ninomiya, Y.; Kojima, I.; Kitamura, T.; Yada, T. Sweet Taste Receptor Serves to Activate Glucose- and Leptin-Responsive Neurons in the Hypothalamic Arcuate Nucleus and Participates in Glucose Responsiveness. Front. Neurosci. 2016, 10, 502. [Google Scholar] [CrossRef]
- Button, K.S.; Ioannidis, J.P.A.; Mokrysz, C.; Nosek, B.A.; Flint, J.; Robinson, E.S.J.; Munafò, M.R. Power failure: Why small sample size undermines the reliability of neuroscience. Nat. Rev. Neurosci. 2013, 14, 365–376. [Google Scholar] [CrossRef] [PubMed]
- Gorgolewski, K.J.; Auer, T.; Calhoun, V.D.; Craddock, R.C.; Das, S.; Duff, E.P.; Flandin, G.; Ghosh, S.S.; Glatard, T.; Halchenko, Y.O.; et al. The brain imaging data structure, a format for organizing and describing outputs of neuroimaging experiments. Sci. Data 2016, 3, 160044. [Google Scholar] [CrossRef] [PubMed]
- Green, E.; Murphy, C. Altered processing of sweet taste in the brain of diet soda drinkers. Physiol. Behav. 2012, 107, 560–567. [Google Scholar] [CrossRef] [PubMed]
- Deichmann, R.; Gottfried, J.; Hutton, C.; Turner, R. Optimized EPI for fMRI studies of the orbitofrontal cortex. NeuroImage 2003, 19, 430–441. [Google Scholar] [CrossRef]
- Jenkinson, M.; Beckmann, C.F.; Behrens, T.E.J.; Woolrich, M.W.; Smith, S.M. “Fsl”. NeuroImage 2012, 62, 782–790. [Google Scholar] [CrossRef]
- Smith, S.M.; Jenkinson, M.; Woolrich, M.W.; Beckmann, C.F.; Behrens, T.E.; Johansen-Berg, H.; Bannister, P.R.; De Luca, M.; Drobnjak, I.; Flitney, D.E.; et al. Advances in functional and structural MR image analysis and implementation as FSL. NeuroImage 2004, 23, S208–S219. [Google Scholar] [CrossRef]
- Woolrich, M.W.; Jbabdi, S.; Patenaude, B.; Chappell, M.; Makni, S.; Behrens, T.; Beckmann, C.; Jenkinson, M.; Smith, S.M. Bayesian analysis of neuroimaging data in FSL. NeuroImage 2009, 45, S173–S186. [Google Scholar] [CrossRef]
- Jenkinson, M.; Bannister, P.; Brady, M.; Smith, S. Improved optimization for the robust and accurate linear registration and motion correction of brain images. NeuroImage 2002, 17, 825–841. [Google Scholar] [CrossRef]


| Characteristic | Mean ± SD or N (%) |
|---|---|
| Gender | |
| Male | 14 (50%) |
| Female | 14 (50%) |
| Age (years) | 25.36 ± 4.74 1 |
| BMI (kg/m2) | 27.61 ± 5.02 1 |
| Ethnicity | |
| Caucasian | 6 (21%) |
| Black or African American | 7 (25%) |
| Hispanic or Latino | 4 (14%) |
| Asian | 10 (36%) |
| Other | 1 (4%) |
| Education (degree) | |
| Bachelor’s | 18 (64%) |
| Graduate school level | 9 (32%) |
| High school | 1 (4%) |
| (Bid Difference from Overall Mean) | ||||
|---|---|---|---|---|
| Food Item | Mean Bid | Water | Sucralose | Glucose |
| Sundae | $2.33 | +$0.56 | −$0.24 | −$0.33 |
| Filled Chocolates | $1.73 | +$0.51 | −$0.13 | −$0.39 |
| Cheese and Cold Meat Platter | $1.73 | +$0.31 | −$0.28 | −$0.02 |
| Apple | $1.36 | +$0.30 | −$0.27 | −$0.04 |
| Waffle with Whipped Cream | $2.23 | +$0.39 | −$0.16 | −$0.23 |
| Sushi | $2.05 | +$0.32 | −$0.20 | −$0.13 |
| Tomatoes | $0.84 | +$0.25 | −$0.25 | −$0.01 |
| French Fries | $2.33 | +$0.34 | −$0.14 | −$0.20 |
| Gummi Candy and Licorice Mix | $1.15 | +$0.27 | −$0.20 | −$0.07 |
| Bowl of Rice | $1.16 | +$0.28 | −$0.18 | −$0.11 |
| Pizza (With Mushrooms) | $3.22 | +$0.34 | −$0.12 | −$0.22 |
| Crackers | $1.10 | +$0.24 | −$0.17 | −$0.06 |
| Nuts (Cashews) | $1.76 | +$0.20 | −$0.19 | −$0.02 |
| Cheese Platter | $1.84 | +$0.21 | −$0.17 | −$0.05 |
| Roast Beef | $3.03 | +$0.15 | −$0.22 | +$0.06 |
| Pizza (With Salami) | $3.33 | +$0.24 | −$0.12 | −$0.11 |
| Doughnut / Donut Jam | $1.84 | +$0.25 | −$0.06 | −$0.20 |
| Salad Plate | $2.02 | +$0.13 | −$0.17 | +$0.04 |
| Loaf of Bread | $1.29 | +$0.06 | −$0.20 | +$0.13 |
| Popcorn | $1.46 | +$0.17 | −$0.08 | −$0.09 |
| Crisp Bread | $0.80 | +$0.08 | −$0.16 | +$0.07 |
| Chocolate Muffin | $1.75 | +$0.10 | −$0.12 | +$0.01 |
| Broccoli | $0.92 | +$0.16 | $0.01 | −$0.17 |
| Peanuts | $1.04 | +$0.02 | −$0.07 | +$0.06 |
| Strawberries | $2.83 | −$0.01 | −$0.08 | +$0.10 |
| Banana | $1.19 | −$0.01 | −$0.07 | +$0.07 |
| Toast | $1.33 | −$0.05 | −$0.11 | +$0.17 |
| Opened Chips Bag | $1.44 | +$0.09 | +$0.04 | −$0.12 |
| Croissants | $2.28 | −$0.10 | +$0.03 | +$0.06 |
| Green Asparagus | $0.82 | −$0.09 | +$0.16 | −$0.06 |
| Food Attribute | Water Bid– Sucralose Bid | Water Bid– Glucose Bid | Sucralose Bid– Glucose Bid |
|---|---|---|---|
| palatability | 0.12 | 0.21 | 0.18 |
| healthiness | −0.28 | −0.41 | −0.3 (p = 0.1095) |
| familiarity | −0.03 | 0.01 | 0.07 |
| fat | 0.26 | 0.4 2 (p = 0.0275) | 0.31 1 (p = 0.097) |
| vitamin | −0.24 | −0.33 1 (p = 0.079) | −0.22 |
| sodium | 0.03 | 0.07 | 0.08 |
| calorie | 0.35 1 (p = 0.058) | 0.44 2 (p = 0.015) | 0.25 |
| carb | 0 | 0.1 | 0.18 |
| sugar | 0.3 (p = 0.113) | 0.38 2 (p = 0.0385) | 0.23 |
| protein | 0.12 | −0.06 | −0.27 |
Publisher’s Note: MDPI stays neutral with regard to jurisdictional claims in published maps and institutional affiliations. |
© 2020 by the authors. Licensee MDPI, Basel, Switzerland. This article is an open access article distributed under the terms and conditions of the Creative Commons Attribution (CC BY) license (http://creativecommons.org/licenses/by/4.0/).
Share and Cite
Zhang, X.; Luo, S.; Jones, S.; Hsu, E.; Page, K.A.; Monterosso, J.R. Impacts of Acute Sucralose and Glucose on Brain Activity during Food Decisions in Humans. Nutrients 2020, 12, 3283. https://doi.org/10.3390/nu12113283
Zhang X, Luo S, Jones S, Hsu E, Page KA, Monterosso JR. Impacts of Acute Sucralose and Glucose on Brain Activity during Food Decisions in Humans. Nutrients. 2020; 12(11):3283. https://doi.org/10.3390/nu12113283
Chicago/Turabian StyleZhang, Xiaobei, Shan Luo, Sabrina Jones, Eustace Hsu, Kathleen A. Page, and John R. Monterosso. 2020. "Impacts of Acute Sucralose and Glucose on Brain Activity during Food Decisions in Humans" Nutrients 12, no. 11: 3283. https://doi.org/10.3390/nu12113283
APA StyleZhang, X., Luo, S., Jones, S., Hsu, E., Page, K. A., & Monterosso, J. R. (2020). Impacts of Acute Sucralose and Glucose on Brain Activity during Food Decisions in Humans. Nutrients, 12(11), 3283. https://doi.org/10.3390/nu12113283