Vitamin D and ω-3 Supplementations in Mediterranean Diet During the 1st Year of Overt Type 1 Diabetes: A Cohort Study

 ,
,  , , ,
, , ,  ,
,
Abstract
1. Introduction
2. Materials and Methods
2.1. Supplementations
2.2. Diet
2.3. Assays
2.4. Statistical Analysis
2.5. Patients
3. Results
The Impact of the Diet
4. Discussion
5. Conclusions
Supplementary Materials
Author Contributions
Funding
Acknowledgments
Conflicts of Interest
References
- McClements, D.J.; Li, F.; Xiao, H. The Nutraceutical Bioavailability Classification Scheme: Classifying Nutraceuticals According to Factors Limiting their Oral Bioavailability. Annu. Rev. Food Sci. Technol. 2015, 6, 299–327. [Google Scholar] [CrossRef] [PubMed]
- Stene, L.C.; Joner, G.; Norwegian Childhood Diabetes Study Group. Use of cod liver oil during the first year of life is associated with lower risk of childhood-onset type 1 diabetes: A large, population-based, case-control study. Am. J. Clin. Nutr. 2003, 78, 1128–1134. [Google Scholar] [CrossRef] [PubMed]
- Hyppönen, E.; Läärä, E.; Reunanen, A.; Järvelin, M.-R.; Virtanen, S.M. Intake of vitamin D and risk of type 1 diabetes: A birth-cohort study. Lancet 2001, 358, 1500–1503. [Google Scholar] [CrossRef]
- Mathieu, C. Vitamin D and diabetes: Where do we stand? Diabetes Res. Clin. Pract. 2015, 108, 201–209. [Google Scholar] [CrossRef]
- Silvis, K.; Aronsson, C.A.; Liu, X.; Uusitalo, U.; Yang, J.; Tamura, R.; Lernmark, Å.; Rewers, M.; Hagopian, W.; She, J.; et al. Maternal dietary supplement use and development of islet autoimmunity in the offspring: TEDDY study. Pediatric Diabetes 2019, 20, 86–92. [Google Scholar] [CrossRef]
- Lamichhane, A.P.; Crandell, J.L.; Jaacks, L.M.; Couch, S.C.; Lawrence, J.M.; Mayer-Davis, E.J. Longitudinal associations of nutritional factors with glycated hemoglobin in youth with type 1 diabetes: The SEARCH Nutrition Ancillary Study. Am. J. Clin. Nutr. 2015, 101, 1278–1285. [Google Scholar] [CrossRef] [PubMed]
- Mayer-Davis, E.J.; Dabelea, D.; Crandell, J.L.; Crume, T.; D’Agostino, R.B.; Dolan, L.; King, I.B.; Lawrence, J.M.; Norris, J.M.; Pihoker, C.; et al. Nutritional Factors and Preservation of C-Peptide in Youth With Recently Diagnosed Type 1 Diabetes: SEARCH Nutrition Ancillary Study. Diabetes Care 2013, 36, 1842–1850. [Google Scholar] [CrossRef]
- Treiber, G.; Prietl, B.; Fröhlich-Reiterer, E.; Lechner, E.; Ribitsch, A.; Fritsch, M.; Rami-Merhar, B.; Steigleder-Schweiger, C.; Graninger, W.; Borkenstein, M.; et al. Cholecalciferol supplementation improves suppressive capacity of regulatory T-cells in young patients with new-onset type 1 diabetes mellitus—A randomized clinical trial. Clin. Immunol. 2015, 161, 217–224. [Google Scholar] [CrossRef]
- Habibian, N.; Amoli, M.M.; Abbasi, F.; Rabbani, A.; Alipour, A.; Sayarifard, F.; Rostami, P.; Dizaji, S.P.; Saadati, B.; Setoodeh, A. Role of vitamin D and vitamin D receptor gene polymorphisms on residual beta cell function in children with type 1 diabetes mellitus. Pharmacol. Rep. 2019, 71, 282–288. [Google Scholar] [CrossRef]
- Wang, B.; Smyl, C.; Chen, C.-Y.; Li, X.-Y.; Huang, W.; Zhang, H.-M.; Pai, V.; Kang, J. Suppression of Postprandial Blood Glucose Fluctuations by a Low-Carbohydrate, High-Protein, and High-Omega-3 Diet via Inhibition of Gluconeogenesis. Int. J. Mol. Sci. 2018, 19, 1823. [Google Scholar] [CrossRef]
- Bellini, L.; Campana, M.; Rouch, C.; Chacinska, M.; Bugliani, M.; Meneyrol, K.; Hainault, I.; Lenoir, V.; Denom, J.; Véret, J.; et al. Protective role of the ELOVL2/docosahexaenoic acid axis in glucolipotoxicity-induced apoptosis in rodent beta cells and human islets. Diabetologia 2018, 61, 1780–1793. [Google Scholar] [CrossRef] [PubMed]
- Bi, X.; Li, F.; Liu, S.; Jin, Y.; Zhang, X.; Yang, T.; Dai, Y.; Li, X.; Zhao, A.Z. ω-3 polyunsaturated fatty acids ameliorate type 1 diabetes and autoimmunity. J. Clin. Investig. 2017, 127, 1757–1771. [Google Scholar] [CrossRef] [PubMed]
- Regnell, S.E.; Lernmark, Å. Early prediction of autoimmune (type 1) diabetes. Diabetologia 2017, 60, 1370–1381. [Google Scholar] [CrossRef] [PubMed]
- Steffes, M.W.; Sibley, S.; Jackson, M.; Thomas, W. -Cell Function and the Development of Diabetes-Related Complications in the Diabetes Control and Complications Trial. Diabetes Care 2003, 26, 832–836. [Google Scholar] [CrossRef] [PubMed]
- Baidal, D.A.; Ricordi, C.; Garcia-Contreras, M.; Sonnino, A.; Fabbri, A. Combination high-dose Omega-3 fatty acids and high-dose cholecalciferol in new onset type 1 diabetes. Eur. Rev. Med. Pharmacol. Sci. 2016, 20, 3313–3318. [Google Scholar] [PubMed]
- Cadario, F.; Savastio, S.; Ricotti, R.; Rizzo, A.M.; Carrera, D.; Maiuri, L.; Ricordi, C. Administration of vitamin D and high dose of omega 3 to sustain remission of type 1 diabetes. Eur. Rev. Med. Pharmacol. Sci. 2018, 22, 512–515. [Google Scholar]
- Cadario, F.; Savastio, S.; Rizzo, A.M.; Carrera, D.; Bona, G.; Ricordi, C. Can Type 1 diabetes progression be halted? Possible role of high dose vitamin D and omega 3 fatty acids. Eur. Rev. Med. Pharmacol. Sci. 2017, 21, 1604–1609. [Google Scholar]
- American Diabetes Association 2. Classification and Diagnosis of Diabetes. Diabetes Care 2017, 40, S11–S24. [Google Scholar] [CrossRef]
- Donaghue, K.C.; Wadwa, R.P.; Dimeglio, L.A.; Wong, T.Y.; Chiarelli, F.; Marcovecchio, M.L.; Salem, M.; Raza, J.; Hofman, P.L.; Craig, M.E. Microvascular and macrovascular complications in children and adolescents: Microvascular and macrovascular complications. Pediatric Diabetes 2014, 15, 257–269. [Google Scholar] [CrossRef]
- Cacciari, E.; Milani, S.; Balsamo, A.; Spada, E.; Bona, G.; Cavallo, L.; Cerutti, F.; Gargantini, L.; Greggio, N.; Tonini, G.; et al. Italian cross-sectional growth charts for height, weight and BMI (2 to 20 yr). J. Endocrinol. Investig. 2006, 29, 581–593. [Google Scholar] [CrossRef]
- Holick, M.F.; Binkley, N.C.; Bischoff-Ferrari, H.A.; Gordon, C.M.; Hanley, D.A.; Heaney, R.P.; Murad, M.H.; Weaver, C.M. Evaluation, Treatment, and Prevention of Vitamin D Deficiency: An Endocrine Society Clinical Practice Guideline. J. Clin. Endocrinol. Metab. 2011, 96, 1911–1930. [Google Scholar] [CrossRef] [PubMed]
- Holick, M.F.; Binkley, N.C.; Bischoff-Ferrari, H.A.; Gordon, C.M.; Hanley, D.A.; Heaney, R.P.; Murad, M.H.; Weaver, C.M. Guidelines for Preventing and Treating Vitamin D Deficiency and Insufficiency Revisited. J. Clin. Endocrinol. Metab. 2012, 97, 1153–1158. [Google Scholar] [CrossRef] [PubMed]
- The DIAMOND Project Group Incidence and trends of childhood Type 1 diabetes worldwide 1990–1999. Diabet. Med. 2006, 23, 857–866. [CrossRef] [PubMed]
- Cadario, F.; Prodam, F.; Pasqualicchio, S.; Bellone, S.; Bonsignori, I.; Demarchi, I.; Monzani, A.; Bona, G. Lipid profile and nutritional intake in children and adolescents with Type 1 diabetes improve after a structured dietician training to a Mediterranean-style diet. J. Endocrinol. Investig. 2012, 35, 160–168. [Google Scholar]
- Rizzo, A.M.; Montorfano, G.; Negroni, M.; Adorni, L.; Berselli, P.; Corsetto, P.; Wahle, K.; Berra, B. A rapid method for determining arachidonic:eicosapentaenoic acid ratios in whole blood lipids: Correlation with erythrocyte membrane ratios and validation in a large Italian population of various ages and pathologies. Lipids Health Dis. 2010, 9, 7. [Google Scholar] [CrossRef] [PubMed]
- Hao, W.; Gitelman, S.; DiMeglio, L.A.; Boulware, D.; Greenbaum, C.J. Fall in C-Peptide During First 4 Years From Diagnosis of Type 1 Diabetes: Variable Relation to Age, HbA1c, and Insulin Dose. Diabetes Care 2016, 39, 1664–1670. [Google Scholar] [CrossRef] [PubMed]
- Zhong, V.W.; Lamichhane, A.P.; Crandell, J.L.; Couch, S.C.; Liese, A.D.; The, N.S.; Tzeel, B.A.; Dabelea, D.; Lawrence, J.M.; Marcovina, S.M.; et al. Association of adherence to a Mediterranean diet with glycemic control and cardiovascular risk factors in youth with type I diabetes: The SEARCH Nutrition Ancillary Study. Eur. J. Clin. Nutr. 2016, 70, 802–807. [Google Scholar] [CrossRef] [PubMed]
- Gregoriou, E.; Mamais, I.; Tzanetakou, I.; Lavranos, G.; Chrysostomou, S. The Effects of Vitamin D Supplementation in Newly Diagnosed Type 1 Diabetes Patients: Systematic Review of Randomized Controlled Trials. Rev. Diabet. Stud. 2017, 14, 260–268. [Google Scholar] [CrossRef] [PubMed]
- Bener, A.; Alsaied, A.; Al-Ali, M.; Al-Kubaisi, A.; Basha, B.; Abraham, A.; Guiter, G.; Mian, M. High prevalence of vitamin D deficiency in type 1 diabetes mellitus and healthy children. Acta Diabetol. 2009, 46, 183–189. [Google Scholar] [CrossRef]
- Greer, R.M.; Portelli, S.L.; Hung, B.S.-M.; Cleghorn, G.J.; McMahon, S.K.; Batch, J.A.; Conwell, L.S. Serum vitamin D levels are lower in Australian children and adolescents with type 1 diabetes than in children without diabetes: Vitamin D in Australian children with diabetes. Pediatric Diabetes 2013, 14, 31–41. [Google Scholar] [CrossRef] [PubMed]
- Franchi, B.; Piazza, M.; Sandri, M.; Mazzei, F.; Maffeis, C.; Boner, A.L. Vitamin D at the onset of type 1 diabetes in Italian children. Eur. J. Pediatrics 2014, 173, 477–482. [Google Scholar] [CrossRef] [PubMed]
- Jamilian, M.; Samimi, M.; Ebrahimi, F.A.; Hashemi, T.; Taghizadeh, M.; Razavi, M.; Sanami, M.; Asemi, Z. The effects of vitamin D and omega-3 fatty acid co-supplementation on glycemic control and lipid concentrations in patients with gestational diabetes. J. Clin. Lipidol. 2017, 11, 459–468. [Google Scholar] [CrossRef] [PubMed]
- Kouchaki, E.; Afarini, M.; Abolhassani, J.; Mirhosseini, N.; Bahmani, F.; Masoud, S.A.; Asemi, Z. High-dose ω-3 Fatty Acid Plus Vitamin D3 Supplementation Affects Clinical Symptoms and Metabolic Status of Patients with Multiple Sclerosis: A Randomized Controlled Clinical Trial. J. Nutr. 2018, 148, 1380–1386. [Google Scholar] [CrossRef] [PubMed]


| Cases | Controls | p Value | |
|---|---|---|---|
| n | 26 | 38 | |
| Gender (female/male) | 14/12 | 20/17 | |
| Age (years) | 8.7 ± 4.6 | 8.8 ± 3.6 | NS |
| Body weight (Kg) | 30.7 ± 17.5 | 32 ± 14 | NS |
| BMI (Kg/m2) | −0.92 ± 1.1 | −1.1 ± 2 | NS |
| HbA1c% | 11.3 ± 2.2 | 11.6 ± 2.6 | NS |
| Insulin dose (UI/Kg/day) | 0.61 ± 0.22 | 0.69 ± 0.28 | NS |
| CSII/MDI device | 2/24 | 11/27 |
| T0 | T3 | T6 | T12 | pfor trend | |
|---|---|---|---|---|---|
| C-peptide (ng/mL) | 0.9 ± 0.7 a | 0.5 ± 0.3 | - | 0.38 ± 0.5 a | p < 0.01 |
| Mean Glucose (mg/dl) | 140 ± 26 | 155 ± 48 | 148 ± 38 | 141 ± 34 | NS |
| SD | 50 ± 18 | 45 ± 24 | 50 ± 24 | 57 ± 25 | NS |
| Vitamin D (nmol/L) | 31 ± 12 b | 41 ± 14 | - | 35 ± 12 b | p < 0.001 |
| AA/EPA | 55 ± 38 a | 6.8 ± 5 | - | 8.8 ± 6 a | p < 0.0001 |
| Timing | p Value | ||||
|---|---|---|---|---|---|
| T0 | n | S | n | NS | |
| Insulin (IU/Kg/day) | 26 | 0.61 ± 0.22 | 38 | 0.69 ± 0.28 | NS |
| HbA1c (%) | 11.3 ± 2.2 | 11.6 ± 2.6 | NS | ||
| T3 | n | S | n | NS | |
| Insulin (IU/Kg/day) | 22 | 0.37 ± 0.3 | 37 | 0.41 ± 0.2 | NS |
| Insulin bolus (IU/Kg/day) | 0.17 ± 0.1 | 0.22 ± 0.1 | NS | ||
| Insulin basal (IU/Kg/day) | 0.20 ± 0.1 | 0.19 ± 0.1 | NS | ||
| HbA1c (%) | 7.3 ± 1.1 | 7.6 ± 0.1 | NS | ||
| IDAA1c < 9 (%) | 50% | 53% | NS | ||
| T6 | n | S | n | NS | |
| Insulin (IU/Kg/day) | 22 | 0.44 ± 0.2 | 37 | 0.51 ± 0.2 | NS |
| Insulin bolus (IU/Kg/day) | 0.20 ± 0.1 | 0.27 ± 0.1 | 0.06 | ||
| Insulin basal (IU/Kg/day) | 0.24 ± 0.1 | 0.23 ± 0.1 | NS | ||
| HbA1c (%) | 7.4 ± 1.1 | 7.5 ± 1.1 | NS | ||
| IDAA1c < 9 | 50% | 34.1% | NS | ||
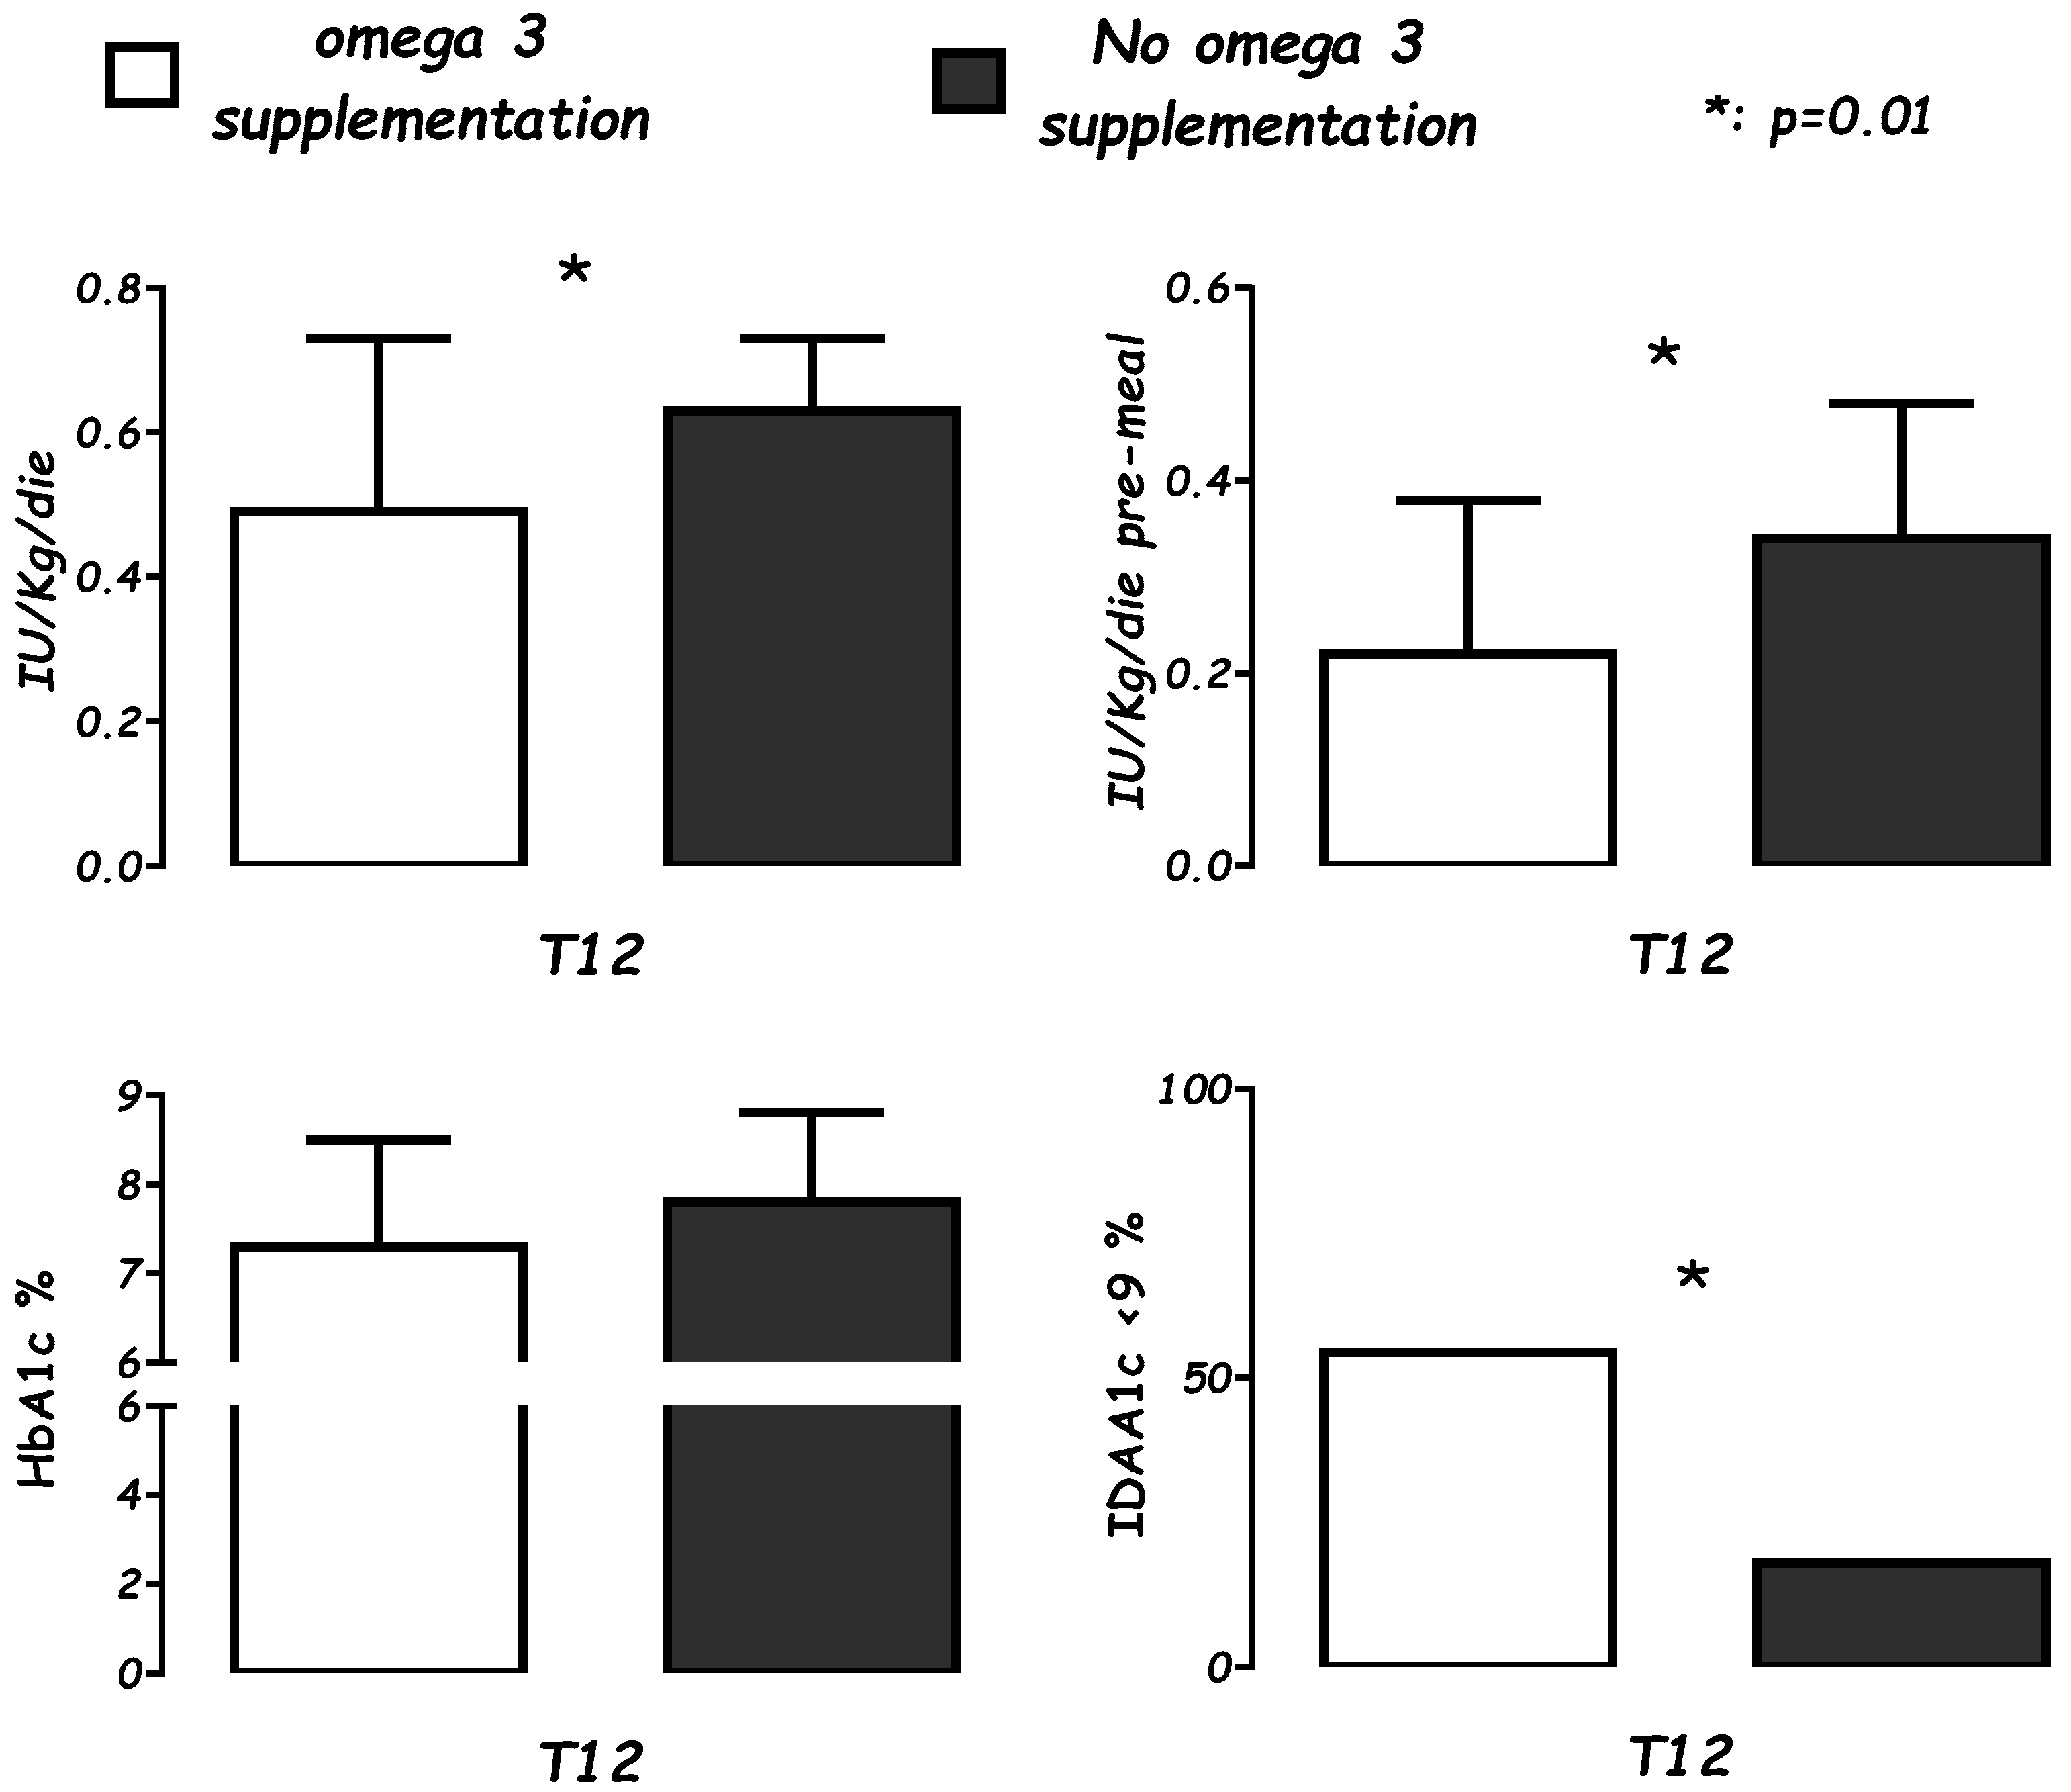
| T12 | n | S | n | NS | |
| Insulin (IU/Kg/day) | 22 | 0.49 ± 0.2 | 37 | 0.63 ± 0.1 | <0.01 |
| Insulin bolus (IU/Kg/day) | 0.22 ± 0.1 | 0.34 ± 0.1 | <0.01 | ||
| Insulin basal (IU/Kg/day) | 0.29 ± 0.1 | 0.28 ± 0.09 | NS | ||
| HbA1c (%) | 7.4 ± 1 | 7.8 ± 1.0 | NS | ||
| IDAA1c < 9 | 54.5% | 18.9% | <0.01 | ||
| Diet Intake | T0 | T12 | p |
|---|---|---|---|
| Caloric intake (Kcal/day) | 1739 ± 556 | 1576 ± 463 | 0.09 |
| Protein g/day | 73 ± 21 | 61.4 ± 20 | <0.05 |
| Lipid g/day | 66 ± 16 | 64 ± 18 | NS |
| CHO g/day | 221 ± 87 | 190 ± 73 | 0.09 |
| Fiber g/day | 18 ± 7.3 | 14 ± 4.6 | <0.05 |
| Vitamin D µg/day | 4 ± 2.7 | 4.6 ± 1.9 | NS |
| PUFAs g/day | 8.6 ± 3.9 | 10.8 ± 6.5 | NS |
| AA g/day | 0.25 ± 0.1 | 0.20 ± 0.1 | <0.01 |
| EPA g/day | 0.22 ± 0.1 | 0.22 ± 0.1 | NS |
| DHA g/day | 0.35 ± 25 | 0.43 ± 0.22 | NS |
© 2019 by the authors. Licensee MDPI, Basel, Switzerland. This article is an open access article distributed under the terms and conditions of the Creative Commons Attribution (CC BY) license (http://creativecommons.org/licenses/by/4.0/).
Share and Cite
Cadario, F.; Pozzi, E.; Rizzollo, S.; Stracuzzi, M.; Beux, S.; Giorgis, A.; Carrera, D.; Fullin, F.; Riso, S.; Rizzo, A.M.; et al. Vitamin D and ω-3 Supplementations in Mediterranean Diet During the 1st Year of Overt Type 1 Diabetes: A Cohort Study. Nutrients 2019, 11, 2158. https://doi.org/10.3390/nu11092158
Cadario F, Pozzi E, Rizzollo S, Stracuzzi M, Beux S, Giorgis A, Carrera D, Fullin F, Riso S, Rizzo AM, et al. Vitamin D and ω-3 Supplementations in Mediterranean Diet During the 1st Year of Overt Type 1 Diabetes: A Cohort Study. Nutrients. 2019; 11(9):2158. https://doi.org/10.3390/nu11092158
Chicago/Turabian StyleCadario, Francesco, Erica Pozzi, Stefano Rizzollo, Marta Stracuzzi, Sheila Beux, Alberto Giorgis, Deborah Carrera, Fabiola Fullin, Sergio Riso, Angela Maria Rizzo, and et al. 2019. "Vitamin D and ω-3 Supplementations in Mediterranean Diet During the 1st Year of Overt Type 1 Diabetes: A Cohort Study" Nutrients 11, no. 9: 2158. https://doi.org/10.3390/nu11092158
APA StyleCadario, F., Pozzi, E., Rizzollo, S., Stracuzzi, M., Beux, S., Giorgis, A., Carrera, D., Fullin, F., Riso, S., Rizzo, A. M., Montorfano, G., Bagnati, M., Dianzani, U., Caimmi, P., Bona, G., & Ricordi, C. (2019). Vitamin D and ω-3 Supplementations in Mediterranean Diet During the 1st Year of Overt Type 1 Diabetes: A Cohort Study. Nutrients, 11(9), 2158. https://doi.org/10.3390/nu11092158