Milk and Dairy Products and Their Nutritional Contribution to the Average Polish Diet


Abstract
1. Introduction
2. Methods
2.1. Study Overview
2.2. Sample Selection Method
2.3. Food Grouping
2.4. Statistical Analysis
3. Results
3.1. Milk and Dairy Products as Sources of Energy
3.2. Milk and Dairy Products as Sources of Protein, Amino Acids, Carbohydrates, Total Fats, Fatty Acids, and Cholesterol
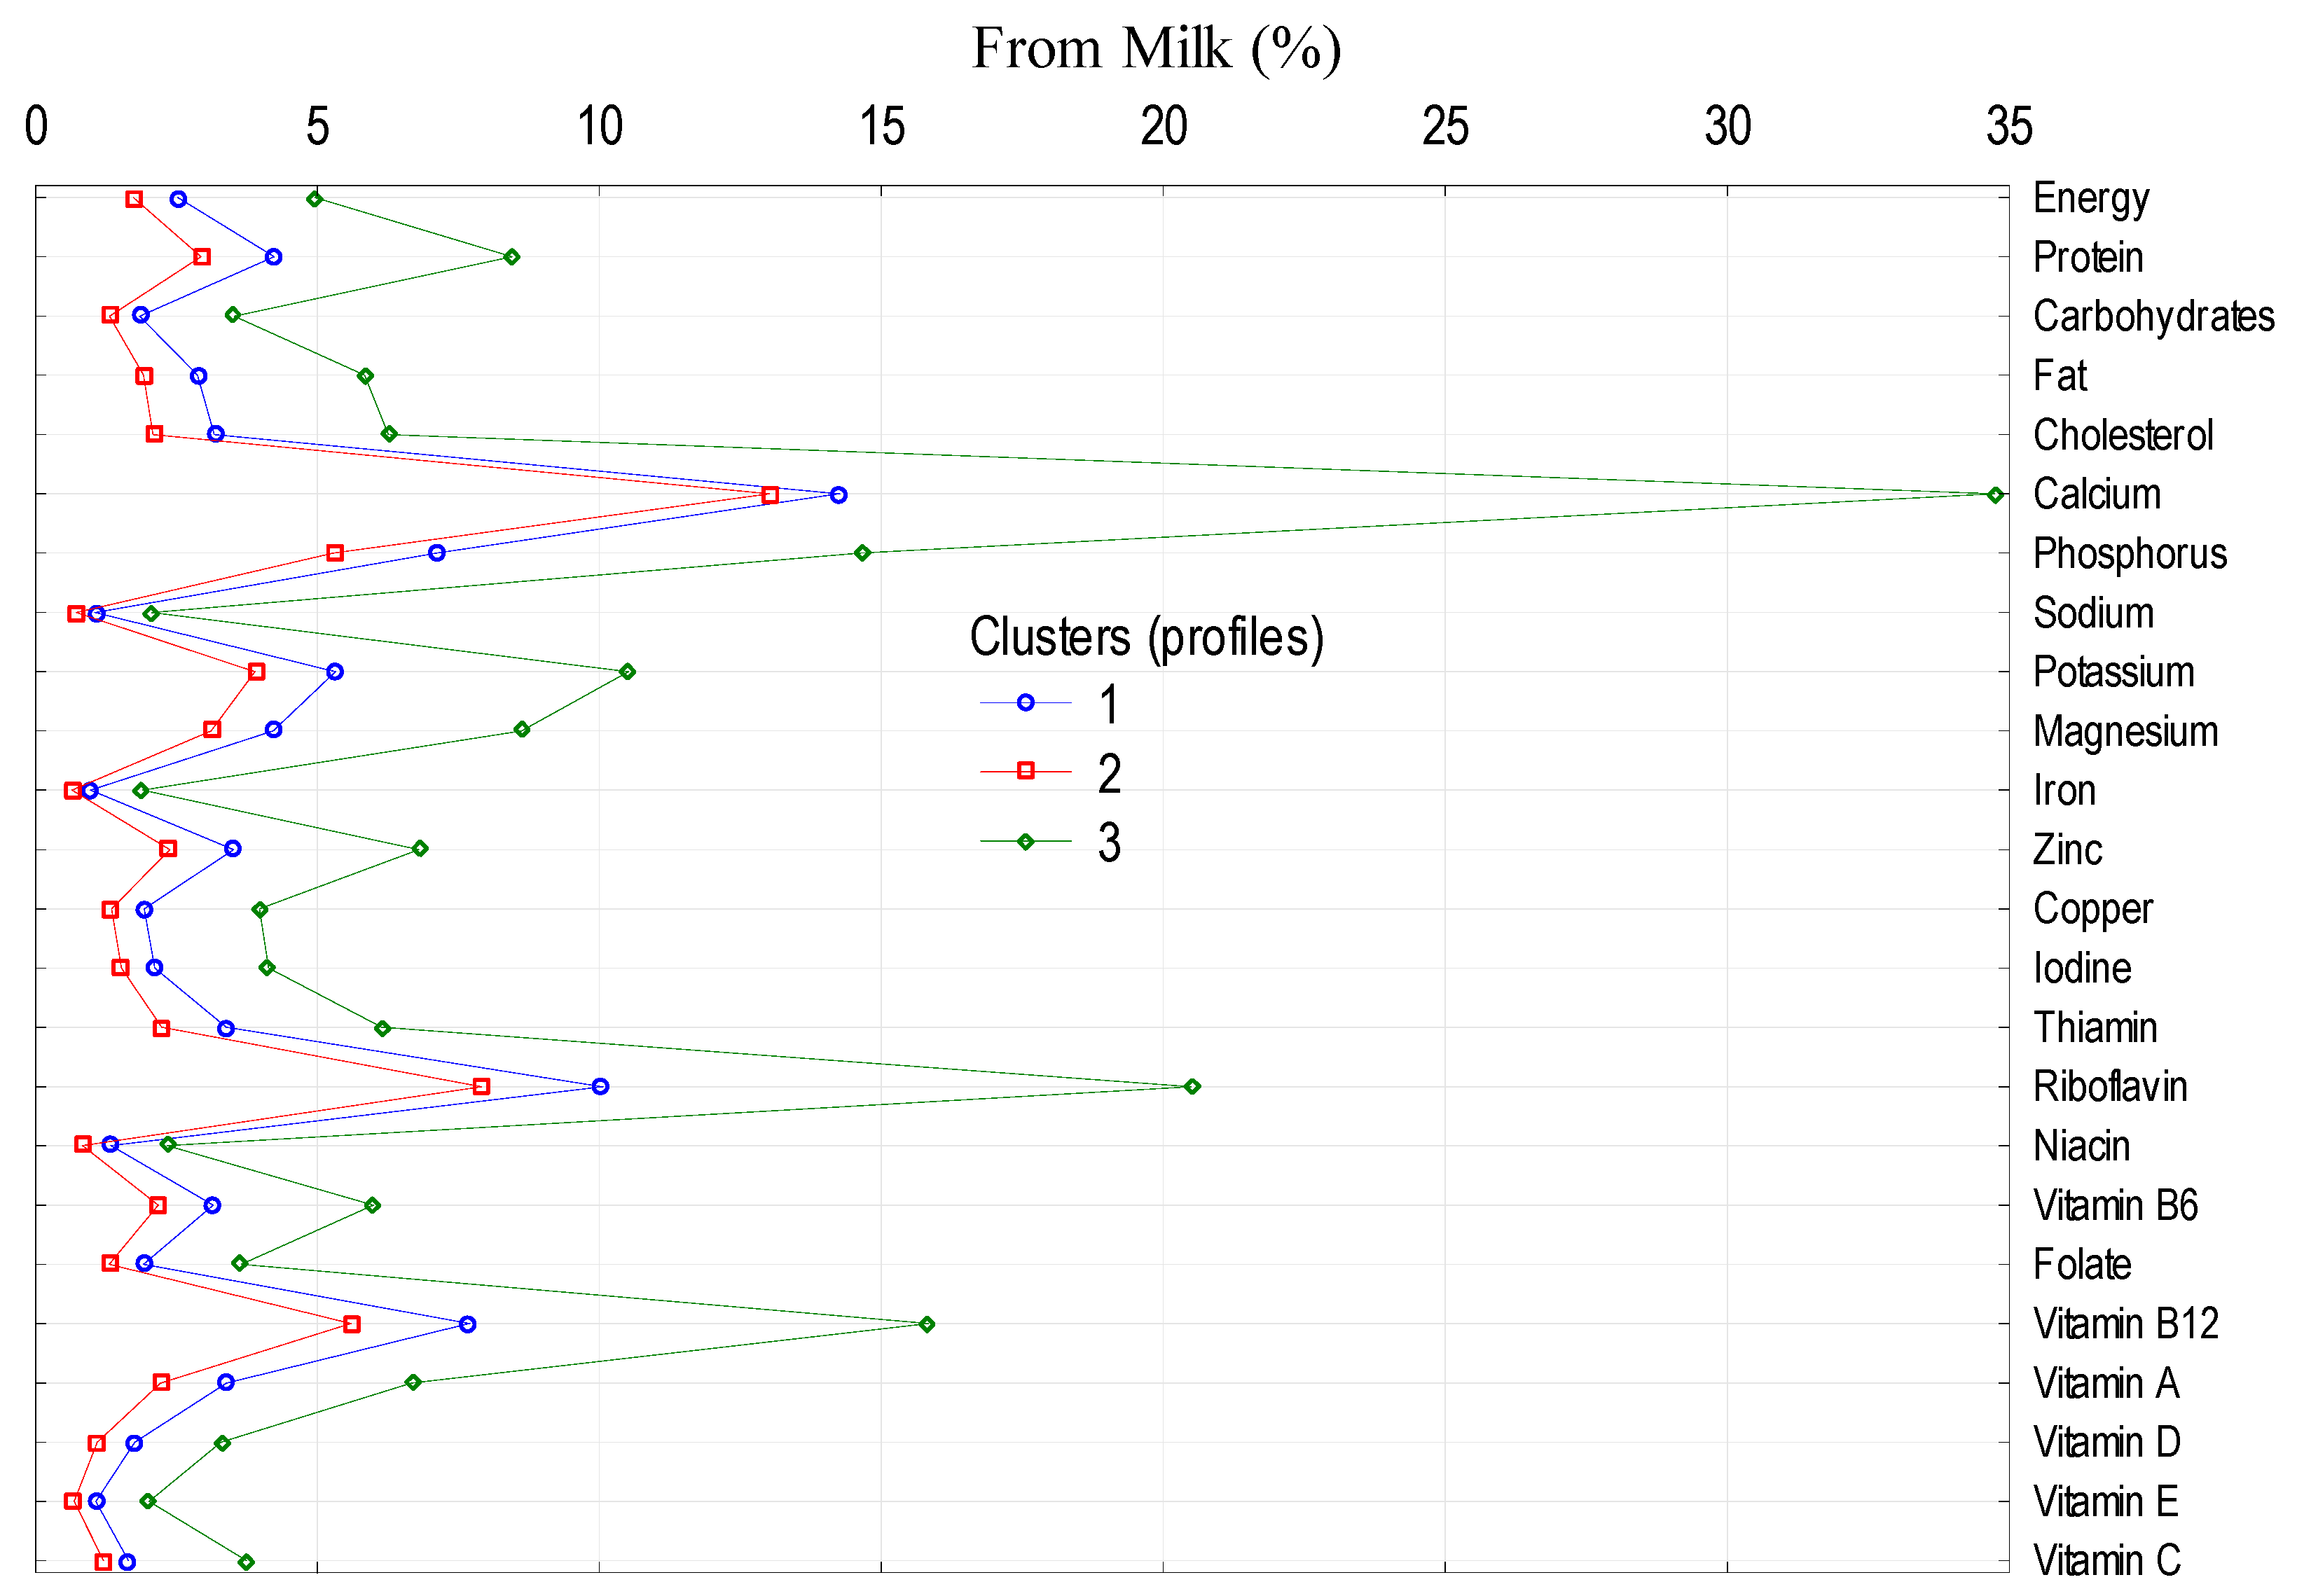
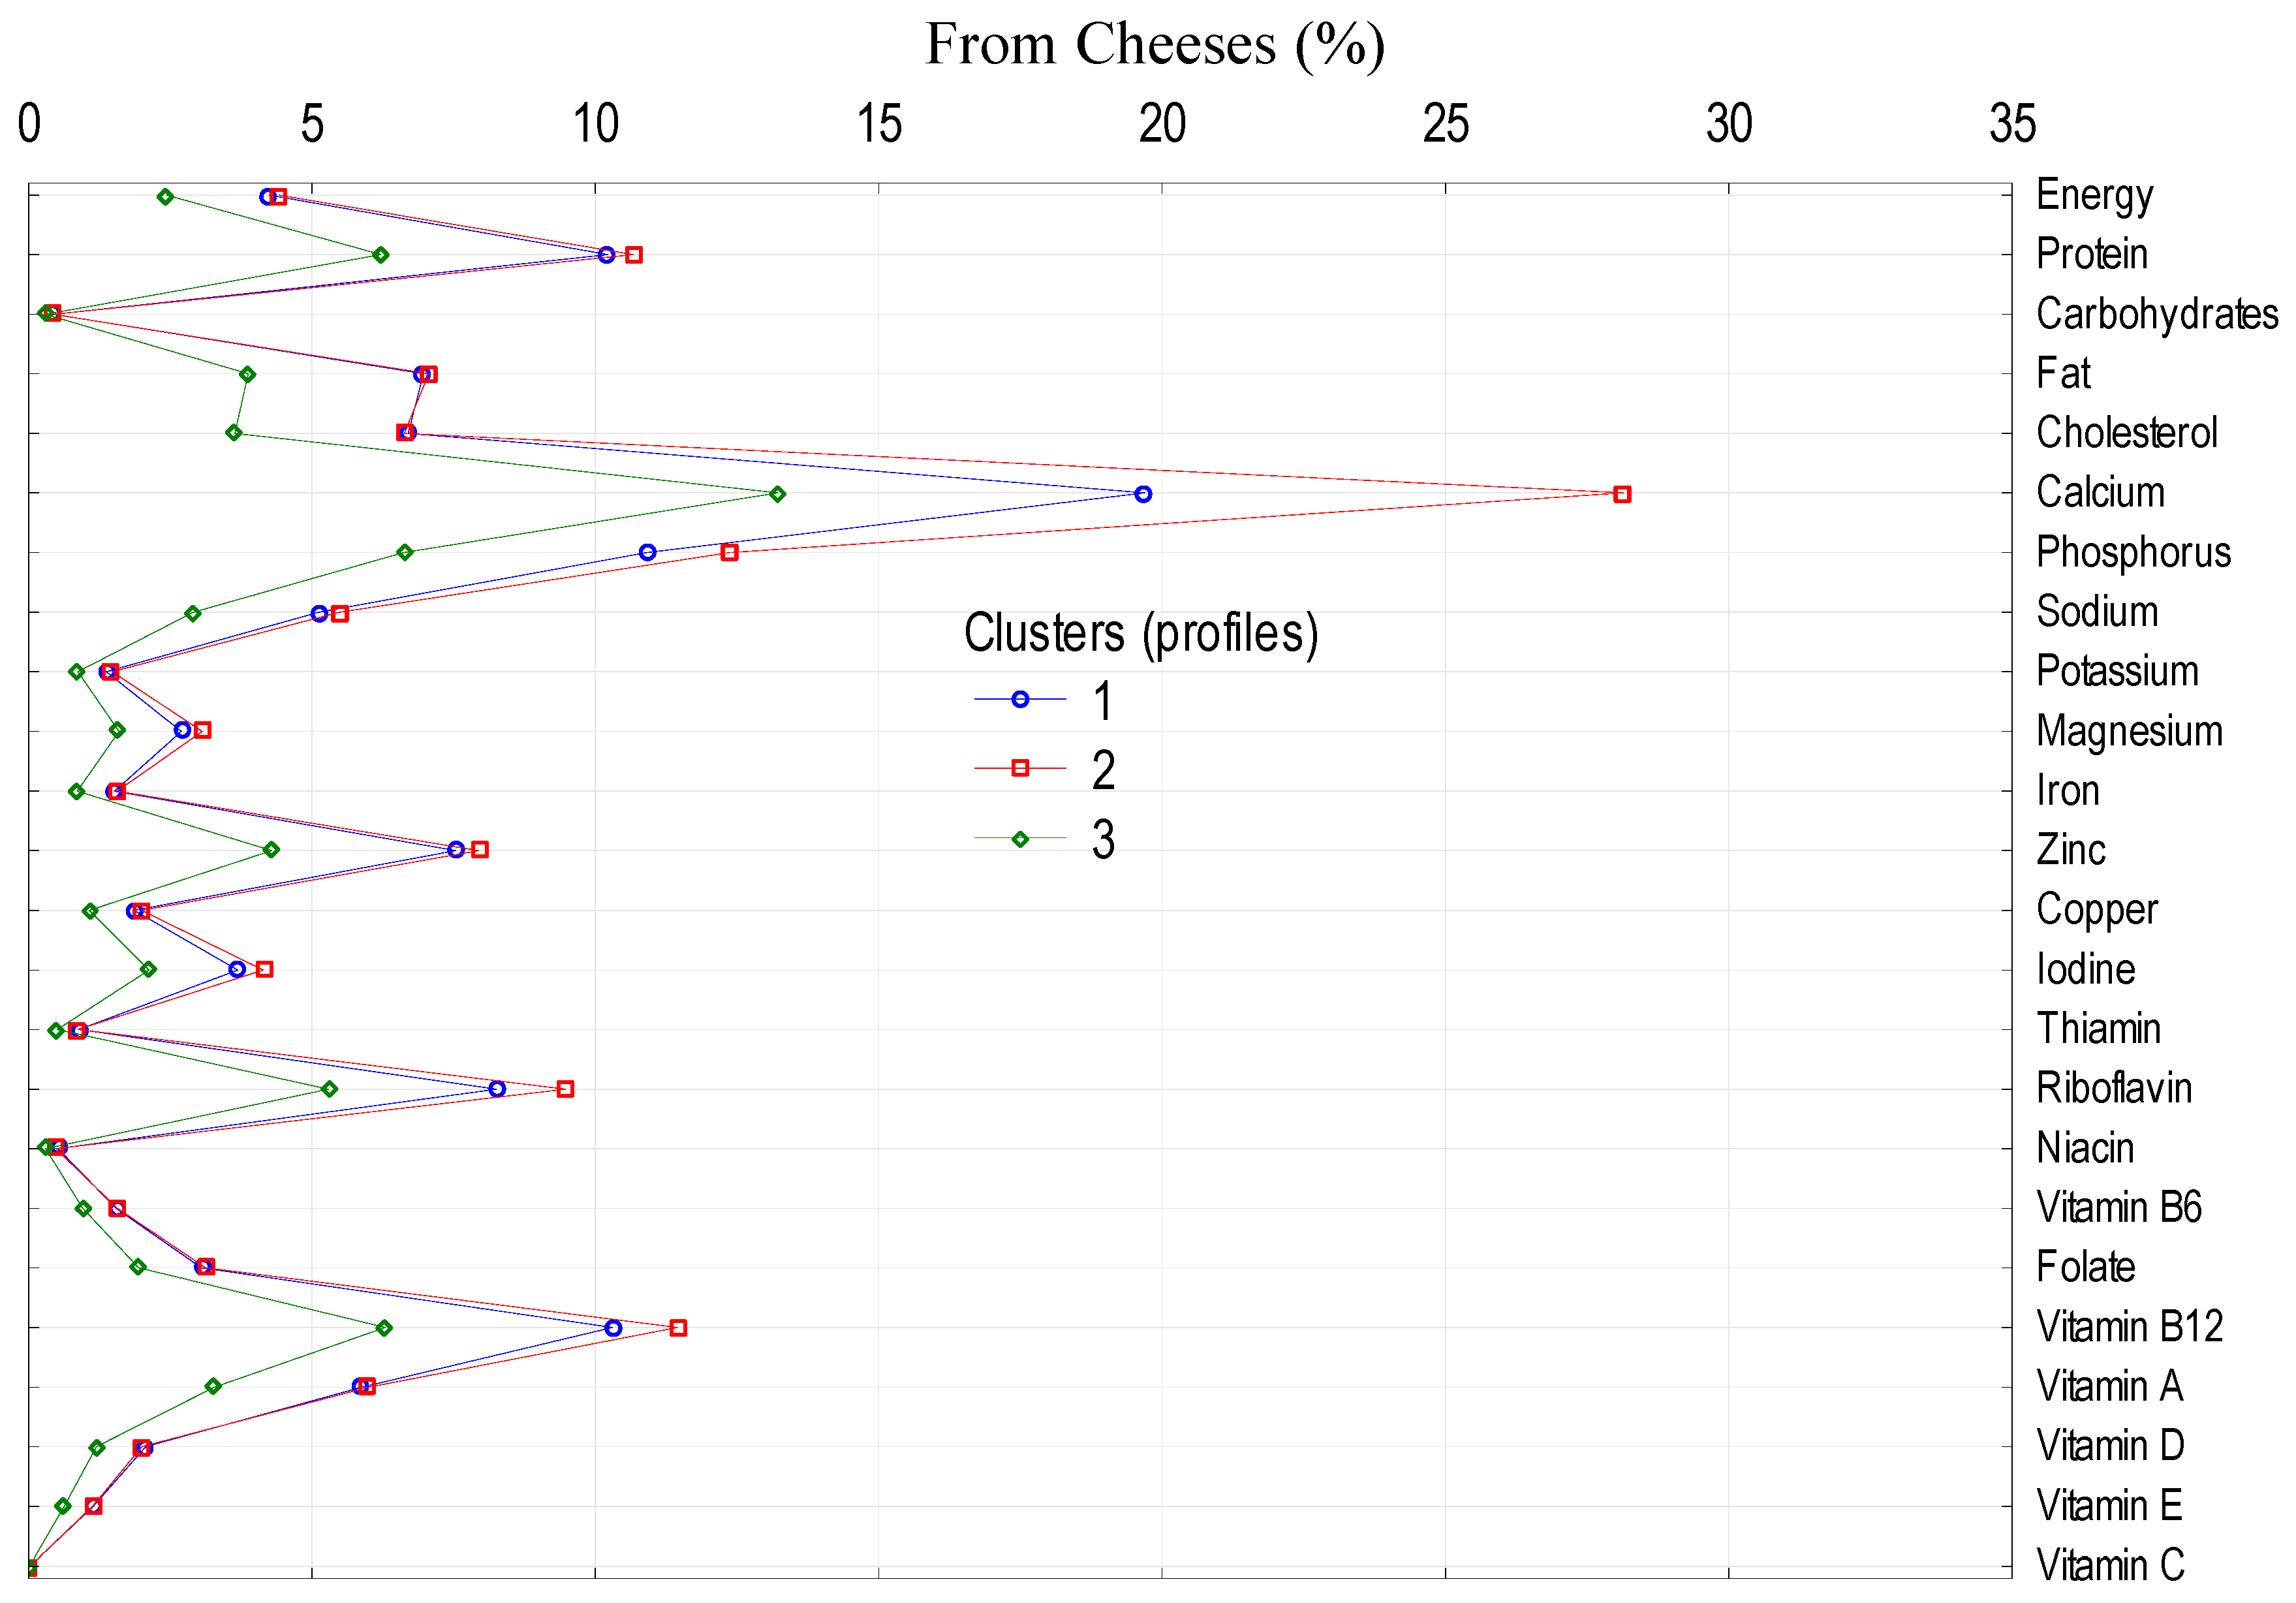
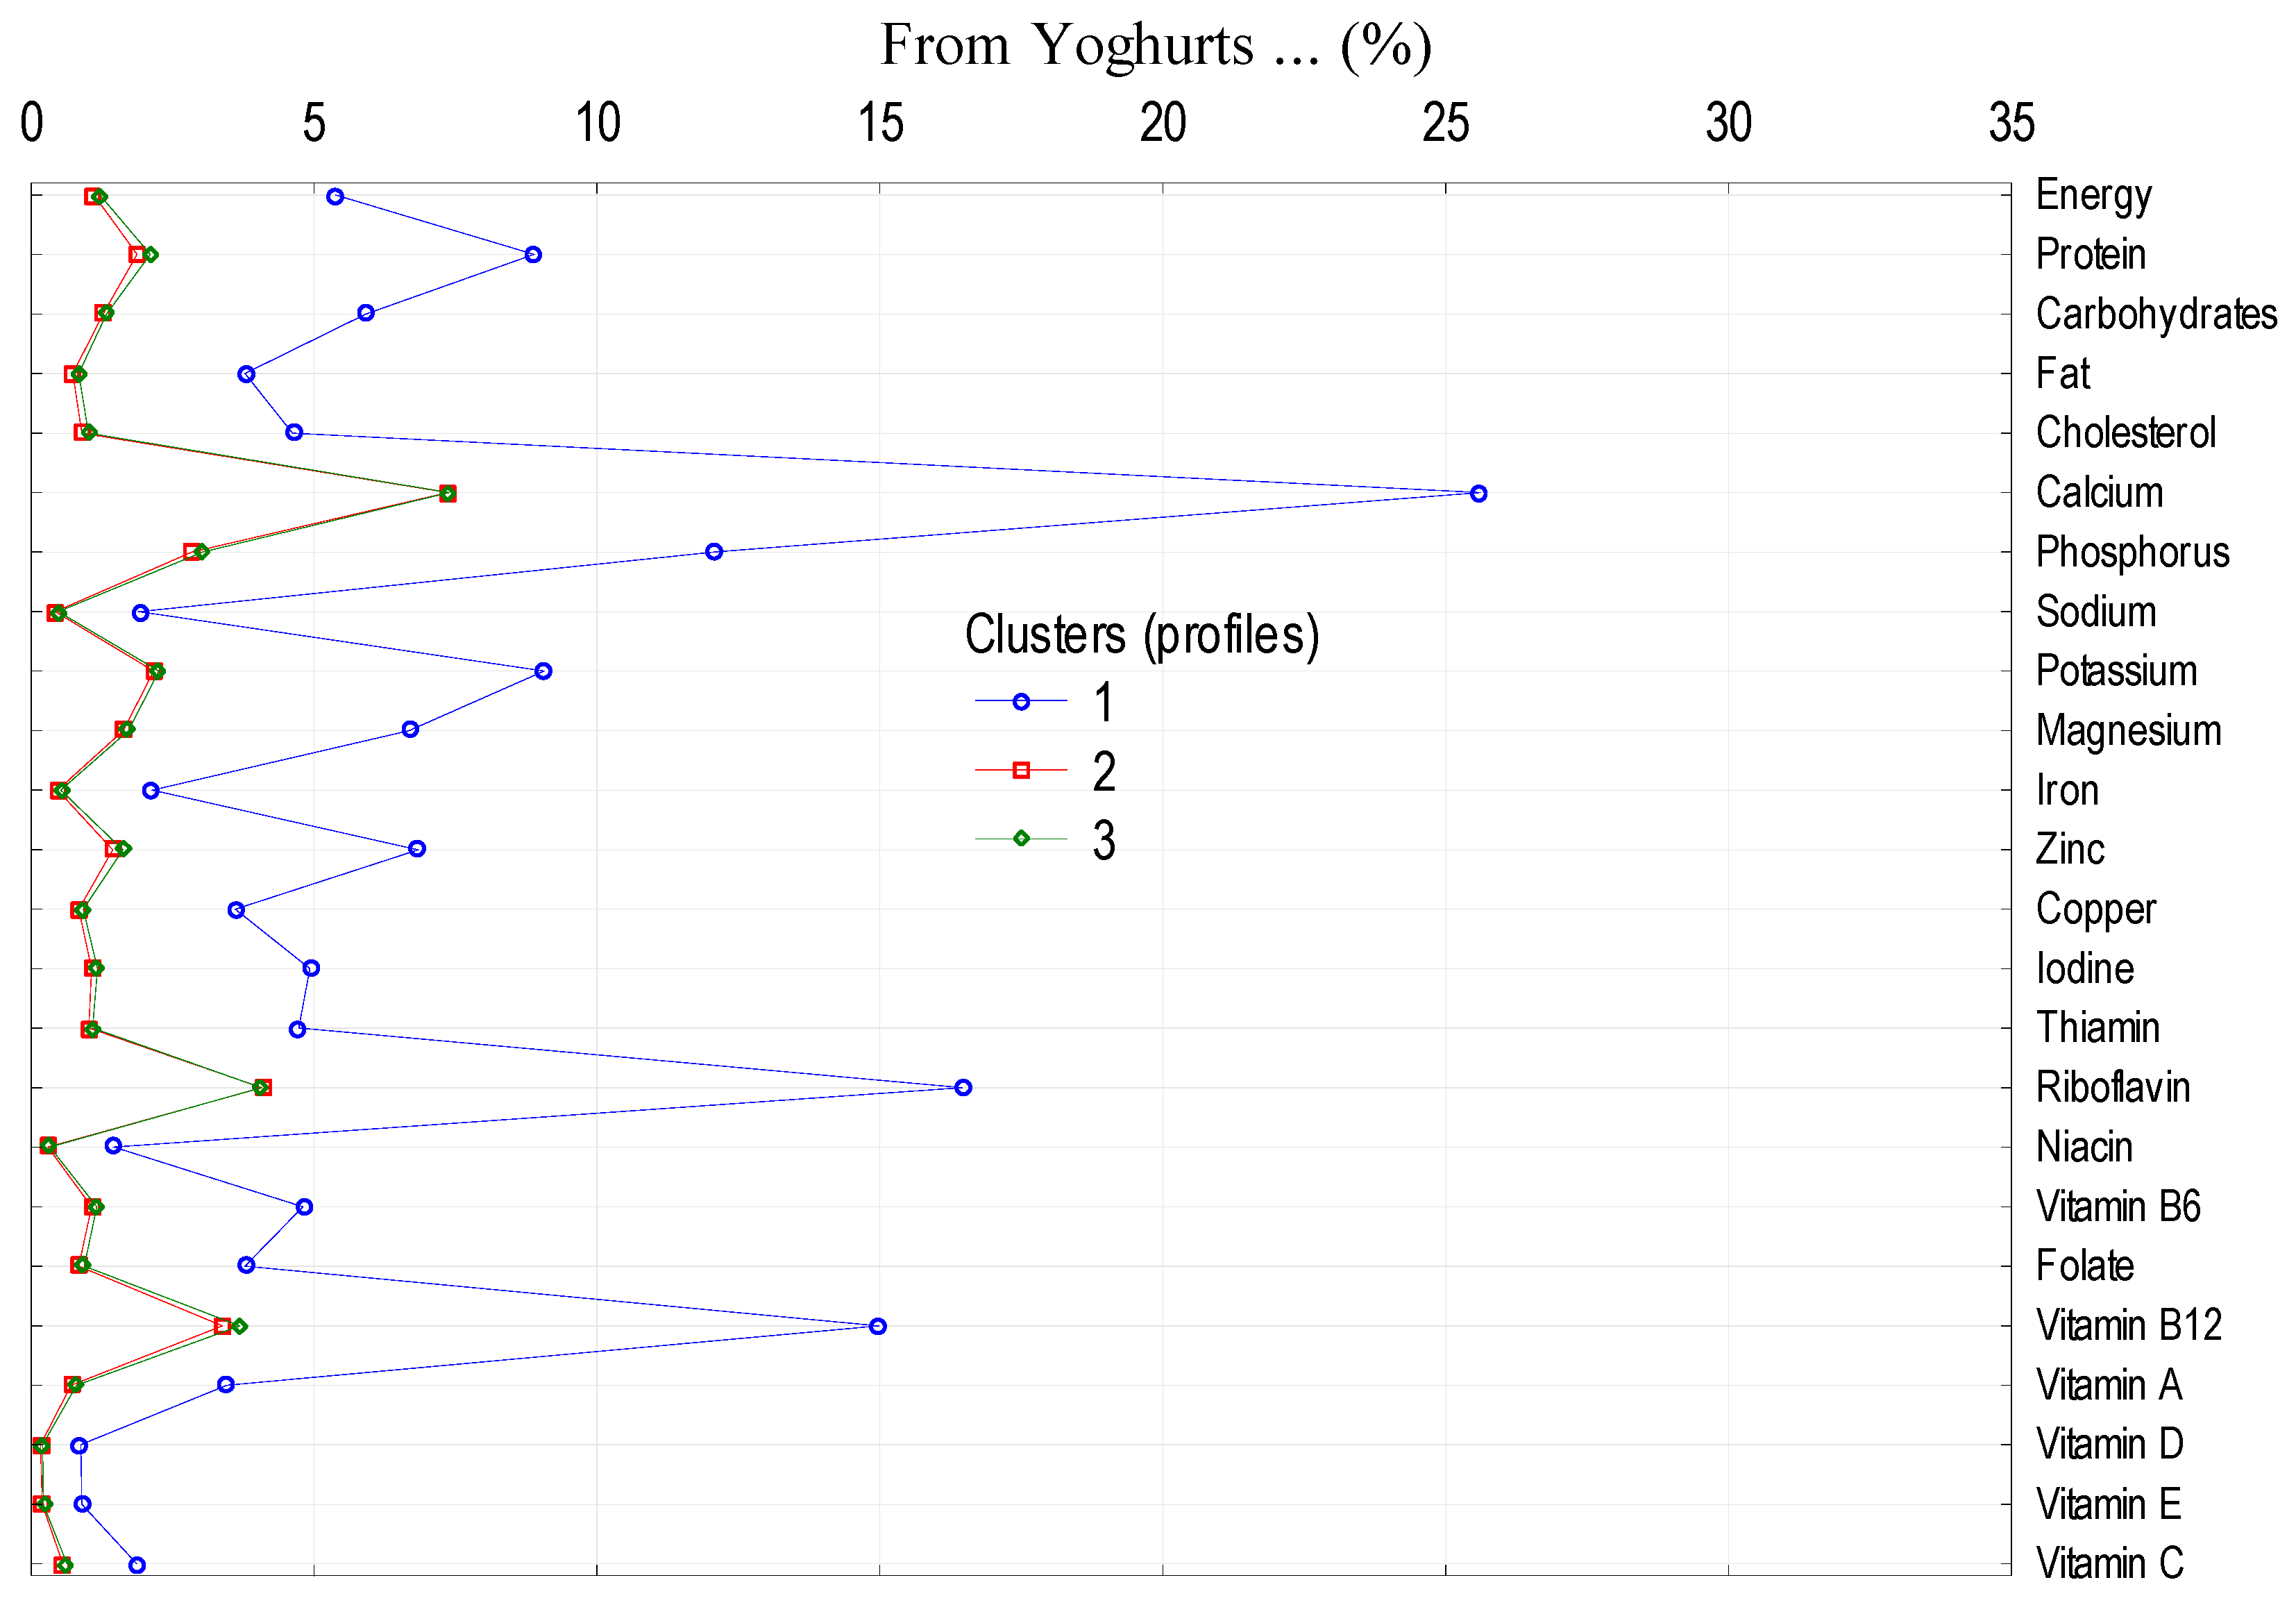
3.3. Milk and Dairy Products as Sources of Minerals and Vitamins
3.4. Summary
4. Discussion
5. Conclusions
Author Contributions
Funding
Acknowledgments
Conflicts of Interest
References
- Park, Y.W. Introduction: Overview of bioactive components in milk and dairy products. In Bioactive Components in Milk and Dairy Products; Park, Y.W., Ed.; Publishers, Wiley- Blackwell: Ames, Iowa; Oxford, UK, 2009; pp. 3–14. ISBN 978-3-86944-021-7. [Google Scholar]
- Haug, A.; Høstmark, A.T.; Harstad, O.M. Bovine milk in human nutrition — A review. Lipids Health Dis. 2007, 6, 1–16. [Google Scholar] [CrossRef] [PubMed]
- Visioli, F.; Strata, A. Milk, dairy products, and their functional effects in humans: A narrative review of recent evidence. Adv. Nutr. 2014, 5, 131–143. [Google Scholar] [CrossRef] [PubMed]
- Mcgrane, M.M.; Essery, E.; Obbagy, J.; Lyon, J.; Macneil, P.; Spahn, J.; van Horn, L. Dairy consumption, blood pressure, and risk of hypertension: An evidence-based review of recent literature. Curr. Cardiovasc. Risk Rep. 2011, 5, 287–298. [Google Scholar] [CrossRef] [PubMed]
- FAO Gateway to Dairy Production and Products FAO 2018 Food and Agriculture Organization of the United Nations. Available online: http://www.fao.org/dairy-production-products/production/en/ (accessed on 6 July 2019).
- Merdji, M.; Gacic, M.K.; Ciheam-Maim, S.T. The Dairy Products Market. Available online: http://www.enpicbcmed.eu/sites/default/files (accessed on 13 June 2019).
- Muehlhoff, E.; Bennett, A.; Mcmahon, D. Milk and Dairy Products in Human Nutrition; Food and Agriculture Organization of the United Nations: Rome, Italy, 2013; ISBN 9789251078631. [Google Scholar]
- Rizzoli, R. Dairy products, yogurts, and bone health. Am. J. Clin. Nutr. 2014, 99, 1256S–1262S. [Google Scholar] [CrossRef] [PubMed]
- Black, R.E.; Williams, S.M.; Jones, I.E.; Goulding, A. Children who avoid drinking cow milk have low dietary calcium intakes and poor bone health. Am. J. Clin. Nutr. 2002, 76, 675–680. [Google Scholar] [CrossRef] [PubMed]
- Bailey, R.L.; Dodd, K.W.; Goldman, J.A.; Gahche, J.J.; Dwyer, J.T.; Moshfegh, A.J.; Sempos, C.T.; Picciano, M.F. Estimation of total usual calcium and vitamin D intakes in the United States. J. Nutr. 2010, 24, 817–822. [Google Scholar] [CrossRef] [PubMed]
- Bechthold, A.; Boeing, H.; Schwedhelm, C.; Hoffmann, G.; Knüppel, S.; Iqbal, K.; De Henauw, S.; Michels, N.; Devleesschauwer, B.; Schlesinger, S.; et al. Food groups and risk of coronary heart disease, stroke and heart failure: A systematic review and dose-response meta-analysis of prospective studies. Crit. Rev. Food Sci. Nutr. 2019, 59, 1071–1090. [Google Scholar] [CrossRef]
- Kardinaal, A.F.M.; Ando, S.; Charles, P.; Charzewska, J.; Rotily, M.; Väänänen, K.; Van Erp-Baart, A.M.J.; Heikkinen, J.; Thomsen, J.; Maggiolini, M.; et al. Dietary calcium and bone density in adolescent girls and young women in Europe. J. Bone Miner. Res. 1999, 14, 583–592. [Google Scholar] [CrossRef] [PubMed]
- Pfeuffer, M.; Watzl, B. Nutrition and health aspects of milk and dairy products and their ingredients. Ernahr. Umschau Sci. Res. 2017, 65, 22–33. [Google Scholar] [CrossRef]
- Franzoi, M.; Niero, G.; Penasa, M.; Cassandro, M.; De Marchi, M. Technical note: Development and validation of a new method for the quantification of soluble and micellar calcium, magnesium, and potassium in milk. J. Dairy Sci. 2017, 101, 1883–1888. [Google Scholar] [CrossRef]
- Bonjour, J.-P. Dietary protein: an essential nutrient for bone health. J. Am. Coll. Nutr. 2005, 24, 526S–536S. [Google Scholar] [CrossRef] [PubMed]
- Zhu, K.; Prince, R.L. Calcium and bone. Clin. Biochem. 2012, 45, 936–942. [Google Scholar] [CrossRef]
- Adegboye, A.R.A.; Christensen, L.B.; Holm-Pedersen, P.; Avlund, K.; Boucher, B.J.; Heitmann, B.L. Intake of dairy products in relation to periodontitis in older danish adults. Nutrients 2012, 4, 1219–1229. [Google Scholar] [CrossRef]
- Lee, K.; Kim, J. Dairy food consumption is inversely associated with the prevalence of periodontal disease in Korean adults. Nutrients 2019, 11, 1035. [Google Scholar] [CrossRef] [PubMed]
- Al-Zahrani, M.S. Increased intake of dairy products is related to lower periodontitis prevalence. J. Periodontol. 2006, 77, 289–294. [Google Scholar] [CrossRef]
- Schifferle, R.E. Nutrition and periodontal disease. Dent. Clin. North Am. 2005, 49, 595–610. [Google Scholar] [CrossRef] [PubMed]
- Shimazaki, Y.; Shirota, T.; Uchida, K.; Yonemoto, K.; Kiyohara, Y.; Iida, M.; Saito, T.; Yamashita, Y. Intake of dairy products and periodontal disease: The hisayama study. J. Periodontol. 2008, 79, 131–137. [Google Scholar] [CrossRef] [PubMed]
- De Oliveira Otto, M.C.; Lemaitre, R.N.; Song, X.; King, I.B.; Siscovick, D.S.; Mozaffarian, D. Serial measures of circulating biomarkers of dairy fat and total and cause-specific mortality in older adults: The cardiovascular health study. Am. J. Clin. Nutr. 2018, 108, 476–484. [Google Scholar] [CrossRef]
- Nilsen, R.; Høstmark, A.T.; Haug, A.; Skeie, S. Effect of a high intake of cheese on cholesterol and metabolic syndrome: Results of a randomized trial. Food Nutr. Res. 2015, 59, 27651. [Google Scholar] [CrossRef] [PubMed]
- Engel, S.; Elhauge, M.; Tholstrup, T. Effect of whole milk compared with skimmed milk on fasting blood lipids in healthy adults: A 3-week randomized crossover study. Eur. J. Clin. Nutr. 2018, 72, 249–254. [Google Scholar] [CrossRef] [PubMed]
- Guo, J.; Astrup, A.; Lovegrove, J.A.; Gijsbers, L.; Givens, D.I.; Soedamah-Muthu, S.S. Milk and dairy consumption and risk of cardiovascular diseases and all-cause mortality: Dose–response meta-analysis of prospective cohort studies. Eur. J. Epidemiol. 2017, 32, 269–287. [Google Scholar] [CrossRef] [PubMed]
- Pimpin, L.; Wu, J.H.Y.; Haskelberg, H.; Del Gobbo, L.; Mozaffarian, D. Is butter back? A systematic review and meta-analysis of butter consumption and risk of cardiovascular disease, diabetes, and total mortality. PLoS ONE 2016, 11, e0158118. [Google Scholar] [CrossRef] [PubMed]
- Yu, E.; Hu, F.B. Dairy products, dairy fatty acids, and the prevention of cardiometabolic disease: A review of recent evidence. Curr. Atheroscler. Rep. 2018, 20, 24. [Google Scholar] [CrossRef] [PubMed]
- Sun, Q.; Ma, J.; Campos, H.; Hu, F.B. Plasma and erythrocyte biomarkers of dairy fat intake and risk of ischemic heart disease. Am. J. Clin. Nutr. 2007, 86, 929–937. [Google Scholar] [CrossRef] [PubMed]
- Pranger, I.G.; Muskiet, F.A.J.; Kema, I.P.; Singh-Povel, C.; Bakker, S.J.L. Potential biomarkers for fat from dairy and fish and their association with cardiovascular risk factors: Cross-sectional data from the lifelines biobank and cohort study. Nutrients 2019, 11, 1099. [Google Scholar] [CrossRef] [PubMed]
- Tong, X.; Chen, G.C.; Zhang, Z.; Wei, Y.L.; Xu, J.Y.; Qin, L.Q. Cheese consumption and risk of all-cause mortality: A meta-analysis of prospective studies. Nutrients 2017, 9, 63. [Google Scholar] [CrossRef] [PubMed]
- Farvid, M.S.; Malekshah, A.F.; Pourshams, A.; Poustchi, H.; Sepanlou, S.G.; Sharafkhah, M.; Khoshnia, M.; Farvid, M.; Abnet, C.C.; Kamangar, F.; et al. Dairy food intake and all-cause, cardiovascular disease, and cancer mortality: The Golestan cohort study. Am. J. Epidemiol. 2017, 185, 697–711. [Google Scholar] [CrossRef] [PubMed]
- Chen, M.; Sun, Q.; Giovannucci, E.; Mozaffarian, D.; Manson, J.E.; Willett, W.C.; Hu, F.B. Dairy consumption and risk of type 2 diabetes: 3 cohorts of US adults and an updated meta-analysis. BMC Med. 2014, 12, 215. [Google Scholar] [CrossRef] [PubMed]
- Gijsbers, L.; Ding, E.L.; Malik, V.S.; de Goede, J.; Geleijnse, J.M.; Soedamah-Muthu, S.S. Consumption of dairy foods and diabetes incidence: a dose-response meta-analysis of observational studies. Am. J. Clin. Nutr. 2016, 103, 1111–1124. [Google Scholar] [CrossRef] [PubMed]
- Aune, D.; Norat, T.; Romundstad, P.; Vatten, L.J. Dairy products and the risk of type 2 diabetes: a systematic review and dose-response meta-analysis of cohort studies. Am. J. Clin. Nutr. 2013, 98, 1066–1083. [Google Scholar] [CrossRef]
- Hruby, A.; Ma, J.; Rogers, G.; Meigs, J.B.; Jacques, P.F. Associations of dairy intake with incident prediabetes or diabetes in middle-aged adults vary by both dairy type and glycemic status. J. Nutr. 2017, 147, 1764–1775. [Google Scholar] [CrossRef] [PubMed]
- Lu, W.; Chen, H.; Niu, Y.; Wu, H.; Xia, D.; Wu, Y. Dairy products intake and cancer mortality risk: a meta-analysis of 11 population-based cohort studies. Nutr. J. 2016, 15, 91. [Google Scholar] [CrossRef] [PubMed]
- Wiseman, M.; Thompson, R.; Allen, K. Diet, Nutrition, Physical Activity and Cancer: a Global Perspective. A summary of the Third Expert Report; World Cancer Research Fund and American Institute for Cancer Research, Diet, Nutrition, Physical Activity and Cancer, WCRF International Ed.: London, UK, 2008; ISBN 9781912259465. [Google Scholar]
- Dehghan, M.; Mente, A.; Zhang, X.; Swaminathan, S.; Li, W.; Mohan, V.; Iqbal, R.; Kumar, R.; Wentzel-Viljoen, E.; Rosengren, A.; et al. Associations of fats and carbohydrate intake with cardiovascular disease and mortality in 18 countries from five continents (PURE): A prospective cohort study. Lancet 2017, 391, 1679–1680. [Google Scholar] [CrossRef]
- Phelan, M.; Kerins, D. The potential role of milk-derived peptides in cardiovascular disease. Food Funct. 2011, 2, 153–167. [Google Scholar] [CrossRef] [PubMed]
- De Goede, J.; Soedamah-Muthu, S.S.; Pan, A.; Gijsbers, L.; Geleijnse, J.M. Dairy consumption and risk of stroke: A systematic review and updated dose-response meta-analysis of prospective cohort studies. J. Am. Heart Assoc. 2016, 5, e002787. [Google Scholar] [CrossRef] [PubMed]
- Bhat, Z.F.; Bhat, H. Milk and dairy products as functional foods: A review. Int. J. Dairy Sci. 2011, 6, 1–12. [Google Scholar] [CrossRef]
- Dunshea, F.R.; Ostrowska, E.; Ferrari, J.M.; Gill, H.S. Dairy proteins and the regulation of satiety and obesity. Aust. J. Exp. Agric. 2007, 47, 1052–1058. [Google Scholar] [CrossRef]
- Alzamora, S.M.; Salvatori, D.; Tapia, M.S.; López-Malo, A.; Welti-Chanes, J.; Fito, P. Novel functional foods from vegetable matrices impregnated with biologically active compounds. J. Food Eng. 2005, 67, 205–214. [Google Scholar] [CrossRef]
- Buttriss, J. Nutritional properties of fermented milk products. Int. J. Dairy Technol. 1997, 50, 21–27. [Google Scholar] [CrossRef]
- Household Budget Survey in 2016; Central Statistical Office: Warsaw, Poland, 2017.
- Barlik, M.; Siwiak, K. (Eds.) Methodology of Household Survey (in Polish); Central Statistical Office, Zakład Wydawnictw Statystycznych: Warsaw, Poland, 2011.
- Laskowski, W.; Górska-Warsewicz, H. Nutrient Density of the Average Polish Diet. Economic Analysis (in Polish), 1st ed.; Laskowski Publisher: Warsaw, Poland, 2014; ISBN 978-83-941257-1-4. [Google Scholar]
- Rejman, K.; Kowrygo, B.; Laskowski, W. Evaluation of the structure of food consumption in poland in the context of demands of sustainable consumption (in Polish). J. Agribus. Rural Dev. 2015, 37, 503–512. [Google Scholar] [CrossRef]
- Górska-Warsewicz, H.; Laskowski, W.; Kulykovets, O.; Kudlińska-Chylak, A.; Czeczotko, M.; Rejman, K. Food products as sources of protein and amino acids—The case of Poland. Nutrients 2018, 10, 1977. [Google Scholar] [CrossRef] [PubMed]
- Laskowski, W.; Górska-Warsewicz, H.; Kulykovets, O. Meat, meat products and seafood as sources of energy and nutrients in the average Polish diet. Nutrients 2018, 10, 1412. [Google Scholar] [CrossRef] [PubMed]
- Laskowski, W.; Górska-Warsewicz, H.; Rejman, K. How important are cereals and cereal products in the average Polish diet? Nutrients 2019, 11, 679. [Google Scholar] [CrossRef] [PubMed]
- What We Eat in America. Available online: https://www.ars.usda.gov/arsuserfiles/80400530/pdf/1314/Food_categories_2013-2014.pdf (accessed on 13 August 2018).
- O’Neil, C.E.; Keast, D.R.; Fulgoni, V.L.; Nicklas, T.A. Food sources of energy and nutrients among adults in the US: NHANES 2003-2006. Nutrients 2012, 4, 2097–2120. [Google Scholar] [CrossRef] [PubMed]
- Scientific Report of the 2015 Dietary Guidelines Advisory Committee Appendix E-2.7: Major Categories and Subcategories Used in DGAC Analyses of WWEIA Food Categories Part E. Section 2: Supplementary Documentation to the 2015 DGAC Report Scie. Available online: https://health.gov/dietaryguidelines/DGAC-Major-categories-and-subcategories-from-WWEIA-Food Categories.pdf (accessed on 13 August 2018).
- Rhodes, D.G.; Adler, M.E.; Clemens, J.C.; Moshfegh, A.J. What we eat in America food categories and changes between survey cycles. J. Food Compos. Anal. 2017, 64, 107–111. [Google Scholar] [CrossRef]
- Kunachowicz, H.; Przygoda, B.; Nadolna, I.; Iwanow, K. Nutritive Tables for Foods and Meals (in Polish), 4th ed.; PZWL Wydawnictwo Lekarskie: Warsaw, Poland, 2017; ISBN 9788320053111. [Google Scholar]
- Fox, J.; Leanage, A. R and the journal of Statistical Software. J. Stat. Softw. 2016, 73, 1–13. [Google Scholar] [CrossRef]
- R Development Core Team R Language Definition. Available online: https://cran.r-project.org/doc/manuals/r-release/R-lang.pdf (accessed on 8 August 2018).
- Lang, M. Efficient R programming. J. Stat. Softw. 2017, 80. [Google Scholar] [CrossRef]
- Dubes, R.; Jain, A.K. Clustering methodologies in exploratory data analysis. Adv. Comput. 1980, 19, 113–228. [Google Scholar]
- Parsons, L.; Haque, E.; Liu, H. Subspace clustering for high dimensional data. ACM SIGKDD Explor. Newsl. 2004, 6, 90–105. [Google Scholar] [CrossRef]
- Wilks, D.S. Cluster analysis. Int. Geophys. 2011, 100, 603–616. [Google Scholar]
- R.Rojas 15 Kohonen Networks 15.1. In Neural Networks; Springer-Verlag: Berlin, Germany, 1996; pp. 391–412. ISBN 9783540605058.
- Papanikolaou, Y.; Fulgoni, V. Grains Contribute shortfall nutrients and nutrient density to older US adults: data from the national health and nutrition examination survey, 2011–2014. Nutrients 2018, 10, 534. [Google Scholar] [CrossRef] [PubMed]
- Mielgo-Ayuso, J.; Aparicio-Ugarriza, R.; Olza, J.; Aranceta-Bartrina, J.; Gil, Á.; Ortega, R.; Serra-Majem, L.; Varela-Moreiras, G.; González-Gross, M. Dietary Intake and food sources of niacin, riboflavin, thiamin and vitamin b6 in a representative sample of the Spanish population. The anthropometry, intake, and energy balance in Spain (ANIBES) study †. Nutrients 2018, 10, 846. [Google Scholar] [CrossRef] [PubMed]
- Olza, J.; Aranceta-Bartrina, J.; González-Gross, M.; Ortega, R.M.; Serra-Majem, L.; Varela-Moreiras, G.; Gil, Á. Reported dietary intake and food sources of zinc, selenium, and vitamins a, e and c in the spanish population: Findings from the anibes study. Nutrients 2017, 9, 697. [Google Scholar] [CrossRef] [PubMed]
- Olza, J.; Aranceta-Bartrina, J.; González-Gross, M.; Ortega, R.M.; Serra-Majem, L.; Varela-Moreiras, G.; Gil, Á. Reported dietary intake, disparity between the reported consumption and the level needed for adequacy and food sources of calcium, phosphorus, magnesium and vitamin D in the Spanish population: Findings from the ANIBES study. Nutrients 2017, 9, 168. [Google Scholar] [CrossRef] [PubMed]
- Rubio, C.; Gutiérrez, Á.J.; Revert, C.; Reguera, J.I.; Burgos, A.; Hardisson, A. Daily dietary intake of iron, copper, zinc and manganese in a Spanish population. Int. J. Food Sci. Nutr. 2009, 60, 590–600. [Google Scholar] [CrossRef] [PubMed]
- Tijhuis, M.J.; Ezendam, J.; Westenbrink, S.; van Rossum, C.; Temme, L. Replacement of Meat and Dairy by More Sustainable Protein Sources in The Netherlands Quality of the Diet; National Institute for Public Health and the Environment, Ministry of Health, Welfare and Sport: Bilthoven, Denmark, 2011. [Google Scholar]
- Van Rossum, C.T.M.; Fransen, H.; Verkaik-Kloosterman, J.; Buurma-Rethans, E.; Ocke, M. National Food Consumption Survey: Dutch National Food Consumption Survey 2007–2010; National Institute for Public Health and the Environment, Ministry of Health, Welfare and Sport: Bilthoven, Denmark, 2011. [Google Scholar]
- A focus on nutrition: Key findings of the 2008/09 New Zealand Adult Nutrition Survey; University of Otago: Dunedin, New Zealand; Ministry of Health: Wellington, New Zealand, 2011; ISBN 9780478373486.
- Mclennan, W.; Podger, A. National Nutrition Survey Nutrient Intakes and Physical Measurements; Australian Bureau of Statistics: Canberra, Australia, 1998; ISBN 0642257248.
- Williams, P.G. Breakfast and the diets of Australian adults: An analysis of data from the 1995 National Nutrition Survey. Int. J. Food Sci. Nutr. 2005, 56, 65–79. [Google Scholar] [CrossRef] [PubMed]
- Rangan, A.M.; Samman, S. Zinc intake and its dietary sources: Results of the 2007 Australian national children’s nutrition and physical activity survey. Nutrients 2012, 4, 611–624. [Google Scholar] [CrossRef] [PubMed]
- Pasiakos, S.M.; Agarwal, S.; Lieberman, H.R.; Fulgoni, V.L. Sources and amounts of animal, dairy, and plant protein intake of US adults in 2007–2010. Nutrients 2015, 7, 7058–7069. [Google Scholar] [CrossRef] [PubMed]
- Drewnowski, A. Concept of a nutritious food: toward a nutrient density score1–3. Am. J. Clin. Nutr. 2005, 82, 721–732. [Google Scholar] [CrossRef] [PubMed]
- Hansen, R.G.; Wyse, B.W.; Sorenson, A.W. Nutritional Quality Index of Foods; AVI Publishing Co. Inc.: Westport, CT, USA, 1979; ISBN 0870553208. [Google Scholar]
- Sorenson, A.W.; Wyse, B.W.; Wittwer, A.J.; Hansen, R.G. An index of nutritional quality for a balanced diet. New help for an old problem. J. Am. Diet. Assoc. 1976, 68, 236–242. [Google Scholar] [PubMed]
- Garlick, P. The role of leucine in the regulation of protein metabolism. J. Nutr. 2005, 135, 1553S–1556S. [Google Scholar] [CrossRef] [PubMed]
- Volpi, E.; Kobayashi, H.; Sheffield-Moore, M.; Mittendorfer, B.; Wolfe, R.R. Essential amino acids are primarily responsible for the amino acid stimulation of muscle protein anabolism in healthy elderly adults. Am. J. Clin. Nutr. 2003, 78, 250–258. [Google Scholar] [CrossRef] [PubMed]
- Blomstrand, E.; Eliasson, J.; Karlsson, H.K.R.; Köhnke, R. Branched-chain amino acids activate key enzymes in protein synthesis after physical exercise. J. Nutr. 2006, 136, 269S–273S. [Google Scholar] [CrossRef] [PubMed]
- Xu, Z.; Mcclure, S.; Appel, L. Dietary cholesterol intake and sources among U.S adults: Results from national health and nutrition examination surveys (NHANES), 2001–2014. Nutrients 2018, 10, 771. [Google Scholar] [CrossRef] [PubMed]
- Hoffman, J.R.; Falvo, M.J. Protein— Which is best? J. Sport. Sci. Med. 2004, 3, 118–130. [Google Scholar]
- Keast, D.R.; Fulgoni, V.L.; Nicklas, T.A.; O’Neil, C.E. Food sources of energy and nutrients among children in the United States: National health and nutrition examination survey 2003-2006. Nutrients 2013, 5, 283–301. [Google Scholar] [CrossRef] [PubMed]
- Hunt, J.R. Biaoavailability of iron, zinc, and other trace minerals from vegetarian diets. Am. J. Clin. Nutr. 2003, 78, 633S–639S. [Google Scholar] [CrossRef] [PubMed]
- Tidemann-Andersen, I.; Acham, H.; Maage, A.; Malde, M.K. Iron and zinc content of selected foods in the diet of schoolchildren in Kumi district, east of Uganda: a cross-sectional study. Nutr. J. 2011, 10, 81. [Google Scholar] [CrossRef] [PubMed]
- Wu, G.; Fanzo, J.; Miller, D.D.; Pingali, P.; Post, M.; Steiner, J.L.; Thalacker-Mercer, A.E. Production and supply of high-quality food protein for human consumption: Sustainability, challenges, and innovations. Ann. N. Y. Acad. Sci. 2014, 1321, 1–19. [Google Scholar] [CrossRef] [PubMed]
- Gallagher, C.M.; Black, L.J.; Oddy, W.H. Micronutrient intakes from food and supplements in Australian adolescents. Nutrients 2014, 6, 342–354. [Google Scholar] [CrossRef] [PubMed]
- Lim, K.H.C.; Riddell, L.J.; Nowson, C.A.; Booth, A.O.; Szymlek-Gay, E.A. Iron and zinc nutrition in the economically-developed world: A review. Nutrients 2013, 5, 3184–3211. [Google Scholar] [CrossRef] [PubMed]
- Hansen, R.G. An index of food quality. Nutr. Rev. 1973, 31, 1–7. [Google Scholar] [CrossRef] [PubMed]
- Diet, Nutrition and the Prevention of Chronic Diseases. Report of a Joint WHO/FAO Expert Consultation; WHO Techni: Geneva, Switzerland, 2003; ISBN 924120916X.
- He, F.J.; Li, J.; Macgregor, G.A. Effect of longer term modest salt reduction on blood pressure: Cochrane systematic review and meta-analysis of randomised trials. BMJ 2013, 346, f1325. [Google Scholar] [CrossRef] [PubMed]
- O’Neil, C.E.; Nicklas, T.A.; Zanovec, M.; Cho, S. Whole-grain consumption is associated with diet quality and nutrient intake in adults: The national health and nutrition examination survey, 1999-2004. J. Am. Diet Assoc. 2010, 110, 1461–1468. [Google Scholar] [CrossRef] [PubMed]


| Stage | Description |
|---|---|
| 1. | Two-stage random selection of representative sample of households (Central Statistical Office)
|
| 2. | Data base of 36,886 households (Central Statistical Office)—quantity of purchase and consumption of food products in 91 sub-groups (in grams, kilograms, liters) per month in each household |
| 3. | Conversion of consumption into one person per month in each household (in grams, kilograms, liters per person per month)—own calculations |
| 4. | Energy and nutrient content in consumed food products in 91 sub-groups in each household (in kcal, g, mg, µg per day)—own calculations |
| 5. | Average energy and nutrient content in sub-groups in kcal, g, mg, µg per person per day in all households—own calculations |
| 6. | Average energy and nutrient contribution (in %) to the average Polish diet from each sub-group—own calculations |
| 7. | Impact of socio-demographic and economic factors on the level and structure of energy and nutrients supply from milk and dairy products—own calculations |
| Main Groups | Sub-Groups |
|---|---|
| Milk | (1) whole milk (2) reduced fat milk (3) condensed and powdered milk |
| Cheeses and cottage cheeses | (4) ripened and melted cheeses |
| (5) cottage cheeses | |
| Yoghurts and milk drinks | (6) yoghurts (7) milk drinks and other dairy products |
| Contribution of Milk and Dairy Products in %: | Energy |
|---|---|
| 9.07 | |
| Milk | 3.21 |
| whole milk | 2.21 |
| reduced fat milk | 0.91 |
| condensed and powdered milk | 0.09 |
| Cheeses | 3.68 |
| ripened and melted cheeses | 2.53 |
| cottage cheeses | 1.15 |
| Yoghurts, milk drinks and other dairy products | 2.17 |
| yoghurts | 0.58 |
| milk drinks and other dairy products | 1.59 |
| Specification | Total Protein | Leucine | Isoleucine | Valine | Lysine | Histidine | Threonine | Tryptophan | Phenylalanine | Methionine | Cysteine | Tyrosine | Arginine | Alanine | Aspartic Acid | Glutamic Acid | Glycine | Proline | Serine |
|---|---|---|---|---|---|---|---|---|---|---|---|---|---|---|---|---|---|---|---|
| Average daily supply in g | 77.90 | 6.04 | 3.78 | 4.38 | 5.29 | 2.27 | 3.24 | 0.98 | 3.45 | 1.88 | 1.18 | 2.76 | 4.19 | 3.80 | 6.82 | 15.18 | 3.38 | 5.43 | 3.68 |
| Contribution of milk and dairy in g | 14.07 | 1.21 | 0.72 | 0.91 | 1.14 | 0.39 | 0.57 | 0.18 | 0.66 | 0.35 | 0.10 | 0.65 | 0.48 | 0.45 | 0.97 | 2.88 | 0.26 | 1.35 | 0.78 |
| Contribution of milk and dairy in %: | 18.06 | 20.02 | 19.05 | 20.84 | 21.47 | 17.02 | 17.55 | 18.87 | 19.21 | 18.36 | 8.50 | 23.61 | 11.34 | 11.90 | 14.29 | 18.95 | 7.84 | 24.80 | 21.07 |
| Milk | 5.43 | 6.15 | 6.28 | 6.52 | 7.42 | 5.02 | 5.19 | 5.37 | 5.66 | 5.58 | 2.81 | 6.16 | 3.40 | 3.84 | 4.49 | 5.31 | 2.27 | 7.23 | 6.35 |
| whole milk | 3.41 | 3.87 | 3.93 | 4.10 | 4.47 | 3.15 | 3.28 | 3.39 | 3.53 | 3.49 | 1.76 | 3.92 | 2.13 | 2.44 | 2.75 | 3.29 | 1.36 | 4.56 | 4.07 |
| reduced fat milk | 1.87 | 2.12 | 2.18 | 2.24 | 2.74 | 1.73 | 1.76 | 1.83 | 1.98 | 1.94 | 0.98 | 2.08 | 1.19 | 1.30 | 1.61 | 1.88 | 0.84 | 2.48 | 2.12 |
| condensed and powdered milk | 0.15 | 0.16 | 0.17 | 0.17 | 0.21 | 0.14 | 0.14 | 0.14 | 0.15 | 0.15 | 0.08 | 0.16 | 0.09 | 0.10 | 0.13 | 0.15 | 0.07 | 0.19 | 0.16 |
| Cheeses | 8.98 | 9.62 | 8.74 | 10.08 | 9.77 | 8.77 | 8.56 | 9.82 | 9.66 | 9.02 | 3.58 | 12.97 | 5.58 | 5.61 | 6.75 | 9.88 | 3.87 | 12.84 | 10.65 |
| ripened and melted cheeses | 5.64 | 5.96 | 5.35 | 6.29 | 6.44 | 5.76 | 4.94 | 6.24 | 6.23 | 5.60 | 2.14 | 8.33 | 3.51 | 3.42 | 4.18 | 6.20 | 2.41 | 8.18 | 6.50 |
| cottage cheeses | 3.34 | 3.67 | 3.39 | 3.79 | 3.33 | 3.00 | 3.62 | 3.58 | 3.43 | 3.42 | 1.44 | 4.64 | 2.07 | 2.19 | 2.57 | 3.68 | 1.46 | 4.65 | 4.16 |
| Yoghurts, milk drinks and other dairy products | 3.65 | 4.24 | 4.03 | 4.25 | 4.28 | 3.23 | 3.81 | 3.69 | 3.89 | 3.76 | 2.12 | 4.49 | 2.36 | 2.46 | 3.05 | 3.76 | 1.70 | 4.74 | 4.07 |
| yoghurts | 1.05 | 1.20 | 1.11 | 1.23 | 1.28 | 0.94 | 1.07 | 1.08 | 1.08 | 1.07 | 0.63 | 1.30 | 0.64 | 0.72 | 0.92 | 1.09 | 0.48 | 1.38 | 1.19 |
| milk drinks and other dairy products | 2.60 | 3.04 | 2.92 | 3.02 | 3.00 | 2.28 | 2.74 | 2.61 | 2.81 | 2.69 | 1.49 | 3.19 | 1.72 | 1.74 | 2.14 | 2.68 | 1.22 | 3.36 | 2.88 |
| Specification | Carbohydrates | Total Fat | SFA | MUFA | PUFA | Cholesterol |
|---|---|---|---|---|---|---|
| Average daily supply in g or mg | 270.37 g | 96.91 g | 34.79 g | 37.40 g | 17.91 g | 316.02 mg |
| Contribution of milk and dairy products in g or mg | 13.60 g | 10.90 g | 6.39 g | 3.28 g | 0.37 g | 36.72 mg |
| Contribution of milk and dairy products in %: | 5.03 | 11.25 | 18.36 | 8.77 | 2.05 | 11.62 |
| Milk | 2.28 | 3.75 | 6.03 | 2.85 | 0.69 | 4.09 |
| whole milk | 1.37 | 2.96 | 4.79 | 2.34 | 0.57 | 3.24 |
| reduced fat milk | 0.82 | 0.72 | 1.13 | 0.46 | 0.11 | 0.75 |
| condensed and powdered milk | 0.09 | 0.07 | 0.11 | 0.06 | 0.01 | 0.10 |
| Cheeses | 0.36 | 5.99 | 9.90 | 4.66 | 1.04 | 5.69 |
| ripened and melted cheeses | 0.02 | 4.59 | 7.51 | 3.61 | 0.81 | 4.25 |
| cottage cheeses | 0.34 | 1.40 | 2.39 | 1.05 | 0.23 | 1.44 |
| Yoghurts, milk drinks and other dairy products | 2.39 | 1.50 | 2.44 | 1.25 | 0.32 | 1.84 |
| yoghurts | 0.63 | 0.39 | 0.62 | 0.33 | 0.10 | 0.51 |
| milk drinks and other dairy products | 1.76 | 1.12 | 1.82 | 0.93 | 0.22 | 1.32 |
| Specification | Calcium | Phosphorus | Sodium | Potassium | Magnesium | Iron | Zinc | Copper | Iodine |
|---|---|---|---|---|---|---|---|---|---|
| Average daily supply in mg or µg | 644.10 mg | 1160.19 mg | 3,863.84 mg | 2,617.85 mg | 267.33 mg | 10.28 mg | 9.78 mg | 1.11 mg | 154.58 µg |
| Contribution of milk and dairy in mg or µg | 352.26 mg | 285.64 mg | 280.51 mg | 310.74 mg | 29.35 mg | 0.35 mg | 1.36 mg | 0.06 mg | 14.02 µg |
| Contribution of milk and dairy products in % | 54.69 | 24.62 | 7.26 | 11.87 | 10.98 | 3.44 | 13.87 | 5.75 | 9.07 |
| Milk | 21.56 | 9.40 | 1.44 | 6.81 | 5.58 | 1.23 | 4.38 | 2.55 | 3.01 |
| whole milk | 13.70 | 5.88 | 0.89 | 4.11 | 3.57 | 0.76 | 2.58 | 1.98 | 1.94 |
| reduced fat milk | 7.24 | 3.25 | 0.50 | 2.47 | 1.84 | 0.43 | 1.67 | 0.50 | 0.93 |
| condensed and powdered milk | 0.62 | 0.27 | 0.04 | 0.23 | 0.17 | 0.04 | 0.13 | 0.07 | 0.14 |
| Cheeses | 21.42 | 10.09 | 4.96 | 1.21 | 2.51 | 1.33 | 6.67 | 1.67 | 3.80 |
| ripened and melted cheeses | 19.28 | 7.41 | 4.37 | 0.57 | 1.98 | 1.02 | 5.30 | 1.30 | 3.32 |
| cottage cheeses | 2.14 | 2.68 | 0.59 | 0.64 | 0.53 | 0.31 | 1.37 | 0.37 | 0.48 |
| Yoghurts, milk drinks and other dairy products | 11.72 | 5.14 | 0.86 | 3.85 | 2.89 | 0.89 | 2.81 | 1,53 | 2.27 |
| yoghurts | 4.37 | 1.84 | 0.29 | 1.55 | 1.20 | 0.33 | 0.89 | 0.69 | 0.46 |
| milk drinks and other dairy products | 7.35 | 3.30 | 0.57 | 2.30 | 1.69 | 0.56 | 1.92 | 0.85 | 1.80 |
| Specification | Thiamin | Riboflavin | Niacin | Vitamin B6 | Folate | Vitamin B12 | Vitamin C | Vitamin A | Vitamin D | Vitamin E |
|---|---|---|---|---|---|---|---|---|---|---|
| Average daily supply in mg or µg | 1.32 mg | 1.59 mg | 16.21 mg | 1.84 mg | 275.02 µg | 4.51 µg | 91.40 mg | 1,194.55 µg | 4.61 µg | 13.45 mg |
| Contribution of milk and dairy in mg or µg | 0.09 mg | 0.45 mg | 0.41 mg | 0.13 mg | 18.07 µg | 1.17 µg | 2.91 mg | 131.28 µg | 0.19 µg | 0.35 mg |
| Contribution of milk and dairy products in %: | 6.67 | 28.15 | 2.53 | 7.12 | 6.57 | 26.14 | 3.18 | 10.99 | 4.22 | 2.61 |
| Milk | 4.02 | 13.45 | 1.53 | 3.85 | 2.35 | 10.28 | 2.27 | 4.38 | 2.11 | 1.29 |
| whole milk | 2.26 | 8.29 | 0.69 | 2.02 | 1.06 | 6.38 | 1.30 | 3.05 | 0.95 | 0.75 |
| reduced fat milk | 1.67 | 4.82 | 0.81 | 1.74 | 1.23 | 3.69 | 0.91 | 1.27 | 1.15 | 0.53 |
| condensed and powdered milk | 0.10 | 0.34 | 0.03 | 0.09 | 0.06 | 0.21 | 0.07 | 0.05 | 0.02 | 0.01 |
| Cheeses | 0.73 | 7.60 | 0.41 | 1.30 | 2.65 | 9.50 | 0.03 | 5.18 | 1.76 | 0.96 |
| ripened and melted cheeses | 0.38 | 3.79 | 0.20 | 0.58 | 1.29 | 6.66 | 0.00 | 4.13 | 1.23 | 0.68 |
| cottage cheeses | 0.35 | 3.81 | 0.21 | 0.72 | 1.36 | 2.84 | 0.03 | 1.05 | 0.53 | 0.28 |
| Yoghurts, milk drinks and other dairy products | 1.92 | 7.09 | 0.58 | 1.97 | 1.58 | 6.35 | 0.89 | 1.43 | 0.35 | 0.37 |
| yoghurts | 0.73 | 2.51 | 0.23 | 0.76 | 0.58 | 2.13 | 0.70 | 0.48 | 0.11 | 0.18 |
| milk drinks and other dairy products | 1.18 | 4.59 | 0.36 | 1.22 | 1.00 | 4.22 | 0.19 | 0.95 | 0.24 | 0.19 |
| Factors | Cramer Correlations |
|---|---|
| size of the village | 0.150 |
| socio-economic affiliation | 0.149 |
| land use | 0.146 |
| education | 0.146 |
| family life phase | 0.140 |
| degree of urbanization | 0.139 |
| age | 0.129 |
| region | 0.116 |
| income (quintile group) | 0.113 |
| assessment of financial situation | 0.099 |
| assessment of nutrition | 0.077 |
| number of people in household | 0.075 |
| study month | 0.053 |
| sex | 0.010 |
| Specification | Sample Population | Cluster 1 | Cluster 2 | Cluster 3 |
| Number of households | 36,886 | 7,425 | 15,804 | 13,657 |
| Number of persons in households | 99,230 | 20,887 | 41,321 | 37,022 |
| Consumption Per 1 Person Per Month | ||||
| milk (in liters) | 3.51 | 2.73 | 2.08 | 5.62 |
| cheeses (in kg) | 0.97 | 1.04 | 1.15 | 0.71 |
| yoghurts, milk drinks and other dairy products (in kg) | 1.92 | 4.54 | 1.12 | 1.22 |
© 2019 by the authors. Licensee MDPI, Basel, Switzerland. This article is an open access article distributed under the terms and conditions of the Creative Commons Attribution (CC BY) license (http://creativecommons.org/licenses/by/4.0/).
Share and Cite
Górska-Warsewicz, H.; Rejman, K.; Laskowski, W.; Czeczotko, M. Milk and Dairy Products and Their Nutritional Contribution to the Average Polish Diet. Nutrients 2019, 11, 1771. https://doi.org/10.3390/nu11081771
Górska-Warsewicz H, Rejman K, Laskowski W, Czeczotko M. Milk and Dairy Products and Their Nutritional Contribution to the Average Polish Diet. Nutrients. 2019; 11(8):1771. https://doi.org/10.3390/nu11081771
Chicago/Turabian StyleGórska-Warsewicz, Hanna, Krystyna Rejman, Wacław Laskowski, and Maksymilian Czeczotko. 2019. "Milk and Dairy Products and Their Nutritional Contribution to the Average Polish Diet" Nutrients 11, no. 8: 1771. https://doi.org/10.3390/nu11081771
APA StyleGórska-Warsewicz, H., Rejman, K., Laskowski, W., & Czeczotko, M. (2019). Milk and Dairy Products and Their Nutritional Contribution to the Average Polish Diet. Nutrients, 11(8), 1771. https://doi.org/10.3390/nu11081771