Initial Dietary Protein Intake Influence Muscle Function Adaptations in Older Men and Women Following High-Intensity Interval Training Combined with Citrulline

 and
and
Abstract
1. Introduction
2. Methods
2.1. Study Design and Population
2.2. Intervention
2.3. Evaluations
2.3.1. Dietary Intake
2.3.2. Functional Capacities
2.3.3. Muscle Strength and Power
2.3.4. Body Composition
2.4. Statistical Analysis
3. Results
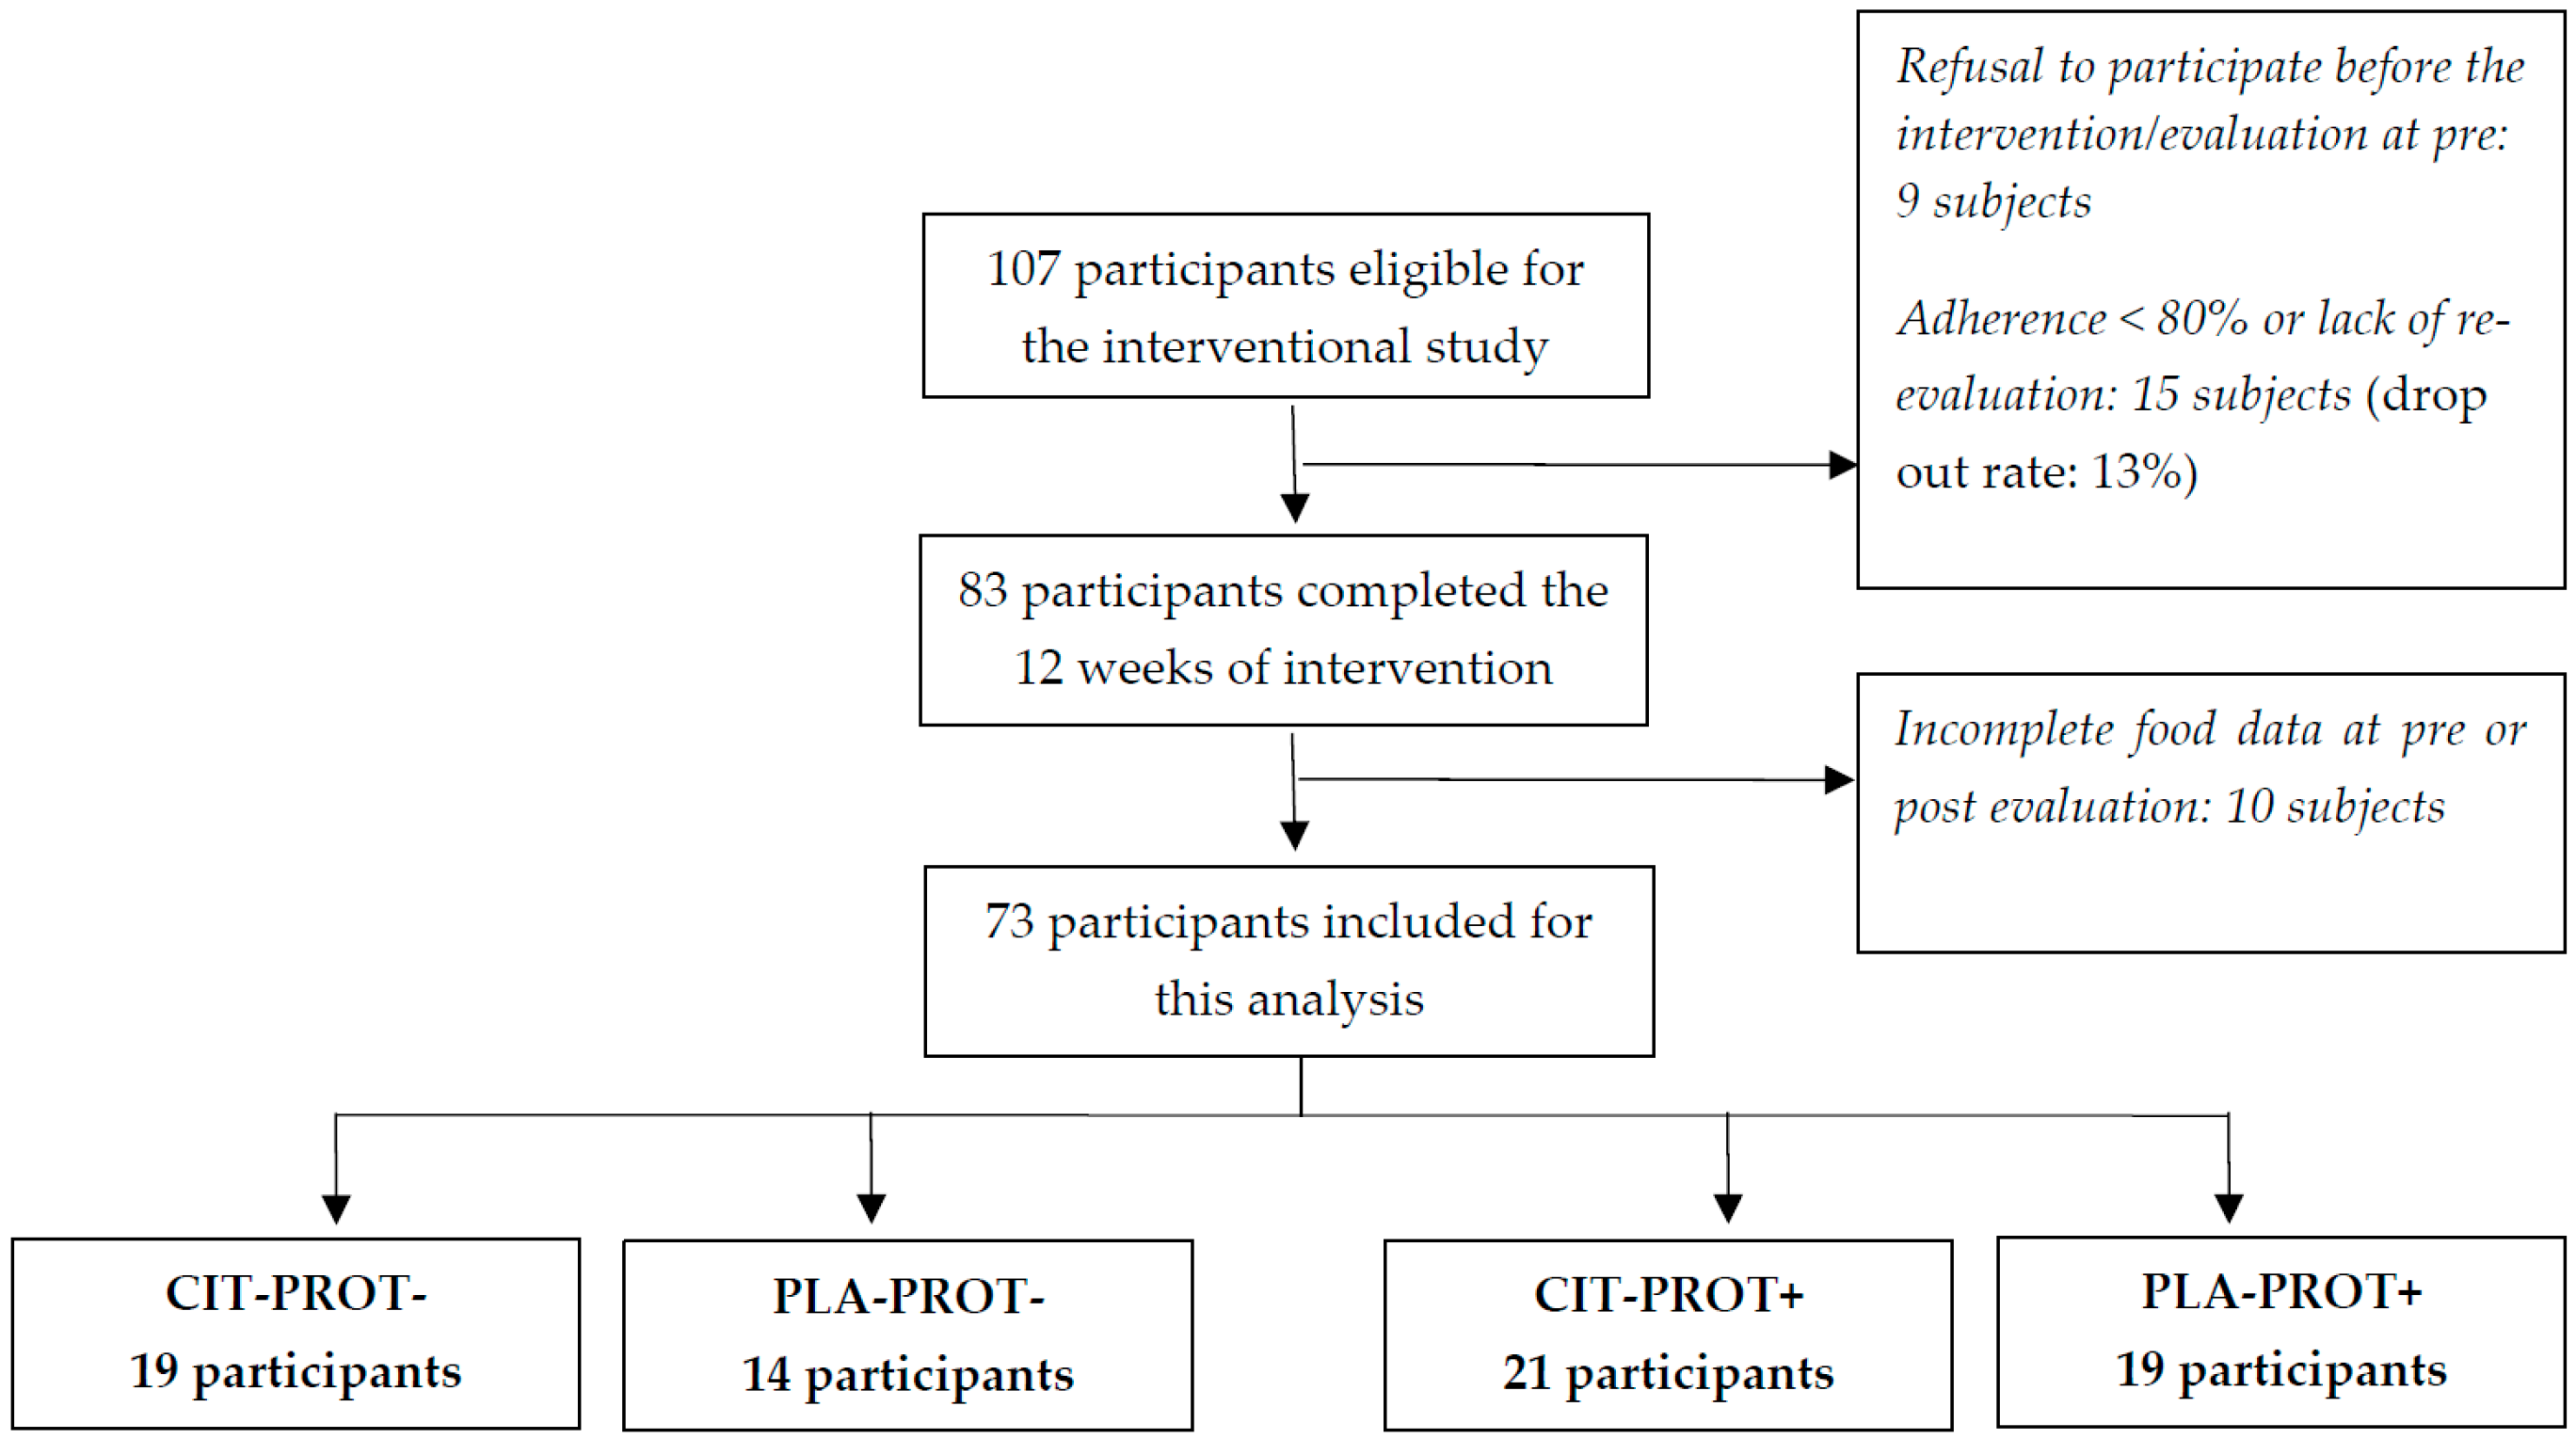
3.1. Population
3.2. Effects of Initial Protein Intake
3.3. Functional Capacities and Physical Endurance
3.4. Muscle Strength and Power
3.5. Body Composition
3.6. Evolution of the Parameters According to the CIT Supplementation
3.7. Evolution of the Parameters According to the Initial Amount of Dietary Protein Intake
4. Discussion
5. Conclusions
Author Contributions
Funding
Acknowledgments
Conflicts of Interest
References
- Visser, M.; Kritchevsky, S.B.; Goodpaster, B.H.; Newman, A.B.; Nevitt, M.; Stamm, E.; Harris, T.B. Leg muscle mass and composition in relation to lower extremity performance in men and women aged 70 to 79: The health, aging and body composition study. J. Am. Geriatr. Soc. 2002, 50, 897–904. [Google Scholar] [CrossRef] [PubMed]
- Goodpaster, B.H.; Park, S.W.; Harris, T.B.; Kritchevsky, S.B.; Nevitt, M.; Schwartz, A.V.; Simonsick, E.M.; Tylavsky, F.A.; Visser, M.; Newman, A.B.; et al. The loss of skeletal muscle strength, mass, and quality in older adults: The health, aging and body composition study. J. Gerontol. Ser. A 2006, 61, 1059–1064. [Google Scholar] [CrossRef] [PubMed]
- Health Aging Body Composition Study; Delmonico, M.J.; Harris, T.B.; Visser, M.; Park, S.W.; Conroy, M.B.; Velasquez-Mieyer, P.; Boudreau, R.; Manini, T.M.; Nevitt, M.; et al. Longitudinal study of muscle strength, quality, and adipose tissue infiltration. Am. J. Clin. Nutr. 2009, 90, 1579–1585. [Google Scholar] [PubMed]
- Daskalopoulou, C.; Stubbs, B.; Kralj, C.; Koukounari, A.; Prince, M.; Prina, A. Physical activity and healthy ageing: A systematic review and meta-analysis of longitudinal cohort studies. Ageing Res. Rev. 2017, 38, 6–17. [Google Scholar] [CrossRef] [PubMed]
- WHO. Strategy and Action Plan for Healthy Ageing in Europe, 2012–2020 2012: Malta; WHO: Geneva, Switzerland, 2012. [Google Scholar]
- Harvey, J.A.; Chastin, S.F.M.; Skelton, D.A. Prevalence of sedentary behavior in older adults: A systematic review. Int. J. Environ. Res. Public Health 2013, 10, 6645–6661. [Google Scholar] [CrossRef]
- Moschny, A.; Platen, P.; Klaaßen-Mielke, R.; Trampisch, U.; Hinrichs, T. Barriers to physical activity in older adults in Germany: A cross-sectional study. Int. J. Behav. Nutr. Phys. Act. 2011, 8, 121. [Google Scholar] [CrossRef] [PubMed]
- Gaesser, G.A.; Angadi, S.S. High-intensity interval training for health and fitness: Can less be more? J. Appl. Physiol. 2011, 111, 1540–1541. [Google Scholar] [CrossRef] [PubMed]
- Gibala, M.J.; Little, J.P.; Hawley, J.A.; Macdonald, M.J.; Macdonald, M.J.; Macdonald, M.J.; Mac Donald, M. Physiological adaptations to low-volume, high-intensity interval training in health and disease. J. Physiol. 2012, 590, 1077–1084. [Google Scholar] [CrossRef]
- Gibala, M.J.; Little, J.P.; Van Essen, M.; Wilkin, G.P.; Burgomaster, K.A.; Safdar, A.; Raha, S.; Tarnopolsky, M.A. Short-term sprint interval versus traditional endurance training: Similar initial adaptations in human skeletal muscle and exercise performance. J. Physiol. 2006, 575 Pt 3, 901–911. [Google Scholar] [CrossRef]
- Papadia, C.; Osowska, S.; Cynober, L.; Forbes, A. Citrulline in health and disease. Review on human studies. Clin. Nutr. 2017, 37, 1823–1828. [Google Scholar] [CrossRef]
- Gonzales, J.U.; Raymond, A.; Ashley, J.; Kim, Y. Does L-citrulline supplementation improve exercise blood flow in older adults? Exp. Physiol. 2017, 102, 1661–1671. [Google Scholar] [CrossRef] [PubMed]
- Bouillanne, O.; Melchior, J.C.; Faure, C.; Paul, M.; Canouï-Poitrine, F.; Boirie, Y.; Chevenne, D.; Forasassi, C.; Guery, E.; Herbaud, S.; et al. Impact of 3-week citrulline supplementation on postprandial protein metabolism in malnourished older patients: The Ciproage randomized controlled trial. Clin. Nutr. 2018, 38, 564–574. [Google Scholar] [CrossRef] [PubMed]
- Osowska, S.; Duchemann, T.; Walrand, S.; Paillard, A.; Boirie, Y.; Cynober, L.; Moinard, C. Citrulline modulates muscle protein metabolism in old malnourished rats. Am. J. Physiol. Metab. 2006, 291, E582–E586. [Google Scholar] [CrossRef] [PubMed]
- Faure, C.; Raynaud-Simon, A.; Ferry, A.; Daugé, V.; Cynober, L.; Aussel, C.; Moinard, C. Leucine and citrulline modulate muscle function in malnourished aged rats. Amino Acids 2012, 42, 1425–1433. [Google Scholar] [CrossRef] [PubMed]
- Le Plénier, S.; Goron, A.; Sotiropoulos, A.; Archambault, E.; Guihenneuc, C.; Walrand, S.; Salles, J.; Jourdan, M.; Neveux, N.; Cynober, L.; et al. Citrulline directly modulates muscle protein synthesis via the PI3K/MAPK/4E-BP1 pathway in a malnourished state: Evidence from in vivo, ex vivo, and in vitro studies. Am. J. Physiol. Endocrinol. Metab. 2017, 312, E27–E36. [Google Scholar] [CrossRef] [PubMed]
- Joffin, N.; Jaubert, A.-M.; Durant, S.; Bastin, J.; De Bandt, J.-P.; Cynober, L.; Moinard, C.; Forest, C.; Noirez, P. Citrulline induces fatty acid release selectively in visceral adipose tissue from old rats. Mol. Nutr. Food Res. 2014, 58, 1765–1775. [Google Scholar] [CrossRef] [PubMed]
- Figueroa, A.; Alvarez-Alvarado, S.; Ormsbee, M.J.; Madzima, T.A.; Campbell, J.C.; Wong, A. Impact of l-citrulline supplementation and whole-body vibration training on arterial stiffness and leg muscle function in obese postmenopausal women with high blood pressure. Exp. Gerontol. 2015, 63, 35–40. [Google Scholar] [CrossRef]
- Buckinx, F.; Gouspillou, G.; Carvalho, L.P.; Marcangeli, V.; Boutros, G.E.H.; Dulac, M.; Noirez, P.; Morais, J.A.; Gaudreau, P.; Aubertin-Leheudre, M. Effect of high-intensity interval training combined with l-citrulline supplementation on functional capacities and muscle function in dynapenic-obese older adults. J. Clin. Med. 2018, 7, 561. [Google Scholar] [CrossRef]
- Jourdan, M.; Nair, K.S.; Carter, R.E.; Schimke, J.; Ford, G.C.; Marc, J.; Aussel, C.; Cynober, L. Citrulline stimulates muscle protein synthesis in the post-absorptive state in healthy people fed a low-protein diet—A pilot study. Clin. Nutr. 2015, 34, 449–456. [Google Scholar] [CrossRef]
- Dulac, M.; Pion, C.; Lemieux, F.; El Hajj, G.B.; Bélanger, M.; Gaudreau, P.; Chevalier, S.; Morais, J.; Gouspillou, G.; Aubertin-Leheudre, M. Differences in muscle adaptation to a 12-week mixed power training in elderly men, depending on usual protein intake. Exp. Gerontol. 2018, 104, 78–85. [Google Scholar] [CrossRef]
- Bradlee, M.L.; Mustafa, J.; Singer, M.R.; Moore, L.L. High-protein foods and physical activity protect against age-related muscle loss and functional decline. J. Gerontol. Ser. A 2017, 73, 88–94. [Google Scholar] [CrossRef] [PubMed]
- Buckinx, F.; Gaudreau, P.; Marcangeli, V.; Boutros, G.E.H.; Dulac, M.C.; Morais, J.A.; Aubertin-Leheudre, M. Muscle adaptation in response to a high-intensity interval training in obese older adults: Effect of daily protein intake distribution. Aging Clin. Exp. Res. 2019, 31, 863–874. [Google Scholar] [CrossRef] [PubMed]
- Baumgartner, R.N.; Wayne, S.J.; Waters, D.L.; Janssen, I.; Gallagher, D.; Morley, J.E. Sarcopenic obesity predicts instrumental activities of daily living disability in the elderly. Obes. Res. 2004, 12, 1995–2004. [Google Scholar] [CrossRef] [PubMed]
- Granic, A.; Mendonça, N.; Sayer, A.A.; Hill, T.R.; Davies, K.; Adamson, A.; Siervo, M.; Mathers, J.C.; Jagger, C. Low protein intake, muscle strength and physical performance in the very old: The Newcastle 85+ Study. Clin. Nutr. 2018, 37 (6 Pt A), 2260–2270. [Google Scholar] [CrossRef]
- Fex, A.; Leduc-Gaudet, J.-P.; Filion, M.-E.; Karelis, A.D.; Aubertin-Leheudre, M. Effect of elliptical high intensity interval training on metabolic risk factor in pre- and type 2 diabetes patients: A pilot study. J. Phys. Act. Health 2015, 12, 942–946. [Google Scholar] [CrossRef] [PubMed]
- Chen, M.J.; Fan, X.; Moe, S.T. Criterion-related validity of the Borg ratings of perceived exertion scale in healthy individuals: A meta-analysis. J. Sports Sci. 2002, 20, 873–899. [Google Scholar] [CrossRef] [PubMed]
- Karvonen, J.; Karvonen, D.J.; Vuorimaa, T. Heart rate and exercise intensity during sports activities. Sports Med. 1988, 5, 303–312. [Google Scholar] [CrossRef]
- Moinard, C.; Le Plénier, S.; Noirez, P.; Morio, B.; Bonnefont-Rousselot, D.; Kharchi, C.; Ferry, A.; Neveux, N.; Cynober, L.; Raynaud-Simon, A. Citrulline supplementation induces changes in body composition and limits age-related metabolic changes in healthy male rats. J. Nutr. 2015, 145, 1429–1437. [Google Scholar] [CrossRef]
- Lührmann, P.; Herbert, B.; Gaster, C.; Neuhäuser-Berthold, M. Validation of a self-administered 3-day estimated dietary record for use in the elderly. Eur. J. Nutr. 1999, 38, 235–240. [Google Scholar] [CrossRef]
- Nutrient Data. Available online: http://www.healthcanada.gc.ca/cnf (accessed on 20 May 2019).
- Podsiadlo, D.; Richardson, S. The timed “Up & Go”: A test of basic functional mobility for frail elderly persons. J. Am. Geriatr. Soc. 1991, 39, 142–148. [Google Scholar]
- Mathias, S.; Nayak, U.S.; Isaacs, B. Balance in elderly patients: The “get-up and go” test. Arch. Phys. Med. Rehabil. 1986, 67, 387–389. [Google Scholar] [PubMed]
- Yanagawa, N.; Shimomitsu, T.; Kawanishi, M.; Fukunaga, T.; Kanehisa, H. Relationship between performances of 10-time-repeated sit-to-stand and maximal walking tests in non-disabled older women. J. Physiol. Anthr. 2016, 36, 163. [Google Scholar] [CrossRef]
- Chung, M.; Chan, R.; Fung, Y.; Fong, S.; Lam, S.; Lai, C.; Ng, S.M.S. Reliability and validity of Alternate Step Test times in subjects with chronic stroke. J. Rehabil. Med. 2014, 46, 969–974. [Google Scholar] [CrossRef] [PubMed]
- Berg, K.O.; Wood-Dauphinee, S.L.; I Williams, J.; Maki, B. Measuring balance in the elderly: Validation of an instrument. Can. J. Public Health 1992, 83, 7–11. [Google Scholar]
- Springer, B.A.; Marín, R.; Cyhan, T.; Roberts, H.; Gill, N.W. normative values for the unipedal stance test with eyes open and closed. J. Geriatr. Phys. Ther. 2007, 30, 8–15. [Google Scholar] [CrossRef] [PubMed]
- ATS statement: Guidelines for the six-minute walk test. Am. J. Respir. Crit. Care Med. 2002, 166, 111–117. [CrossRef] [PubMed]
- Burr, J.F.; Bredin, S.S.D.; Faktor, M.D.; Warburton, D.E.R. The 6-minute walk test as a predictor of objectively measured aerobic fitness in healthy working-aged adults. Phys. Sportsmed. 2011, 39, 133–139. [Google Scholar] [CrossRef]
- Mathiowetz, V.; Weber, K.; Volland, G.; Kashman, N. Reliability and validity of grip and pinch strength evaluations. J. Hand Surg. 1984, 9, 222–226. [Google Scholar] [CrossRef]
- Dulac, M.; Boutros, G.E.H.; Pion, C.; Barbat-Artigas, S.; Gouspillou, G.; Aubertin-Leheudre, M. Is handgrip strength normalized to body weight a useful tool to identify dynapenia and functional incapacity in post-menopausal women? Braz. J. Phys. Ther. 2016, 20, 510–516. [Google Scholar] [CrossRef]
- Houtz, S.J.; Lebow, M.J.; Beyer, F.R. Effect of posture on strength of the knee flexor and extensor muscles. J. Appl. Physiol. 1957, 11, 475–480. [Google Scholar] [CrossRef]
- Williams, M.; Stutzman, L. Strength variation through the range of joint motion. Phys. Ther. 1959, 39, 145–152. [Google Scholar] [CrossRef]
- Riggs, B.L.; Wahner, H.W.; Dunn, W.L.; Mazess, R.B.; Offord, K.P.; Melton, L.J. Differential changes in bone mineral density of the appendicular and axial skeleton with aging: Relationship to spinal osteoporosis. J. Clin. Investig. 1981, 67, 328–335. [Google Scholar] [CrossRef] [PubMed]
- Barbat-Artigas, S.; Rolland, Y.; Cesari, M.; Abellan van Kan, G.; Vellas, B.; Aubertin-Leheudre, M. Clinical relevance of different muscle strength indexes and functional impairment in women aged 75 years and older. J. Gerontol. A Biol. Sci. Med. Sci. 2013, 68, 811–919. [Google Scholar] [CrossRef] [PubMed]
- Bassey, E.J.; Short, A.H. A new method for measuring power output in a single leg extension: Feasibility, reliability and validity. Graefe’s Arch. Clin. Exp. Ophthalmol. 1990, 60, 385–390. [Google Scholar] [CrossRef]
- Kennedy, J.; Rutherford, O.M.; Skelton, D.A. Explosive power and asymmetry in leg muscle function in frequent fallers and non-fallers aged over 65. Age Ageing 2002, 31, 119–125. [Google Scholar]
- Blew, R.M.; Lee, V.R.; Farr, J.N.; Schiferl, D.J.; Going, S.B. Standardizing evaluation of pQCT image quality in the presence of subject movement: Qualitative versus quantitative assessment. Calcif. Tissue Int. 2014, 9, 202–211. [Google Scholar] [CrossRef] [PubMed]
- Doube, M.; Kłosowski, M.M.; Arganda-Carreras, I.; Cordelières, F.P.; Dougherty, R.P.; Jackson, J.S.; Schmid, B.; Hutchinson, J.R.; Shefelbine, S.J. BoneJ: Free and extensible bone image analysis in ImageJ. Bone 2010, 47, 1076–1079. [Google Scholar] [CrossRef]
- Frank-Wilson, A.W.; Johnston, J.D.; Olszynski, W.P.; Kontulainen, S.A. Measurement of muscle and fat in postmenopausal women: Precision of previously reported pQCT imaging methods. Bone 2015, 75, 49–54. [Google Scholar] [CrossRef]
- De Oliveira Silva, A.; Dutra, M.T.; de Moraes, W.M.A.M.; Funghetto, S.S.; de Farias, D.L.; dos Santos, P.H.F.; Vieira, D.C.L.; da Cunha Nascimento, D.; Orsano, V.S.M.; Schoenfeld, B.J.; et al. Resistance training-induced gains in muscle strength, body composition, and functional capacity are attenuated in elderly women with sarcopenic obesity. Clin. Interv. Aging 2018, 13, 411–417. [Google Scholar] [CrossRef]
- Bell, K.E.; Parise, G.; Baker, S.K.; Phillips, S.; Seguin, C. Day-to-day changes in muscle protein synthesis in recovery from resistance, aerobic, and high-intensity interval exercise in older men. J. Gerontol. Ser. A 2015, 70, 1024–1029. [Google Scholar] [CrossRef]
- Mitchell, C.J.; Milan, A.M.; Mitchell, S.M.; Zeng, N.; Ramzan, F.; Sharma, P.; O Knowles, S.; Roy, N.C.; Sjödin, A.; Wagner, K.-H.; et al. The effects of dietary protein intake on appendicular lean mass and muscle function in elderly men: A 10-wk randomized controlled trial. Am. J. Clin. Nutr. 2017, 106, 1375–1383. [Google Scholar] [CrossRef]
- Moro, T.; Brightwell, C.R.; Deer, R.R.; Graber, T.G.; Galvan, E.; Fry, C.S.; Volpi, E.; Rasmussen, B.B. Muscle protein anabolic resistance to essential amino acids does not occur in healthy older adults before or after resistance exercise training. J. Nutr. 2018, 148, 900–909. [Google Scholar] [CrossRef]
- Da Boit, M.; Sibson, R.; Thies, F.; Gray, S.R.; Meakin, J.R.; Aspden, R.M.; Mangoni, A.A. Sex differences in the response to resistance exercise training in older people. Physiol. Rep. 2016, 4, e12834. [Google Scholar] [CrossRef]
- Glenn, J.M.; Gray, M.; Jensen, A.; Stone, M.S.; Vincenzo, J.L. Acute citrulline-malate supplementation improves maximal strength and anaerobic power in female, masters athletes tennis players. Eur. J. Sport Sci. 2016, 16, 1–9. [Google Scholar] [CrossRef]
- Cohen, P.P.; Hayano, M. The conversion of citrulline to arginine (transimination) by tissue slices and homogenates. J. Biol. Chem. 1946, 166, 239–250. [Google Scholar]
- Alba-Roth, J.; Müller, O.A.; Schopohl, J.; Von Werder, K. Arginine stimulates growth hormone secretion by suppressing endogenous somatostatin secretion. J. Clin. Endocrinol. Metab. 1988, 67, 1186–1189. [Google Scholar] [CrossRef]
- Ge, X.; Yu, J.; Jiang, H. Growth hormone stimulates protein synthesis in bovine skeletal muscle cells without altering insulin-like growth factor-I mRNA expression1. J. Anim. Sci. 2012, 90, 1126–1133. [Google Scholar] [CrossRef]


| Variables | CIT–PROT− (n = 19) | PLA–PROT− (n = 14) | CIT–PROT+ (n = 21) | PLA–PROT+ (n = 19) | p-Value |
|---|---|---|---|---|---|
| Sex (men) | 7 (36.8%) | 9 (64.3%) | 8 (38.1%) | 9 (36.8%) | 0.46 |
| Age (years) | 67.5 ± 4.5 | 67.8 ± 3.9 | 66.5 ± 5.2 | 68.2 ± 3.5 | 0.65 |
| Weight (kg) | 82.0 ± 10.6 | 81.9 ± 10.6 c,d | 76.8 ± 15.0 b | 74.9 ± 13.2 b | 0.01 |
| Height (cm) | 165.6 ± 8.1 | 168.1 ± 9.5 | 166.3 ± 7.3 | 164.4 ± 9.1 | 0.47 |
| BMI (kg/m²) | 30.4 ± 4.0 | 31.9 ± 6.0 d | 27.7 ± 5.0 | 27.6 ± 3.8 b | 0.009 |
| Waist circumference (cm) | 104.8 ± 13.6 | 109.2 ± 10.8 | 100.6 ± 13.2 | 101.0 ± 11.9 | 0.18 |
| Number of steps/d (n) | 5591 ± 3068 | 5288 ±2180 | 6835 ± 3051 | 7570 ± 3267 | 0.10 |
| Energy expenditure (kcal/d) | 2115 ± 196 | 2373 ± 528 | 2169 ± 364 | 2183 ± 344 | 0.26 |
| Energy intake (kcal/d) | 1692 ± 418 | 1754 ± 395 | 2149 ± 523 a,b | 2390 ± 301 | 0.004 |
| Protein intake (g/kg/d) | 0.76 ± 0.17 c,d | 0.78 ± 0.15 c,d | 1.32 ± 0.23 a,b | 1.34 ± 0.32 a,b | <0.001 |
| Variables | Pre-Intervention (T0) | Post-Intervention (T12) | Time Effect | Time*Group Effect | ||||||
|---|---|---|---|---|---|---|---|---|---|---|
| CIT–PROT− | PLA–PROT− | CIT–PROT+ | PROT+PLA | CIT–PROT− | PLA–PROT− | CIT–PROT+ | PLA–PROT+ | |||
| Functional capacities | ||||||||||
| TUG (s) | 10.2 ± 1.8 | 10.7 ± 2.1 | 9.9 ± 1.4 | 9.8 ±0.8 | 8.8 ±1.0 | 9.4 ± 1.7 | 8.8 ±1.1 | 9.0 ± 0.8 | <0.001 | 0.17 |
| TUGf (s) | 7.4 ± 1.1 | 7.6 ± 1.4 | 7.4 ± 1.1 | 7.3 ± 0.6 | 6.4 ± 0.8 | 6.7 ± 1.2 | 6.4 ± 1.1 | 6.6 ± 0.7 | <0.001 | 0.49 |
| Chair stand test (s) | 19.5 ± 2.9 | 20.3 ± 6.0 | 18.8 ± 3.4 | 19.5 ± 3.2 | 16.2 ± 2.8 | 16.3 ± 4.3 | 15.4 ± 2.6 | 16.1 ± 3.7 | <0.001 | 0.89 |
| Alternate step test (n) | 28.9 ± 5.0 | 28.2 ± 4.4 | 30.4 ± 4.6 | 28.3 ± 3.7 | 32.9 ± 5.8 | 32.4 ± 5.5 | 34.0 ± 5.2 | 33.5 ± 4.4 | <0.001 | 0.49 |
| Unipodal balance test (s) | 18.1 ± 14.4 | 24.1 ± 15.4 | 35.5 ± 18.7 | 26.2 ± 20.5 | 30.9 ± 21.9 | 39.2 ± 20.8 | 42.6 ± 20.8 | 35.1 ± 20.4 | <0.001 | 0.65 |
| Physical endurance | ||||||||||
| 6MWT (m) | 547 ± 103 | 528 ± 83 | 545 ± 82 | 566 ± 77 | 605 ± 89 | 591 ± 83 | 626 ± 95 | 638 ± 86 | <0.001 | 0.70 |
| Variables | Pre-Intervention (T0) | Post-Intervention (T12) | Time Effect | Time*Group Effect | ||||||
|---|---|---|---|---|---|---|---|---|---|---|
| CIT–PROT− | PLA–PROT− | CIT–PROT+ | PLA–PROT+ | CIT–PROT− | PLA–PROT− | CIT–PROT+ | PLA–PROT+ | |||
| Upper and Lower Muscle Strength | ||||||||||
| HSr (kg/kg) | 0.41 ± 0.12 a | 0.41 ± 0.11 | 0.42 ± 0.11 | 0.40 ± 0.09 | 0.45 ± 0.11 a | 0.43 ± 0.12 | 0.43 ± 0.11 | 0.41 ± 0.08 | <0.001 | 0.04 |
| KESr (N/kg) | 9.9 ± 2.2 | 9.8 ± 2.0 | 9.9 ± 2.5 b | 10.2 ± 1.6 | 10.3 ± 2.0 | 10.1 ± 1.9 | 11.4 ± 1.9 b | 10.4 ± 1.6 | <0.001 | 0.07 |
| Muscle Power | ||||||||||
| LLMP(W/kg) | 8.8 ± 2.4 | 8.8 ± 3.2 | 9.1 ± 2.7 | 9.0 ± 2.1 | 10.3 ± 2.4 | 10.7 ± 2.8 | 10.9 ± 2.9 | 10.4 ± 1.8 | <0.001 | 0.91 |
| Variables | Pre-intervention (T0) | Post-intervention (T12) | Time Effect | Time*Group Effect | ||||||
|---|---|---|---|---|---|---|---|---|---|---|
| CIT–PROT− | PLA–PROT− | CIT–PROT+ | PLA–PROT+ | CIT–PROT− | PLA–PROT− | CIT–PROT+ | PLA–PROT+ | |||
| Body composition | ||||||||||
| Total FM (%) | 38.4 ± 7.3 a | 37.6 ± 7.8 | 35.8 ± 5.9 b | 38.6 ± 7.7 | 37.1 ± 7.2 a | 37.0 ± 7.2 | 34.9 ± 5.3 b | 38.2 ± 8.1 | 0.004 | 0.63 |
| Android (%) | 47.4 ± 6.6 | 47.5 ± 6.0 | 45.0 ± 9.7 | 48.0 ± 7.7 | 46.6 ± 6.7 | 47.0 ± 5.7 | 42.9 ± 9.1 | 47.8 ± 8.4 | 0.011 | 0.18 |
| Gynoid (%) | 41.2 ± 9.9 a | 37.7 ± 11.0 | 38.6± 7.0 | 42.2 ± 9.3 | 39.0 ± 9.0 a | 37.7 ± 10.3 | 38.9 ± 7.47 | 41.5 ± 10.1 | 0.07 | 0.06 |
| LM (kg) | 47.5 ± 7.0 | 51.8 ± 7.3 | 47.8 ± 7.5 | 43.1 ± 9.3 | 48.0 ± 7.2 | 53.0 ± 7.9 | 46.3 ± 8.0 | 43.4 ± 9.5 | 0.001 | 0.33 |
| LLM (kg) | 16.4 ± 2.4 a | 18.4 ± 3.0 | 16.6 ± 2.9 | 15.4 ± 3.5 | 16.9 ± 2.3 a | 18.8 ± 3.3 | 16.6 ± 2.9 | 15.7 ± 3.5 | 0.001 | 0.11 |
| App LM (kg/m)² | 21.7 ± 3.67 | 24.4 ± 4.4 | 21.7 ± 4.1 | 20.4 ± 5.2 | 22.1 ± 3.6 | 24.7 ± 4.9 | 21.7 ± 4.2 | 20.6 ± 5.2 | 0.02 | 0.63 |
| Muscle composition | ||||||||||
| Thigh muscle Area (cm2) | 109.9 ± 21.2 | 91.8 ± 11.9 | 91.7 ± 28.7 | 99.3 ± 21.7 | 109.6 ± 30.7 | 94.4 ± 15.6 | 91.3 ± 27.9 | 95.7 ± 21.8 | 0.10 | 0.42 |
| Total Fat Area (cm2) | 91.9 ± 60.4 | 93.1 ± 41.6 | 77.3 ± 38.3 | 73.1 ± 35.7 | 90.9 ± 56.1 | 86.2 ± 37.9 | 75.4 ± 35.6 | 66.9 ± 29.9 | 0.28 | 0.55 |
| Subcutaneous fat area (cm2) | 85.7 ± 60.3 | 87.7 ± 41.5 | 73.2 ± 38.6 | 77.7 ± 43.0 | 85.4 ± 55.0 | 81.9 ± 38.2 | 71.3 ± 35.2 | 62.9± 30.4 | 0.31 | 0.59 |
| Intra-muscular fat area (cm2) | 6.23 ± 1.63 | 5.35 ± 3.03 | 4.11 ± 1.93 | 4.89 ± 2.38 | 5.46 ± 2.88 | 4.26 ± 1.92 | 4.13 ± 1.83 | 4.05 ± 2.36 | 0.08 | 0.67 |
| Variables | Δ CIT–PROT− | Δ PLA–PROT− | p | Δ CIT–PROT+ | Δ PLA–PROT+ | p |
|---|---|---|---|---|---|---|
| Functional capacities | ||||||
| TUG (%) | −14.7 ± 7.2 | −11.3 ± 9.2 | 0.30 | −10.7 ± 9.4 | −7.8 ± 9.1 | 0.41 |
| TUGf (%) | −13.3 ± 7.2 | −11.9 ± 7.2 | 0.48 | −13.8 ± 9.8 | −9.6 ± 9.6 | 0.25 |
| Chair stand test (%) | −16.4 ± 9.0 | −18.8 ± 10.2 | 0.93 | −16.6 ± 14.2 | −17.2 ± 11.7 | 0.77 |
| Alternate step test (%) | 14.1 ± 9.8 | 14.9 ± 10.6 | 0.90 | 13.2 ± 12.3 | 18.5 ± 8.9 | 0.16 |
| Unipodal balance test (%) | 124.9± 181.7 | 77.4 ± 77.2 | 0.06 | 51.8 ± 125.7 | 92.9 ± 141.2 | 0.79 |
| Physical endurance | ||||||
| 6MWT (%) | 12.0 ± 12.6 | 12.6 (±11.6) | 0.71 | 15.2 ± 9.5 | 13.6 ± 14.5 | 0.31 |
| Muscle strength | ||||||
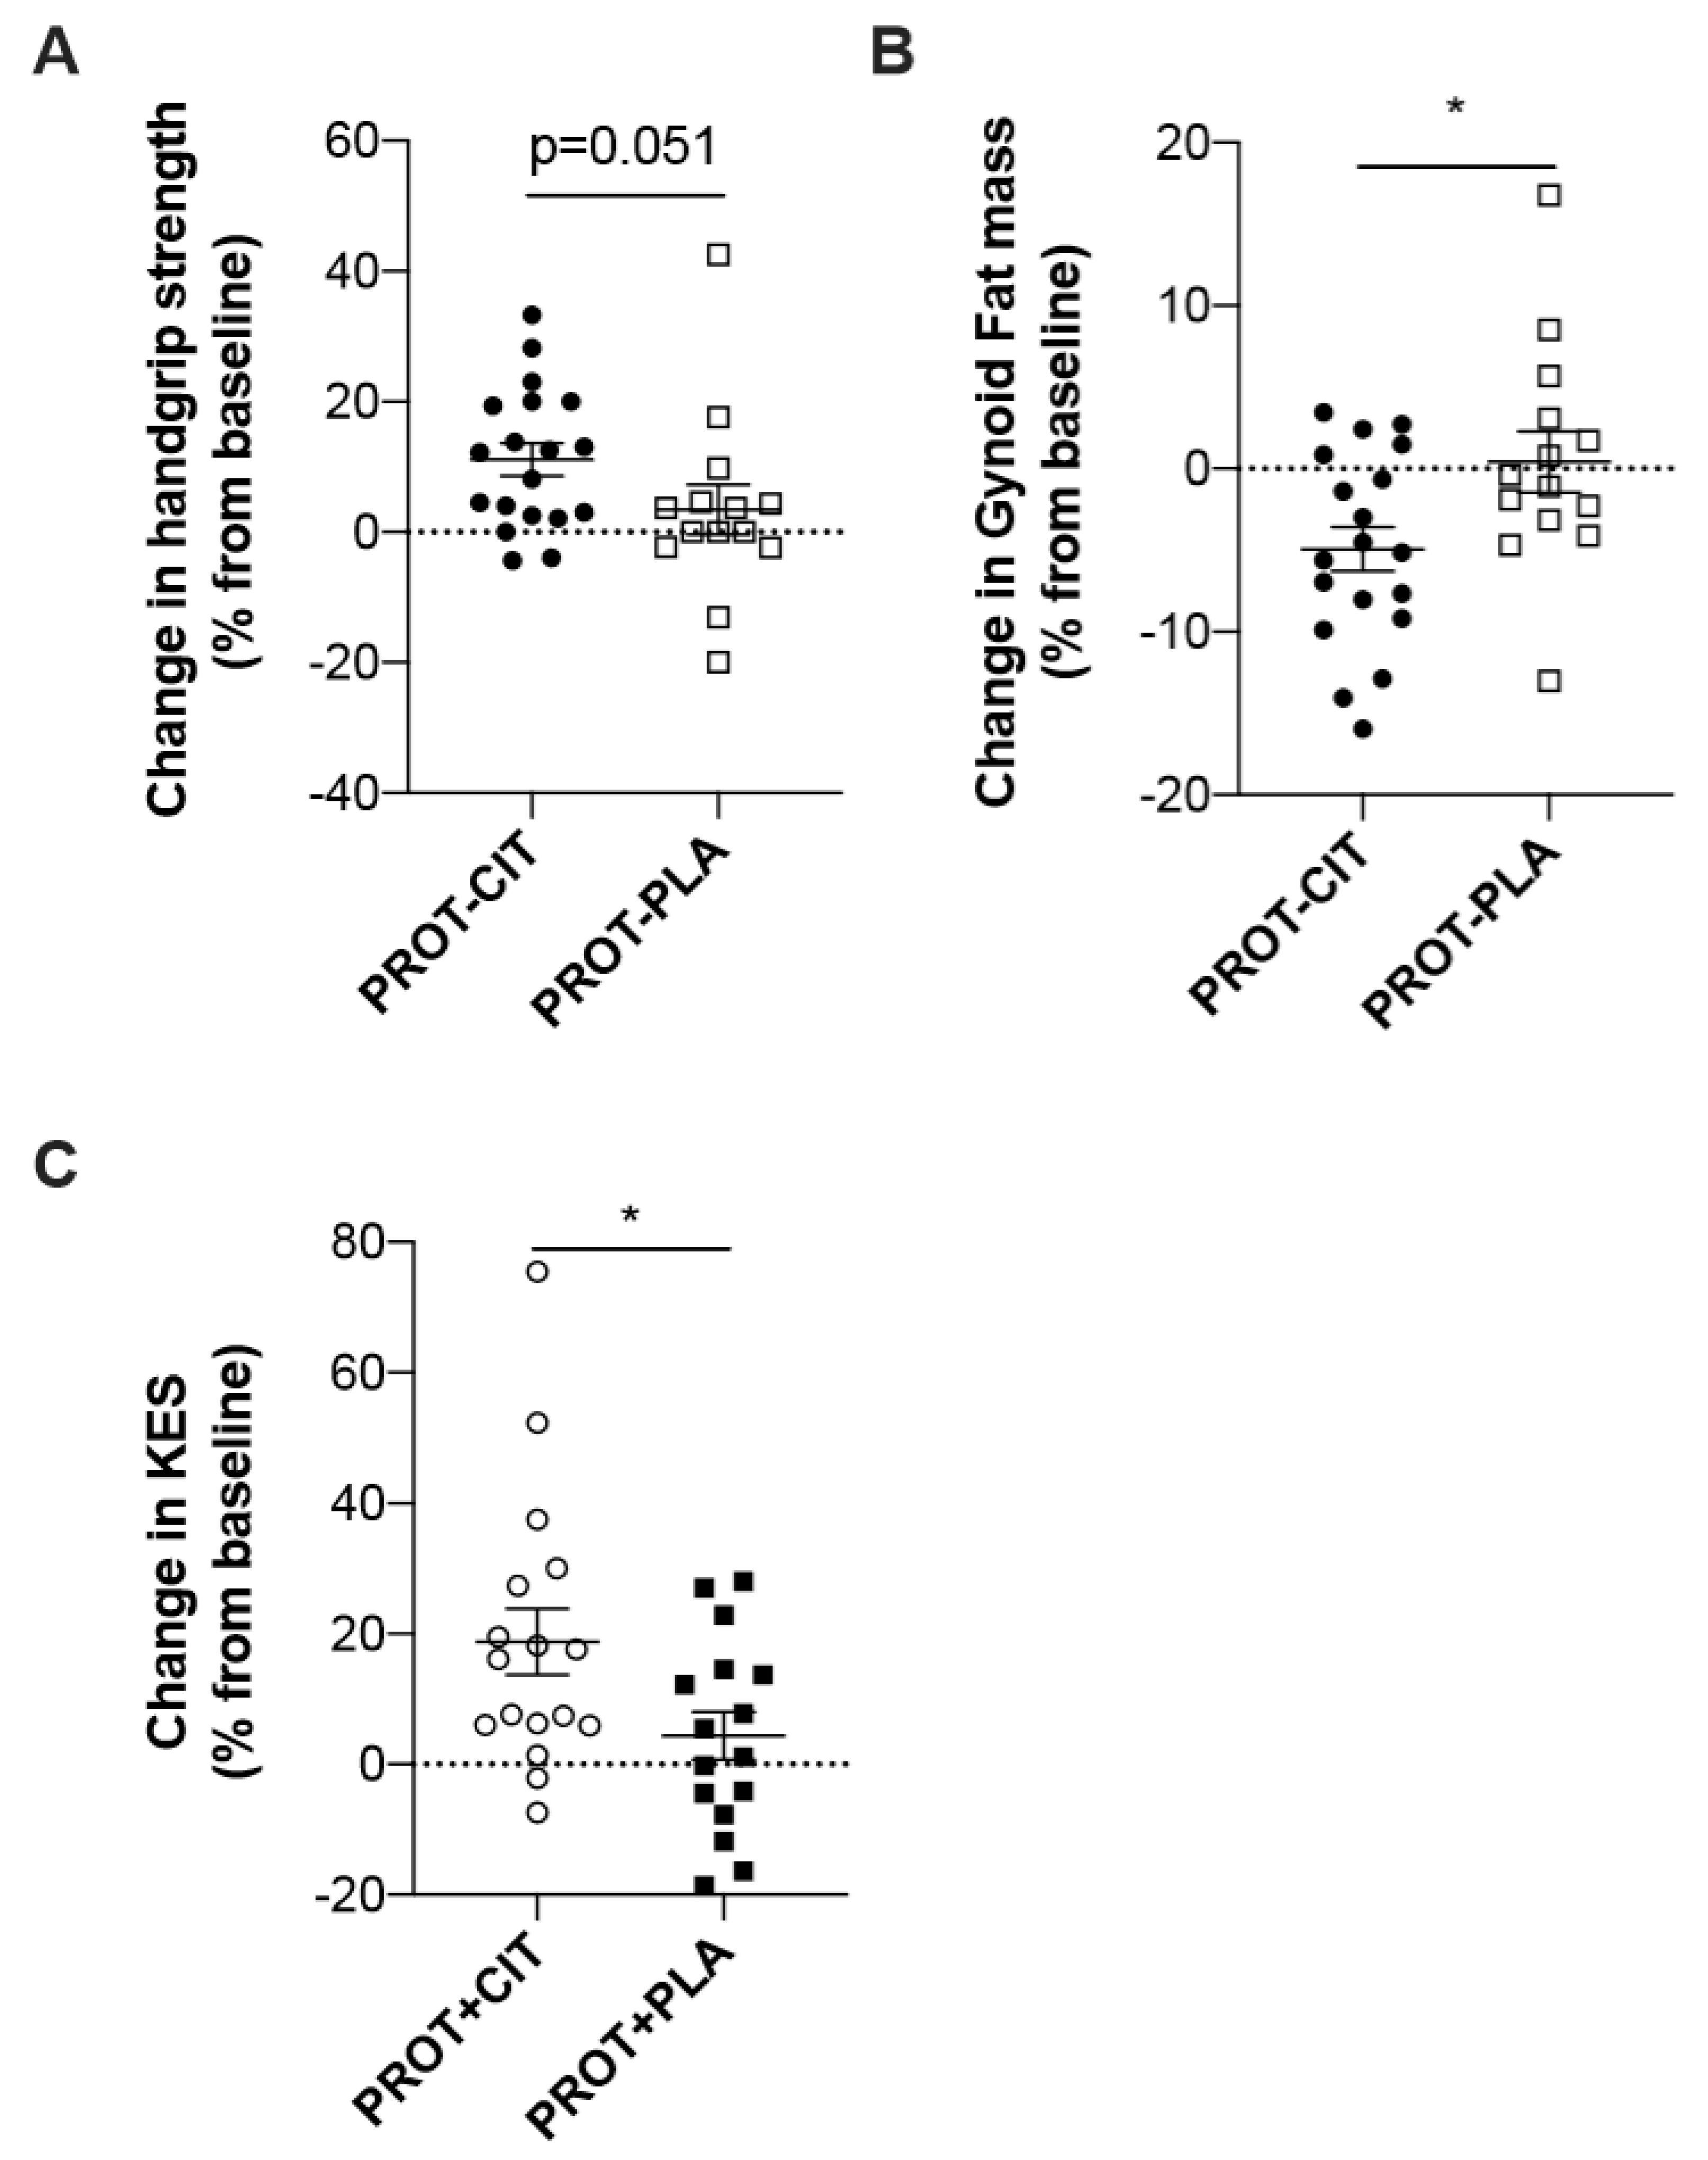
| HSr (%) | 12.4 ± 11.4 | 3.4 ± 14.6 | 0.051 | 3.0 ± 9.8 | 2.9 ± 9.3 | 0.92 |
| KESr (%) | 6.4 ± 19.1 | 3.4 ± 8.6 | 0.74 | 19.4 ± 23.0 | 3.6 ± 16.5 | 0.04 |
| Muscle power | ||||||
| LLMP (%) | 22.7 ± 33.0 | 25.7 ± 17.4 | 0.76 | 24.6 ± 33.9 | 21.5 ± 33.1 | 0.59 |
| Body composition | ||||||
| FM (%) | −3.4 ± 4.1 | −1.4 ± 5.4 | 0.42 | −1.8 ± 9.7 | −1.1 ± 5.0 | 0.42 |
| Android (%) | −1.34 ± 4.83 | −0.87± 6.53 | 0.30 | −4.04 ± 4.87 | −0.74 ± 4.41 | 0.05 |
| Gynoid (%) | −4.9 ± 5.9 | 0.4 ± 6.9 | 0.04 | 0.9 ± 9.2 | −2.1 ± 7.3 | 0.17 |
| LM (%) | 1.3 ± 3.4 | 2.3 ± 3.8 | 0.32 | 0.9 ± 2.4 | 0.7 ± 3.0 | 0.73 |
| LLM (%) | 3.1 ± 5.2 | 2.0 ± 3.1 | 0.30 | −0.1 ± 3.6 | 1.8 ± 5.1 | 0.24 |
| App LM (%) | 1.62 ± 4.71 | 0.88 ± 3.27 | 0.39 | 0.69 ± 2.37 | 1.24 ± 4.83 | 0.08 |
| Lean muscle area (%) | −1.76 ± 51.3 | 2.35 ± 75.2 | 0.88 | −1.73 ± 61.3 | 127.2 ± 365.9 | 0.41 |
| Total Fat Area (%) | −6.94 ± 7.28 | 3.04 ± 23.9 | 0.06 | 0.76 ± 22.3 | −1.77 ± 9.97 | 0.81 |
| Total subcutaneous fat area (%) | −5.85 ± 6.54 | 5.71 ± 28.9 | 0.13 | 2.20 ± 21.9 | −1.59 ± 9.18 | 0.61 |
| Intra muscular (%) | 1.97 ± 9.56 | −0.47 ± 13.9 | 0.46 | −4.69 ± 18.1 | 1.73 ± 6.33 | 0.34 |
| Variables | Δ CIT–PROT− | Δ CIT–PROT+ | p | Δ PLA–PROT− | Δ PLA–PROT+ | p |
|---|---|---|---|---|---|---|
| Functional capacities | ||||||
| TUG (%) | −14.7 ± 7.2 | −10.7 ± 9.4 | 0.20 | −11.3 ± 9.2 | −7.8 ± 9.1 | 0.48 |
| TUGf (%) | −13.3 ± 7.2 | −13.8 ± 9.8 | 0.88 | −11.9 ± 7.2 | −9.6 ± 9.6 | 0.76 |
| Chair stand test (%) | −16.4 ± 9.0 | −16.6 ± 14.2 | 0.73 | −18.8 ± 10.2 | −17.2 ± 11.7 | 0.82 |
| Alternate step test (%) | 14.1 ± 9.8 | 13.2 ± 12.3 | 0.90 | 14.9 ± 10.6 | 18.5 ± 8.9 | 0.28 |
| Unipodal balance test (%) | 120 ± 184 | 52 ± 126 | 0.16 | 77 ± 77 | 101 ± 145 | 0.88 |
| Physical endurance | ||||||
| 6MWT (%) | 12.0 (±12.6) | 15.2 (±9.5) | 0.27 | 12.6 (±11.6) | 13.6 (±14.5) | 0.65 |
| Muscle strength | ||||||
| HSr (%) | 12.4 ± 11.4 | 3.0 ± 9.8 | 0.02 | 3.4 ± 1.6 | 2.9 ± 9.3 | 0.60 |
| KESr (%) | 6.4 ± 19.1 | 19.4 ± 23.0 | 0.06 | 3.4 ± 8.6 | 3.6 ± 16.5 | 0.85 |
| Muscle power | ||||||
| LLMP (%) | 22.7 ± 33.0 | 24.6 ± 33.9 | 0.92 | 25.7 ± 17.4 | 21.5 ± 33.1 | 0.32 |
| Body composition | ||||||
| FM (%) | −3.4 ± 4.1 | −1.8 ± 9.7 | 0.61 | −1.4 ± 5.4 | −1.1 ± 5.0 | 0.55 |
| Android (%) | −1.34 ± 4.83 | −4.04 ± 8.75 | 0.05 | −0.87 ± 6.53 | −0.74 ± 4.41 | 0.22 |
| Gynoid (%) | −4.9 ± 5.9 | 0.9 ± 9.2 | 0.02 | 0.4 ± 6.9 | −2.1 ± 7.3 | 0.73 |
| LM (%) | 1.3 ± 3.4 | 0.9 ± 2.4 | 0.75 | 2.3 ± 3.8 | 0.7 ± 3.0 | 0.38 |
| LLM (%) | 3.1 ± 5.2 | −0.1 ± 3.6 | 0.02 | 2.0 ± 3.1 | 1.8 ± 5.1 | 0.19 |
| App LM (%) | 0.88 ± 3.27 | 1.24 ± 4.83 | 0.05 | 1.62 ± 4.71 | 0.67 ± 2.37 | 0.35 |
| Lean Muscle Area (%) | −1.76 ± 51.3 | −1.73 ± 61.3 | 0.69 | 2.35 ± 75.2 | 172.2 ± 635.9 | 0.54 |
| Total Fat Area (%) | −6.94 ± 7.28 | 0.76 ± 22.3 | 0.21 | 3.04 ± 23.9 | −1.77 ± 9.97 | 0.92 |
| Total subcutaneous fat area (%) | −5.85 ± 6.54 | 2.20 ± 21.9 | 0.12 | 5.71 ± 28.9 | −1.59 ± 9.18 | 0.72 |
| Intramuscular (cm²) | 1.97 ± 9.56 | −4.69 ± 18.1 | 0.34 | −0.47 ± 13.9 | 1.73 ± 6.33 | 0.44 |
© 2019 by the authors. Licensee MDPI, Basel, Switzerland. This article is an open access article distributed under the terms and conditions of the Creative Commons Attribution (CC BY) license (http://creativecommons.org/licenses/by/4.0/).
Share and Cite
Buckinx, F.; Marcangeli, V.; Pinheiro Carvalho, L.; Dulac, M.; Hajj Boutros, G.; Gouspillou, G.; Gaudreau, P.; Morais, J.; Noirez, P.; Aubertin-Leheudre, M. Initial Dietary Protein Intake Influence Muscle Function Adaptations in Older Men and Women Following High-Intensity Interval Training Combined with Citrulline. Nutrients 2019, 11, 1685. https://doi.org/10.3390/nu11071685
Buckinx F, Marcangeli V, Pinheiro Carvalho L, Dulac M, Hajj Boutros G, Gouspillou G, Gaudreau P, Morais J, Noirez P, Aubertin-Leheudre M. Initial Dietary Protein Intake Influence Muscle Function Adaptations in Older Men and Women Following High-Intensity Interval Training Combined with Citrulline. Nutrients. 2019; 11(7):1685. https://doi.org/10.3390/nu11071685
Chicago/Turabian StyleBuckinx, Fanny, Vincent Marcangeli, Lívia Pinheiro Carvalho, Maude Dulac, Guy Hajj Boutros, Gilles Gouspillou, Pierrette Gaudreau, José Morais, Philippe Noirez, and Mylène Aubertin-Leheudre. 2019. "Initial Dietary Protein Intake Influence Muscle Function Adaptations in Older Men and Women Following High-Intensity Interval Training Combined with Citrulline" Nutrients 11, no. 7: 1685. https://doi.org/10.3390/nu11071685
APA StyleBuckinx, F., Marcangeli, V., Pinheiro Carvalho, L., Dulac, M., Hajj Boutros, G., Gouspillou, G., Gaudreau, P., Morais, J., Noirez, P., & Aubertin-Leheudre, M. (2019). Initial Dietary Protein Intake Influence Muscle Function Adaptations in Older Men and Women Following High-Intensity Interval Training Combined with Citrulline. Nutrients, 11(7), 1685. https://doi.org/10.3390/nu11071685