Vegetable Consumption and Factors Associated with Increased Intake among College Students: A Scoping Review of the Last 10 Years

 , ,
, ,
Abstract
:1. Introduction
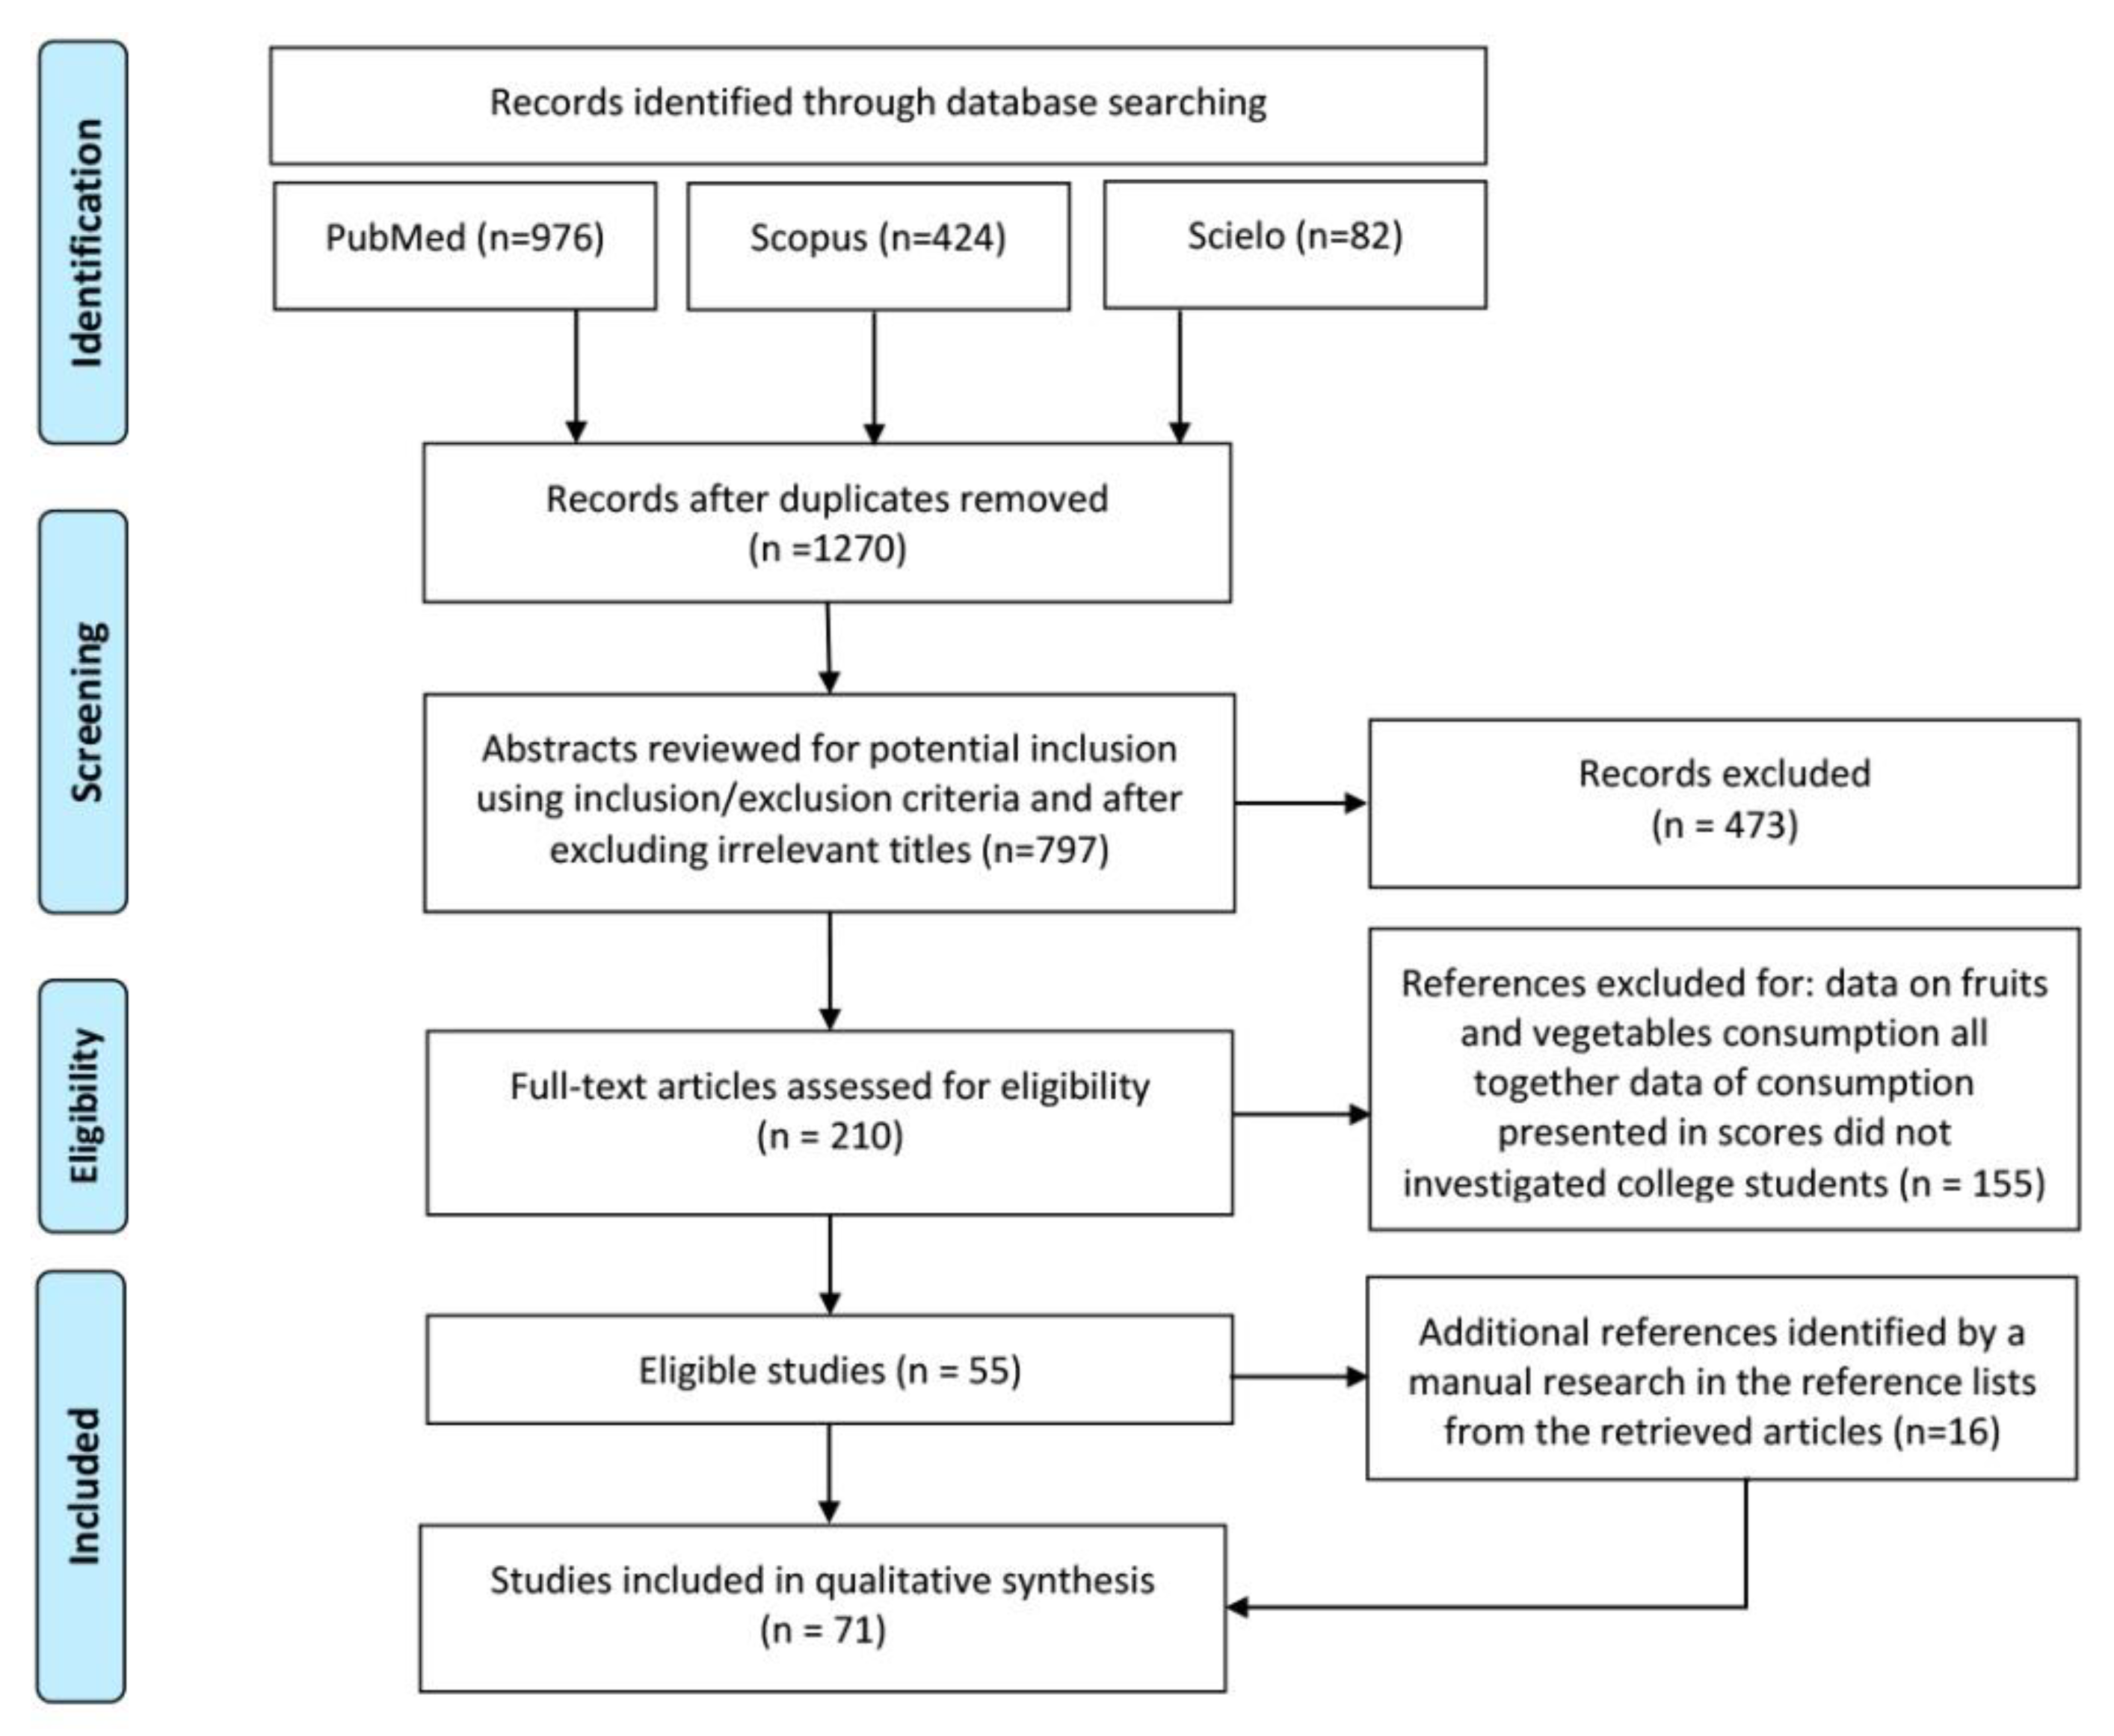
2. Materials and Methods
3. Results
3.1. Studies Characteristics
3.1.1. Design and Participants
3.1.2. Vegetable Definition
3.1.3. Vegetable Consumption
4. Discussion
Limitations and Further Studies
5. Conclusions
Author Contributions
Funding
Conflicts of Interest
References
- Nelson, M.C.; Story, M.; Larson, N.I.; Neumark-Sztainer, D.; Lytle, L.A. Emerging adulthood and college-aged youth: An overlooked age for weight-related behavior change. Obesity 2008, 16, 2205–2211. [Google Scholar] [CrossRef] [PubMed]
- Stok, F.M.; Renner, B.; Clarys, P.; Lien, N.; Lakerveld, J.; Deliens, T. Understanding Eating Behavior during the Transition from Adolescence to Young Adulthood: A Literature Review and Perspective on Future Research Directions. Nutrients 2018, 10, 667. [Google Scholar] [CrossRef] [PubMed]
- Zaborowicz, K.; Czarnocinska, J.; Galinski, G.; Kazmierczak, P.; Gorska, K.; Durczewski, P. Evaluation of selected dietary behaviours of students according to gender and nutritional knowledge. Rocz. Panstw. Zakl. Hig. 2016, 67, 45–50. [Google Scholar] [PubMed]
- Sanchez Socarras, V.; Aguilar Martinez, A. Food habits and health-related behaviors in a university population. Nutr. Hosp. 2014, 31, 449–457. [Google Scholar] [CrossRef] [PubMed]
- Bernardo, G.L.; Jomori, M.M.; Fernandes, A.C.; Proença, R.P.d.C. Food intake of university students. Rev. Nutr. 2017, 30, 847–865. [Google Scholar] [CrossRef] [Green Version]
- Hutchesson, M.J.; Rollo, M.E.; Krukowski, R.; Ells, L.; Harvey, J.; Morgan, P.J.; Callister, R.; Plotnikoff, R.; Collins, C.E. eHealth interventions for the prevention and treatment of overweight and obesity in adults: A systematic review with meta-analysis. Obes. Rev. 2015, 16, 376–392. [Google Scholar] [CrossRef] [PubMed]
- World Health Organization. Fact sheets. In Noncommunicable Diseases, 1st ed.; World Health Organization: Geneva, Switzerland, 2018. [Google Scholar]
- World Health Organization. Healthy Diet. Fact Sheet N°394; World Health Organization: Geneva, Switzerland, 2015. [Google Scholar]
- Del Gobbo, L.C.; Khatibzadeh, S.; Imamura, F.; Micha, R.; Shi, P.; Smith, M.; Myers, S.S.; Mozaffarian, D. Assessing global dietary habits: A comparison of national estimates from the FAO and the Global Dietary Database. Am. J. Clin. Nutr. 2015, 101, 1038–1046. [Google Scholar] [CrossRef] [PubMed]
- Miller, V.; Yusuf, S.; Chow, C.K.; Dehghan, M.; Corsi, D.J.; Lock, K.; Popkin, B.; Rangarajan, S.; Khatib, R.; Lear, S.A.; et al. Availability, affordability, and consumption of fruits and vegetables in 18 countries across income levels: Findings from the Prospective Urban Rural Epidemiology (PURE) study. Lancet Glob. Health 2016, 4, e695–e703. [Google Scholar] [CrossRef]
- Wang, X.; Ouyang, Y.; Liu, J.; Zhu, M.; Zhao, G.; Bao, W.; Hu, F.B. Fruit and vegetable consumption and mortality from all causes, cardiovascular disease, and cancer: Systematic review and dose-response meta-analysis of prospective cohort studies. BMJ 2014, 349, g4490. [Google Scholar] [CrossRef]
- Food and Agriculture Organization of the United Nations. Plates, Pyramids, Planet; Food and Agriculture Organization of the United Nations: Rome, Italy, 2016. [Google Scholar]
- Slavin, J.L.; Lloyd, B. Health benefits of fruits and vegetables. Adv. Nutr. 2012, 3, 506–516. [Google Scholar] [CrossRef]
- Sabate, J.; Sranacharoenpong, K.; Harwatt, H.; Wien, M.; Soret, S. The Environmental Cost of Protein Food Choices--CORRIGENDUM. Public Health Nutr. 2015, 18, 2096. [Google Scholar] [CrossRef] [PubMed]
- Trudeau, E.; Kristal, A.R.; Li, S.; Patterson, R.E. Demographic and psychosocial predictors of fruit and vegetable intakes differ: Implications for dietary interventions. J. Am. Diet. Assoc. 1998, 98, 1412–1417. [Google Scholar] [CrossRef]
- Appleton, K.M.; Hemingway, A.; Saulais, L.; Dinnella, C.; Monteleone, E.; Depezay, L.; Morizet, D.; Armando Perez-Cueto, F.J.; Bevan, A.; Hartwell, H. Increasing vegetable intakes: Rationale and systematic review of published interventions. Eur. J. Nutr. 2016, 55, 869–896. [Google Scholar] [CrossRef] [PubMed]
- Van der Kruk, J.J.; Jager-Wittenaar, H.; Nieweg, R.M.; van der Schans, C.P. Do Dutch nutrition and dietetics students meet nutritional requirements during education? Public Health Nutr. 2014, 17, 1237–1244. [Google Scholar] [CrossRef] [PubMed]
- White, B.A.; Horwath, C.C.; Conner, T.S. Many apples a day keep the blues away-daily experiences of negative and positive affect and food consumption in young adults. Br. J. Health Psychol. 2013, 18, 782–798. [Google Scholar] [CrossRef]
- De Piero, A.; Bassett, N.; Rossi, A.; Sammán, N. Tendencia en el consumo de alimentos de estudiantes universitarios. Nutr. Hosp. 2015, 31, 1824–1831. [Google Scholar] [PubMed]
- Ramsay, S.A.; Rudley, M.; Tonnemaker, L.E.; Price, W.J. A Comparison of College Students’ Reported Fruit and Vegetable Liking and Intake from Childhood to Adulthood. J. Am. Coll. Nutr. 2017, 36, 28–37. [Google Scholar] [CrossRef]
- Cansian, A.C.C.; Gollino, L.; Alves, J.B.d.O.; Pereira, E.M.S. Avaliação da ingestão de frutas e hortaliças entre estudantes universitários. J. Braz. Soc. Food Nutr. 2012, 37, 54–63. [Google Scholar] [CrossRef]
- Conner, T.S.; Thompson, L.M.; Knight, R.L.; Flett, J.A.; Richardson, A.C.; Brookie, K.L. The Role of Personality Traits in Young Adult Fruit and Vegetable Consumption. Front. Psychol. 2017, 8, 119. [Google Scholar] [CrossRef] [Green Version]
- El Hamid Hussein, R.A. Can knowledge alone predict vegetable and fruit consumption among adolescents? A transtheoretical model perspective. J. Egypt Public Health Assoc. 2011, 86, 95–103. [Google Scholar] [CrossRef]
- Khalid, U.; Nosheen, F.; Raza, M.A.; Ishaque, M.; Ahmad, M.; Rashid, S.; Rubab, F. A Comparative Study about the Daily Intake of Fruits and Vegetables among Female Students of Two Universities of Faisalabad. Pak. J. Nutr. 2011, 10, 684–689. [Google Scholar] [CrossRef] [Green Version]
- Lesani, A.; Mohammadpoorasl, A.; Javadi, M.; Esfeh, J.M.; Fakhari, A. Eating breakfast, fruit and vegetable intake and their relation with happiness in college students. Eat Weight Disord. 2016, 21, 645–651. [Google Scholar] [CrossRef] [PubMed]
- Lim, R.B.T.; Tham, D.K.T.; Muller-Riemenschneider, F.; Wong, M.L. Are University Students in Singapore Meeting the International and National Recommended Daily Servings of Fruits and Vegetables? Asia Pac. J. Public Health 2017, 29, 199–210. [Google Scholar] [CrossRef] [PubMed]
- Muñiz-Mendoza, P.; Cabrera-Pivaral, C.; Orozco-Valerio, M.; Báez-Báez, L.; Méndez-Magaña, A. Hábitos e ingesta alimentaria de frutas y verduras en estudiantes de educación superior. Rev. Chil. Nutr. 2018, 45, 258–262. [Google Scholar] [CrossRef]
- Poscia, A.; Teleman, A.A.; Azzolini, E.; de Waure, C.; Maged, D.; Virdis, A.; Ricciardi, W.; Di Pietro, M.L. Eating episode frequency and fruit and vegetable consumption among Italian university students. Ann. IST Super Sanita 2017, 53, 199–204. [Google Scholar] [CrossRef] [PubMed]
- Juríková, T.; Viczayová, I.; Mlček, J.; Sochor, J.; Balla, Š.; Baroň, M. Fruit and Vegetable Intake Among College Students in Nitra—Comparative Study. Potravin. Slovak J. Food Sci. 2016, 10, 475–480. [Google Scholar]
- Ramalho, A.A.; Dalamaria, T.; Souza, O.F.d. Consumo regular de frutas e hortaliças por estudantes universitários em Rio Branco, Acre, Brasil: Prevalência e fatores associados. Cad. Saúde Públ. 2012, 28, 1405–1413. [Google Scholar] [CrossRef]
- Odum, M.; Xu, L. Racial and sex differences of fruit and vegetable self-efficacy and intake among college students in a rural, southern location. J. Am. Coll. Health J. ACH 2018, 1–10. [Google Scholar] [CrossRef]
- Van den Bogerd, N.; Maas, J.; Seidell, J.C.; Dijkstra, S.C. Fruit and vegetable intakes, associated characteristics and perceptions of current and future availability in Dutch university students. Public Health Nutr. 2018, 1–9. [Google Scholar] [CrossRef]
- Menozzi, D.; Sogari, G.; Mora, C. Understanding and modelling vegetables consumption among young adults. LWT Food Sci. Technol. 2017, 85, 327–333. [Google Scholar] [CrossRef]
- Teschl, C.; Nössler, C.; Schneider, M.; Carlsohn, A.; Lührmann, P. Vegetable consumption among university students: Relationship between vegetable intake, knowledge of recommended vegetable servings and self-assessed achievement of vegetable intake recommendations. Health Educ. J. 2018, 77, 398–411. [Google Scholar] [CrossRef]
- Fujii, H.; Nakano, T.; Muto, T.; Aikawa, K. Skipping Breakfast is Associated with Poor Vegetable Intake Among College Students in Japan. Dokkyo J. Med. Sci. 2010, 37, 47–54. [Google Scholar]
- Evagelou, E.; Vlachou, E.; Polikandrioti, M.; Koutelekos, I.; Dousis, E.; Kyritsi, E. Exploration of Nursing students’ dietary habits. Health Sci. J. 2014, 8, 452–468. [Google Scholar]
- Bagordo, F.; Grassi, T.; Serio, F.; Idolo, A.; De Donno, A. Dietary habits and health among university students living at or away from home in southern Italy. J. Food Nutr. Res. 2013, 52, 164–171. [Google Scholar]
- Hadjimbei, E.; Botsaris, G.; Gekas, V.; Panayiotou, A.G. Adherence to the Mediterranean Diet and Lifestyle Characteristics of University Students in Cyprus: A Cross-Sectional Survey. J. Nutr. Metab. 2016, 2016, 2742841. [Google Scholar] [CrossRef] [PubMed]
- Pérez-Gallardo, L.; Mingo Gómez, T.; Bayona Marzo, I.; Ferrer Pascual, M.á.; Márquez Calle, E.; Ramírez Domínguez, R.; Navas Ferrer, C.; Navas Cámara, F. Calidad de la dieta en estudiantes universitarios con distinto perfil académico. Nutr. Hosp. 2015, 31, 2230–2239. [Google Scholar] [PubMed]
- Strawson, C.; Bell, R.; Downs, S.; Farmer, A.; Olstad, D.; Willows, N. Dietary patterns of female university students with nutrition education. Can. J. Diet. Pract. Res. 2013, 74, 138–142. [Google Scholar] [CrossRef] [PubMed]
- Azadbakht, L.; Esmaillzadeh, A. Dietary energy density is favorably associated with dietary diversity score among female university students in Isfahan. Nutrition 2012, 28, 991–995. [Google Scholar] [CrossRef]
- Azadbakht, L.; Haghighatdoost, F.; Feizi, A.; Esmaillzadeh, A. Breakfast eating pattern and its association with dietary quality indices and anthropometric measurements in young women in Isfahan. Nutrition 2013, 29, 420–425. [Google Scholar] [CrossRef]
- El Ansari, W.; Adetunji, H.; Oskrochi, R. Food and mental health: Relationship between food and perceived stress and depressive symptoms among university students in the United Kingdom. Cent. Eur. J. Public Health 2014, 22, 90–97. [Google Scholar] [CrossRef]
- El Ansari, W.; Stock, C.; Mikolajczyk, R.T. Relationships between food consumption and living arrangements among university students in four European countries - A cross-sectional study. Nutr. J. 2012, 11, 28. [Google Scholar] [CrossRef] [PubMed]
- El Ansari, W.; Suominen, S.; Berg-Beckhoff, G. Is Healthier Nutrition Behaviour Associated with Better Self-Reported Health and Less Health Complaints? Evidence from Turku, Finland. Nutrients 2015, 7, 8478–8490. [Google Scholar] [CrossRef] [PubMed] [Green Version]
- El Ansari, W.; Suominen, S.; Berg-Beckhoff, G. Mood and food at the University of Turku in Finland: Nutritional correlates of perceived stress are most pronounced among overweight students. Int. J. Public Health 2015, 60, 707–716. [Google Scholar] [CrossRef] [PubMed]
- El Ansari, W.; Suominen, S.; Samara, A. Eating Habits and Dietary Intake: Is Adherence to Dietary Guidelines Associated with Importance of Healthy Eating among Undergraduate University Students in Finland? Cent. Eur. J. Public Health 2015, 23, 306–313. [Google Scholar] [CrossRef] [PubMed] [Green Version]
- Becerra-Bulla, F.; Pinzón-Villate, G.; Vargas-Zárate, M. Food practices of a group of college students and the perceived difficulties for healthy eating. Rev. Fac. Med. 2015, 63, 457–463. [Google Scholar]
- Daniuseviciute-Brazaite, L.; Abromaitiene, L. Evaluation of students’ dietary behaviours depending on gender. Prog. Nutr. 2018, 20, 21–29. [Google Scholar]
- Doostan, F.; Mohseni-Takalloo, S.; Nosrati, M. Assessment of the dietary pattern of dormitory students in Kerman, Iran. J. Pak. Med. Assoc. 2016, 66, 1054–1059. [Google Scholar] [PubMed]
- Gresse, A.; Steenkamp, L.; Pietersen, J. Eating, drinking and physical activity in Faculty of Health Science students compared to other students at a South African university. S. Afr. J. Clin. Nutr. 2015, 28, 154–159. [Google Scholar] [CrossRef]
- Kresic, G.; Kendel Jovanovic, G.; Pavicic Zezel, S.; Cvijanovic, O.; Ivezic, G. The effect of nutrition knowledge on dietary intake among Croatian university students. Coll. Antropol. 2009, 33, 1047–1056. [Google Scholar]
- Lupi, S.; Bagordo, F.; Stefanati, A.; Grassi, T.; Piccinni, L.; Bergamini, M.; De Donno, A. Assessment of lifestyle and eating habits among undergraduate students in northern Italy. Ann. IST Super Sanita 2015, 51, 154–161. [Google Scholar] [CrossRef]
- Muñoz de Mier, G.; Lozano Estevan, M.d.C.; Romero Magdalena, C.S.; Pérez de Diego, J.; Veiga Herreros, P. Evaluación del consumo de alimentos de una población de estudiantes universitarios y su relación con el perfil académico. Nutr. Hosp. 2017, 34, 134–143. [Google Scholar] [CrossRef] [PubMed]
- Mushonga, N.G.T.; Chagwena, D.; Benhura, C.; Nyanga, L.K. An assessment of the nutritional status of University of Zimbabwe students. Pak. J. Nutr. 2013, 12, 30–33. [Google Scholar] [CrossRef]
- Perez, P.M.P.; Castro, I.R.R.d.; Franco, A.d.S.; Bandoni, D.H.; Wolkoff, D.B. Práticas alimentares de estudantes cotistas e não cotistas de uma universidade pública brasileira. Ciênc. Saúde Colet. 2016, 21, 531–542. [Google Scholar] [CrossRef] [PubMed]
- Schnettler, B.; Miranda, H.; Lobos, G.; Orellana, L.; Sepulveda, J.; Denegri, M.; Etchebarne, S.; Mora, M.; Grunert, K.G. Eating habits and subjective well-being. A typology of students in Chilean state universities. Appetite 2015, 89, 203–214. [Google Scholar] [CrossRef] [PubMed]
- Stroebele-Benschop, N.; Dieze, A.; Hilzendegen, C. Students’ adherence to dietary recommendations and their food consumption habits. Nutr. Health 2018, 24, 75–81. [Google Scholar] [CrossRef] [PubMed]
- Van den Berg, V.L.; Okeyo, A.P.; Dannhauser, A.; Nel, M. Body weight, eating practices and nutritional knowledge amongst university nursing students, Eastern Cape, South Africa. Afr. J. Prim. Health Care Fam. Med. 2012, 4, 323. [Google Scholar] [CrossRef]
- Viljoen, A.T.; Spuy, E.v.d.; Rand, G.E.d. Food consumption, lifestyle patterns, and body mass index of a group of white South African students. Int. J. Consum. Stud. 2018, 42, 533–546. [Google Scholar] [CrossRef]
- Hakim, N.H.A.; Muniandy, N.D.; Danish, A. Nutritional Status and Eating Practices among University Students in Selected Universities in Selangor, Malaysia. Asian J. Clin. Nutr. 2012, 4, 77–87. [Google Scholar] [CrossRef] [Green Version]
- Murakami, K.; Sasaki, S.; Okubo, H. Characteristics of Under- and Over-Reporters of Energy Intake among Young Japanese Women. J. Nutr. Sci. Vitaminol. 2012, 58, 253–262. [Google Scholar] [CrossRef] [Green Version]
- Sato-Mito, N.; Sasaki, S.; Murakami, K.; Okubo, H.; Takahashi, Y.; Shibata, S.; Yamada, K.; Sato, K. The midpoint of sleep is associated with dietary intake and dietary behavior among young Japanese women. Sleep Med. 2011, 12, 289–294. [Google Scholar] [CrossRef]
- Al-Rethaiaa, A.S.; Fahmy, A.E.; Al-Shwaiyat, N.M. Obesity and eating habits among college students in Saudi Arabia: A cross sectional study. Nutr. J. 2010, 9, 39. [Google Scholar] [CrossRef] [PubMed]
- Anandhasayanam, A.; Jimshad, M.I.; Kannan, S.; Johnson, J.S.; Chander, U. Perception of Paramedical Students in a Teaching Institute on BMI, Diet and Social Habits—A Cross Sectional Survey. Int. J. Pharm. Pharm. Sci. 2015, 2015, 226–231. [Google Scholar]
- Crovetto, M.; Valladares, M.; Espinoza, V.; Mena, F.; Onate, G.; Fernandez, M.; Duran-Aguero, S. Effect of healthy and unhealthy habits on obesity: A multicentric study. Nutrition 2018, 54, 7–11. [Google Scholar] [CrossRef] [PubMed]
- Durán, A.S.; Valdés, B.P.; Godoy, C.A.; Herrera, V.T. Hábitos alimentarios y condición física en estudiantes de pedagogía en educación física. Rev. Chil. Nutr. 2014, 41, 251–259. [Google Scholar] [CrossRef]
- Durán Agüero, S.; Fernández Godoy, E.; Fuentes Fuentes, J.; Hidalgo Fernández, A.; Quintana Muñoz, C.; Yunge Hidalgo, W.; Fehrmann Rosas, P.; Delgado Sánchez, C. Patrones alimentarios asociados a un peso corporal saludable en estudiantes chilenos de la carrera de nutrición y dietética. Nutr. Hosp. 2015, 32, 1780–1785. [Google Scholar] [PubMed]
- Durán-Agüero, S.; Fernández-Godoy, E.; Fehrmann-Rosas, P.; Delgado-Sánchez, C.; Quintana-Muñoz, C.; Yunge-Hidalgo, W.; Hidalgo-Fernández, A.; Fuentes-Fuentes, J. Menos horas de sueño asociado con sobrepeso y obesidad en estudiantes de nutrición de una universidad chilena. Rev. Peruana Med. Exp. Salud Publica 2016, 33, 264–268. [Google Scholar] [CrossRef]
- Feitosa, E.P.S.; Dantas, C.A.d.O.; Andrade-Wartha, E.R.S.; Marcellini, P.S.; Mendes-Netto, R.S. Hábitos Alimentares de Estudantes de uma Universidade Pública no Nordeste, Brasil. Alim. Nutr. 2010, 21, 225–230. [Google Scholar]
- Greene, G.W.; Schembre, S.M.; White, A.A.; Hoerr, S.L.; Lohse, B.; Shoff, S.; Horacek, T.; Riebe, D.; Patterson, J.; Phillips, B.W.; et al. Identifying clusters of college students at elevated health risk based on eating and exercise behaviors and psychosocial determinants of body weight. J. Am. Diet. Assoc. 2011, 111, 394–400. [Google Scholar] [CrossRef]
- Hilger, J.; Loerbroks, A.; Diehl, K. Eating behaviour of university students in Germany: Dietary intake, barriers to healthy eating and changes in eating behaviour since the time of matriculation. Appetite 2017, 109, 100–107. [Google Scholar] [CrossRef]
- Ilow, R.A.; Regulska-Ilow, B.; Rozanska, D. Dietary habits of Wroclaw Medical University students (Poland). Rocz. Panstw. Zakl. Hig. 2017, 68, 23–32. [Google Scholar]
- Khan, M.; Aimi Mohamad, N.; Abdul Hameed, M.; Ismail, N. Eating Habits and Body Weight Profiles Among Undergraduate Students in UiTM Puncak Alam, Selangor, Malaysia; IEEE Colloquium on Humanities, Science and Engineering Research: Selangor, Malaysia, 2011. [Google Scholar]
- Kowalcze, K.; Turyk, Z.; Drywien, M. Nutrition of students from dietetics profile education in the Siedlce University of Natural Sciences and Humanities compared with students from other academic centres. Rocz. Panstw. Zakl. Hig. 2016, 67, 51–58. [Google Scholar] [PubMed]
- Likus, W.; Milka, D.; Bajor, G.; Jachacz-Lopata, M.; Dorzak, B. Dietary habits and physical activity in students from the Medical University of Silesia in Poland. Rocz. Panstw. Zakl. Hig. 2013, 64, 317–324. [Google Scholar] [PubMed]
- Perusse-Lachance, E.; Tremblay, A.; Drapeau, V. Lifestyle factors and other health measures in a Canadian university community. Appl. Physiol. Nutr. Metab. 2010, 35, 498–506. [Google Scholar] [CrossRef] [PubMed]
- Sharma, B.; Harker, M.; Harker, D.; Reinhard, K. Living independently and the impact on young adult eating behaviour in Germany. Br. Food J. 2009, 111, 436–451. [Google Scholar] [CrossRef]
- De Sousa, T.F.; Fonseca, S.A.; Barbosa, A.R. Regular and negative self-rated health in students from a public university from Northeastern, Brazil: Prevalence and associated factors. Acta Sci. 2014, 36, 185–194. [Google Scholar]
- De Sousa, T.F.; José, H.P.M.; Barbosa, A.R. Condutas negativas à saúde em estudantes universitários brasileiros. Ciênc. Saúde Colet. 2013, 18, 3563–3575. [Google Scholar] [CrossRef]
- Chen Yun, T.; Rohaiza Ahmad, S.; Koh Soo Quee, D. Dietary Habits and Lifestyle Practices among University Students in Universiti Brunei Darussalam. Malays. J. Med. Sci. 2018, 25, 56–66. [Google Scholar] [CrossRef]
- Teleman, A.A.; de Waure, C.; Soffiani, V.; Poscia, A.; Di Pietro, M.L. Nutritional habits in Italian university students. Ann. IST Super Sanita 2015, 51, 99–105. [Google Scholar] [CrossRef]
- Yahia, N.; Wang, D.; Rapley, M.; Dey, R. Assessment of weight status, dietary habits and beliefs, physical activity, and nutritional knowledge among university students. Perspect. Public Health 2016, 136, 231–244. [Google Scholar] [CrossRef]
- Abdel-Megeid, F.Y.; Abdelkarem, H.M.; El-Fetouh, A.M. Unhealthy nutritional habits in university students are a risk factor for cardiovascular diseases. Saudi Med. J. 2011, 32, 621–627. [Google Scholar]
- McArthur, L.H.; Pawlak, R. An Exploratory study of compliance with dietary recommendations among college students majoring in health-related disciplines: Application of the transtheoretical model. Nutr. Res. Pract. 2011, 5, 578–584. [Google Scholar] [CrossRef] [PubMed]
- Nola, I.A.; Jelinic, J.D.; Matanic, D.; Pucarin-Cvetkovic, J.; Bergman Markovic, B.; Senta, A. Differences in eating and lifestyle habits between first- and sixth-year medical students from Zagreb. Coll. Antropol. 2010, 34, 1289–1294. [Google Scholar] [PubMed]
- Oliveira, G.A.; Oliveira, S.H.V.; Morais, C.A.S.; Lima, L.M. Hábitos alimentares e risco de doenças cardiovasculares em universitários. Medicina 2014, 47, 399–405. [Google Scholar] [CrossRef]
- Larson, N.; Neumark-Sztainer, D.; Laska, M.N.; Story, M. Young Adults and Eating Away from Home: Associations with Dietary Intake Patterns and Weight Status Differ by Choice of Restaurant. J. Am. Diet. Assoc. 2011, 111, 1696–1703. [Google Scholar] [CrossRef] [PubMed] [Green Version]
- Mirabitur, E.; Peterson, K.E.; Rathz, C.; Matlen, S.; Kasper, N. Predictors of college-student food security and fruit and vegetable intake differ by housing type. J. Am. Coll. Health J. ACH 2016, 64, 555–564. [Google Scholar] [CrossRef] [PubMed]
- Roark, R.A.; Niederhauser, V.P. Fruit and vegetable intake: Issues with definition and measurement. Public Health Nutr. 2013, 16, 2–7. [Google Scholar] [CrossRef]
- Monteiro, C.A.; Cannon, G.; Levy, R.B.; Moubarac, J.C.; Louzada, M.L.; Rauber, F.; Khandpur, N.; Cediel, G.; Neri, D.; Martinez-Steele, E.; et al. Ultra-processed foods: What they are and how to identify them. Public Health Nutr. 2019, 22, 936–941. [Google Scholar] [CrossRef]
- Vandevijvere, S.; Jaacks, L.M.; Monteiro, C.A.; Moubarac, J.C.; Girling-Butcher, M.; Lee, A.C.; Pan, A.; Bentham, J.; Swinburn, B. Global trends in ultraprocessed food and drink product sales and their association with adult body mass index trajectories. Obes. Rev. Off. J. Int. Assoc. Stud. Obes. 2019. [Google Scholar] [CrossRef]
- Srour, B.; Fezeu, L.K.; Kesse-Guyot, E.; Alles, B.; Mejean, C.; Andrianasolo, R.M.; Chazelas, E.; Deschasaux, M.; Hercberg, S.; Galan, P.; et al. Ultra-processed food intake and risk of cardiovascular disease: Prospective cohort study (NutriNet-Sante). BMJ 2019, 365, l1451. [Google Scholar] [CrossRef]
- Monteiro, C.A.; Cannon, G.; Moubarac, J.C.; Levy, R.B.; Louzada, M.L.C.; Jaime, P.C. The UN Decade of Nutrition, the NOVA food classification and the trouble with ultra-processing. Public Health Nutr. 2018, 21, 5–17. [Google Scholar] [CrossRef]
- Baranski, M.; Srednicka-Tober, D.; Volakakis, N.; Seal, C.; Sanderson, R.; Stewart, G.B.; Benbrook, C.; Biavati, B.; Markellou, E.; Giotis, C.; et al. Higher antioxidant and lower cadmium concentrations and lower incidence of pesticide residues in organically grown crops: A systematic literature review and meta-analyses. Br. J. Nutr. 2014, 112, 794–811. [Google Scholar] [CrossRef] [PubMed]
- Schneider, M.K.; Luscher, G.; Jeanneret, P.; Arndorfer, M.; Ammari, Y.; Bailey, D.; Balazs, K.; Baldi, A.; Choisis, J.P.; Dennis, P.; et al. Gains to species diversity in organically farmed fields are not propagated at the farm level. Nat. Commun. 2014, 5, 4151. [Google Scholar] [CrossRef] [PubMed]
- Janssen, M. Determinants of organic food purchases: Evidence from household panel data. Food Qual. Prefer. 2018, 68, 19–28. [Google Scholar] [CrossRef]
- Sofi, F.; Abbate, R.; Gensini, G.F.; Casini, A. Accruing evidence on benefits of adherence to the Mediterranean diet on health an updated systematic review and meta-analysis. Am. J. Clin. Nutr. 2010, 92, 1189–1196. [Google Scholar] [CrossRef] [PubMed]
- Kliemann, N.; Kraemer, M.V.S.; Scapin, T.; Rodrigues, V.M.; Fernandes, A.C.; Bernardo, G.L.; Uggioni, P.L.; Proenca, R.P.C. Serving Size and Nutrition Labelling: Implications for Nutrition Information and Nutrition Claims on Packaged Foods. Nutrients 2018, 10, 891. [Google Scholar] [CrossRef] [PubMed]
- Gibney, M.J.; Barr, S.I.; Bellisle, F.; Drewnowski, A.; Fagt, S.; Livingstone, B.; Masset, G.; Moreiras, G.V.; Moreno, L.A.; Smith, J.; et al. Breakfast in Human Nutrition: The International Breakfast Research Initiative. Nutrients 2018, 10, 559. [Google Scholar] [CrossRef] [PubMed]
- St-Onge, M.P.; Ard, J.; Baskin, M.L.; Chiuve, S.E.; Johnson, H.M.; Kris-Etherton, P.; Varady, K. Meal Timing and Frequency: Implications for Cardiovascular Disease Prevention: A Scientific Statement From the American Heart Association. Circulation 2017, 135, E96–E121. [Google Scholar] [CrossRef] [PubMed]
- Lee, Y.; Mozaffarian, D.; Sy, S.; Huang, Y.; Liu, J.; Wilde, P.E.; Abrahams-Gessel, S.; Jardim, T.S.V.; Gaziano, T.A.; Micha, R. Cost-effectiveness of financial incentives for improving diet and health through Medicare and Medicaid: A microsimulation study. PLoS Med. 2019, 16, e1002761. [Google Scholar] [CrossRef] [PubMed]
- Castro, M.A.; Garcez, M.R.; Pereira, J.L.; Fisberg, R.M. Eating behaviours and dietary intake associations with self-reported sleep duration of free-living Brazilian adults. Appetite 2019, 137, 207–217. [Google Scholar] [CrossRef] [PubMed]
- Corbalan-Tutau, M.D.; Madrid, J.A.; Garaulet, M. Timing and duration of sleep and meals in obese and normal weight women. Association with increase blood pressure. Appetite 2012, 59, 9–16. [Google Scholar] [CrossRef] [PubMed]
- Tuck, N.J.; Farrow, C.; Thomas, J.M. Assessing the effects of vegetable consumption on the psychological health of healthy adults: A systematic review of prospective research. Am. J. Clin. Nutr. 2019. [Google Scholar] [CrossRef] [PubMed]
- Aceijas, C.; Waldhausl, S.; Lambert, N.; Cassar, S.; Bello-Corassa, R. Determinants of health-related lifestyles among university students. Perspect. Public Health 2017, 137, 227–236. [Google Scholar] [CrossRef] [PubMed]
- Pelletier, J.E.; Laska, M.N.; Neumark-Sztainer, D.; Story, M. Positive attitudes toward organic, local, and sustainable foods are associated with higher dietary quality among young adults. J. Acad. Nutr. Diet. 2013, 113, 127–132. [Google Scholar] [CrossRef]
- Alles, B.; Peneau, S.; Kesse-Guyot, E.; Baudry, J.; Hercberg, S.; Mejean, C. Food choice motives including sustainability during purchasing are associated with a healthy dietary pattern in French adults. Nutr. J. 2017, 16, 58. [Google Scholar] [CrossRef] [PubMed]
- Reicks, M.; Kocher, M.; Reeder, J. Impact of Cooking and Home Food Preparation Interventions Among Adults: A Systematic Review (2011–2016). J. Nutr. Educ. Behav. 2018, 50, 148–172. [Google Scholar] [CrossRef] [PubMed]
- Bernardo, G.L.; Jomori, M.M.; Fernandes, A.C.; Colussi, C.F.; Condrasky, M.D.; Proenca, R.P.D. Positive impact of a cooking skills intervention among Brazilian university students: Six months follow-up of a randomized controlled trial. Appetite 2018, 130, 247–255. [Google Scholar] [CrossRef]


| Authors (Country, Year) | Study Design | Sample | Female (%) | Age Range | Mean Age | Assessment Instruments | Definition of Vegetables | Category of Results | Frequency (%) | Factors Associated with Increased Intake (p < 0.05) | ||||||
|---|---|---|---|---|---|---|---|---|---|---|---|---|---|---|---|---|
| >1 Day a | Daily b | 5–6 Times Per Week c | 3–4 Times Per Week d | 1–2 Times Per Week e | Rarely f | Never g | ||||||||||
| El Ansari et al. [47] (Finland, 2015) | Cross-sectional | 1189 | 70.6 | - | 21.0 | FFQ | Salad and raw vegetables, cooked vegetables | Moderate adherence to dietary guidelines (>50%) | 17.6 | 50.9 | 26.8 | 4.6 | 0.2 | Importance given for eating healthy | ||
| Low adherence to dietary guidelines (<50%) | 5.2 | 23.4 | 43.1 | 24.1 | 4.1 | |||||||||||
| El Ansari et al. [45] (Finland, 2015) | Cross-sectional | 1189 | 70.6 | - | 21.0 | FFQ | Salad and raw vegetables | Male | 57.3 | - | - | - | - | - | ||
| Female | 72.4 | - | - | - | - | |||||||||||
| Kowalcze et al. [75] (Poland, 2016) | Cross-sectional | 100 | 100.0 | - | - | Questionnaire | Vegetables | General | 65.0 | 22.0 | - | - | 13.0 | - | ||
| Hadjimbei et al. [38] (Cyprus, 2016) | Cross-sectional | 193 | 54.9 | 18 to 25 | 20.6 | Questionnaire | Fresh and cooked vegetables | General | (29.5) | 56.5 | - | - | - | - | - | |
| Daniuseviciute-Brazaite & Abromaitiene [49] (Lithuania, 2018) | Cross-sectional | 500 | 67.8 | - | 23.2 | FFQ | Salad and raw vegetables, cooked vegetables | Cooked | 5.0 | 60.0 | 40.0 | 20.0 | 0 | Females | ||
| Raw and salad | 5.0 | 40.0 | 40.0 | 10.0 | 5.0 | |||||||||||
| Ramsay et al. [20] (United States, 2017) | Retrospective survey | 676 | 63.0 | 18 to 25 | 20.8 | Questionnaire | Vegetables | General | 15.0 | 30.0 | 29.0 | 21.0 | 4.0 | 1.0 | - | |
| Teleman et al. [82] (Italy, 2015) | Cross-sectional | 8516 | 67.0 | 18 to 30 | 22.2 | Questionnaire | Vegetables | General | 22.5 | 19.6 | 16.0 | 28.5 * | 9.5 | - | 3.9 | - |
| Schnettler et al. [57] (Chile, 2015) | Cross-sectional | 369 | 53.7 | - | 20.9 | FFQ | Vegetables | General | 47.0 | 36.0 * | 9.0 | 6.0 | 2.0 | - | ||
| Khan et al. [74] (Malaysia, 2011) | Cross-sectional | 460 | 52.8 | - | 21.6 | Questionnaire | Vegetables | General | 46.1 | - | 29.6 | 20.7 | - | 3.7 | - | |
| Male | 57.5 | - | - | - | - | - | ||||||||||
| Female | 42.5 | - | - | - | - | - | ||||||||||
| Hakim et al. [61] (Malaysia, 2012) | Cross-sectional | 200 | 55.0 | 18 to 26 | 20.0 | 24-h recall | Vegetables | Male | 43.3 | 45.6 | 4.4 | 4.4 | 2.2 | - | ||
| Female | 41.8 | 44.5 | 4.5 | 3.6 | 5.5 | |||||||||||
| Likus et al. [76] (Poland, 2013) | Cross-sectional | 239 | 84.0 | - | 20.0 | Questionnaire | Vegetables | General | - | - | - | - | - | - | ||
| Male | 30.0 | 42.5 | 17.5 | 7.5 | 2.5 | |||||||||||
| Female | 36.7 | 31.6 | 21.2 | 4.5 | 6.0 | |||||||||||
| Evagelou et al. [36] (Greece, 2014) | Cross-sectional | 435 | 83.4 | - | - | Questionnaire | Vegetables | General | 39.2 | 12.8 | 24.4 | 16.7 | 4.5 | - | Females | |
| Becerra-Bulla et al. [48] (Colombia, 2015) | Cross-sectional | 45 | 77.2 | 18 to 30 | - | FFQ | Vegetables without tubers, roots and bananas | General | 33.3 | 42.2 * | 15.6 | - | - | - | ||
| Mushonga et al. [55] (Zimbabwe, 2013) | Cross-sectional | 84 | 56.0 | - | 22.2 | FFQ | Vegetables | General | 14.3 | 9.5 | 17.9 | 2.4 | - | |||
| Sousa et al. [79] (Brazil, 2014) | Cross-sectional | 1232 | 54.7 | 17 to 52 | 23.5 | Questionnaire | Vegetables | General | 43.1 (≥5 days) | 56.9 (≤4 days) | Regular health self-rate | |||||
| van den Berg et al. [59] (South Africa, 2012) | Cross-sectional | 161 | 68.3 | 18 to 42 | 24.9 | FFQ + three 24-h recalls | Vegetables | General | 12.4 | - | - | 85.4 | 2.5 | - | ||
| Durán-Agüero et al. [67] (Chile, 2014) | Cross-sectional | 239 | 23.5 | 18 to 31 | 21.5 | Questionnaire | Vegetables | General | 21.8 | - | - | - | - | - | - | |
| Male | 10.2 | - | - | - | 83.8 | 6.0 | ||||||||||
| Female | 17.5 | - | - | - | 80.8 | 1.7 | ||||||||||
| Ramalho et al. [30] (Brazil, 2012) | Cross-sectional | 863 | 61.8 | Grouped as ≤20 to ≥31 | - | Questionnaire | Vegetables | General | 40.0 | - | - | - | - | - | ||
| Male | 32.7 | - | - | - | - | |||||||||||
| Female | 44.6 | - | - | - | - | |||||||||||
| Abdel- Megeid et al. [84] (Saudi Arabia, 2011) | Cross-sectional | 312 | 57.7 | - | 21.1 | Questionnaire + 3 days food records | Vegetables | Male | 29.6 | - | 30.3 | 30.3 | 9.8 | - | Lower BMI and lower blood pressure (both genders) | |
| Female | 23.9 | - | 29.2 | 30.3 | 16.6 | - | ||||||||||
| Hilger et al. [72] (Germany, 2017) | Cross-sectional | 689 | 69.5 | - | 22.7 | Data from the Nutrition and Physical Activity Study | Salad and raw vegetables, cooked vegetables | Cooked | 3.2 | 50.0 | - | - | - | - | Years of university | |
| Raw and salad | 3.6 | 40.0 | - | 38.0 | - | - | - | |||||||||
| El Ansari et al. [43] (England, Wales, Northern Ireland, 2014) | Cross-sectional | 3706 | 72.8 | - | - | FFQ | Salad and raw vegetables, cooked vegetables | Cooked vegetables | 3.4 ** | Less perceived stress and depressive symptoms scores (both genders) | ||||||
| Salad and raw vegetables | 3.6 ** | |||||||||||||||
| Cansian et al. [21] (Brazil, 2012) | Cross-sectional | 122 | 94.0 | - | 21.0 | FFQ | Sautéed leafy greens, leafy greens, vegetables | Sautéed leafy greens | - | - | 38.7 | 9.2 | 25.2 | - | ||
| Leafy greens | 51.2 | - | 33.1 | 1.7 | 7.4 | |||||||||||
| Nonleafy cooked | 15.0 | - | 38.4 | - | 15.0 | |||||||||||
| Nonleafy raw | 14.3 | 31.1 | - | 36.0 | - | 3.4 | ||||||||||
| Viljoen et al. [60] (South Africa, 2018) | Cross-sectional | 488 | 44.6 | 18 to 24+ | FFQ | Green vegetables 1, Yellow vegetables 2, Other vegetables 3, Salads 4 | Green vegetables | 24.6 | 48.5 | 12.7 | 7.3 | 6.9 | - | |||
| Yellow vegetables | 18.1 | 46.8 | 19.2 | 10.0 | 5.8 | |||||||||||
| Other vegetables | 21.7 | 57.1 | 15.0 | 4.2 | 2.1 | |||||||||||
| Salads | 21.5 | 49.6 | 14.0 | 8.6 | 6.3 | |||||||||||
| Oliveira et al. [87] (Brazil, 2014) | Cross-sectional | 97 | 53.6 | 18 to 25 | - | FFQ | Vegetables, greens | Vegetables | 33.0 | - | - | - | - | - | ||
| Greens | 22.0 | - | - | - | - | |||||||||||
| Perez et al. [56] (Brazil, 2016) | Cross-sectional | 1336 | 56.4 | 18 to 24 | - | FFQ | Raw vegetables, cooked vegetables | Vegetables | 21.2 | 41.7 | - | - | - | 11.4 | Non-quota students | |
| Raw and salad | 11.5 | 25.0 | - | - | - | 28.4 | ||||||||||
| Cooked | 9.5 | 20.8 | - | - | - | 25.5 | ||||||||||
| Quota students | 39.2 | - | - | - | - | |||||||||||
| Nonquota students | 43.3 | - | - | - | - | |||||||||||
| El Ansari et al. [44] (Germany, Denmark, Poland, Bulgaria, 2012) | Cross-sectional | 2402 | 61.5 | 20 to 23 (70–80%) | - | FFQ | Raw and cooked vegetables | Germany | 25.9 | - | - | - | - | Living at family home with parents | ||
| Denmark | 19.3 | - | - | - | - | |||||||||||
| Poland | 15.2 | - | - | - | - | |||||||||||
| Bulgaria | 31.6 | - | - | - | - | |||||||||||
| Khalid et al. [24] (Pakistan, 2011) | Cross-sectional | 80 | 100.0 | - | - | Questionnaire | Vegetables | College A | 50 | 32.5 | - | - | - | - | ||
| College B | 25 | 55.0 | - | - | - | |||||||||||
| Juríková et al. [29] (Slovakia, 2016) | Cross-sectional | 242 | 82.6 | 19 to 22 | - | Questionnaire | Fresh vegetables | Journalism | 22.2 | 22.2 | - | 33.3 | 11.1 | 11.1 | - | |
| Regional Tourism in Slovakian | 40.3 | 26.4 | - | 26.4 | 6.9 | 0 | ||||||||||
| Regional Tourism in Hungarian | 20.0 | 35.6 | - | 37.8 | 4.4 | 2.2 | ||||||||||
| Education in Slovakian | 18.0 | 37.0 | - | 38.0 | 5.0 | 2.0 | ||||||||||
| Education in Hungarian | 21.9 | 50.0 | - | 21.9 | 6.3 | 0 | ||||||||||
| Chen et al. [81] (Malaysia, 2018) | Cross-sectional | 303 | 72.6 | - | 20.0 | Questionnaire | Vegetables | General | 23.4 | 42.9 | - | 33.7 | - | - | ||
| Obese | 24.1 | 42.1 | - | 33.8 | - | |||||||||||
| Non-obese | 21.8 | 44.8 | - | 33.3 | - | |||||||||||
| Al-Rethaiaa et al. [64] (Saudi Arabia, 2010) | Cross-sectional | 357 | 0.0 | 18 to 24 | 20.4 | Questionnaire | Green, red or yellow coloured vegetables | General | 11.2 | - | 24.4 | 32.2 | 32.2 | - | - | |
| Authors | Study Design | Sample | Female (%) | Age Range | Mean Age | Assessment Instruments | Definition of Vegetables | Measure | Frequency | Factors Associated with Increased Intake (p < 0.05) |
|---|---|---|---|---|---|---|---|---|---|---|
| Anandhasayanam et al. [65] (India, 2015) | Cross-sectional | 232 | 55.6 | 18 to 31 | - | Questionnaire | Vegetables | <1 serving/day | 5.17%, | |
| 1 serving/day | 43.97%, | |||||||||
| 2 servings/day | 32.76%, | |||||||||
| 3 servings/day | 15.95%, | |||||||||
| >3 servings/day | 2.16% | |||||||||
| Crovetto et al. [66] (Chile, 2018) | Cross-sectional | 1454 | 77.9 | - | - | Questionnaire | Vegetables | Do not consume | 3.3%. | Consuming two or more servings/day of vegetables was protective for overweight/obesity |
| <1 portion/day | 16.1%. | |||||||||
| 1–2 portion/day | 16.8%. | |||||||||
| 1 portion/day | 35.8%. | |||||||||
| 2 portions/day | 27.7% | |||||||||
| Lesani et al. [25] (Iran, 2016) | Cross-sectional | 541 | 75.4 | - | 24.1 | Questionnaire | Fresh or canned or juice | <1 serving/day | 22.7% | Measure of happiness was positively associated with the amount of vegetable consumption |
| 1 serving/day | 51.6% | |||||||||
| 2–3 servings/day | 21.1%, | |||||||||
| 3 servings/day | 4.6% | |||||||||
| Durán-Agüero et al. [67] (Chile, 2014) | Cross-sectional | 239 | 23.5 | 18 to 31 | 21.5 | Questionnaire | Vegetables | 2 servings/day | 21.8% | |
| Durán-Agüero et al. [69] (Chile, 2016) | Cross-sectional | 635 | 86.4 | - | 22 | Questionnaire | Vegetables | Normal weight (2 portions/day) | 32.4% | |
| Overweight/obese (2 portions/day) | 43.9% | |||||||||
| Feitosa et al. [70] (Brazil, 2010) | Cross-sectional | 718 | 50.0 | - | - | Questionnaire | Vegetables | <5 spoons/day | 84.4% | |
| Poscia et al. [28] (Italy, 2017) | Cross-sectional | 8292 | 67.0 | 18 to 30 | 22.2 | Questionnaire | Vegetables | Males (>1 portion/day) | 12.2% | Number of meals, breakfast intake (stronger for males) |
| Females (>1 portion/day) | 27.5% | |||||||||
| Ilow et al. [73] (Poland, 2017) | Cross-sectional | 1168 | 76.4 | 23.5 | Questionnaire with 46 questions | Vegetable | Male (≥3 portions/day) | 21.0% | ||
| Female (≥3 portions/day) | 30.2% | |||||||||
| Sharma et al. [78] (Germany, 2009) | Cross-sectional | 305 | 63.3 | 18 to 24 | - | Questionnaire | Vegetables | Total (<1 serving/day) | 8.3% | Living at family home |
| Dependent | 4.8% | |||||||||
| Independent | 9.6%. | |||||||||
| Total (1 serving/day) | 23.2% | |||||||||
| Dependent | 25.3% | |||||||||
| Independent | 22.5%. | |||||||||
| Total (2 servings/day) | 32.1% | |||||||||
| Dependent | 37.3% | |||||||||
| Independent | 29.8%. | |||||||||
| Total (3 servings/day) | 36.8% | |||||||||
| Dependent | 20.5% | |||||||||
| Independent | 23.9% | |||||||||
| Total (4–5 servings/day) | 13.6% | |||||||||
| Dependent | 12.0% | |||||||||
| Independent | 14.2% | |||||||||
| Yahia et al. [83] (United States, 2016) | Cross-sectional | 237 | 73.0 | - | 20.6 | Questionnaire | Vegetables | Male (≥2 portions/day) Always | 28.0% | |
| Often | 16.0% | |||||||||
| Sometimes | 45.0% | |||||||||
| Never | 11.0% | |||||||||
| Female (≥2 portions/day) Always | 22.0% | |||||||||
| Often | 36.0%, | |||||||||
| Sometimes | 32.0%, | |||||||||
| Never | 10.0% | |||||||||
| Doostan et al. [50] (Iran, 2016) | Cross-sectional | 229 | 66.0 | - | 21.8 | FFQ | Vegetables | Categories of Healthy Eating Index: Poor (2.83 cups/day) | 8.1% | - |
| Needs improvement (2.89 cups/day) | 63.4% | |||||||||
| Good (3.18 cups/day) | 28.5% | |||||||||
| Gresse et al. [51] (South Africa, 2015) | Cross-sectional | 619 | 66.1 | - | - | FFQ | Vegetable | Health area (<1 portion/day) | 70.0% | |
| Other areas (<1 portion/day) | 64.0% | |||||||||
| El Hamid Hussein [23] (Saudi Arabia, 2011) | Cross-sectional | 205 | 100.0 | 18 to 21 | - | FFQ | Vegetable | Nutrition department students (≥3 servings/day) | 64.3% | |
| Non-nutrition department students (≥3 servings/day) | 45.5% |
| Authors | Study Design | Sample | Female (%) | Age Range | Mean Age | Assessment Instruments | Definition of Vegetables | Measure (Servings/Day) | Mean (SD) | Factors Associated with Increased Intake (p < 0.05) |
|---|---|---|---|---|---|---|---|---|---|---|
| Bagordo et al. [37] (Italy, 2013) | Cross-sectional | 193 | 77.7 | 20 to 30 | - | FFQ | Raw vegetables, cooked vegetables | Raw vegetables * | 4.8 (≅3.00) | Living at family home higher intake of cooked vegetables. Living away from home higher intake of raw vegetables |
| Cooked vegetables * | 3.0 (≅2.50) | |||||||||
| Living at home | ||||||||||
| Raw vegetables * | 4.40 (3.00) | |||||||||
| Cooked vegetables * | 3.29 (2.56) | |||||||||
| Living outside home | ||||||||||
| Raw vegetables * | 5.74 (3.52) | |||||||||
| Cooked vegetables * | 2.18 (2.05) | |||||||||
| Lupi et al. [53] (Italy, 2015) | Cross-sectional | 258 | - | 19 to 42 | 23.3 | FFQ | Salad and raw vegetables, cooked vegetables | General | Females and living at family home | |
| Raw vegetables/salads * | 4.69 (≅0.5) | |||||||||
| Cooked vegetables * | 3.10 (≅0.5) | |||||||||
| Male | ||||||||||
| Raw vegetables/salad * | 3.46 (≅2.87) | |||||||||
| Cooked vegetables * | 1.92 (2.45) | |||||||||
| Female | ||||||||||
| Raw vegetables/salads * | 5.25 (3.81) | |||||||||
| Cooked vegetables * | 3.63 (4.10) | |||||||||
| Living at home | ||||||||||
| Raw vegetables * | 5.78 (3.94) | |||||||||
| Cooked vegetables * | 3.91 (3.34) | |||||||||
| Living outside home | ||||||||||
| Raw vegetables * | 3.76 (3.08) | |||||||||
| Cooked vegetables * | 2.40 (3.95) | |||||||||
| Conner et al. [22] (New Zealand, 2017) | Cross-sectional | 1,073 | 67.9 | 18 to 25 | 20.6 | Daily diary for 21 (sample 1) or 13 days (sample 2) | Fresh, frozen, canned, or stewed vegetables. *Do not include vegetable juices or hot chips (French fries). | Sample 1 | 2.51 (1.07) | Openness to experience |
| Sample 2 | 2.76 (1.38) | |||||||||
| De Piero et al. [19] (Argentina, 2015) | Time series analysis | 329 | 75.0 | - | 23.0 | FFQ + 7-days food record | Raw and cooked vegetables (portion 150 g) | General | 0.7 (-) | - |
| 1998–1999 § | 0.5 (-) | |||||||||
| 2012–2013 § | 0.9 (-) | |||||||||
| Kresic et al. [52] (Croatia, 2009) | Cross-sectional | 1005 | 73.7 | - | 21.7 | FFQ + Questionnaire | Vegetables | Total | 2.17 (1.27) | Nutrition knowledge |
| Male | 1.67 (0.83) | |||||||||
| Female | 1.81 (1.00) | |||||||||
| Freshman | 1.63 (0.71) | |||||||||
| Juniors | 1.83 (0.97) | |||||||||
| Seniors | 1.65 (0.99) | |||||||||
| Home | 1.98 (0.93) | |||||||||
| Student restaurants | 1.80 (0.97) | |||||||||
| Self-cooking | 1.72 (0.99) | |||||||||
| Muñiz-Mendoza [27] (Chile, 2018) | Cross-sectional | 218 | 62.8 | 18 to 30 | 20.7 | FFQ + Questionnaire + 24-h recall | Vegetables (not included fruits, cereals and tubers) | Male § | 0.47 (0.85) | |
| Female § | 1.08 (1.34) | |||||||||
| <20 years | 0.82 (1.13) | |||||||||
| 20–25 years | 0.95 (1.27) | |||||||||
| >25 years | 1.33 (1.73) | |||||||||
| Lim et al. [26] (Singapore, 2017) | Cross-sectional | 884 | 49.3 | 20 to 22 | - | Questionnaire | Vegetables | General | 1.7 (-) | . |
| Menozzi et al. [33] (Italy, 2017) | Cross-sectional | 751 | 55.0 | - | 22.1 | Questionnaire | Vegetables | General | 1.8 (-) | Consumption may be intentional as well as habitual, depending on the level of habit strengths |
| Muñoz de Mier et al. [54] (Spain, 2017) | Cross-sectional | 390 | 60.0 | 18 to 25 | 21.3 | FFQ | Vegetables | General § | 1.6 | Females and normal weight |
| Pérez-Gallardo et al. [39] (Spain, 2015) | Cross-sectional | 77 | 80.0 | - | 21.0 | 7-day food record | Vegetables | General § | 0.9 (0.5) | |
| Male | 1.0 (0.6) | |||||||||
| Female | 0.9 (0.5) | |||||||||
| Pérusse-Lachance et al. [77] (Canada, 2010) | Cross-sectional | 2490 | 76.0 | - | 24.1 | Questionnaire | Raw or cooked or canned or frozen | General | 2.5 (1.6) | |
| Strawson et al. [40] (Canada, 2013) | Cross-sectional | 36 | 100.0 | - | - | FFQ | Vegetables | General | 2.7 (1.3) | . |
| White et al. [18] (New Zealand, 2013) | Microlongitudinal (21 days) | 281 | 54.4 | 18 to 25 | 19.9 | 21 days food diary | Vegetables | General | 2.51 (-) | Greater positive affects |
| Authors | Study Design | Sample | Female (%) | Age Range | Mean Age | Assessment Instruments | Definition of Vegetables | General Results for Vegetable Consumption | Average Intake In Grams/Day (SD) | Factors Associated with Increased Intake (p < 0.05) |
|---|---|---|---|---|---|---|---|---|---|---|
| Azadbakht & Esmaillzadeh [41] (Iran, 2012) | Cross-sectional | 289 | 100.0 | 18 to 28 | - | FFQ | Vegetables | General | 263.0 | Lower dietary energy density |
| Azadbakht et al. [42] (Iran, 2013) | Cross-sectional | 411 | 100.0 | 18 to 28 | - | FFQ | Vegetables | Breakfast eaters | 185.0 | Breakfast consumption |
| Breakfast skippers | 133.0 | |||||||||
| Fujii et al. [35] (Japan, 2010) | Cross-sectional | 125 | 54.4 | 18 to 21 | 19.2 | Diet history | Vegetables | General | 217.5 (156.6) | |
| 20.8% | ≥350.0 | |||||||||
| Murakami et al. [62] (Japan, 2012) | Cross-sectional | 3956 | 100.0 | 18 to 20 | - | Diet history | Vegetables | General | 126.7 (75.5) | |
| Nola et al. [86] (Croatia, 2010) | Cross-sectional | 441 | 70.0 | 19 to 26 | - | FFQ | Vegetables | 1st year | 80.0 (47.3) | |
| 6th year | 129.0 (47.4) | |||||||||
| Sato-Mito et al. [63] (Japan, 2011) | Cross-sectional | 3304 | 100.0 | 18 to 20 | - | Self-administered diet history questionnaire | Coloured vegetables or other vegetables or mushrooms or sea vegetables | General | 121.6 (71.6) | Early midpoint of sleep |
| Midpoint of sleep quintile 1st | 126.7 (3.1) | |||||||||
| 2nd | 127.5 (2.6) | |||||||||
| 3rd | 121.9 (2.8) | |||||||||
| 4th | 121.3 (2.6) | |||||||||
| 5th | 109.8 (2.93) | |||||||||
| Teschl et al. [34] (Germany, 2018) | Cross-sectional | 365 | 86.0 | 17 to 53 | - | FFQ | Cooked and raw vegetables | Male | 179.0 (153) | |
| Female | 176.0 (165) | |||||||||
| van der Bogerd et al. [32] (The Netherlands, 2018) | Cross-sectional | 717 | 63.7 | <22> | - | FFQ | Vegetable side dishes or salads | General | 126.2 | Adherence to the vegetable guideline was met by 6%–8% of the students |
| Authors | Study Design | Sample | Female (%) | Age Range | Mean Age | Assessment Instruments | Definition of Vegetables | Guidelines | Categories | Meeting the Recommendations (%) | Factors Associated with Increased Intake (p < 0.05) | ||
|---|---|---|---|---|---|---|---|---|---|---|---|---|---|
| General | Male | Female | |||||||||||
| El Ansari et al. [47] (Finland, 2015) | Cross-sectional | 1189 | 70.6 | - | 21.0 | FFQ | Salad and raw vegetables, cooked vegetables | WHO dietary guidelines (daily or several times a day) | Salad/raw vegetables | 68.4 | 57.6 | 72.9 | Females and Importance given for eating healthy |
| Cooked vegetables | 28.6 | 19.8 | 32.3 | ||||||||||
| El Ansari et al. [46] (Finland, 2015) | Cross-sectional | 1189 | 70.6 | - | 21.0 | FFQ | Salad and raw vegetables, cooked vegetables | WHO dietary guidelines (daily or several times a day) | Salad/raw vegetables | - | 57.2 | 72.9 | Females and Less stress |
| Cooked vegetables | - | 19.8 | 32.6 | ||||||||||
| Becerra-Bulla et al. [48] (Colombia, 2015) | Cross-sectional | 45 | 77.2 | 18 to 30 | - | FFQ | Vegetables without tubers, roots and bananas | Colombian Food Guidelines (5 servings/day) | 24.5 | - | - | - | |
| Strawson et al. [40] (Canada, 2013) | Cross-sectional | 36 | 100.0 | - | - | FFQ | - | Traditional Healthy Mediterranean Diet Pyramid (≥4 servings/day) | 19.0 | ||||
| Muñoz de Mier et al. [54] (Spain, 2017) | Cross-sectional | 390 | 60.0 | 18 to 25 | 21.3 | FFQ | - | Food Diamond—Spanish Guidelines (≥3 servings/day) | 21.0 | 12.7 | 31.8 | Females and normal weight | |
| Stroebele-Benschop et al. [58] (Germany, 2018) | Cross-sectional | 103 | 75.7 | 18 to 30 | 24.3 | FFQ | Raw or cooked vegetables or salad | German Nutrition Society (≥3 servings/day) | 12.9 | 4.2 | 15.4 | - | |
| Teschl et al. [34] (Germany, 2018) | Cross-sectional | 365 | 86.0 | 17 to 53 | - | FFQ | Cooked and raw vegetables | German Nutrition Society (≥3 servings or 400g/day) | 9.8 | 7.3 | |||
| van den Berg et al. [59] (South Africa, 2012) | Cross-sectional | 161 | 68.3 | 18 to 42 | 24.9 | FFQ; three 24-h recalls | - | USDA Food Guide Pyramid (≥3 servings/day) | 2.5 | - | - | - | |
| Greene et al. [71] (United States, 2011) | Cross-sectional | 1689 | 72.4 | 18 to 19 | - | Questionnaire | - | MyPyramid (2.5 cups/day) | 12.4 | 8.9 | 14.4 | - | |
| McArthur & Pawlak [85] (United States, 2011) | Cross-sectional | 149 | 75.2 | - | 20.9 | 3-days food records | Vegetables and juice | MyPyramid (2.5 cups/day) | 7.0 | - | - | - | |
| Odum & Xu [31] (United States, 2018) | Cross-sectional | 1503 | 59.1 | 18 to 25+ | 19.1 | Questionnaire | Fresh, cooked, or frozen, as well as green salad and to not count potatoes | Dietary Guidelines for Americans (2.5 cups/day) | On average, in 3 of the past 7 days) | - | - | - | |
| Durán-Agüero et al. [68] (Chile, 2015) | Cross-sectional | 634 | 87.0 | - | 22.0 | Questionnaire | - | Chilean Food Guidelines (≥2 servings/day) | 35.4 | - | - | Adequate weight | |
| van der Kruk et al. [17] (The Netherlands, 2014) | Cross-sectional and longitudinal | 568 | 96.0 | 18 to 29 | - | 7 days food records + questionnaire | - | Netherlands Guidelines for a Healthy Diet (≥150 g/day) | First-year students | 40.0 | - | - | - |
| Fourth-year students | 74.0 | - | - | ||||||||||
| Sousa et al. [80] (Brazil. 2013) | Cross-sectional | 1084 | 55.0 | - | 23.5 | Questionnaire | - | WHO dietary guidelines—adapted (≥5 days/week) | All ages | 43.0 | 39.0 | 46.5 | Females |
| 17 to 19years | 43.5 | - | - | ||||||||||
| 20 to 21years | 35.6 | - | - | ||||||||||
| 22 to 24years | 40.3 | - | - | ||||||||||
| 25 to 52years | 53.2 | - | - | ||||||||||
© 2019 by the authors. Licensee MDPI, Basel, Switzerland. This article is an open access article distributed under the terms and conditions of the Creative Commons Attribution (CC BY) license (http://creativecommons.org/licenses/by/4.0/).
Share and Cite
Mello Rodrigues, V.; Bray, J.; Fernandes, A.C.; Luci Bernardo, G.; Hartwell, H.; Secchi Martinelli, S.; Lazzarin Uggioni, P.; Barletto Cavalli, S.; Proença, R.P.d.C. Vegetable Consumption and Factors Associated with Increased Intake among College Students: A Scoping Review of the Last 10 Years. Nutrients 2019, 11, 1634. https://doi.org/10.3390/nu11071634
Mello Rodrigues V, Bray J, Fernandes AC, Luci Bernardo G, Hartwell H, Secchi Martinelli S, Lazzarin Uggioni P, Barletto Cavalli S, Proença RPdC. Vegetable Consumption and Factors Associated with Increased Intake among College Students: A Scoping Review of the Last 10 Years. Nutrients. 2019; 11(7):1634. https://doi.org/10.3390/nu11071634
Chicago/Turabian StyleMello Rodrigues, Vanessa, Jeffery Bray, Ana Carolina Fernandes, Greyce Luci Bernardo, Heather Hartwell, Suellen Secchi Martinelli, Paula Lazzarin Uggioni, Suzi Barletto Cavalli, and Rossana Pacheco da Costa Proença. 2019. "Vegetable Consumption and Factors Associated with Increased Intake among College Students: A Scoping Review of the Last 10 Years" Nutrients 11, no. 7: 1634. https://doi.org/10.3390/nu11071634
APA StyleMello Rodrigues, V., Bray, J., Fernandes, A. C., Luci Bernardo, G., Hartwell, H., Secchi Martinelli, S., Lazzarin Uggioni, P., Barletto Cavalli, S., & Proença, R. P. d. C. (2019). Vegetable Consumption and Factors Associated with Increased Intake among College Students: A Scoping Review of the Last 10 Years. Nutrients, 11(7), 1634. https://doi.org/10.3390/nu11071634