Evidence for Toxic Advanced Glycation End-Products Generated in the Normal Rat Liver


Abstract
1. Introduction
2. Materials and Methods
2.1. Animals
2.2. Reagents and Antibodies
2.3. Animal Breeding and Experimental Design
2.4. Biochemical Analysis of Blood
2.4.1. Serum TAGE Levels
2.4.2. Parameters Other than Serum TAGE Levels
2.5. H.E. Staining of Hepatic Sections
2.6. Oil Red O Staining of Hepatic Sections
2.7. Sirius Red Staining of Hepatic Sections
2.8. Preparation of Hepatic Tissue Homogenates
2.8.1. Samples for the WB Analysis
2.8.2. Samples for the Slot Blotting (SB) Analysis
2.9. WB Analysis of Tissue Lysates
2.10. SB Analysis of Tissue Lysates
2.11. Immunostaining of Hepatic Sections with the Anti-TAGE Antibody
2.12. Preparation Medium to Incubate SD Rat Primary Hepatocytes
2.13. Cell Culture
2.14. SB Analysis of Cell Lysates
2.15. Statistical Analysis
3. Results
3.1. Intake Parameters for the Normal Diet and HFCS Beverage and Body and Liver Weights
3.2. Serum and Plasma Biochemistries in the HFCS Group
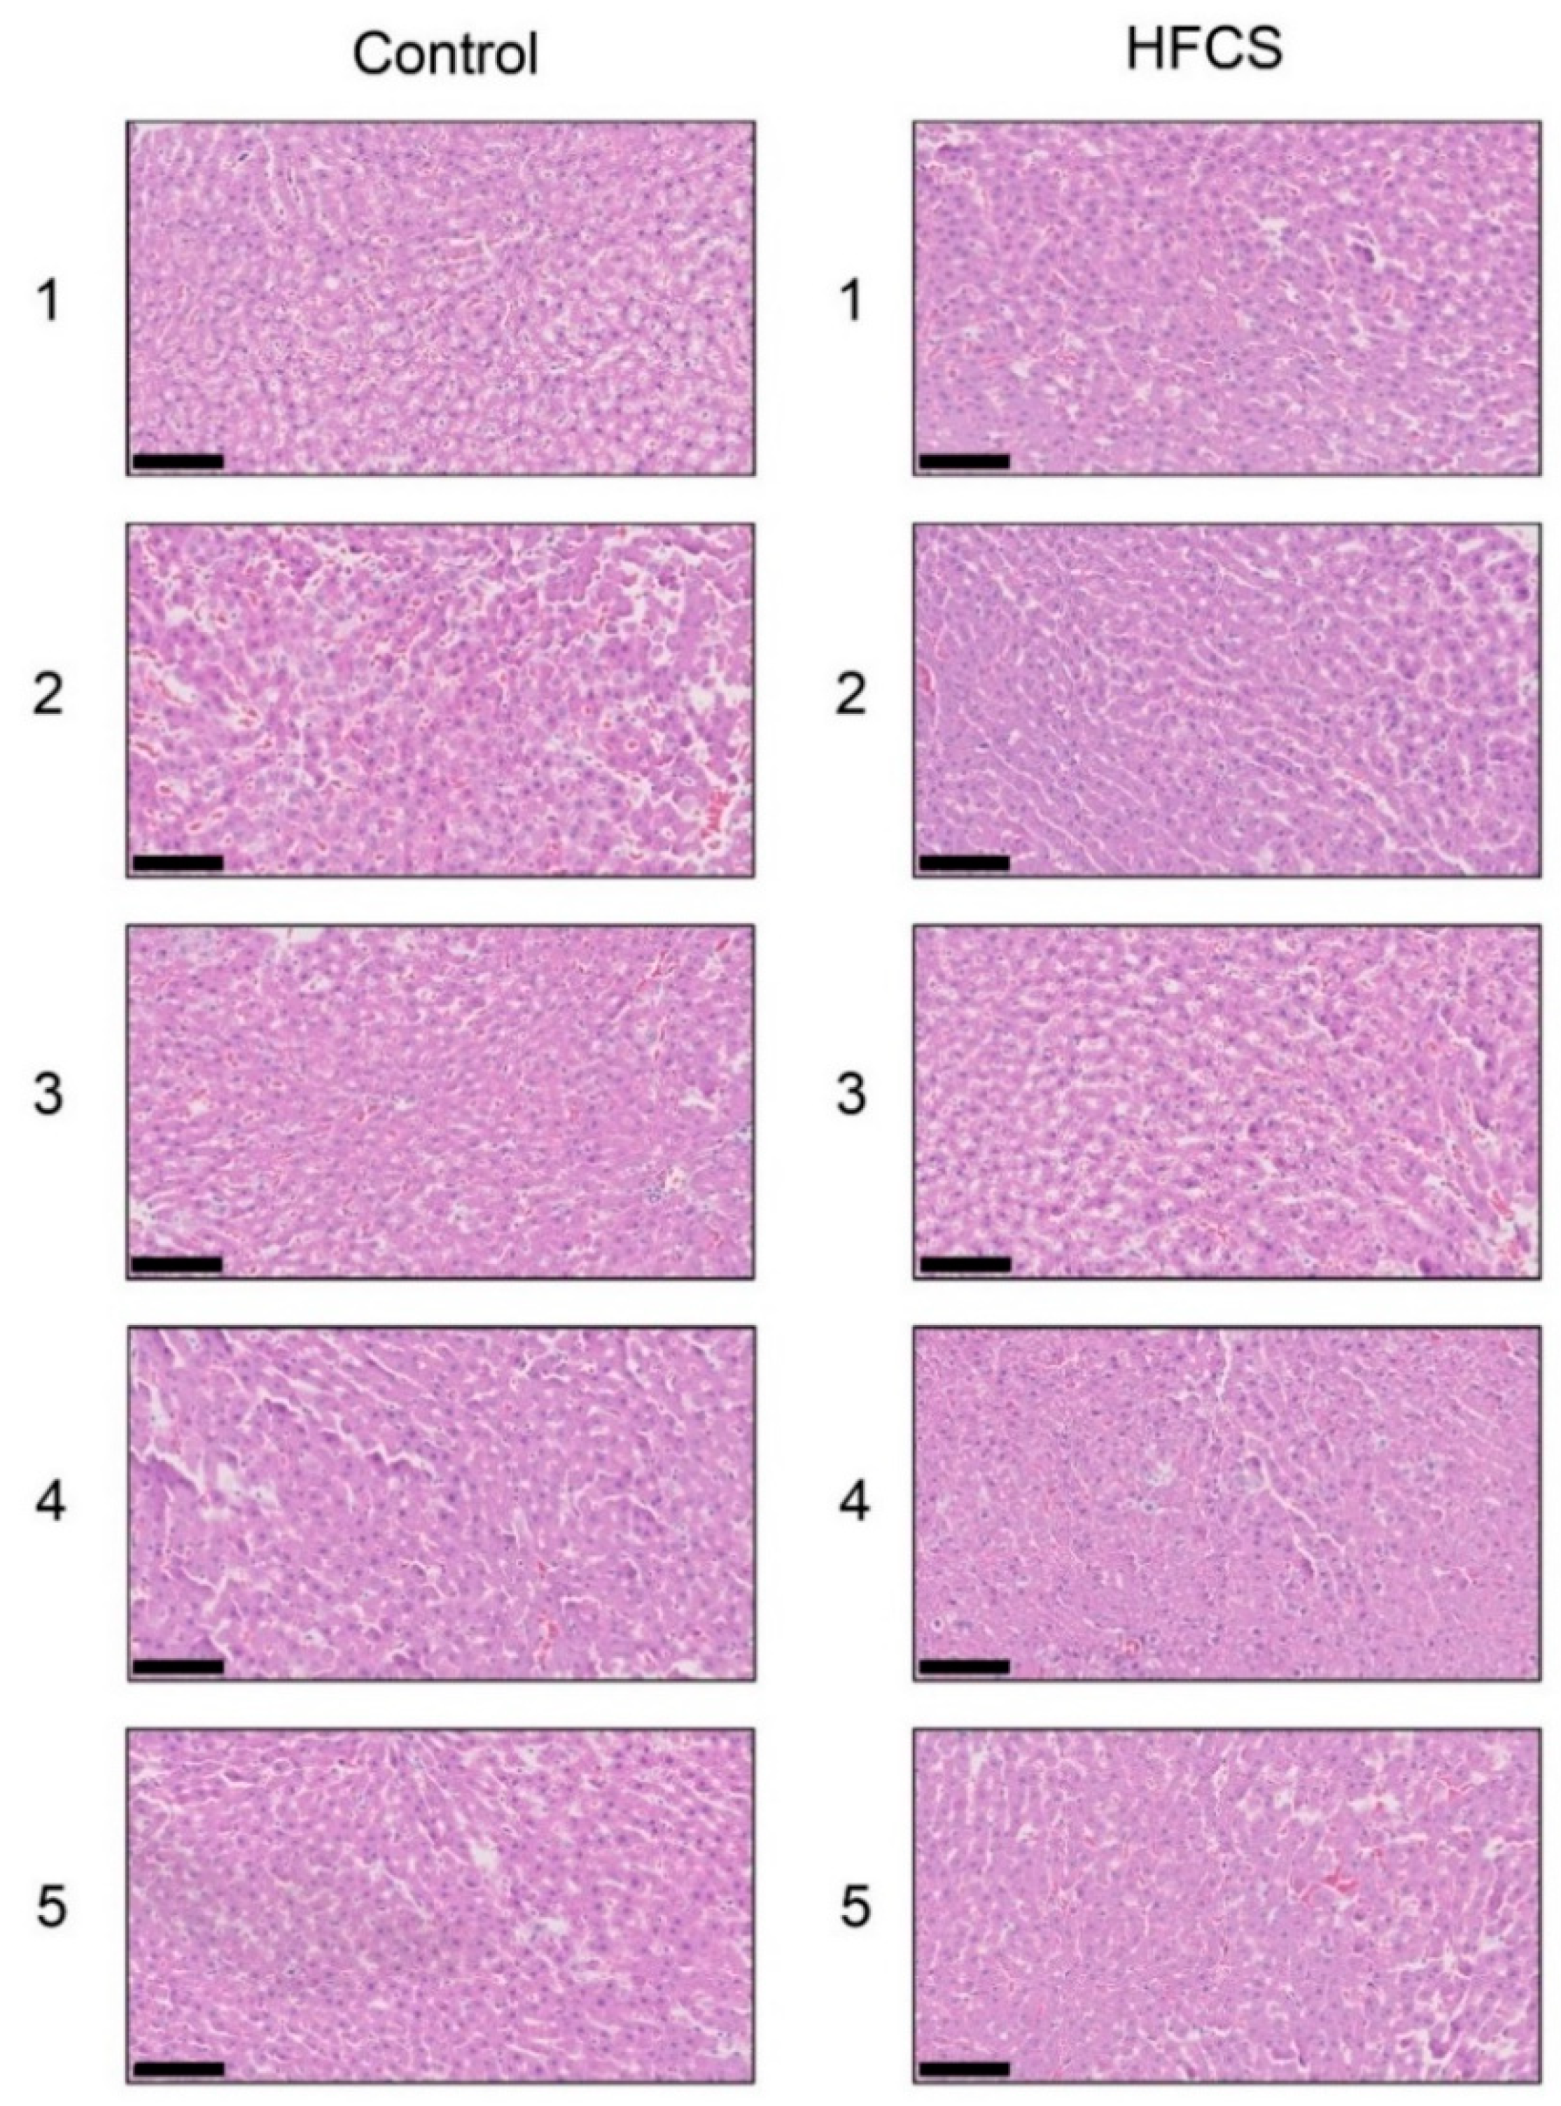
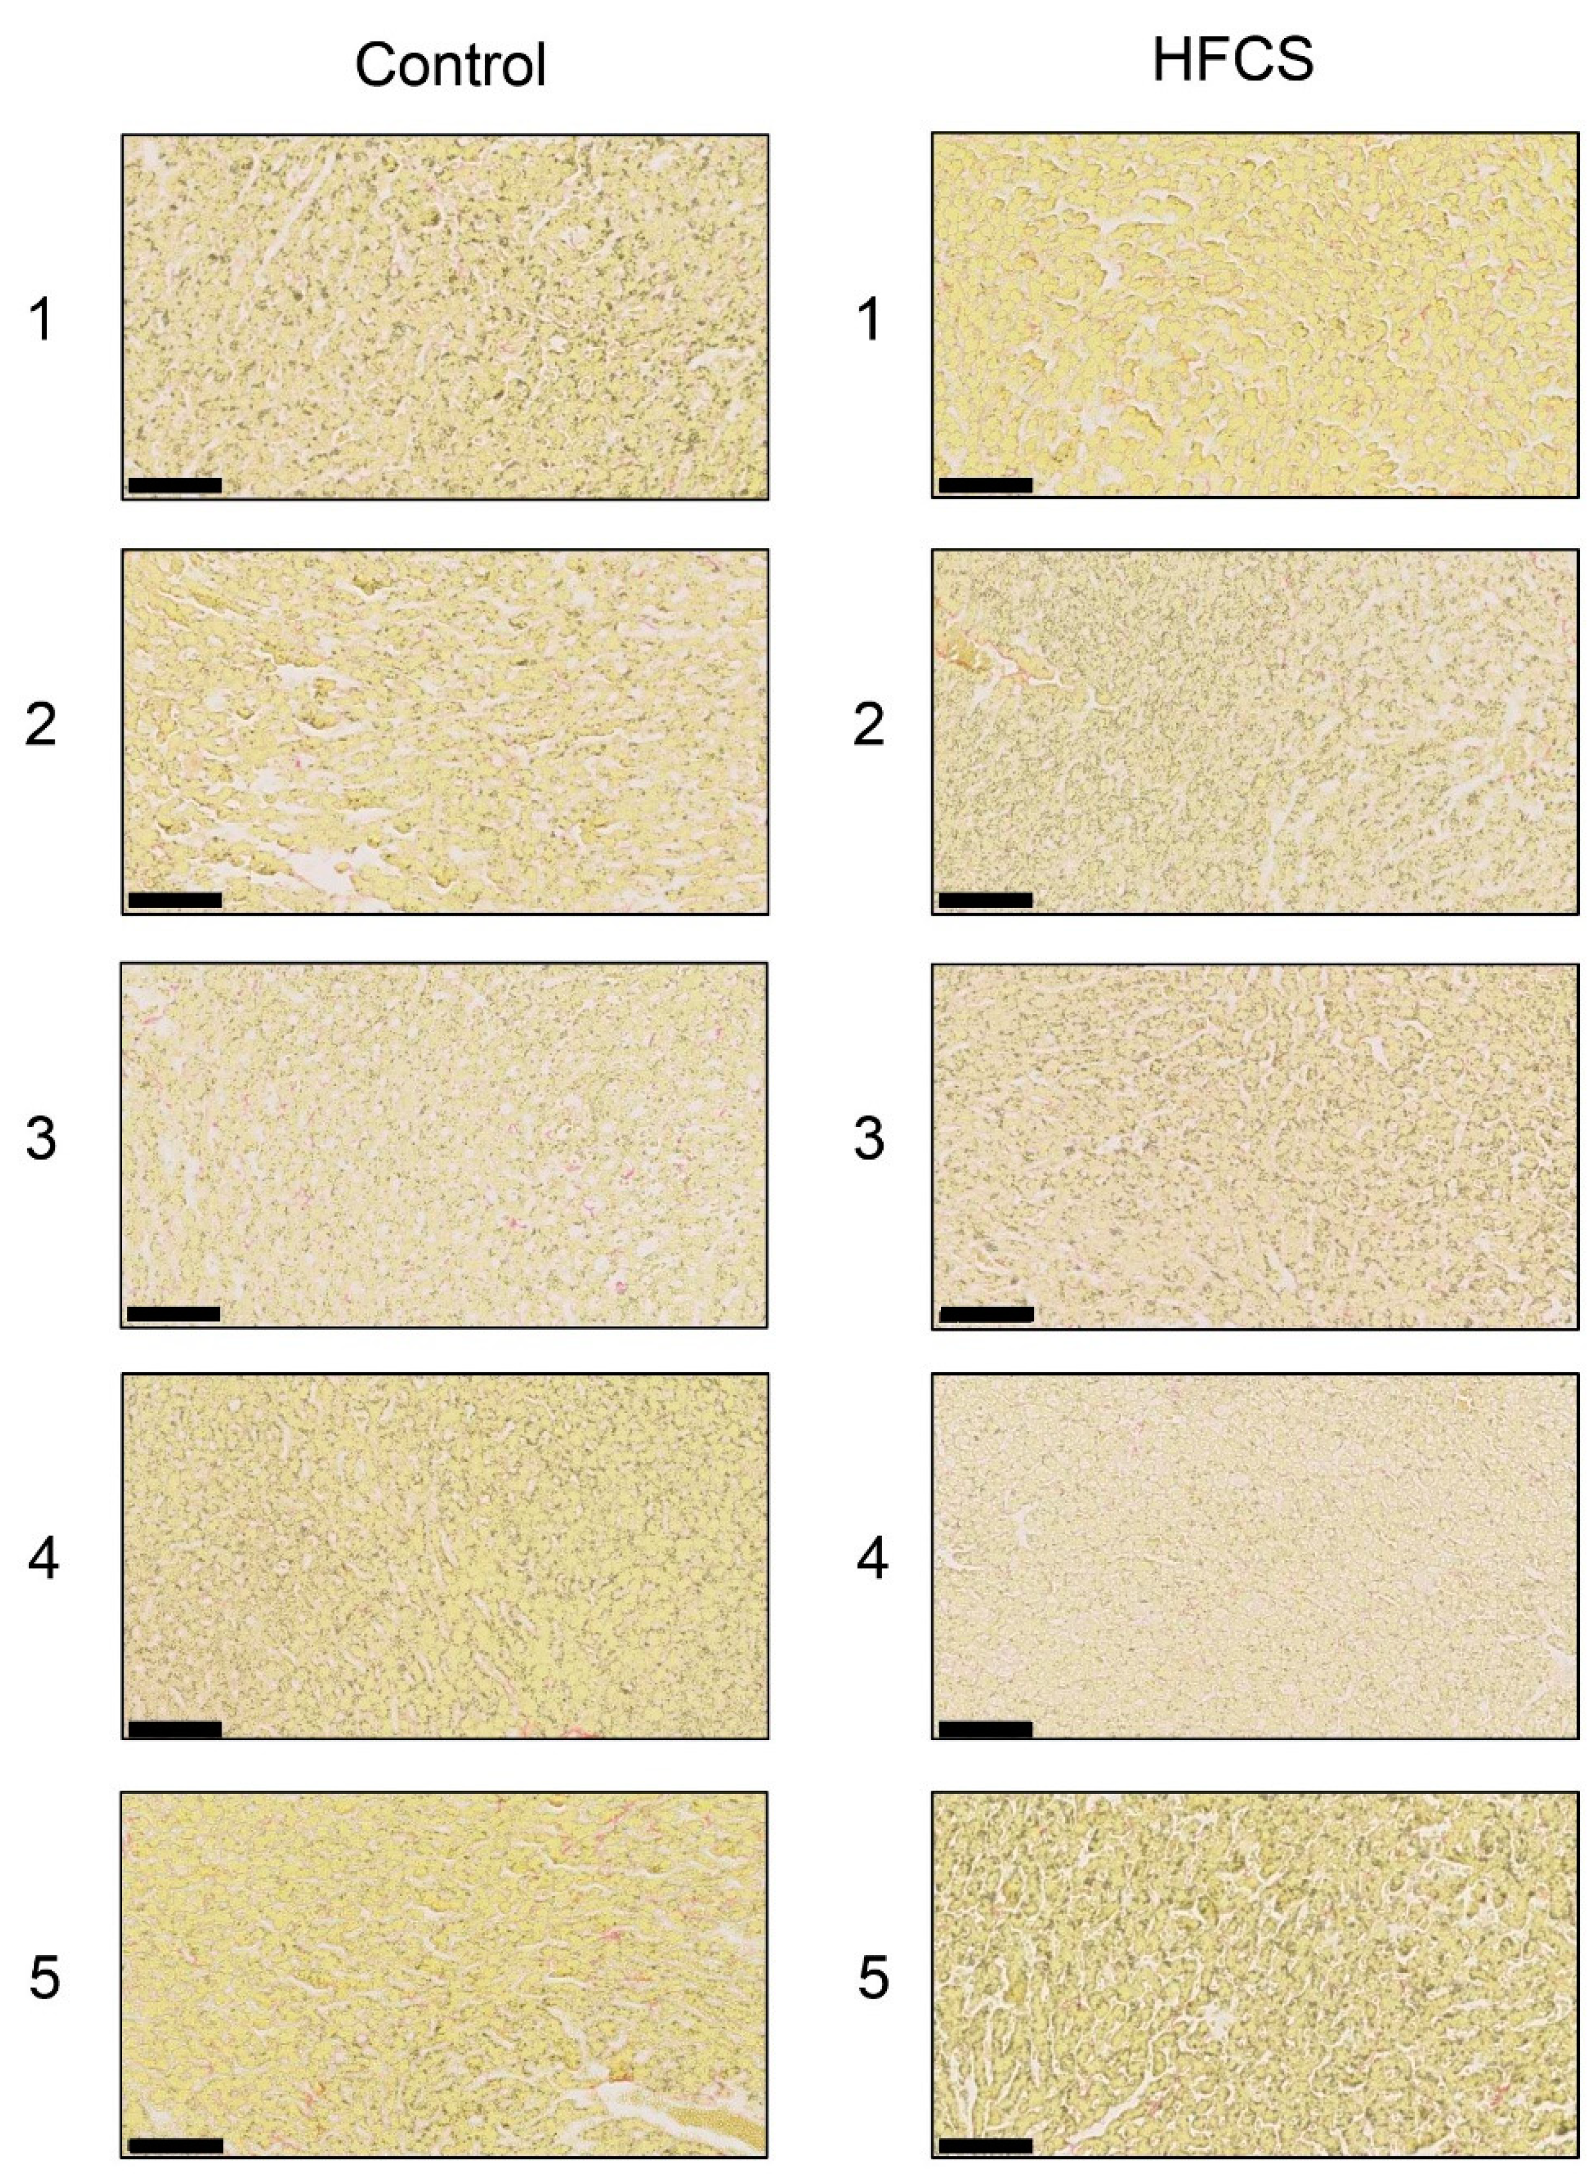
3.3. Histological Analysis of the Liver with H.E., Oil Red O, and Sirius Red Staining
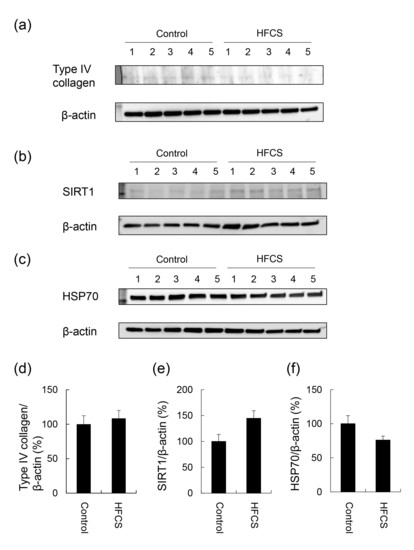
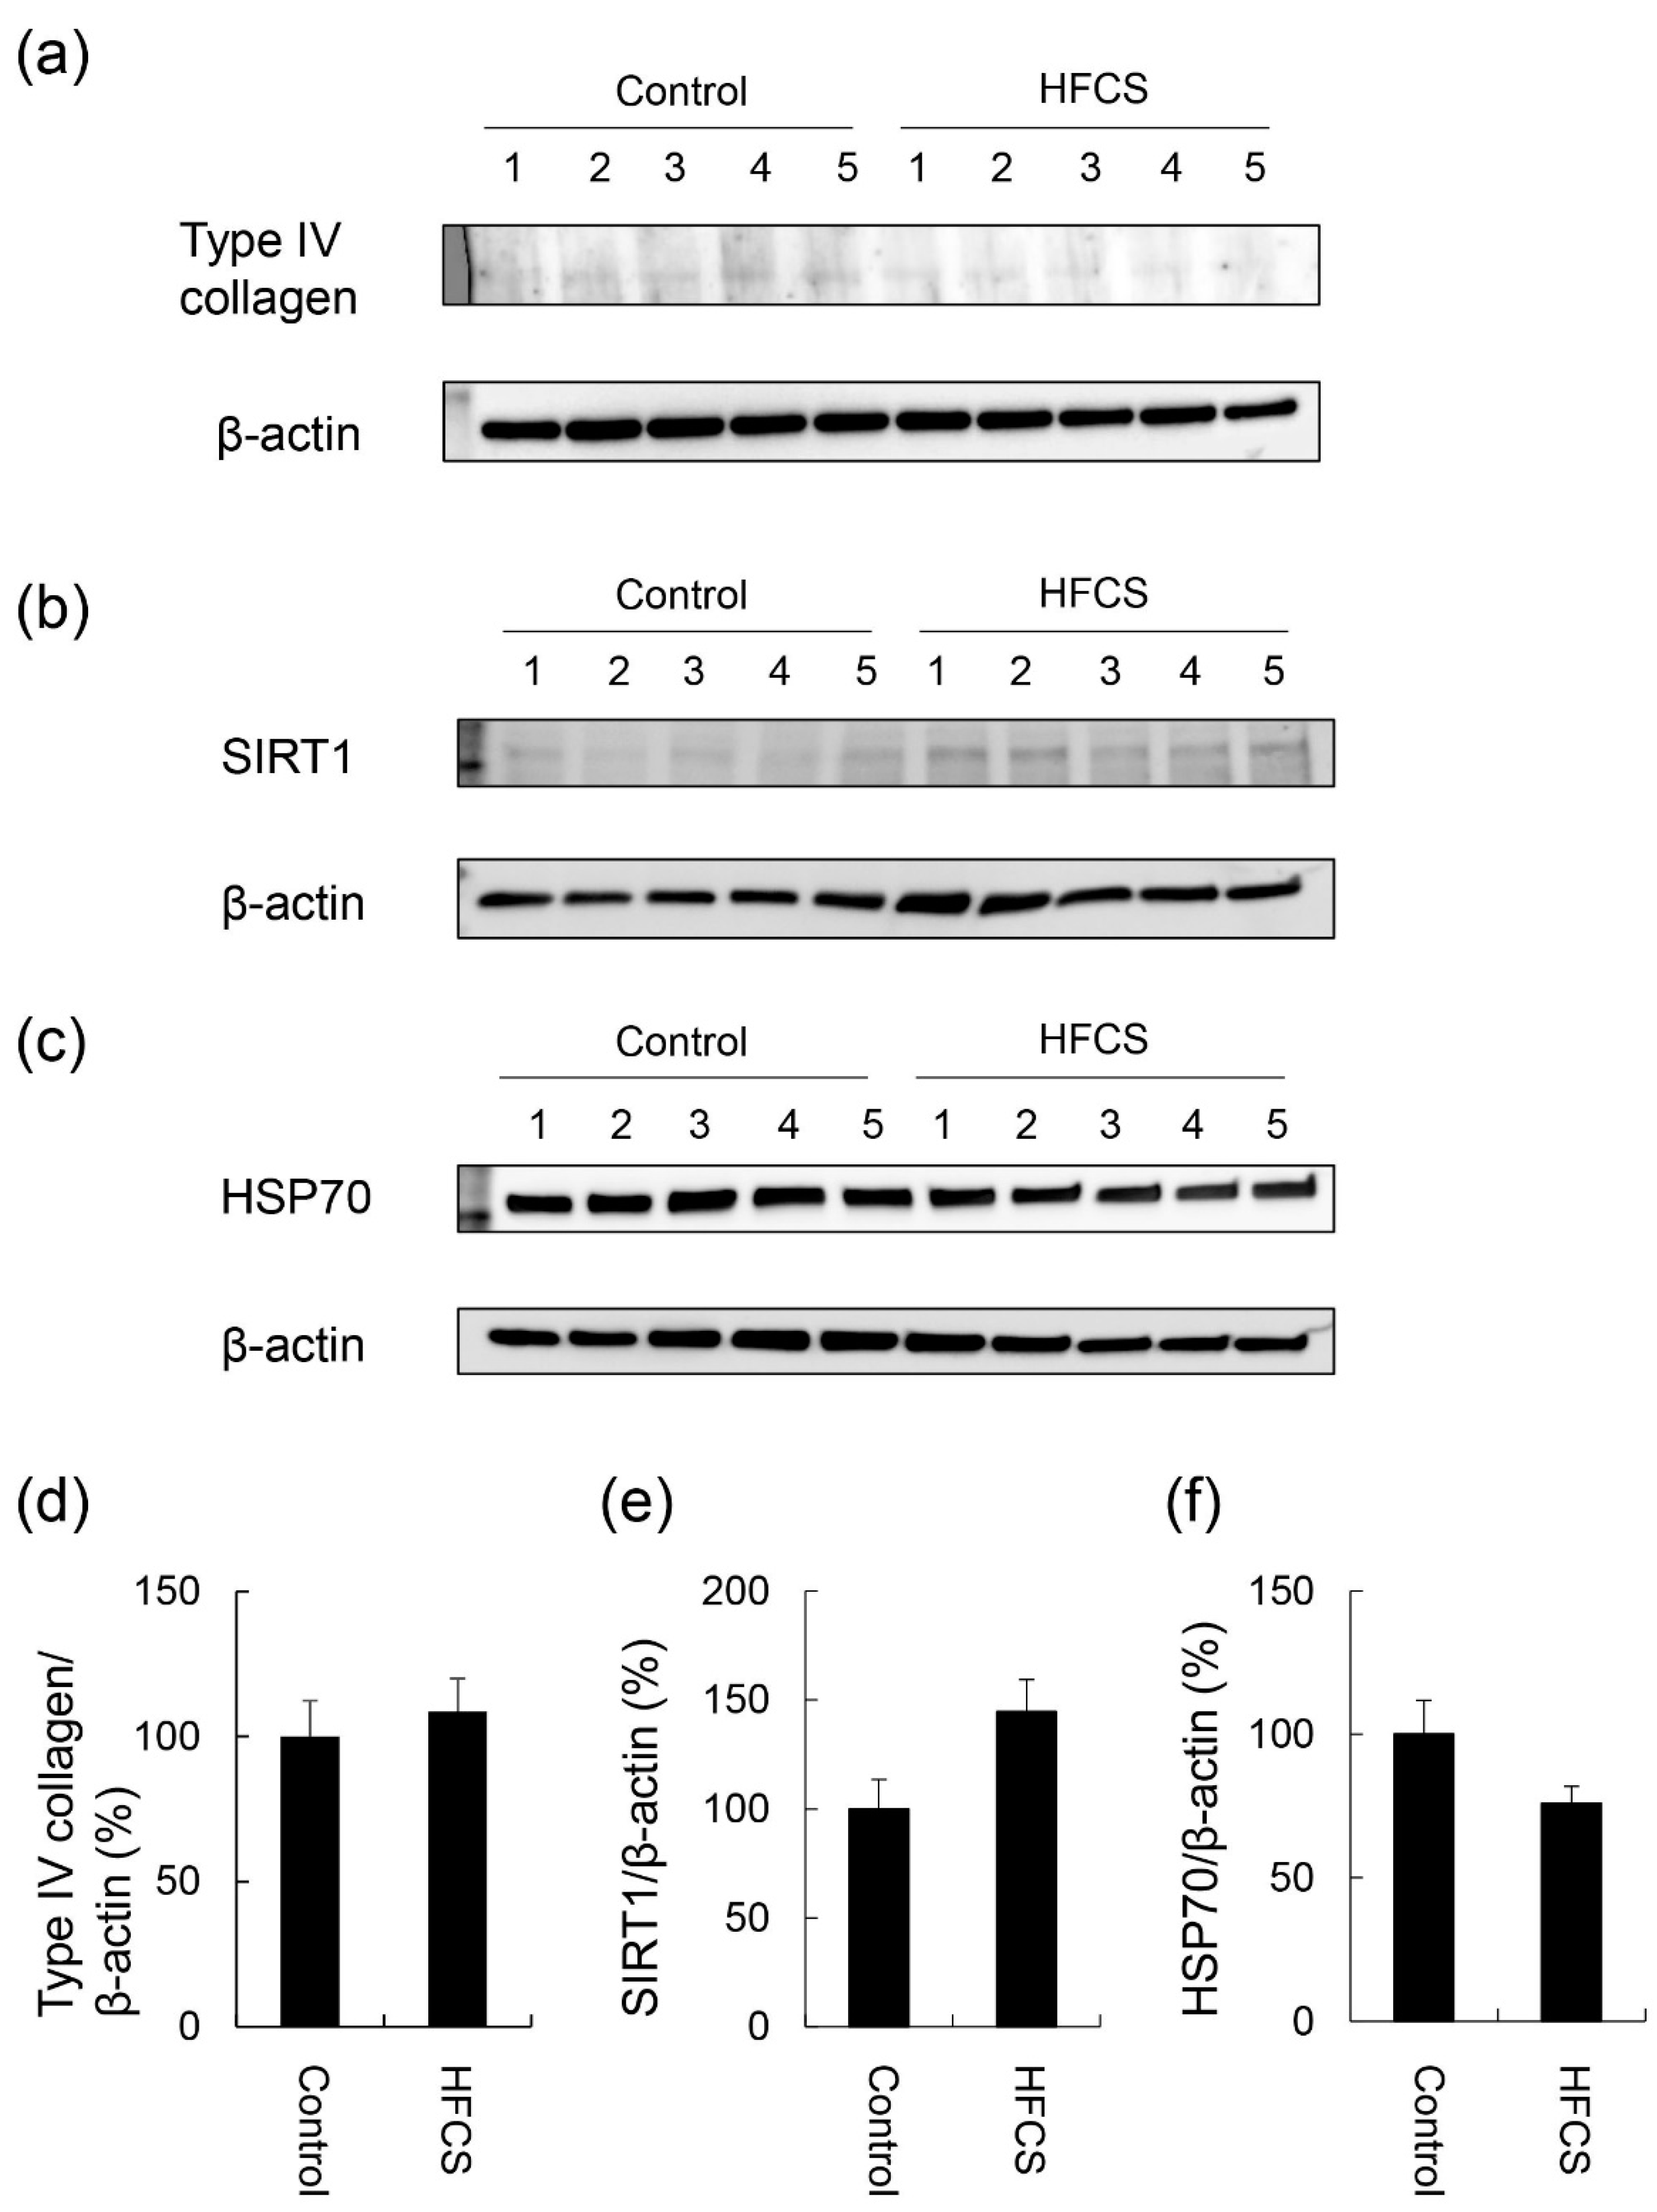
3.4. Expression Partterns of Proteins Associated with Steatosis, Inflammation, and Fibrosis
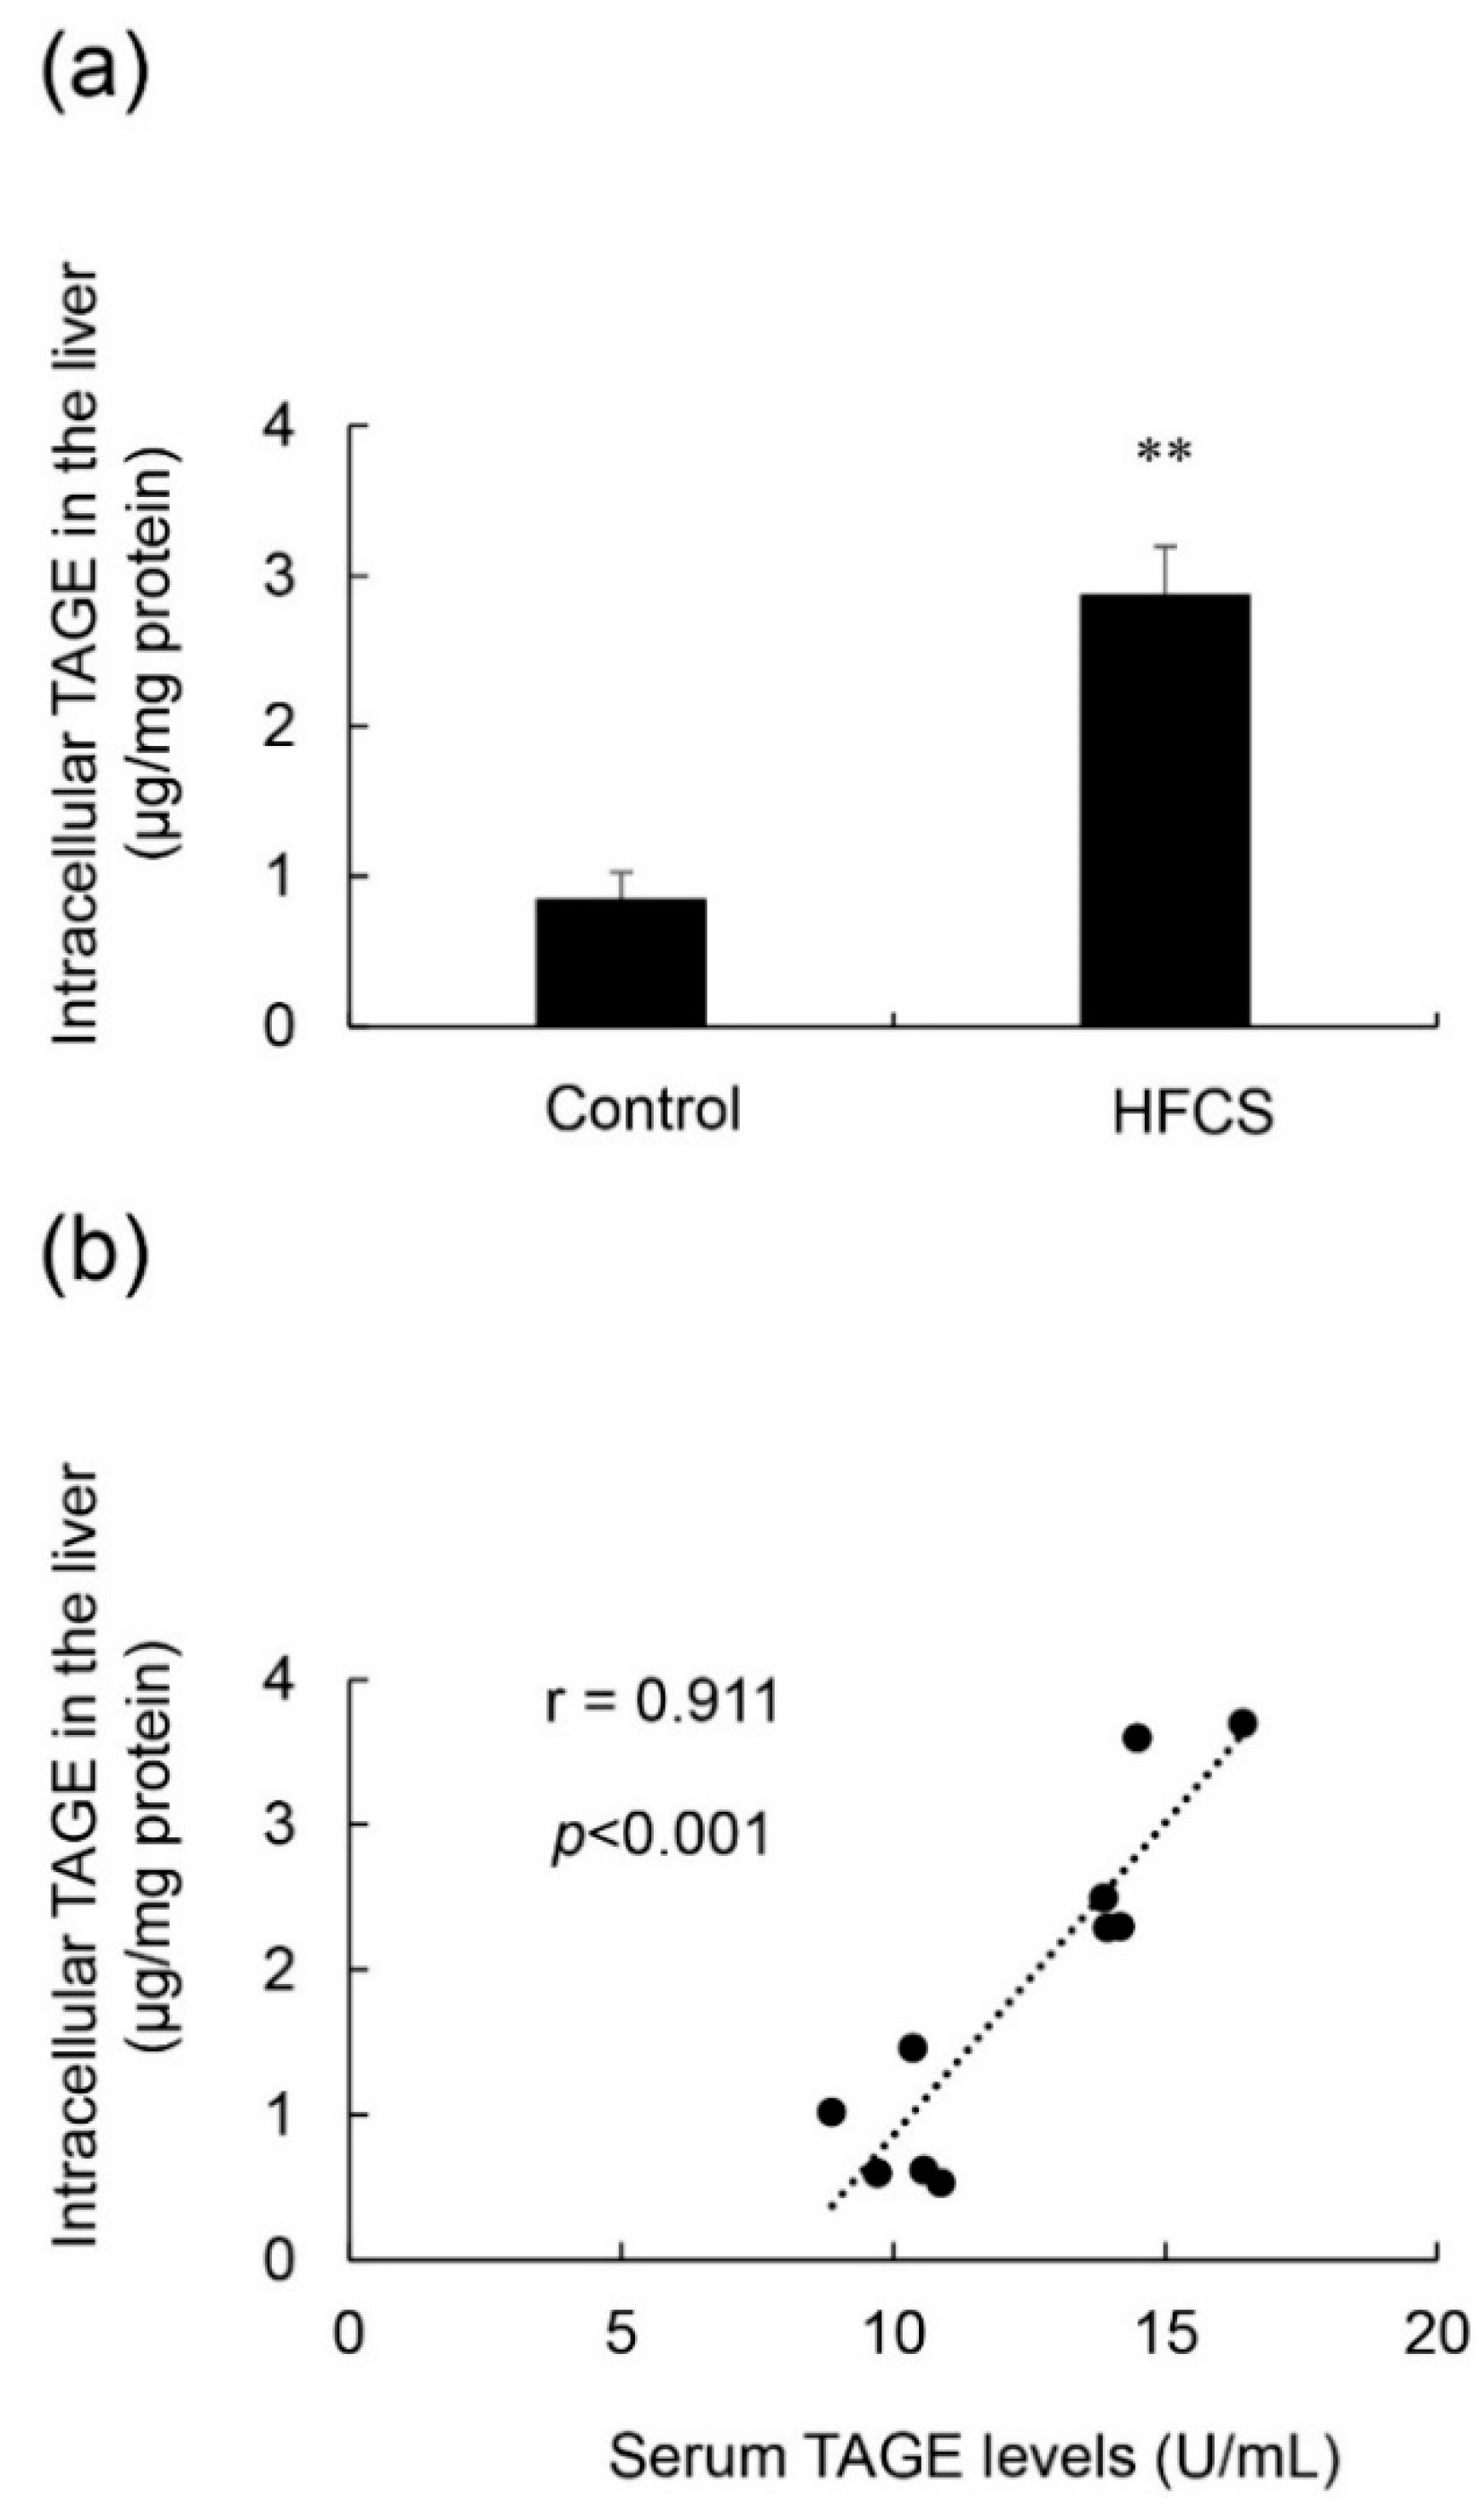
3.5. Calculation of Intracellular TAGE Levels in the Liver and Its Relationship with Serum TAGE Levels in the HFCS Group
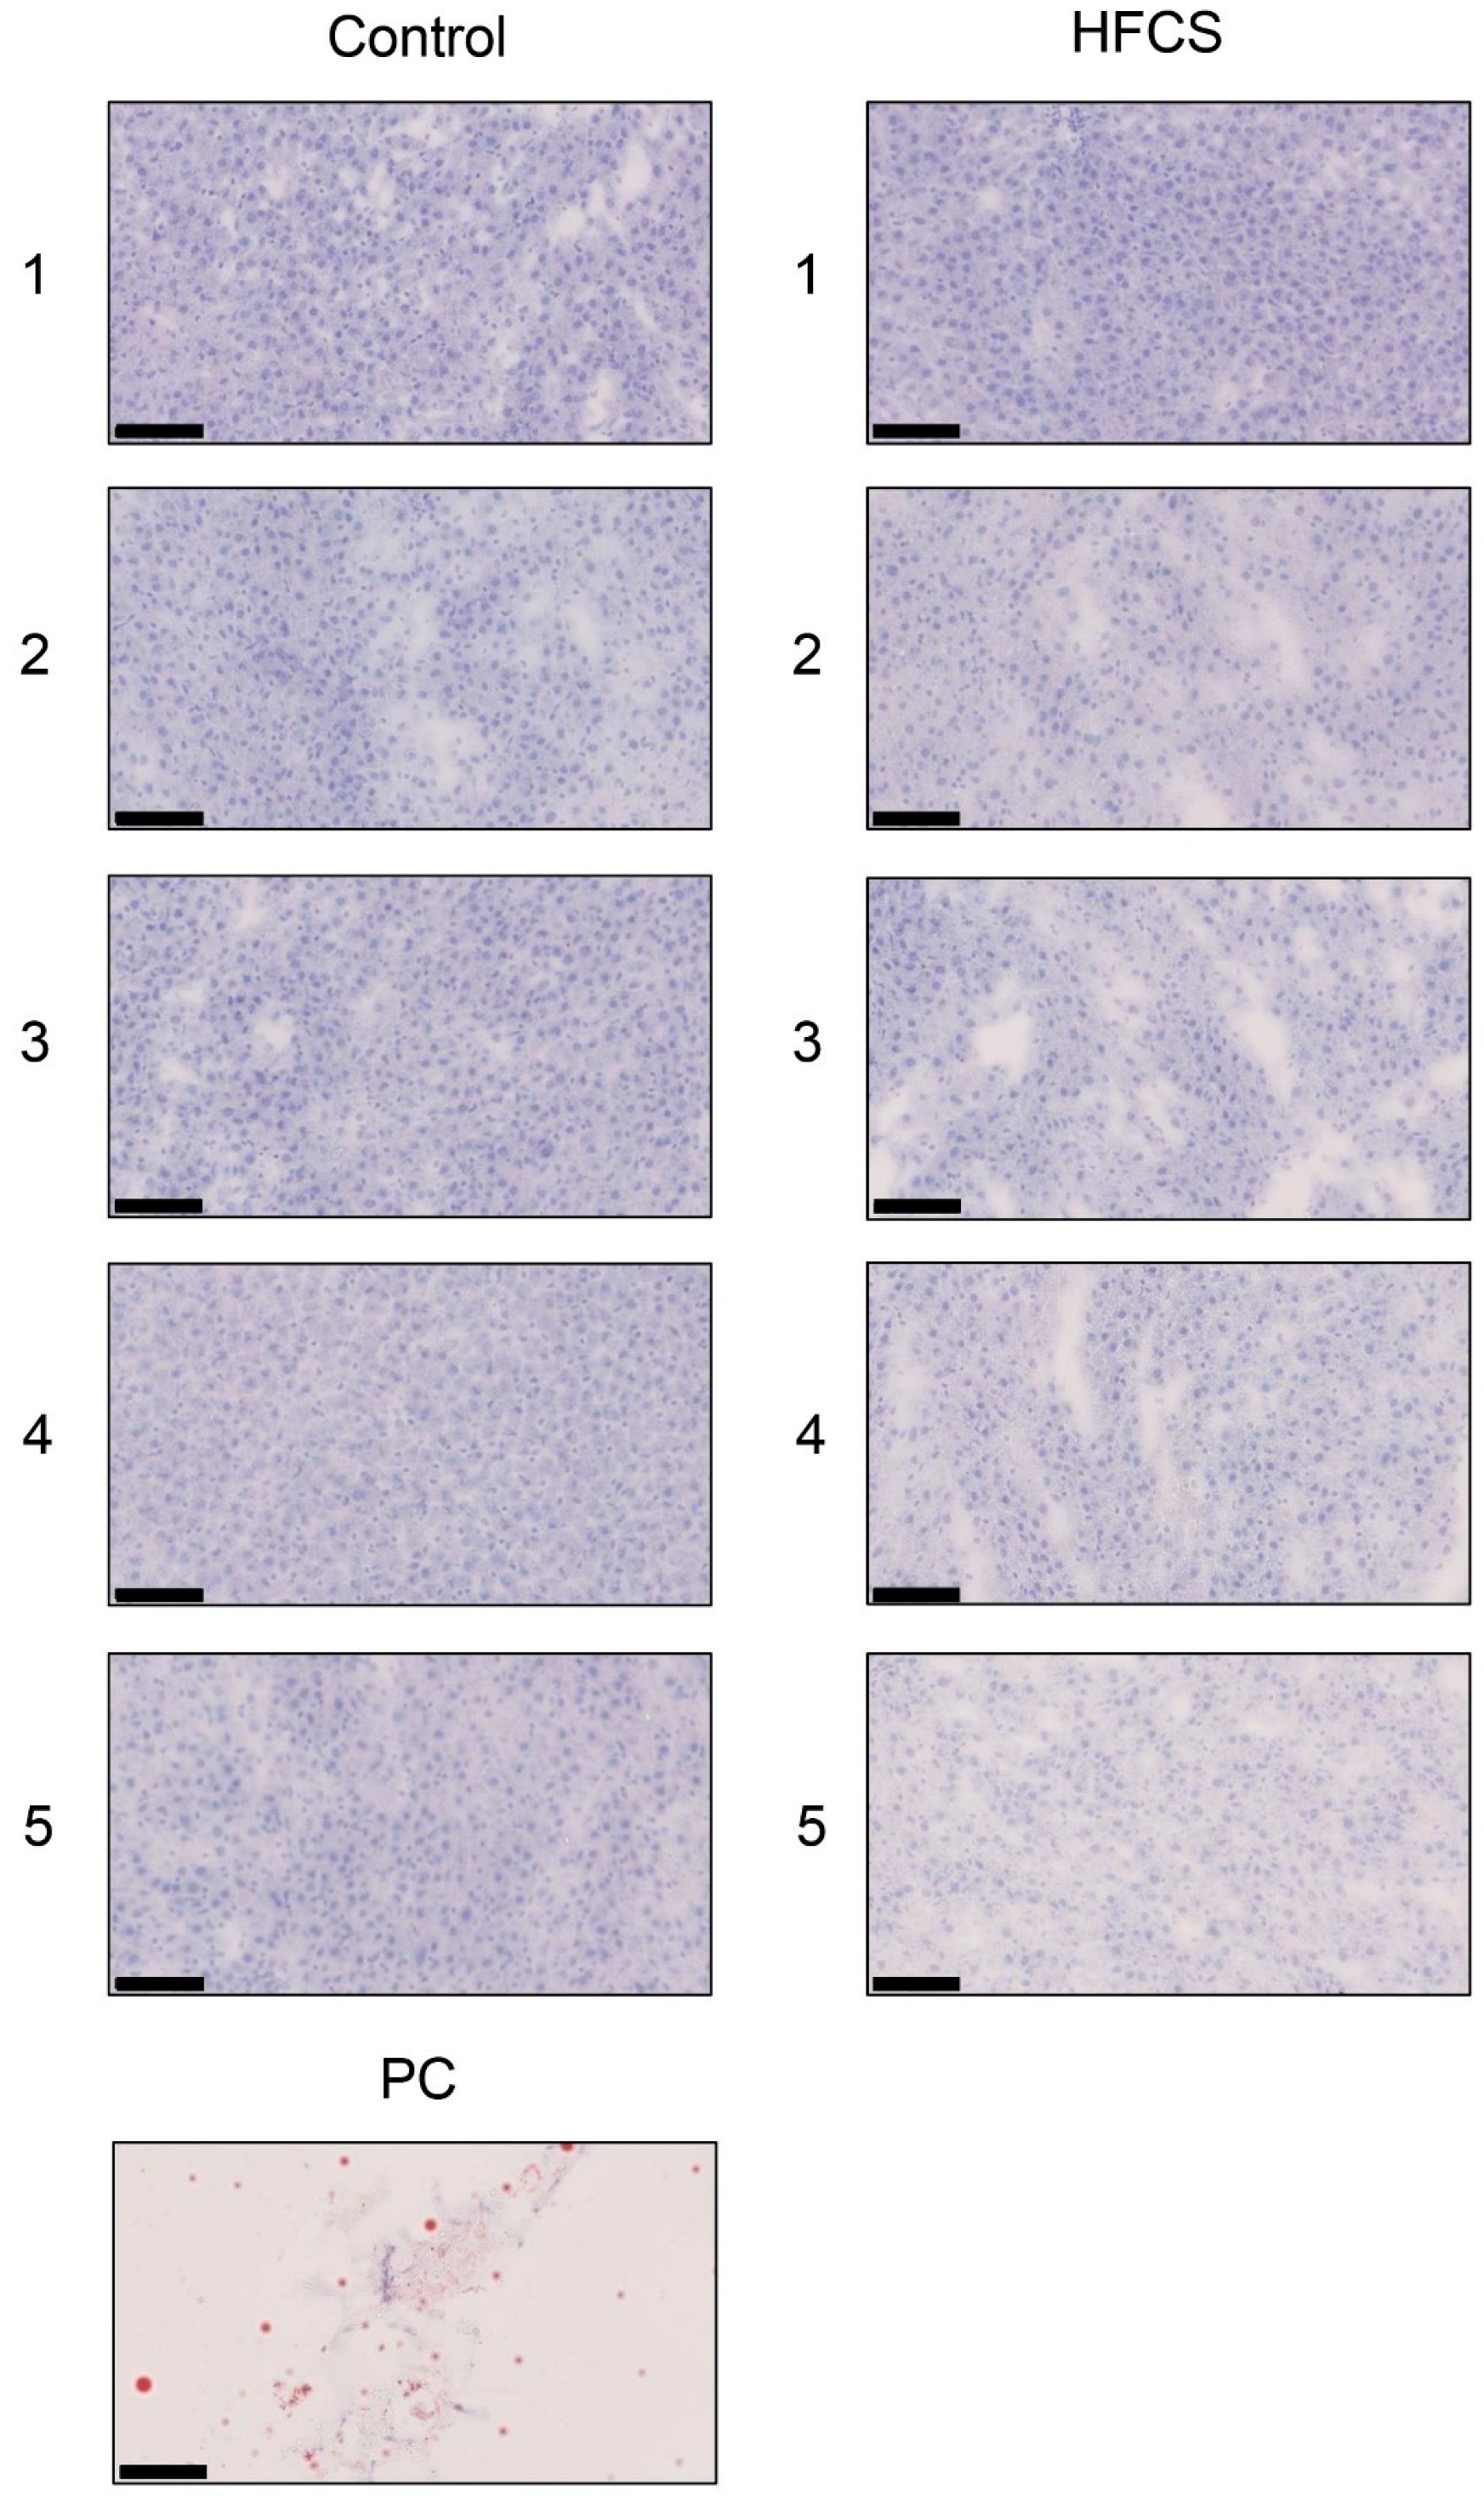
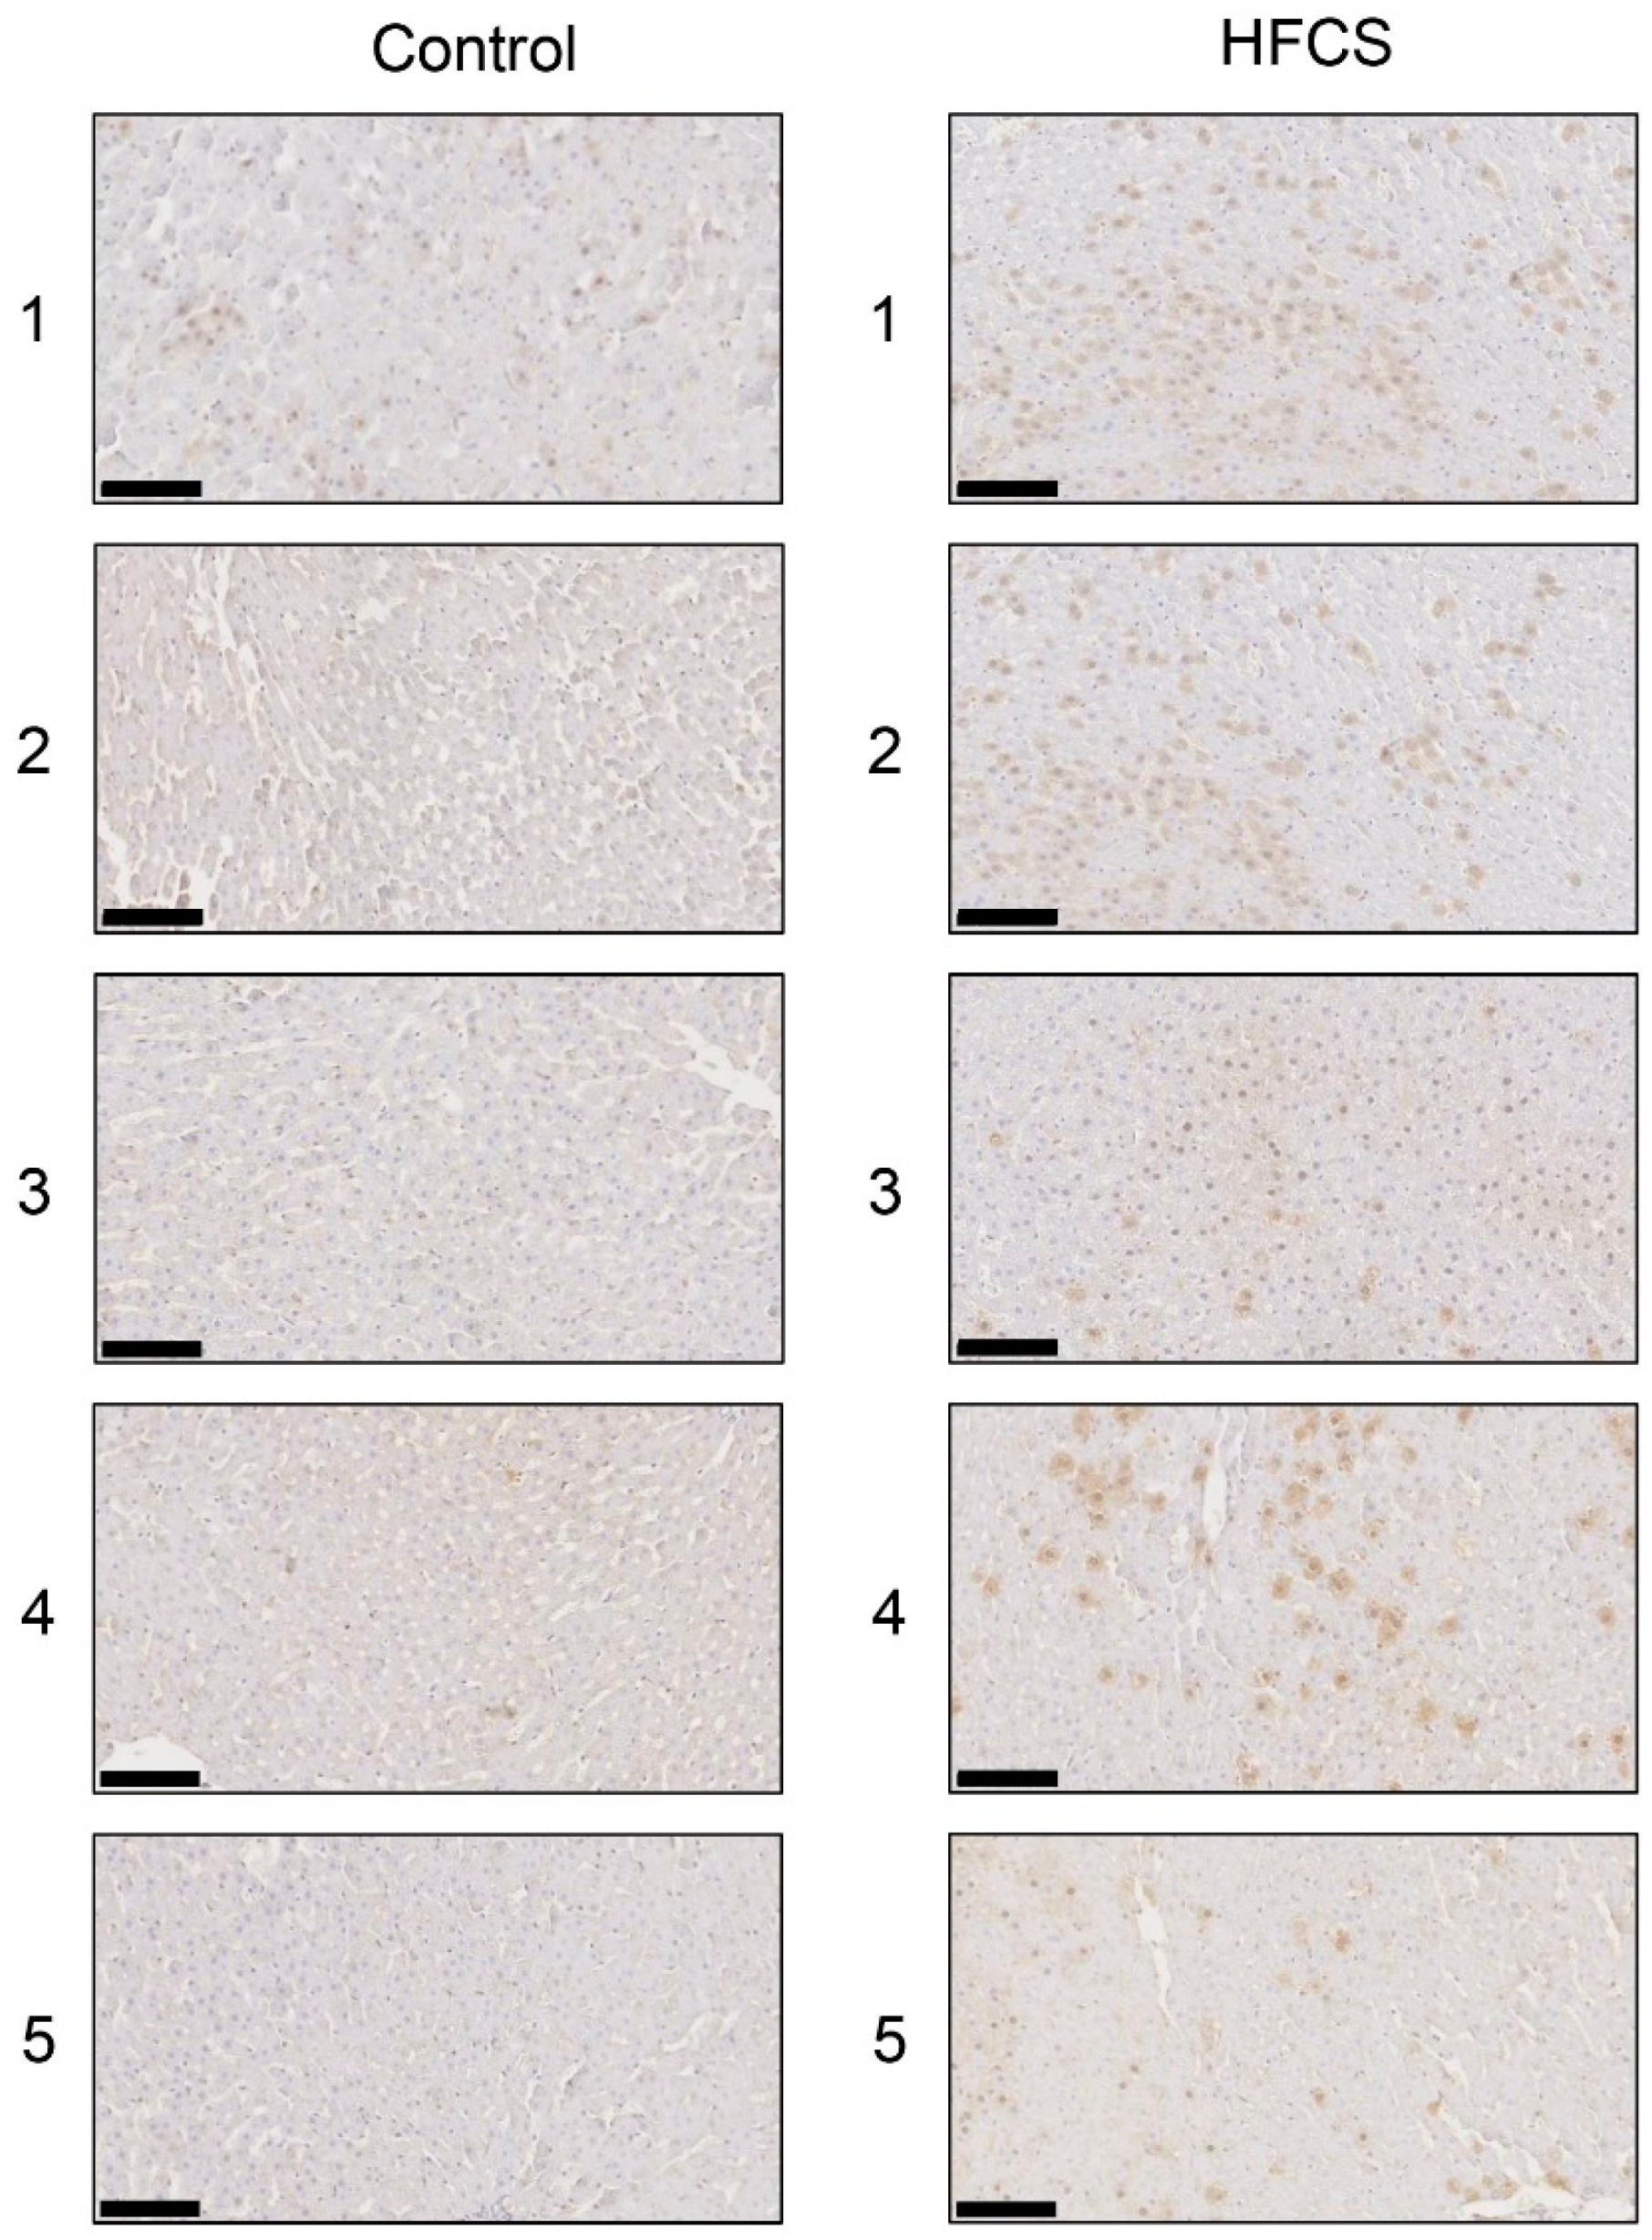
3.6. Histological Analysis of the Liver with Anti-TAGE Antibody Staining
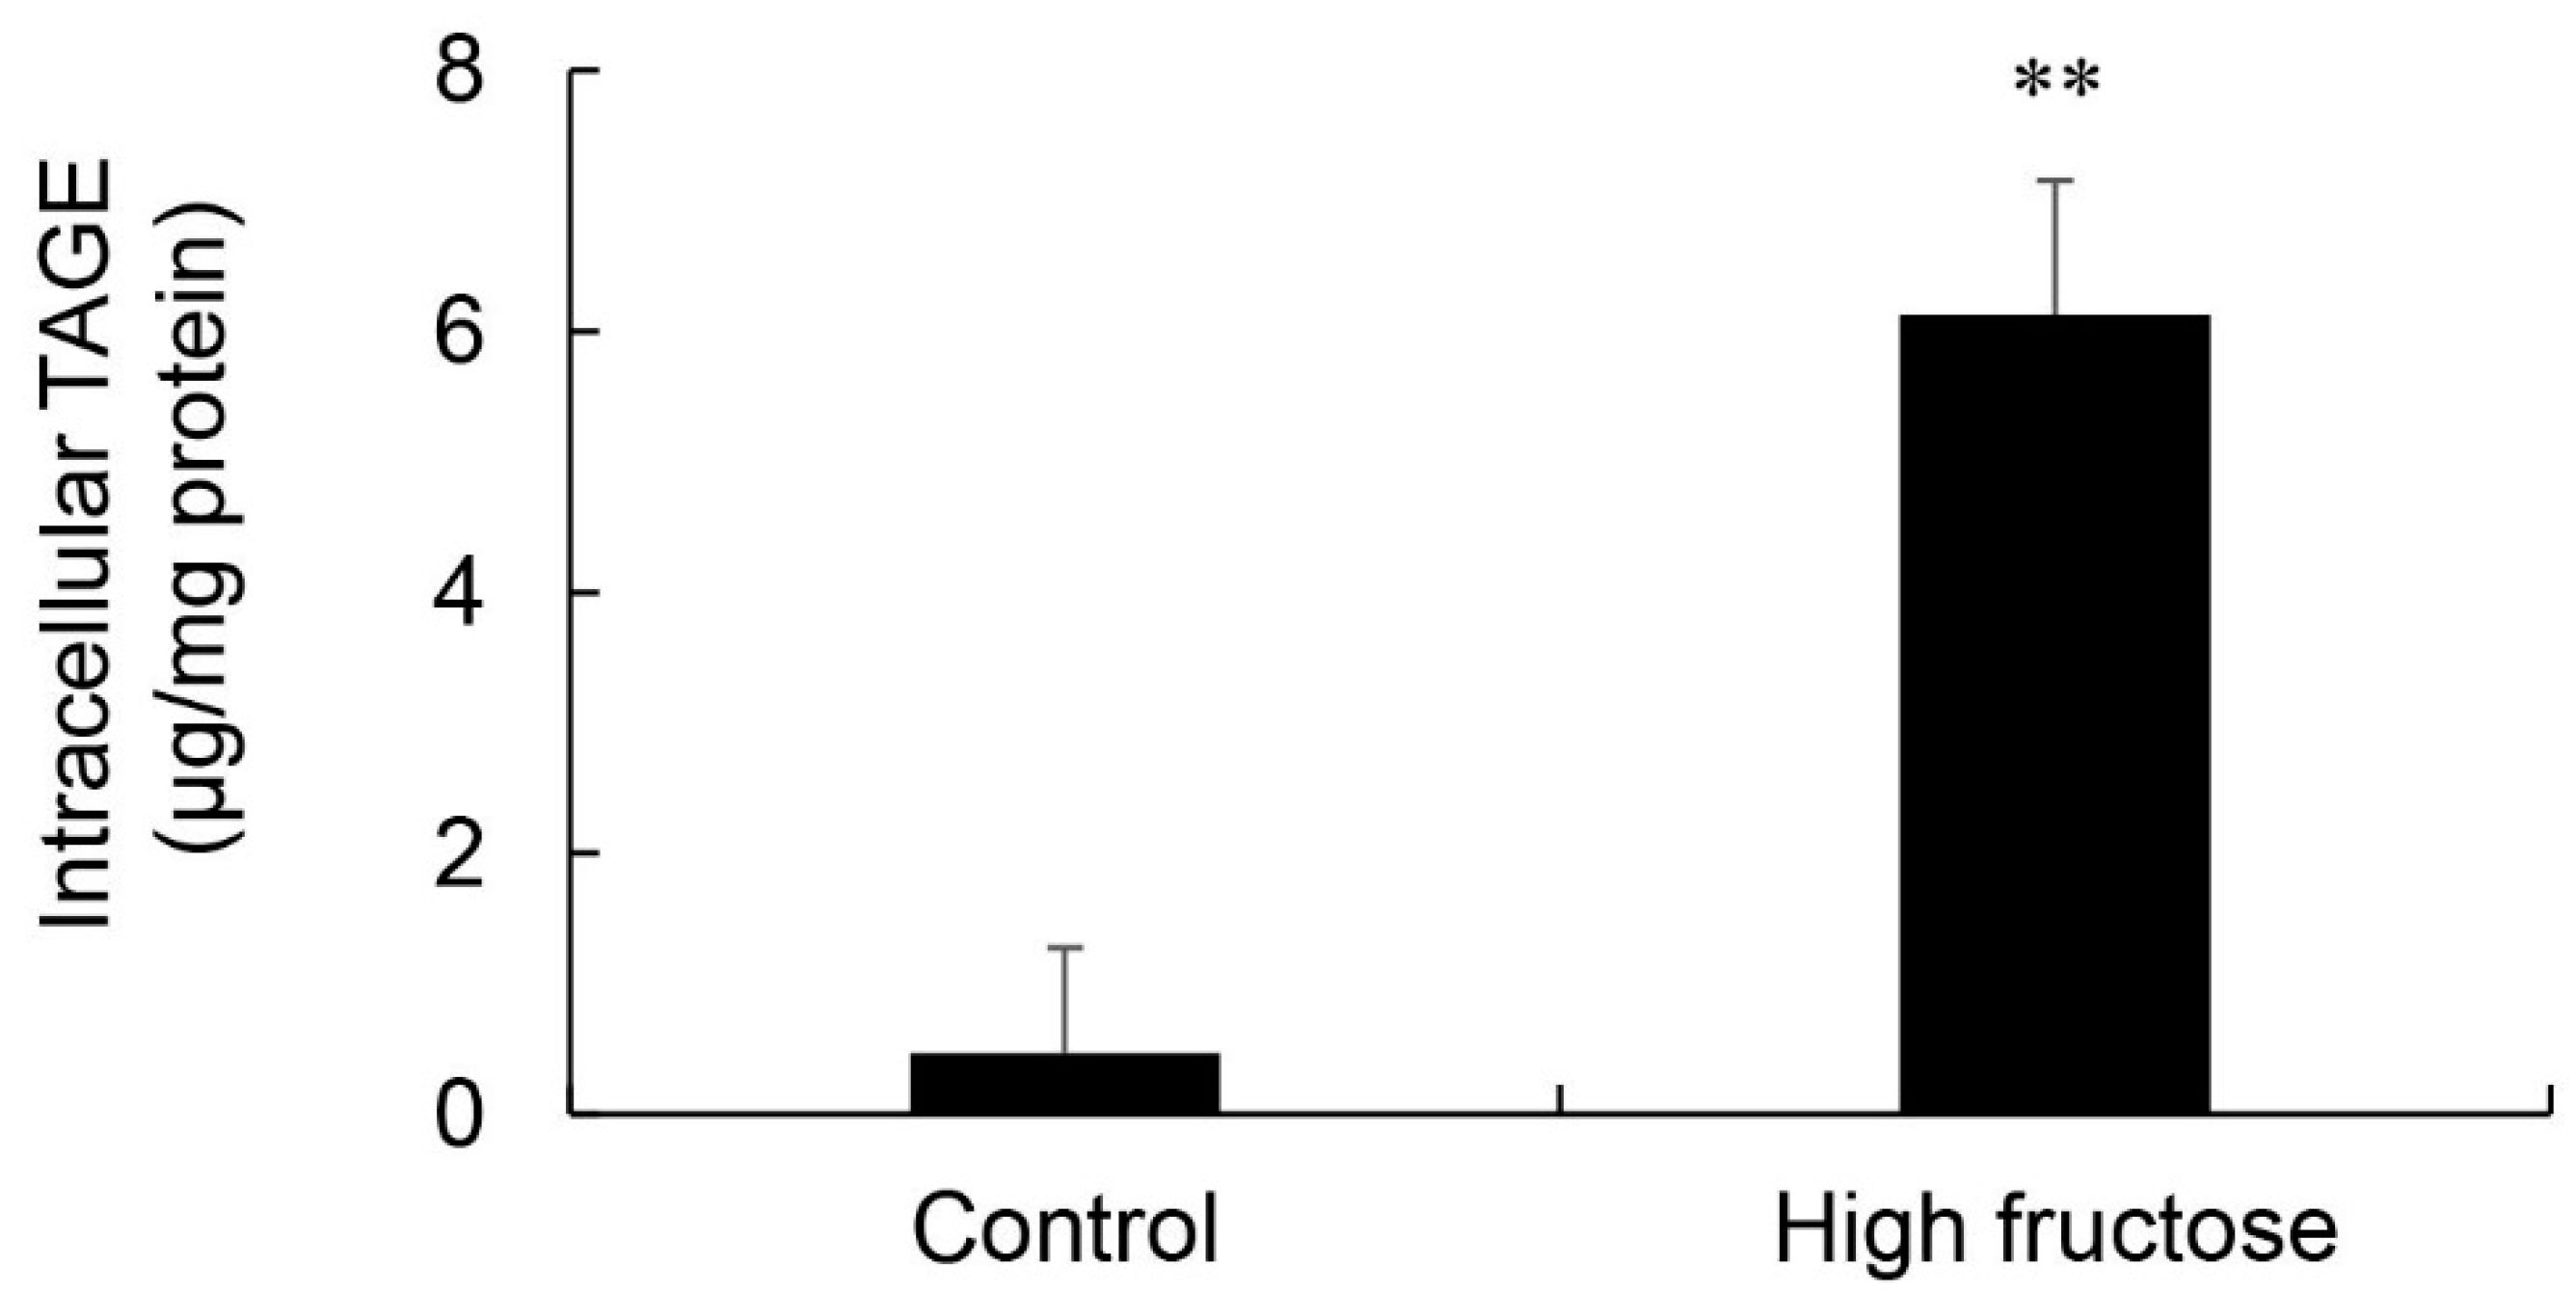
3.7. Calculation of Intracellular TAGE Levels in SD Rat Primary Hepatocytes
3.8. Intake of the Normal Diet and Lactobacillus Beverage and Body and Liver Weights
3.9. Serum and Plasma Biochemistries in the Lactobacillus Beverage Group
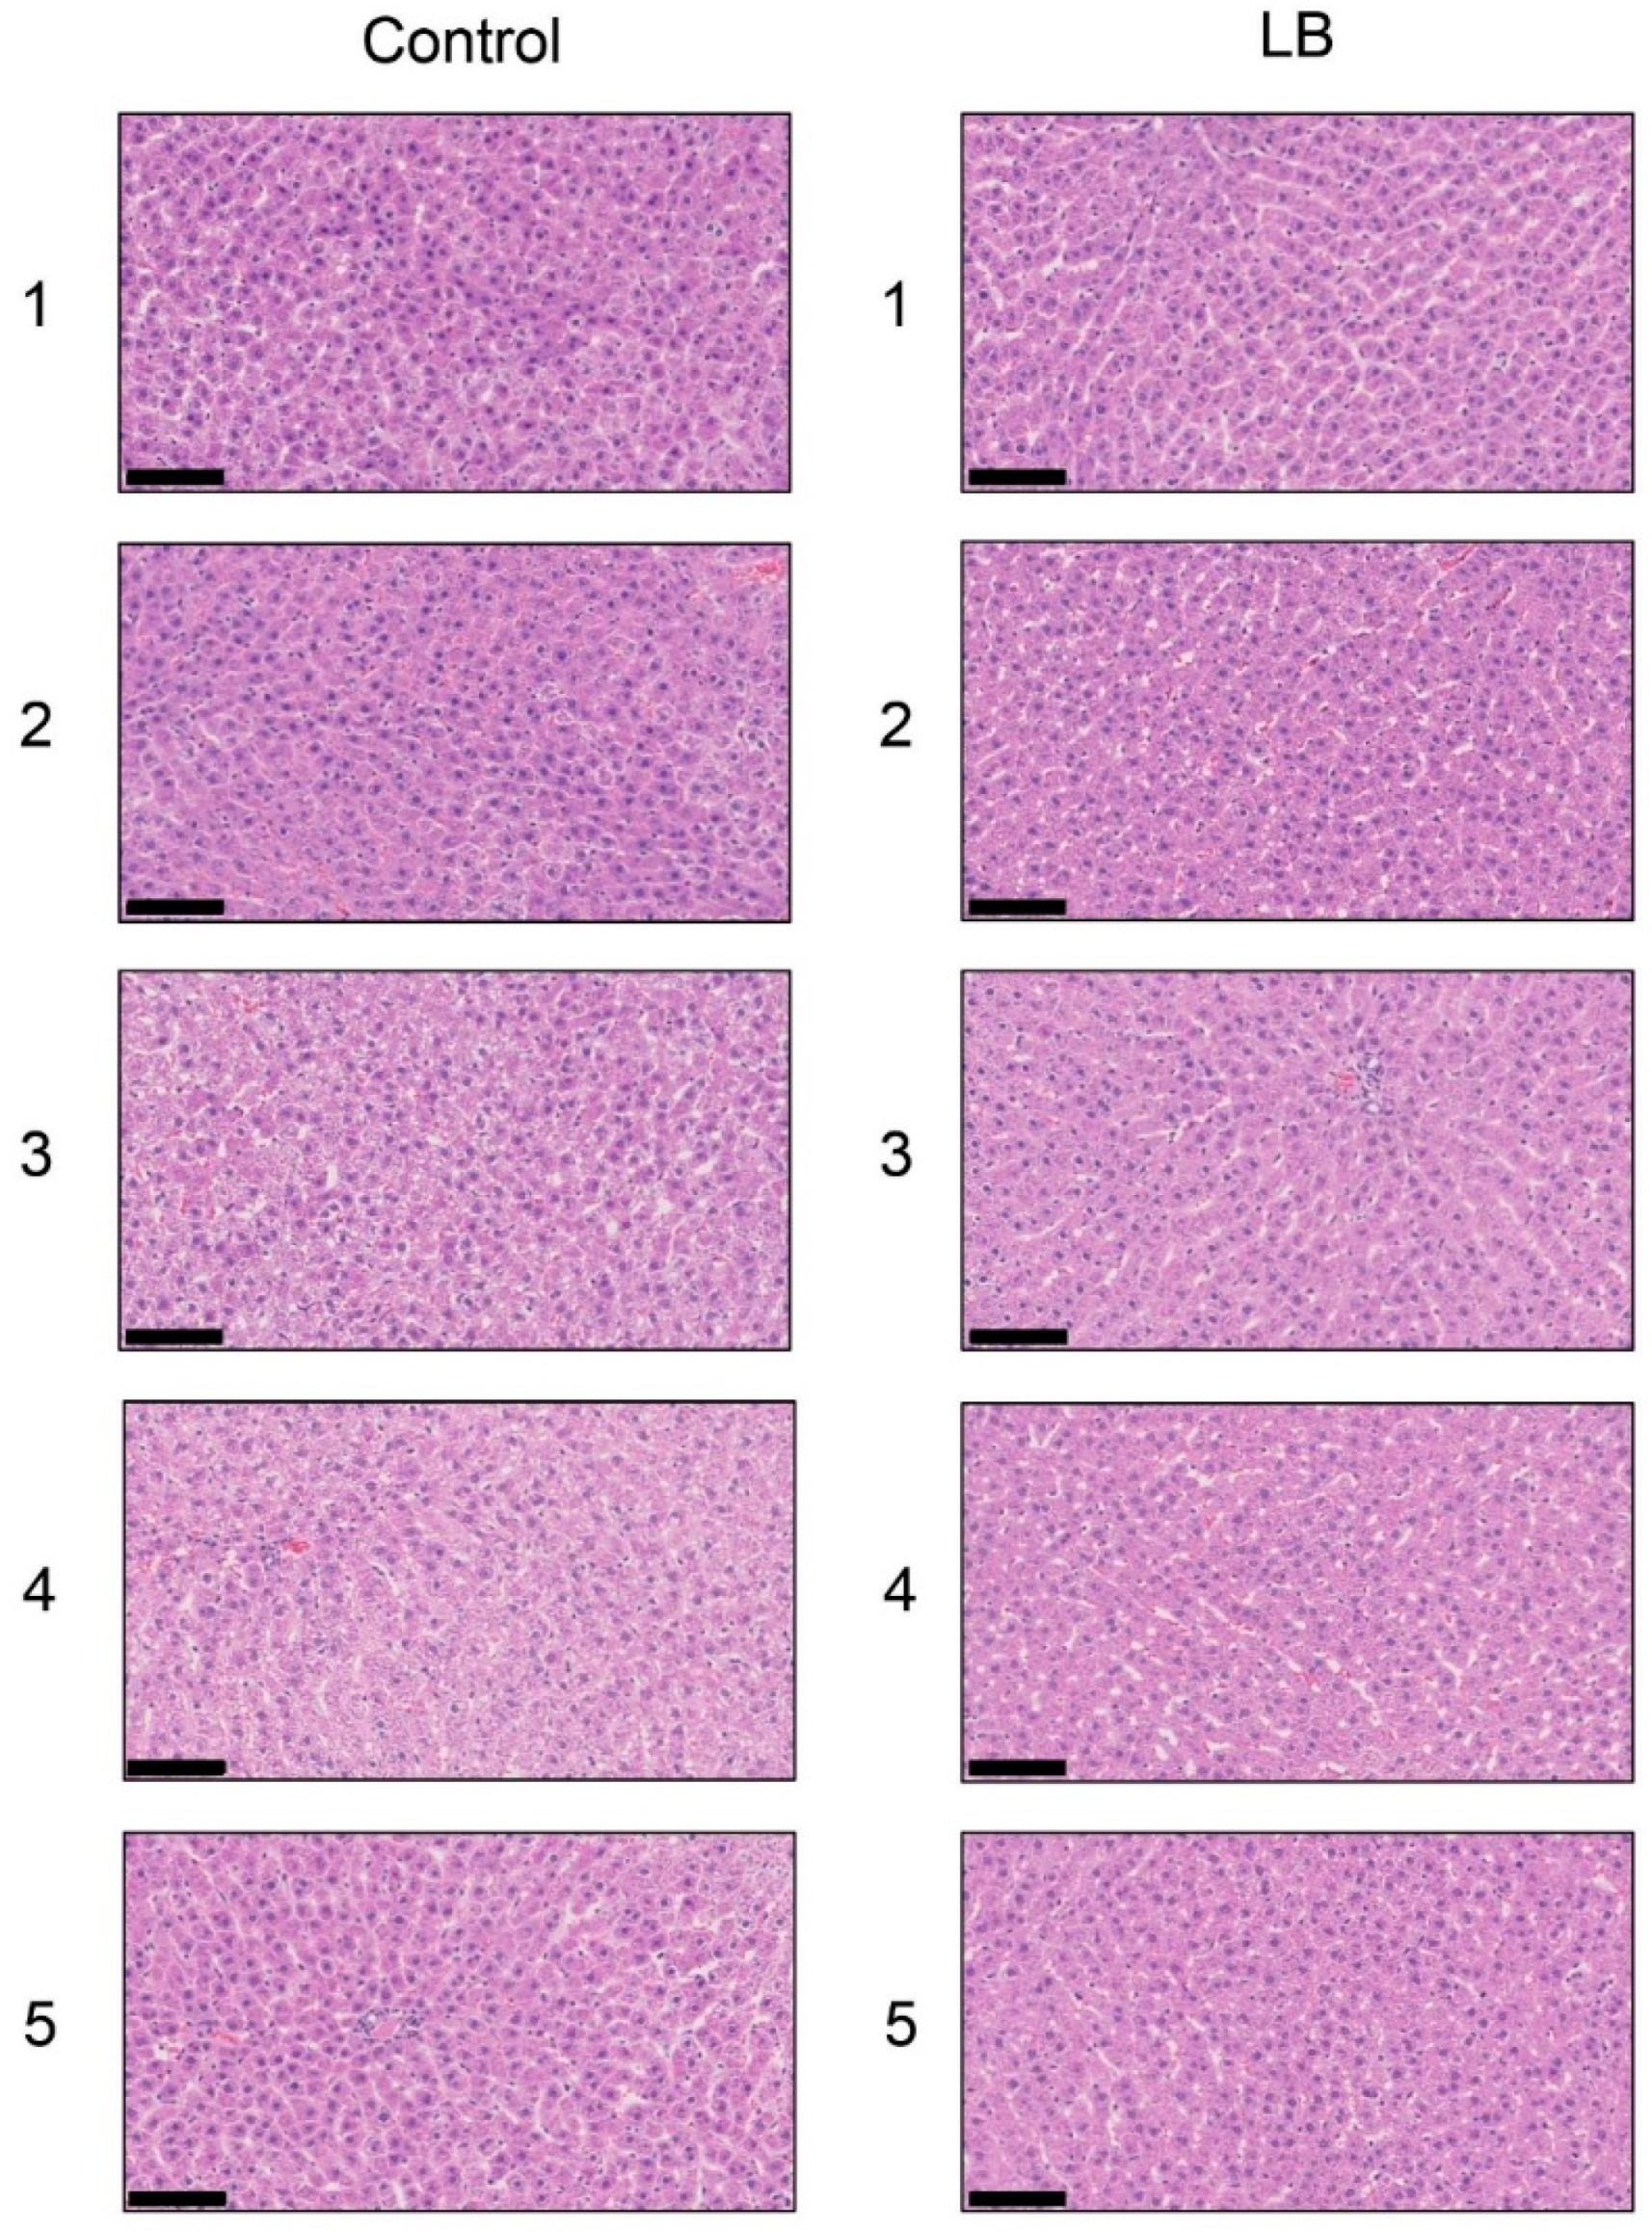
3.10. Histological Analysis of the Liver with H.E., Oil Red O, and SIRIUS Red Staining in the Lactobacillus Beverage Group
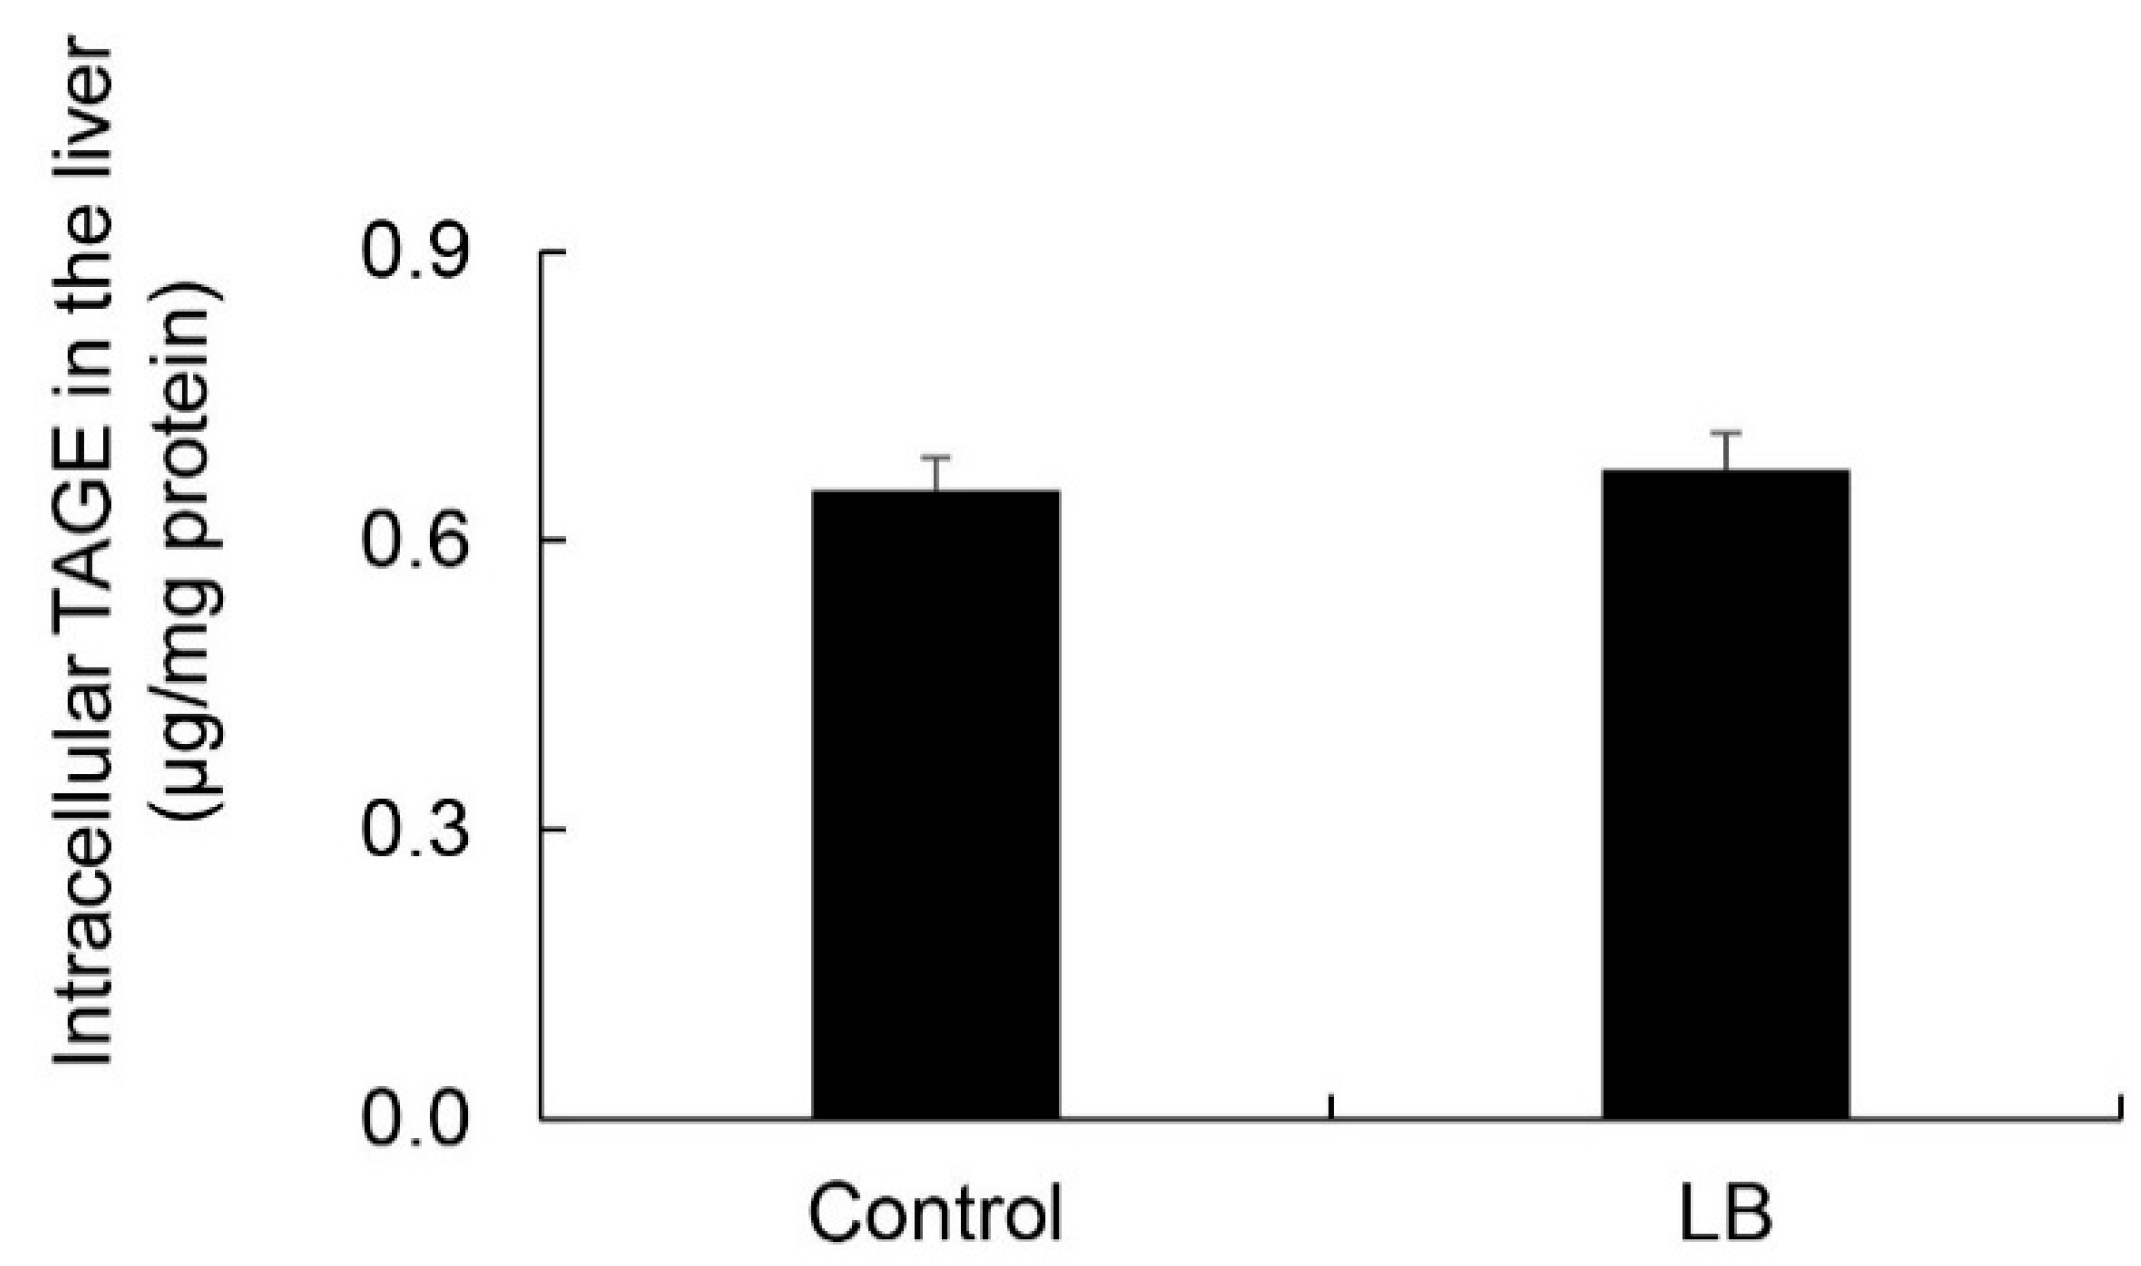
3.11. Calculation of Intracellular TAGE Levels in the Lactobacillus Beverage Group
3.12. Histological Analysis of the Liver with Anti-TAGE Antibody Staining in the Lactobacillus Group
4. Discussion
5. Conclusions
Supplementary Materials
Author Contributions
Funding
Acknowledgments
Conflicts of Interest
References
- Mirtschink, P.; Jang, C.; Arany, Z.; Krek, W. Fructose metabolism, cardiometabolic risk, and the epidemic of coronary artery disease. Eur. Heart J. 2018, 39, 2497–2505. [Google Scholar] [CrossRef] [PubMed]
- Takeuchi, M.; Takino, J.; Sakasai-Sakai, A.; Takata, T.; Tsutsumi, M. Toxic AGE (TAGE) theory for the pathophysiology of the onset/progression of NAFLD and ALD. Nutrients 2017, 9, 634. [Google Scholar] [CrossRef] [PubMed]
- Takeuchi, M. Serum levels of Toxic AGEs (TAGE) may be a promising novel biomarker for the onset/progression of lifestyle-related disease. Diagnostics 2016, 6, 23. [Google Scholar] [CrossRef] [PubMed]
- Takeuchi, M.; Takino, J.; Sakasai-Sakai, A.; Takata, T.; Ueda, T.; Tsutsumi, M.; Hyogo, H.; Yamagishi, S. Involvement of TAGE-RAGE system in non-alcoholic steatohepatitis: Novel treatment strategies. World J. Hepatol. 2014, 6, 880–893. [Google Scholar] [CrossRef] [PubMed]
- Hyogo, H.; Yamagishi, S.; Iwamoto, K.; Arihiro, K.; Takeuchi, M.; Sato, T.; Ochi, H.; Nonaka, M.; Nabeshima, Y.; Inoue, M.; et al. Elevated levels of serum advanced glycation end products in patients with non-alcoholic steatohepatitis. J. Gastroenterol. Hepatol. 2007, 22, 1112–1119. [Google Scholar] [CrossRef] [PubMed]
- Enomoto, M.; Adachi, H.; Yamagishi, S.; Takeuchi, M.; Furuki, K.; Hino, A.; Hiratsuka, A.; Takajo, Y.; Imaizumi, T. Positive association of serum levels of advanced glycation end products with thrombogenic markers in humans. Metabolism 2006, 55, 912–917. [Google Scholar] [CrossRef] [PubMed]
- Ueda, S.; Yamagishi, S.; Matsui, T.; Noda, Y.; Ueda, S.; Jinnouchi, Y.; Sasaki, K.; Takeuchi, M.; Imaizumi, T. Serum levels of advanced glycation products (AGEs) are inversely associated with the number and migratory activity or circulating endothelial progenitor cells in apparently healthy subjects. Cardiovasc. Ther. 2012, 30, 249–254. [Google Scholar] [CrossRef]
- Tomosugi, N.; Yamamoto, S.; Takeuchi, M.; Yonekura, H.; Ishigaki, Y.; Numata, N.; Katsuda, S.; Sakai, Y. Effect of collagen tripeptide on atherosclerosis in healthy humans. J. Atheroscler. Throb. 2017, 24, 530–538. [Google Scholar] [CrossRef]
- Kan, H.; Yamagishi, S.; Ojima, A.; Fukami, K.; Ueda, S.; Takeuchi, M.; Hyogo, H.; Aikata, H.; Chayama, K. Elevation of serum levels of advanced glycation end products in patients with non-B or non-C hepatocellular carcinoma. J. Clin. Lab. Anal. 2015, 29, 480–484. [Google Scholar] [CrossRef]
- Kimura, Y.; Hyogo, H.; Yamagishi, S.; Takeuchi, M.; Ishitobi, T.; Nabeshima, Y.; Arihiro, K.; Chayama, K. Atorvastatin decreases serum levels of advanced glycation end products (AGEs) in nonalcoholic steatohepatitis (NASH) patients with dyslipidemia clinical usefulness of AGEs as a biomarker for the attenuation of NASH. J. Gastroenterol. 2010, 45, 750–757. [Google Scholar] [CrossRef]
- Sakasai-Sakai, A.; Takata, T.; Takino, J.; Takeuchi, M. The relevance of toxic AGEs (TAGE) cytotoxicity to NASH pathogenesis: A mini-review. Nutrients 2019, 11, 462. [Google Scholar] [CrossRef] [PubMed]
- Takeuchi, M.; Makita, Z.; Bucala, R.; Suzuki, T.; Koike, T.; Kameda, Y. Immunological evidence that non-carboxymethyllysine advanced glycation end-products are produced from short chain and dicarbonyl compounds in vivo. Mol. Med. 2000, 6, 114–125. [Google Scholar] [CrossRef] [PubMed]
- Mahmoud, A.M.; Ashour, M.B.; Abdel-Moneim, A.; Ahmed, O.M. Hesperidin and naringin attenuate hyperglycemia-mediated oxidative stress and proinflammatory cytokine production high fat fed/streptozotocin-induced type 2 diabetic rats. J. Diabetes Complicat. 2012, 26, 483–490. [Google Scholar] [CrossRef] [PubMed]
- Jinno, M.; Takeuchi, M.; Watanabe, A.; Teruya, K.; Hirohama, J.; Eguchi, N.; Miyazaki, A. Advanced glycation end-products accumulation compromises embryonic development and achievement of pregnancy by assisted reproductive technology. Hum. Reprod. 2011, 26, 604–610. [Google Scholar] [CrossRef] [PubMed]
- Takata, T.; Ueda, T.; Sakasai-Sakai, A.; Takeuchi, M. Generation of glyceraldehyde-derived advanced glycation end-products in pancreatic cancer cells and the potential of tumor promotion. World J. Gastroenterol. 2017, 23, 4910–4919. [Google Scholar] [CrossRef] [PubMed]
- Mucci, L.; Santilli, F.; Cuccurullo, C.; Davì, G. Cardiovascular risk and dietary sugar intake: Is the link so sweet? Intern. Emerg. Med. 2012, 7, 313–322. [Google Scholar] [CrossRef]
- Basaranoglu, M.; Basaranoglu, G.; Bugianesi, E. Carbohydrate intake and nonalcoholic fatty liver disease: Fructose as a weapon of mass destruction. Hepatobiliary Surg. Nutr. 2015, 4, 109–116. [Google Scholar] [CrossRef]
- Ding, W.J.; Wang, Y.; Fan, J.G. Regulation of adipokines by polyunsaturated fatty acids in a rat model of non-alcoholic steatohepatitis. Arch. Iran. Med. 2014, 17, 563–568. [Google Scholar]
- Yuan, F.; Wang, H.; Tian, Y.; Li, Q.; He, L.; Li, N.; Liu, Z. Fish oil alleviated high-fat diet-induced non-alcoholic fatty liver disease via regulating hepatic lipids metabolism and metaflammation: A transcriptomic study. Lipids. Health Dis. 2016, 15, 20. [Google Scholar] [CrossRef]
- Kitahara, Y.; Takeuchi, M.; Miura, K.; Mine, T.; Matsui, T.; Yamagishi, S. Glyceraldehyde-derived advanced glycation end products (AGEs). A novel biomarker of postprandial hyperglycemia in diabetic rats. Clin. Exp. Med. 2008, 8, 175–177. [Google Scholar] [CrossRef]
- Masuda, Y.; Kurikawa, N.; Nishizawa, T. Overexpressing human GRP109A leads to pronounced reduction in plasma triglyceride levels in BAC transgenic rats. Atherosclerosis 2018, 272, 182–192. [Google Scholar] [CrossRef] [PubMed]
- Takino, J.; Kobayashi, Y.; Takeuchi, M. The formation of intracellular glyceraldehyde-derived advanced glycation end-products and cytotoxicity. J. Gastroenterol. 2010, 45, 646–655. [Google Scholar] [CrossRef] [PubMed]
- Takino, J.; Nagamine, K.; Takeuchi, M.; Hori, T. In vitro identification of nonalcoholic fatty liver disease-related protein hnRNPM. World J. Gastroenterol. 2015, 21, 1784–1793. [Google Scholar] [CrossRef] [PubMed]
- Sakasai-Sakai, A.; Takata, T.; Takino, J.; Takeuchi, M. Impact of intracellular glyceraldehyde-derived advanced glycation end-products on human hepatocyte cell death. Sci. Rep. 2017, 7, 14282. [Google Scholar] [CrossRef] [PubMed]
- Koriyama, Y.; Furukawa, A.; Muramatsu, M.; Takino, J.; Takeuchi, M. Glyceraldehyde caused Alzheimer’s disease-like alterations in diagnostic marker levels in SH-SY5Y human neuroblastoma cells. Sci. Rep. 2015, 5, 13313. [Google Scholar] [CrossRef] [PubMed]
- Takata, T.; Sakasai-Sakai, A.; Ueda, T.; Takeuchi, M. Intracellular toxic advanced glycation end-products in cardiomyocytes may cause cardiovascular disease. Sci. Rep. 2019, 9, 2121. [Google Scholar] [CrossRef]
- Aizawa, Y.; Shirai, T.; Kobayashi, T.; Hino, O.; Tsujii, H.; Inoue, H.; Tadokoro, T.; Suzuki, T.; Kobayashi, K.I.; Yamamoto, Y. The tuberous sclerosis complex model Eker (TSC2+/-) rat exhibits hyperglycemia and hyperketonemia due to decreased glycolysis in the liver. Arch. Biochem. Biophys. 2016, 590, 48–55. [Google Scholar] [CrossRef]
- Do Nascimento, G.S.; Constantin, R.P.; Gilglioni, E.H.; De Castro Ghizoni, C.V.; Bracht, A.; Utsunomiya, K.S.; Yamamoto, N.S.; Ishii-Iwamoto, E.L.; Constantin, J.; Constantin, R.P. The acute effects of citrus flavanones on the metabolism of glycogen and monosaccharides in the isolated perfused rat liver. Toxicol. Lett. 2018, 291, 158–172. [Google Scholar] [CrossRef]
- Kaji, N.; Okuno, A.; Ohno-Ichiki, K.; Oki, H.; Ishizawa, H.; Shirai, M.; Asai, F. Plasma profiles of glucose, insulin, and lipids in the male WBN/Kob-Leprfa rat, a new model of type 2 diabetes with obesity. J. Vet. Med. Sci. 2012, 74, 1185–1189. [Google Scholar] [CrossRef]
- Namekawa, J.; Takagi, Y.; Wakabayashi, K.; Nakamura, Y.; Watanabe, A.; Nagakubo, D.; Shirai, M.; Asai, F. Effects of high-fat diet and fructose-rich diet on obesity, dyslipidemia and hyperglycemia in the WBN/Kob-Leprfa rat, a new model of type 2 diabetes mellitus. J. Vet. Med. Sci. 2017, 79, 988–991. [Google Scholar] [CrossRef]
- Yang, X.; Yang, M.; Cheng, M.; Ma, L.B.; Xie, X.C.; Han, S.; Zhang, B.; Fei, X.; Wang, M.; Mei, C.L. Effects of low-protein diets supplemented with ketoacid on expression of TGF-β and its receptors in diabetic rats. Biomed. Res. Int. 2015, 2015, 873519. [Google Scholar] [CrossRef] [PubMed][Green Version]
- Roth-Maier, D.A.; Kettler, S.I.; Benedikt, J.; Kirchgessner, M. Effects of vitamin B6 supplementation in rats during lactation on vitamin B6 concentration and transaminase activities in the offspring. Arch. Tierenahr. 2000, 53, 227–239. [Google Scholar] [CrossRef]
- Atarashi, M.; Izawa, T.; Miyagi, R.; Ohji, S.; Hashimoto, A.; Kuwamura, M.; Yamate, J. Dietary iron supplementation alters hepatic inflammation in a rat model of nonalcoholic steatohepatitis. Nutrients 2018, 10, 175. [Google Scholar] [CrossRef] [PubMed]
- Talavera-Urquijo, E.; Rodríguez-Navarro, S.; Beisani, M.; Salcedo-Allende, M.T.; Chakkur, A.; Arús-Avilés, M.; Cremades, M.; Augustin, S.; Martell, M.; Balibrea, J.M. Morphofunctional changes after sleeve gastrectomy and very low calorie diet in animal model of non-alcoholic fatty liver disease. Obes. Surg. 2018, 28, 142–151. [Google Scholar] [CrossRef] [PubMed]
- Huang, Y.; De Boer, W.B.; Adams, L.A.; Macquillan, G.; Rossi, E.; Rigby, P.; Raftopoulos, S.C.; Bulsara, M.; Jeffrey, G.P. Image analysis of liver collagen Sirius red is more acute and correlates better with serum fibrosis markers than trichrome. Liver Int. 2013, 33, 1249–1256. [Google Scholar] [CrossRef]
- Friedman, S.L.; Neuschwander-Tetri, B.A.; Rinella, M.; Sanyal, A.J. Mechanisms of NAFLD development and therapeutic strategies. Nat. Med. 2018, 24, 908–922. [Google Scholar] [CrossRef] [PubMed]
- Lehmann, J.; Praktiknjo, M.; Nielsen, M.J.; Schierwagen, R.; Meyer, C.; Thomas, S.; Violi, F.; Strassburg, C.P.; Bendtsen, F.; Møller, S.; et al. Collagen type IV remodeling gender-specifically predicts mortality in decompensated cirrhosis. Liver Int. 2019, 39, 885–893. [Google Scholar] [CrossRef] [PubMed]
- Mizuno, M.; Shima, T.; Oya, H.; Mitsumoto, Y.; Mizuno, C.; Isoda, S.; Kuramoto, M.; Taniguchi, M.; Noda, M.; Sakai, K.; et al. Classification of patients with non-alcoholic fatty liver disease using rapid immunoassay of serum type IV collagen compared with liver histology and other fibrosis markers. Hepatol. Res. 2017, 47, 216–225. [Google Scholar] [CrossRef]
- Zeng, W.; Shan, W.; Gao, L.; Gao, D.; Hu, Y.; Wang, G.; Zhang, N.; Li, Z.; Tian, X.; Xu, W.; et al. Inhibition of HMGB1 release via salvianolic acid B-mediated SIRT1 up-regulation products rats against non-alcoholic fatty liver disease. Sic. Rep. 2015, 5, 16013. [Google Scholar] [CrossRef]
- Panchal, S.K.; Poudyal, H.; Arumugam, T.V.; Brown, L. Rutin attenuates metabolic changes, nonalcoholic steatohepatitis, and cardiovascular remodeling in high-carbohydrate, high-fat diet-fed rats. J. Nutr. 2011, 141, 1062–1069. [Google Scholar] [CrossRef]
- Aragno, M.; Mastrocola, R. Dietary sugars and endogenous formation of advanced glycation endproducts: Emerging mechanisms of disease. Nutrients 2017, 9, 385. [Google Scholar] [CrossRef] [PubMed]
- Gugliucci, A. Formation of fructose-mediated advanced glycation end products and their roles in metabolic and inflammatory diseases. Adv. Nutr. 2017, 8, 54–62. [Google Scholar] [CrossRef] [PubMed]
- Hsieh, C.C.; Liao, C.C.; Liao, Y.C.; Hwang, L.S.; Wu, L.Y.; Hsieh, S.C. Proteomic changes associated with metabolic syndrome in a fructose-fed rat model. J. Food Drug Anal. 2016, 24, 754–761. [Google Scholar] [CrossRef] [PubMed]
- Sakamuri, A.; Pitla, S.; Putcha, U.K.; Jayapal, S.; Pothana, S.; Vadakattu, S.S.; Konapalli, N.R.; Sakamuri, S.S.; Ibrahim, A. Transient decrease in circulatory testosterone and homocysteine precedes the development of metabolic syndrome features in fructose-fed Sprague Dawley rats. J. Nutr. Metab. 2016, 2016, 7510840. [Google Scholar] [CrossRef] [PubMed]
- Patel, C.; Sugimoto, K.; Douard, V.; Shah, A.; Inui, H.; Yamanouchi, T.; Ferraris, R.P. Effect of dietary fructose on portal and systemic serum fructose levels in rats and in KHK-/- and GLUT5-/- mice. Am. J. Physiol. Gastrointest. Liver Physiol. 2015, 309, G779–G790. [Google Scholar] [CrossRef] [PubMed]
- Yagi, M.; Yonei, Y. Glycative stress and anti-aging: 10. Glycative stress and liver disease. Glycative Stress Res. 2018, 5, 177–180. [Google Scholar] [CrossRef]


| Parameters | Control (n = 5) | HFCS (n = 5) |
|---|---|---|
| Normal diet (g) | 16.9 ± 0.5 | 12.0 ± 0.4 ** |
| Crude protein in the normal diet (g) | 4.2 ± 0.1 | 3.0 ± 0.1 ** |
| Crude fat in the normal diet (g) | 0.85 ± 0.03 | 0.60 ± 0.02 ** |
| NFE in the normal diet (g) | 8.4 ± 0.2 | 6.0 ± 0.2 ** |
| HFCS beverage (mL) | 127.4 ± 5.6 | |
| Fructose from the HFCS beverage (g) | 7.2 ± 0.3 | |
| Glucose from the HFCS beverage (g) | 5.9 ± 0.3 | |
| Energy from the normal diet (kcal) | 58.1 ± 1.7 | 41.3 ± 1.4 ** |
| Energy from the HFCS beverage (kcal) | 48.2 ± 2.1 | |
| Body weight (g) | 496.0 ± 8.7 | 527.8 ± 14.4 |
| Liver weight (g) | 15.6 ± 0.5 | 18.0 ± 0.8 |
| Liver index (g/kg) | 31.5 ± 0.6 | 34.0 ± 0.7 * |
| Parameters | Control (n = 5) | HFCS (n = 5) |
|---|---|---|
| TAGE (U/mL) | 10.08 ± 0.36 | 14.58 ± 0.47 ** |
| Glucose (mM) | 9.70 ± 0.51 | 14.08 ± 0.73 ** |
| Glycoalbumin (%) | 1.30 ± 0.22 | 1.70 ± 0.18 |
| BUN (mM) | 8.92 ± 0.32 | 4.29 ± 0.54 ** |
| UA (μM) | 197.47 ± 10.02 | 222.46 ± 8.33 |
| Ca (mM) | 2.64 ± 0.04 | 2.82 ± 0.01 |
| AST (IU/L) | 134.4 ± 19.3 | 88.2 ± 7.2 |
| ALT (IU/L) | 72.0 ± 6.0 | 41.2 ± 2.2 ** |
| LDH (IU/L) | 944.8 ± 143.3 | 780.6 ± 89.9 |
| CK (IU/L) | 910.2 ± 174.0 | 653.2 ± 74.7 |
| T-CHO (mM) | 2.42 ± 0.08 | 2.73 ± 0.19 |
| TG (mM) | 0.79 ± 0.13 | 1.61 ± 0.36 * |
| LDL-C (mM) | 0.22 ± 0.02 | 0.20 ± 0.01 |
| T-BIL (μM) | 0.68 ± 0.05 | 0.82 ± 0.10 |
| Group | N | Steatosis | Inflammation | Ballooning | Score |
|---|---|---|---|---|---|
| 0 1 2 3 | 0 1 2 3 | 0 1 2 | |||
| Control | 5 | 5 0 0 0 | 5 0 0 0 | 5 0 0 | 0 |
| HFCS | 5 | 5 0 0 0 | 5 0 0 0 | 5 0 0 | 0 |
| Parameters | Control (n = 5) | LB (n = 5) |
|---|---|---|
| Normal diet (g) | 19.9 ± 0.7 | 10.3 ± 0.6 ** |
| Crude protein in the normal diet (g) | 5.0 ± 0.2 | 2.6 ± 0.2 ** |
| Crude fat in the normal diet (g) | 0.87 ± 0.03 | 0.45 ± 0.03 ** |
| NEF in the normal diet (g) | 9.9 ± 0.4 | 5.1 ± 0.3 ** |
| Lactobacillus beverage (mL) | 54.8 ± 3.8 | |
| Crude protein in the Lactobacillus beverage (g) | 0.4 ± 0.0 | |
| Crude fat in the Lactobacillus beverage (g) | 0.08 ± 0.01 | |
| Fructose in the Lactobacillus beverage (g) | 2.8 ± 0.2 | |
| Glucose in the Lactobacillus beverage (g) | 3.0 ± 0.2 | |
| Sucrose in the Lactobacillus beverage (g) | 2.3 ± 0.2 | |
| Lactose in the Lactobacillus beverage (g) | 0.8 ± 0.1 | |
| Other carbohydrates in the Lactobacillus beverage (g) | 0.8 ± 0.1 | |
| Energy from the normal diet (kcal) | 67.4 ± 2.5 | 35.0 ± 2.1 ** |
| Energy from the Lactobacillus beverage (kcal) | 42.2 ± 2.6 | |
| Body weight (g) | 478.8 ± 14.9 | 481.8 ± 8.9 |
| Liver weight (g) | 14.3 ± 0.4 | 14.8 ± 0.5 |
| Liver index (g/kg) | 29.9 ± 0.4 | 30.8 ± 0.8 |
| Parameters | Control (n = 5) | LB (n = 5) |
|---|---|---|
| TAGE (U/mL) | 10.12 ± 0.22 | 10.02 ± 0.83 |
| Glucose (mM) | 9.73 ± 0.41 | 14.65 ± 1.42 ** |
| Glycoalbumin (%) | 1.78 ± 0.16 | 1.34 ± 0.43 |
| BUN (mM) | 9.77 ± 0.44 | 6.34 ± 0.63 ** |
| UA (μM) | 173.68 ± 12.67 | 205.80 ± 25.56 |
| Ca (mM) | 2.64 ± 0.02 | 2.70 ± 0.01 |
| AST (IU/L) | 142.2 ± 6.5 | 109.6 ± 25.9 |
| ALT (IU/L) | 70.6 ± 8.0 | 69.4 ± 29.7 |
| LDH (IU/L) | 831.6 ± 69.9 | 1071.2 ± 310.4 |
| CK (IU/L) | 917.8 ± 69.3 | 900.2 ± 122.5 |
| T-CHO (mM) | 1.96 ± 0.15 | 2.45 ± 0.27 |
| TG (mM) | 0.73 ± 0.17 | 1.04 ± 0.25 |
| LDL-C (mM) | 0.17 ± 0.01 | 0.15 ± 0.01 |
| T-BIL (μM) | 0.51 ± 0.05 | 0.55 ± 0.10 |
| Group | N | Steatosis | Inflammation | Ballooning | Score |
|---|---|---|---|---|---|
| 0 1 2 3 | 0 1 2 3 | 0 1 2 | |||
| Control | 5 | 5 0 0 0 | 5 0 0 0 | 5 0 0 | 0 |
| LB beverages | 5 | 5 0 0 0 | 5 0 0 0 | 5 0 0 | 0 |
© 2019 by the authors. Licensee MDPI, Basel, Switzerland. This article is an open access article distributed under the terms and conditions of the Creative Commons Attribution (CC BY) license (http://creativecommons.org/licenses/by/4.0/).
Share and Cite
Takata, T.; Sakasai-Sakai, A.; Takino, J.-i.; Takeuchi, M. Evidence for Toxic Advanced Glycation End-Products Generated in the Normal Rat Liver. Nutrients 2019, 11, 1612. https://doi.org/10.3390/nu11071612
Takata T, Sakasai-Sakai A, Takino J-i, Takeuchi M. Evidence for Toxic Advanced Glycation End-Products Generated in the Normal Rat Liver. Nutrients. 2019; 11(7):1612. https://doi.org/10.3390/nu11071612
Chicago/Turabian StyleTakata, Takanobu, Akiko Sakasai-Sakai, Jun-ichi Takino, and Masayoshi Takeuchi. 2019. "Evidence for Toxic Advanced Glycation End-Products Generated in the Normal Rat Liver" Nutrients 11, no. 7: 1612. https://doi.org/10.3390/nu11071612
APA StyleTakata, T., Sakasai-Sakai, A., Takino, J.-i., & Takeuchi, M. (2019). Evidence for Toxic Advanced Glycation End-Products Generated in the Normal Rat Liver. Nutrients, 11(7), 1612. https://doi.org/10.3390/nu11071612