Designing Optimal Breakfast for the United States Using Linear Programming and the NHANES 2011–2014 Database: A Study from the International Breakfast Research Initiative (IBRI)


Abstract
1. Introduction
2. Materials and Methods
2.1. Study Population and Dietary Data
2.2. Food Categories and Food Groups
2.3. Measures of Dietary Quality
2.4. Linear Programming Applied to T1 Breakfast
2.5. Analytical Approach
2.6. Data Availability and Ethical Approval
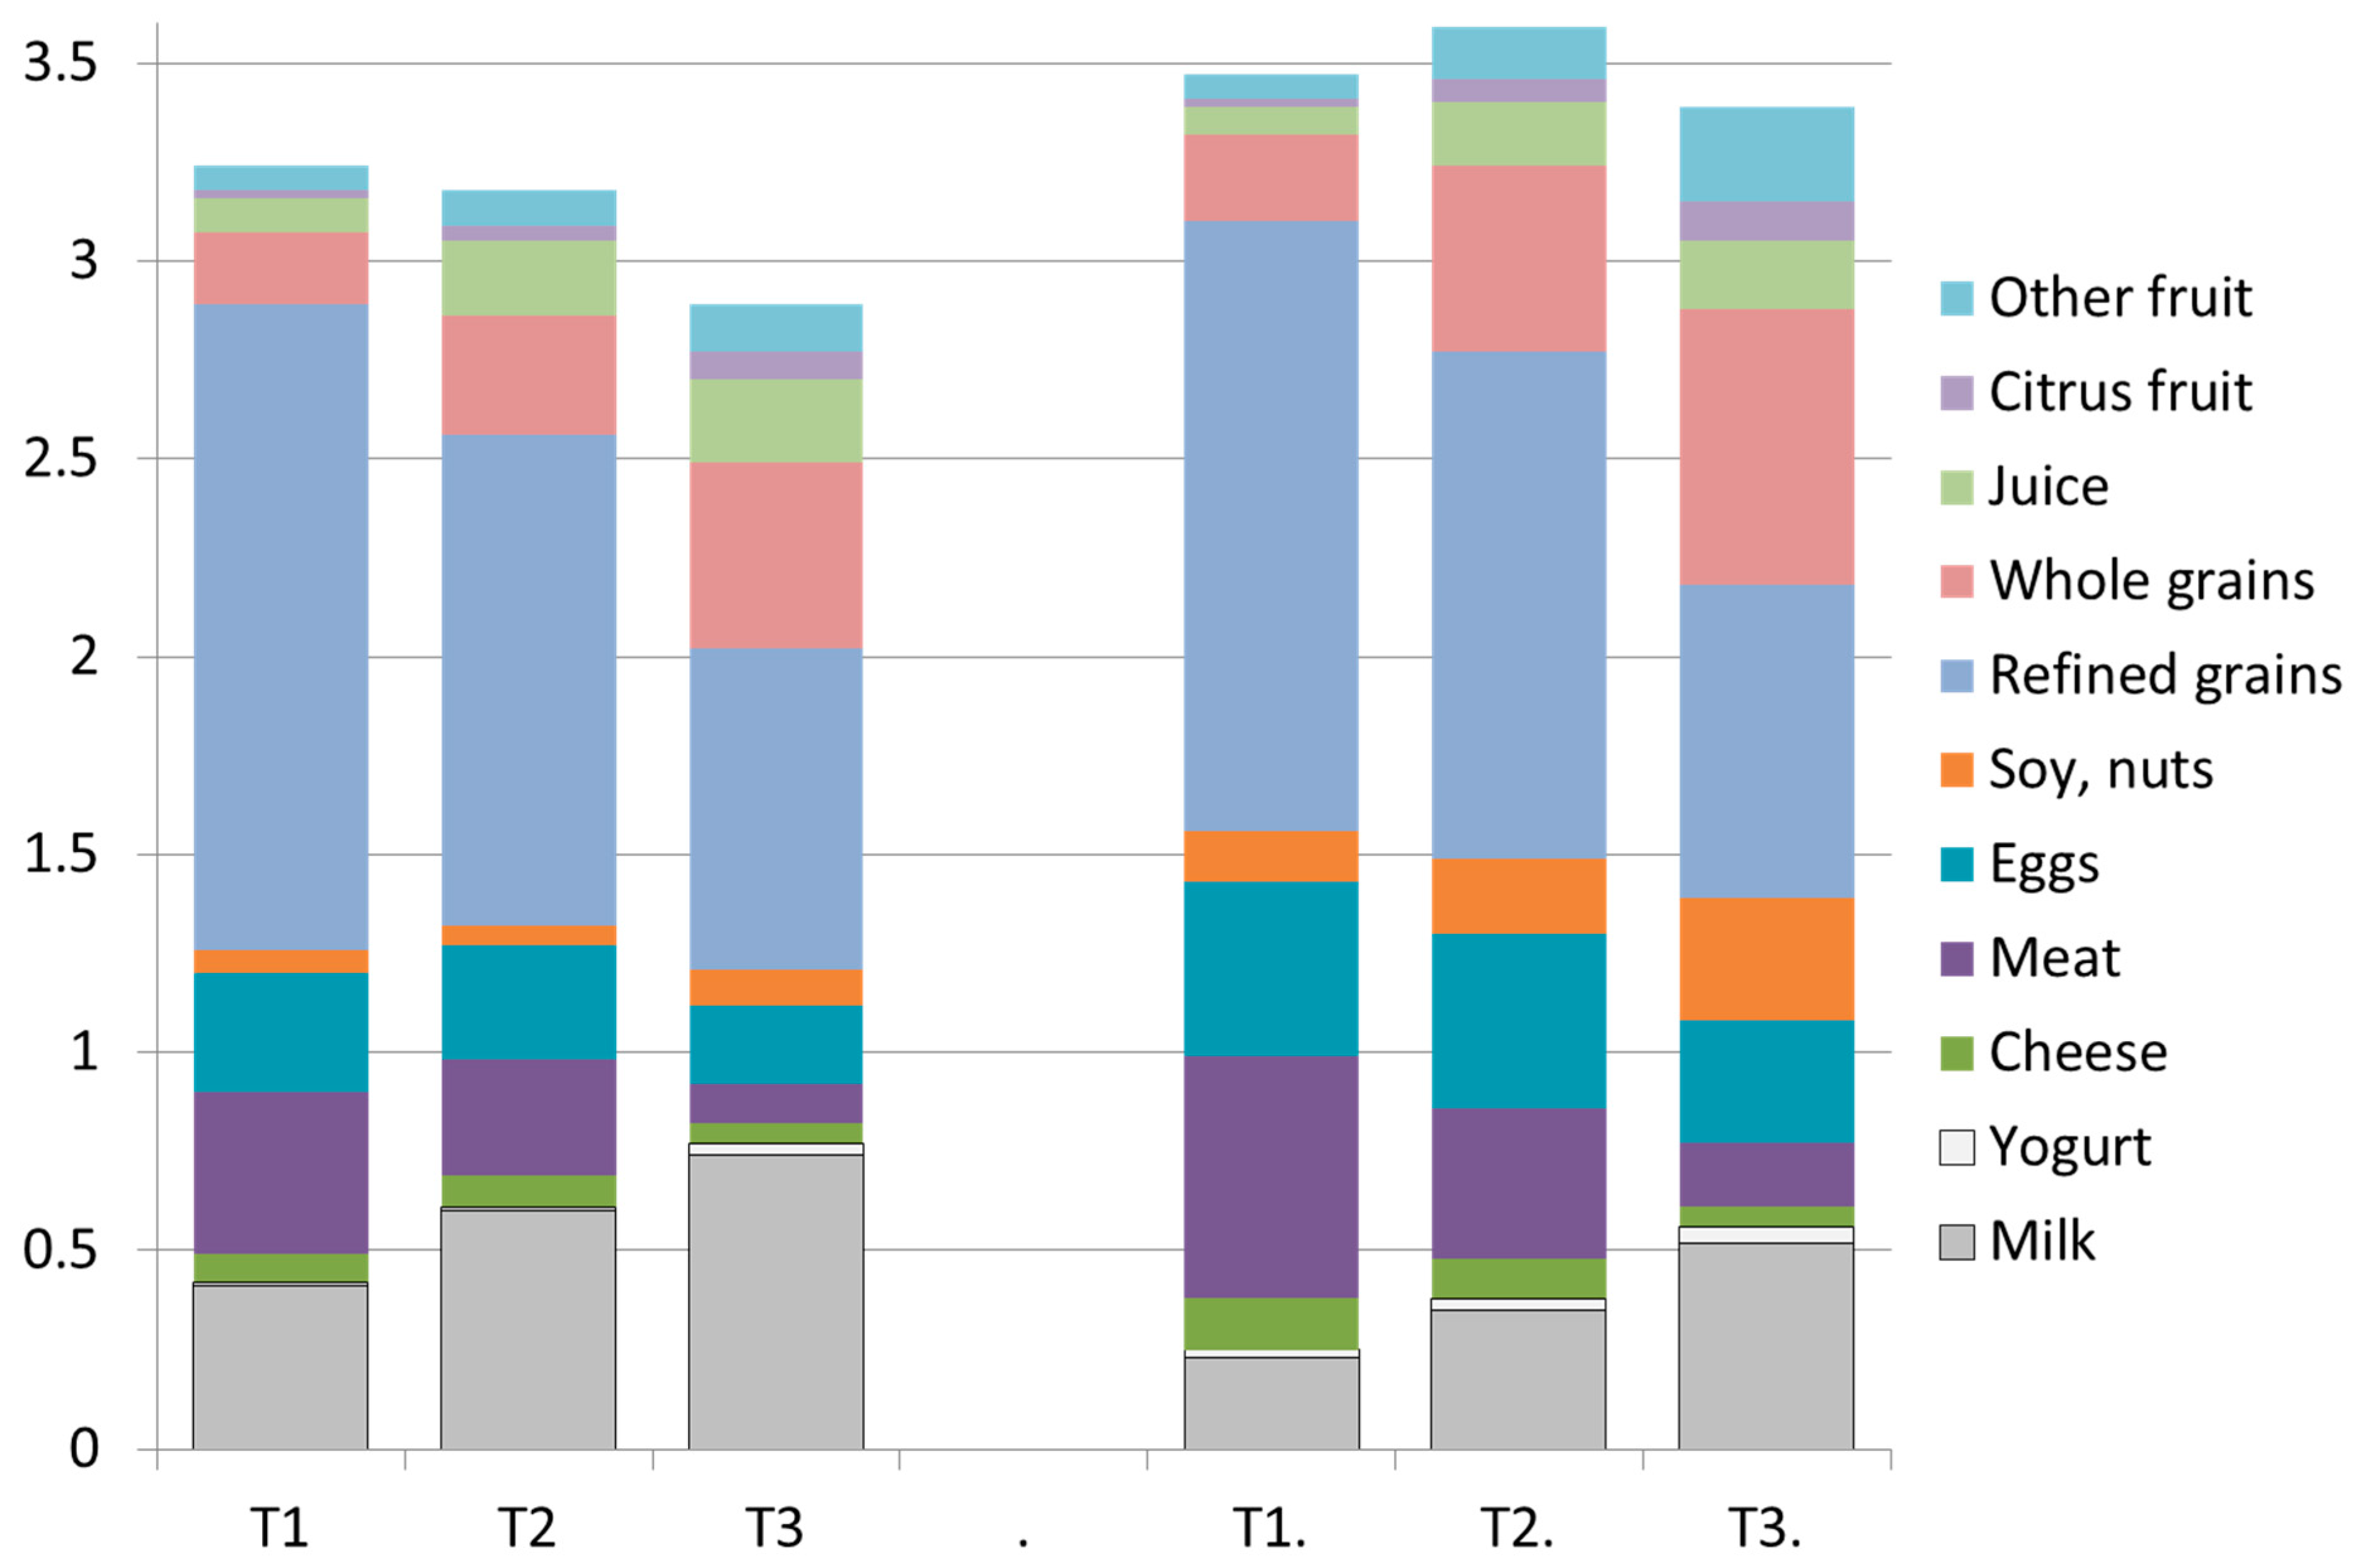
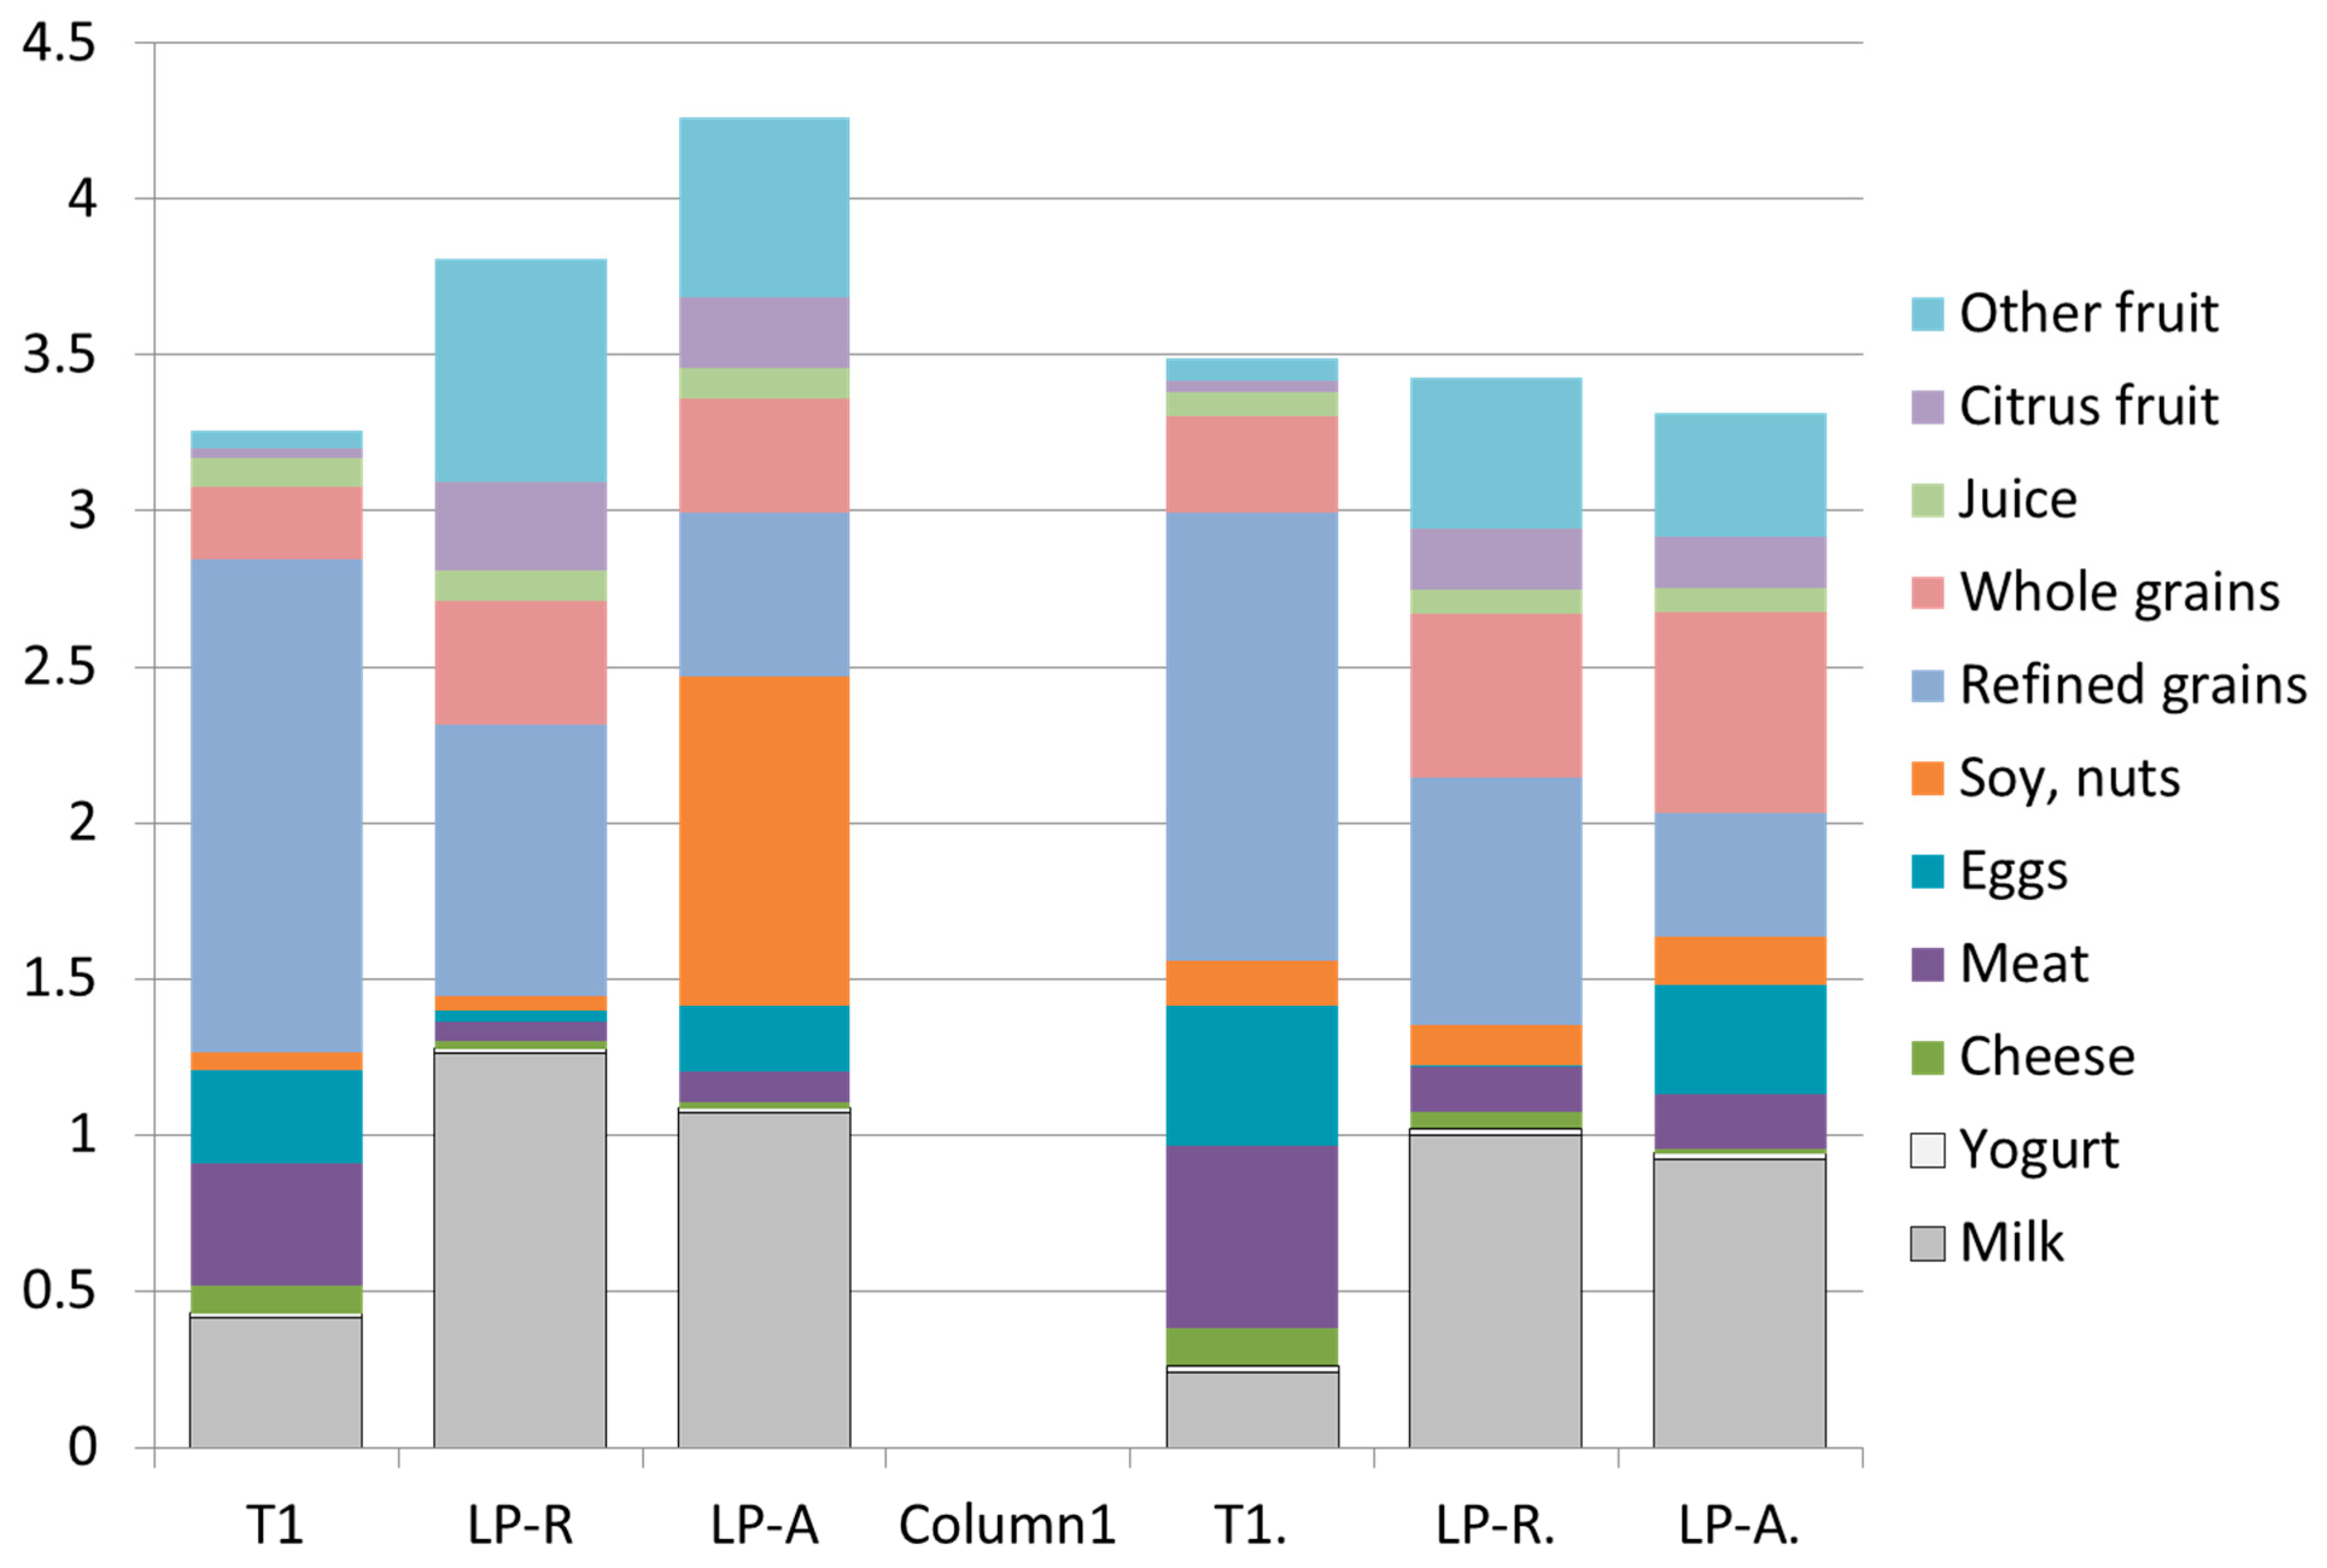
3. Results
Comparing Existing and LP-Modeled Breakfasts
4. Discussion
5. Conclusions
Supplementary Materials
Author Contributions
Funding
Acknowledgments
Conflicts of Interest
References
- Gibney, M.; Barr, S.; Bellisle, F.; Drewnowski, A.; Fagt, S.; Livingstone, B.; Masset, G.; Varela Moreiras, G.; Moreno, L.A.; Smith, J.; et al. Breakfast in Human Nutrition: The International Breakfast Research Initiative. Nutrients 2018, 10, 559. [Google Scholar] [CrossRef] [PubMed]
- Gibney, M.; Barr, S.; Bellisle, F.; Drewnowski, A.; Fagt, S.; Hopkins, S.; Livingstone, B.; Varela-Moreiras, G.; Moreno, L.; Smith, J.; et al. Towards an Evidence-Based Recommendation for a Balanced Breakfast—A Proposal from the International Breakfast Research Initiative. Nutrients 2018, 10, 1540. [Google Scholar] [CrossRef] [PubMed]
- Albertson, A.M.; Wold, A.C.; Joshi, N. Ready-to-Eat Cereal Consumption Patterns: The Relationship to Nutrient Intake, Whole Grain Intake, and Body Mass Index in an Older American Population. J. Aging Res. 2012, 2012, 631310. [Google Scholar] [CrossRef] [PubMed]
- O’Neil, C.E.; Nicklas, T.A.; Fulgoni, V.L. Nutrient Intake, Diet Quality, and Weight/Adiposity Parameters in Breakfast Patterns Compared with No Breakfast in Adults: National Health and Nutrition Examination Survey 2001–2008. J. Acad. Nutr. Diet. 2014, 114, S27–S43. [Google Scholar] [CrossRef] [PubMed]
- Betts, J.A.; Chowdhury, E.A.; Gonzalez, J.T.; Richardson, J.D.; Tsintzas, K.; Thompson, D. Is breakfast the most important meal of the day? Proc. Nut. Soc. 2016, 75, 464–474. [Google Scholar] [CrossRef] [PubMed]
- Merten, M.; Williams, A.; Shriver, L. Breakfast Consumption in Adolescence and Young Adulthood: Parental Presence, Community Context, and Obesity. J. Am. Diet. Assoc. 2009, 109, 1384. [Google Scholar] [CrossRef] [PubMed]
- Susan, I.B.; Hassan, V.; Jessica, S. Breakfast in Canada: Prevalence of Consumption, Contribution to Nutrient and Food Group Intakes, and Variability across Tertiles of Daily Diet Quality. A Study from the International Breakfast Research Initiative. Nutrients 2018, 10, 985. [Google Scholar] [CrossRef]
- Fagt, S.; Matthiessen, J.; Thyregod, C.; Kørup, K.; Biltoft-Jensen, A. Breakfast in Denmark. Prevalence of Consumption, Intake of Foods, Nutrients and Dietary Quality. A Study from the International Breakfast Research Initiative. Nutrients 2018, 10, 1085. [Google Scholar] [CrossRef]
- Bellisle, F.; Hébel, P.; Salmon-Legagneur, A.; Vieux, F. Breakfast Consumption in French Children, Adolescents, and Adults: A Nationally Representative Cross-Sectional Survey Examined in the Context of the International Breakfast Research Initiative. Nutrients 2018, 10, 1056. [Google Scholar] [CrossRef]
- Ruiz, E.; Ávila, J.M.; Valero, T.; Rodriguez, P.; Varela-Moreiras, G. Breakfast Consumption in Spain: Patterns, Nutrient Intake and Quality. Findings from the ANIBES Study, a Study from the International Breakfast Research Initiative. Nutrients 2018, 10, 1324. [Google Scholar] [CrossRef]
- Gaal, S.; Kerr, M.A.; Ward, M.; McNulty, H.; Livingstone, M.B.E. Breakfast Consumption in the UK: Patterns, Nutrient Intake and Diet Quality. A Study from the International Breakfast Research Initiative Group. Nutrients 2018, 10, 999. [Google Scholar] [CrossRef] [PubMed]
- Drewnowski, A.; Rehm, C.D.; Vieux, F. Breakfast in the United States: Food and Nutrient Intakes in Relation to Diet Quality in National Health and Examination Survey 2011–2014. A Study from the International Breakfast Research Initiative. Nutrients 2018, 10, 1200. [Google Scholar] [CrossRef] [PubMed]
- Gibney, M.J.; Uzhova, I. Breakfast: Shaping Guidelines for Food and Nutrient Patterns. In Nurturing a Healthy Generation of Children: Research Gaps and Opportunities; Nestle Nutr Inst Workshop Ser; S. Karger AG.: Basel, Switzerland, 2019; Volume 91, pp. 133–142. [Google Scholar]
- Maillot, M.; Vieux, F.; Amiot, M.; Darmon, N. Individual diet modeling translates nutrient recommendations into realistic and individual-specific food choices. Am. J. Clin. Nutr. 2010, 91, 421. [Google Scholar] [CrossRef] [PubMed]
- Gazan, R.; Brouzes, C.; Vieux, F.; Maillot, M.; Lluch, A.; Darmon, N. Mathematical Optimization to Explore Tomorrow’s Sustainable Diets: A Narrative Review. Adv. Nutr. 2018, 9, 602–616. [Google Scholar] [CrossRef] [PubMed]
- Darmon, N.; Vieux, F.; Maillot, M.; Volatier, J.-L.; Martin, A. Nutrient profiles discriminate between foods according to their contribution to nutritionally adequate diets: A validation study using linear programming and the SAIN, LIM system. Am. J. Clin. Nutr. 2009, 89, 1227. [Google Scholar] [CrossRef] [PubMed]
- Maillot, M.; Ferguson, E.; Drewnowski, A.; Darmon, N. Nutrient Profiling Can Help Identify Foods of Good Nutritional Quality for Their Price: A Validation Study with Linear Programming. J. Nutr. 2008, 138, 1107–1113. [Google Scholar] [CrossRef]
- Wilde, P.E.; Llobrera, J. Using the Thrifty Food Plan to Assess the Cost of a Nutritious Diet. J. Consum. Aff. 2009, 43, 274–304. [Google Scholar] [CrossRef]
- Carlson, A.; Lino, M.; Juan, W.; Hanson, K.; Basiotis, P.P. Thrifty Food Plan, 2006; US Department of Agriculture: Alexandria, VA, USA, 2007.
- Ferguson, E.L.; Darmon, N.; Briend, A.; Premachandra, I.M. Food-based dietary guidelines can be developed and tested using linear programming analysis. J. Nutr. 2004, 134, 951. [Google Scholar] [CrossRef]
- Perignon, M.; Masset, G.; Ferrari, G.; Barré, T.; Vieux, F.; Maillot, M.; Amiot, M.J.; Darmon, N. How low can dietary greenhouse gas emissions be reduced without impairing nutritional adequacy, affordability and acceptability of the diet? A modelling study to guide sustainable food choices. Public Health Nutr. 2016, 19, 2662–2674. [Google Scholar] [CrossRef]
- Masset, G.; Vieux, F.; Verger, E.; Soler, L.-G.; Touazi, D.; Darmon, N. Reducing energy intake and energy density for a sustainable diet: A study based on self-selected diets in French adults. Am. J. Clin. Nutr. 2014, 99, 1460. [Google Scholar] [CrossRef]
- CDC. About the National Health and Nutrition Examination Survey (NHANES). 2013. Available online: https://www.cdc.gov/nchs/nhanes/about_nhanes.htm (accessed on 25 April 2019).
- CDC. NCHS Research Ethics Review Board (ERB) Approval 2012. 2012. Available online: https://www.cdc.gov/nchs/nhanes/irba98.htm (accessed on 25 April 2019).
- CDC. National Health and Nutrition Examination Survey Questionnaire: Dietary Interview Component. 2018. Available online: https://wwwn.cdc.gov/nchs/nhanes/ContinuousNhanes/Questionnaires.aspx?BeginYear=2015 (accessed on 13 June 2019).
- CDC. National Health and Nutrition Examination Survey Questionnaire: Phone Follow-Up Dietary Interviewer Procedures. 2012. Available online: https://www.cdc.gov/nchs/data/nhanes/nhanes_11_12/Phone_Follow-up_Dietary_Procedures.pdf (accessed on 13 June 2019).
- U.S. Department of Agriculture, Agricultural Research Service. Nutrient Intakes from Food and Beverages: Mean Amounts Consumed per Individual, by Gender and Age, What We Eat in America, NHANES 2001–2012. Available online: http://www.ars.usda.gov/Services/docs.htm?docid=18349 (accessed on 13 June 2019).
- US Department of Agriculture, Agricultural Research Service. What are WWEIA Food Categories? 2018. Available online: https://www.ars.usda.gov/northeast-area/beltsville-md-bhnrc/beltsville-human-nutrition-research-center/food-surveys-research-group/docs/dmr-food-categories/ (accessed on 13 June 2019).
- Mainardi, F.; Drewnowski, A.; Green, H. Personalized Nutrient Profiling of Food Patterns: Nestlé’s Nutrition Algorithm Applied to Dietary Intakes from NHANES. Nutrients 2019, 11, 379. [Google Scholar] [CrossRef] [PubMed]
- Agricultural Research Service. Nutrient Data Laboratory. USDA National Nutrient Database for Standard Reference. United States Department of Agriculture, 2018. Available online: https://ndb.nal.usda.gov/ndb/ (accessed on 9 May 2019).
- Food Surveys Research Group. Food Patterns Equivalents Database (FPED). 2017. Available online: https://data.nal.usda.gov/dataset/food-patterns-equivalents-database-fped (accessed on 25 April 2019).
- Drewnowski, A. The Nutrient Rich Foods Index helps to identify healthy, affordable foods. Am. J. Clin. Nutr. 2010, 91, 1095S. [Google Scholar] [CrossRef]
- U.S. Department of Health and Human Services and U.S. Department of Agriculture. 2015—2020 Dietary Guidelines for Americans, 8th ed. December 2015. Available online: https://health.gov/dietaryguidelines/2015/guidelines/ (accessed on 9 May 2019).
- Hill, K.M.; Jonnalagadda, S.S.; Albertson, A.M.; Joshi, N.A.; Weaver, C.M. Top food sources contributing to vitamin D intake and the association of ready-to-eat cereal and breakfast consumption habits to vitamin D intake in Canadians and United States Americans. J. Food Sci. 2012, 77, H170–H175. [Google Scholar] [CrossRef]
- Krebs-Smith, S.M.; Pannucci, T.E.; Subar, A.F.; Kirkpatrick, S.I.; Lerman, J.L.; Tooze, J.A.; Wilson, M.M.; Reedy, J. Update of the healthy eating index: HEI-2015. J. Acad. Nutr. Diet. 2018, 118, 1591–1602. [Google Scholar] [CrossRef] [PubMed]
- Food and Drug Administration. Food Labeling: Revision of the Nutrition and Supplement Facts Labels and Serving Sizes of Foods That Can Reasonably Be Consumed at One Eating Occasion; Dual-Column Labeling; Updating, Modifying, and Establishing Certain Reference Amounts Customarily Consumed; Serving Size for Breath Mints; and Technical Amendments; Extension of Compliance Dates. May 2018. Available online: https://www.federalregister.gov/documents/2018/05/04/2018-09476/food-labeling-revision-of-the-nutrition-and-supplement-facts-labels-and-serving-sizes-of-foods-that (accessed on 13 June 2019).
- CDC. National Health and Nutrition Examination Survey Data. Available online: https://wwwn.cdc.gov/nchs/nhanes/continuousnhanes/default.aspx (accessed on 13 June 2019).
- Colombo, P.E.; Patterson, E.; Elinder, L.S.; Lindroos, A.K.; Sonesson, U.; Darmon, N.; Parlesak, A. Optimizing School Food Supply: Integrating Environmental, Health, Economic, and Cultural Dimensions of Diet Sustainability with Linear Programming. Preprints 2019, 2019030178. [Google Scholar]
- Fulgoni, V., III; Drewnowski, A. An Economic Gap Between the Recommended Healthy Food Patterns and Existing Diets of Minority Groups in the US National Health and Nutrition Examination Survey 2013–14. Front. Nutr. 2019, 6, 37. [Google Scholar] [CrossRef] [PubMed]


| All Breakfast Consumers | T1 Breakfast Consumers | |||||
|---|---|---|---|---|---|---|
| All (11,565) | Children (3296) | Adults (8269) | T1 n = 4020 | Children (1144) | Adults (2876) | |
| Overall | 433.34 (4.90) | 444.00 (4.72) | 257.80 (5.34) | 254.75 (2.01) | ||
| Gender | ||||||
| Male | 5663 | 437.14 (5.18) | 426.02 (4.99) | 2,084 | 264.14 (8.09) | 253.12 (3.23) |
| Female | 5902 | 429.33 (7.06) | 460.47 (5.6) | 1936 | 251.40 (7.27) | 256.69 (3.33) |
| 0.3057 | <0.0001 | 0.2642 | 0.4977 | |||
| Race/ethnicity | ||||||
| NH White | 4346 | 419.04 (9.94) | 448.84 (6.32) | 1586 | 248.92 (7.84) | 254.36 (2.71) |
| NH Black | 2664 | 413.2 (6.45) | 390.32 (5.94) | 1161 | 268.86 (7.29) | 248.87 (5.01) |
| Mex-American | 1647 | 475.2 (7.66) | 444.35 (7.13) | 472 | 273.36 (5.90) | 258.15 (4.58) |
| Asian | 1303 | 487.78 (15.42) | 494.84 (6.09) | 286 | 266.35 (12.93) | 280.37 (7.15) |
| Hispanic | 1164 | 449.84 (14.98) | 450.69 (6.59) | 357 | 263.15 (9.90) | 268.69 (8.41) |
| Other | 441 | 431.37 (17.84) | 418.97 (20.58) | 158 | 283.22 (13.18) | 223.80 (21.72) |
| <0.0001 | <0.0001 | 0.0395 | 0.0051 | |||
| Family IPR 1 | ||||||
| <1.3 | 3912 | 433.43 (7.32) | 403.39 (6.32) | 1,558 | 259.31 (8.86) | 225.59 (5.37) |
| 1.3–1.849 | 1310 | 440.97 (14.37) | 426.8 (8.91) | 478 | 255.79 (12.93) | 253.34 (7.99) |
| 1.85–2.99 | 1683 | 410.48 (12.55) | 430.64 (8.13) | 607 | 261.32 (10.89) | 253.09 (6.34) |
| ≥3.0 | 3835 | 439.37 (10.33) | 471.28 (5.74) | 1124 | 255.90 (6.52) | 277.76 (3.79) |
| 0.1950 | <0.0001 | 0.9600 | <0.0001 | |||
| Education 2 | ||||||
| <HS | 1625 | 414.25 (5.45) | 596 | 231.35 (5.80) | ||
| High school | 1707 | 404.21 (7.99) | 757 | 241.63 (4.35) | ||
| Some college | 2362 | 436.24 (6.83) | 864 | 256.19 (3.88) | ||
| ≥College | 2181 | 495.28 (6.93) | 476 | 291.48 (4.73) | ||
| <0.0001 | <0.0001 | |||||
| What We Eat in America | Category | Children | Adults | ||||
|---|---|---|---|---|---|---|---|
| T1 | Optimized | T1 | Optimized | ||||
| Relative | Absolute | Relative | Absolute | ||||
| Beverages | Coffee & Tea | 24.3 | 24.3 | 24.3 | 231.4 | 231.4 | 231.4 |
| Diet Beverages | 2.6 | 2.6 | 2.6 | 12.4 | 12.4 | 12.4 | |
| Sweetened Beverages | 55.9 | 55.9 | 55.9 | 75.5 | 75.5 | 75.5 | |
| Fats & Oils | Fats & Oils | 1.7 | 1.7 | 0 | 9.1 | 9.1 | 9.1 |
| Fruit | Fruit | 8.9 | 145.7 | 116.2 | 9.3 | 92.1 | 77.1 |
| 100% Juice | 19.5 | 19.5 | 19.5 | 15.8 | 15.8 | 15.8 | |
| Grains | Breads | 7.3 | 7.3 | 7.3 | 16.2 | 16.2 | 0 |
| Cooked grains | 6.9 | 6.9 | 6.9 | 8.4 | 8.4 | 8.4 | |
| Grains | 0.9 | 0.9 | 0.9 | 1.3 | 1.3 | 1.3 | |
| Quick Breads | 20.0 | 13.7 | 0 | 11.6 | 0 | 0 | |
| High Sugar RTE Cereal | 6.4 | 24.2 | 6.4 | 3.3 | 22.9 | 3.3 | |
| Low Sugar RTE Cereal | 0.8 | 0.8 | 11.2 | 1.7 | 1.7 | 27.9 | |
| Milk & Dairy | Cheese | 0.8 | 0.8 | 0 | 2.2 | 2.2 | 0 |
| Flavored Milk | 9.7 | 9.7 | 9.7 | 4.5 | 4.5 | 4.5 | |
| Milk | 75.1 | 288.0 | 243.6 | 32.8 | 227.6 | 203.6 | |
| Milk Dessert Drinks | 0.8 | 0.8 | 0.8 | 0.6 | 0.6 | 0.6 | |
| Yogurt | 2.7 | 2.7 | 2.7 | 4.5 | 4.5 | 4.5 | |
| Mixed Dishes | Mixed Dishes | 26.8 | 0 | 3.6 | 33.7 | 0 | 0 |
| Protein Foods | Eggs | 12.9 | 0 | 12.9 | 21.7 | 0 | 21.7 |
| Nuts, Beans & Soy | 0.5 | 0.5 | 25.0 | 1.8 | 1.8 | 1.8 | |
| Processed Meat | 6.4 | 0 | 0 | 9.1 | 0 | 0 | |
| Seafood/Meat | 2.2 | 2.2 | 2.2 | 4.9 | 4.9 | 4.9 | |
| Snacks & Sweets | Candy | 0.6 | 0.6 | 0.6 | 0.3 | 0.3 | 0.3 |
| Crackers | 0.5 | 0.5 | 0 | 0.4 | 0.4 | 0 | |
| Other Desserts | 0.3 | 0.3 | 0.3 | 1.0 | 1.0 | 1.0 | |
| Savory Snacks | 0.9 | 0.9 | 0.9 | 0.7 | 0.7 | 0.7 | |
| Snack/Meal Bars | 0.4 | 0.4 | 0.4 | 1.0 | 1.0 | 1.0 | |
| Sweet Bakery | 20.6 | 2.9 | 0.6 | 12.8 | 2.5 | 2.9 | |
| Sugars | Sugars | 7.5 | 7.5 | 7.5 | 8.6 | 8.6 | 8.6 |
| Vegetables | Vegetables, Non-potato | 0.4 | 0.4 | 0.4 | 2.2 | 2.2 | 2.2 |
| White Potatoes | 1.7 | 1.7 | 1.7 | 8.7 | 8.7 | 8.7 | |
| Nutrient | Children | Adults | |||||
|---|---|---|---|---|---|---|---|
| T1 | LP-R | LP-A | T1 | LP-R | LP-A | Guidelines | |
| Energy (kcal) | 440.9 | 500.0 | 500.0 | 480.7 | 500.0 | 489.1 | (300,500) |
| Added Sugar (g) | 4.7 | 5.1 | 3.6 | 4.9 | 5.4 | 4.7 | |
| Carbohydrates (g) | 60.7 | 88.0 | 73.6 | 61.3 | 84.5 | 77.3 | |
| PUFA (g) | 3.3 | 1.9 | 3.7 | 4.2 | 2.4 | 2.9 | |
| MUFA (g) | 5.8 | 3.4 | 6.3 | 7.1 | 4.0 | 4.9 | |
| Saturated Fat (g) | 6.1 | 5.1 | 5.6 | 6.5 | 5.2 | 5.4 | |
| Proteins (%) | 12.4 | 12.8 | 15.0 | 13.9 | 13.1 | 14.2 | |
| Carbohydrates (%E) | 55.1 | 70.4 | 58.9 | 51.0 | 67.6 | 63.2 | (55,75) |
| Added Sugars (%E) | 4.3 | 4.1 | 2.9 | 4.1 | 4.3 | 3.8 | <10 |
| Total Fat (%E) | 33.7 | 20.4 | 30.0 | 36.3 | 22.8 | 26.5 | (20,30) |
| SFA (%E) | 12.4 | 9.2 | 10.0 | 12.3 | 9.3 | 10.0 | <10 |
| Proteins (g) | 13.7 | 16.0 | 18.7 | 16.7 | 16.4 | 17.4 | >10 |
| Dietary Fiber (g) | 2.6 | 5.6 | 6.1 | 3.1 | 5.6 | 5.8 | >5.6 |
| Sodium (mg) | 630.9 | 460.0 | 460.0 | 742.7 | 460.0 | 460.0 | <460 |
| Vitamin A (g) | 195.3 | 373.9 | 284.9 | 186.1 | 316.9 | 360.3 | >90 |
| Thiamin (mg) | 0.4 | 0.7 | 0.5 | 0.4 | 0.6 | 0.6 | (>0.3,>0.2) |
| Riboflavin (mg) | 0.6 | 1.1 | 0.9 | 0.7 | 1.1 | 1.2 | (>0.5,>0.4) |
| Niacin (mg) | 5.0 | 7.5 | 6.5 | 5.8 | 7.6 | 7.9 | >4 |
| Vitamin B6 (mg) | 0.5 | 1.0 | 0.8 | 0.5 | 1.0 | 1.1 | >0.3 |
| Vitamin B12 (g) | 1.5 | 3.2 | 2.4 | 1.4 | 3.0 | 3.3 | (>0.6,>0.5) |
| Vitamin C (mg) | 15.4 | 43.9 | 35.7 | 16.9 | 32.9 | 32.7 | >18 |
| Vitamin D (µg) | 1.9 | 4.8 | 4.0 | 1.6 | 4.0 | 4.0 | >4 |
| Folate (g) | 103.5 | 191.4 | 184.7 | 100.7 | 187.6 | 230.9 | >80 |
| Calcium (mg) | 250.9 | 489.5 | 421.2 | 223.7 | 423.8 | 390.3 | (>390,>325) |
| Iron (mg) | 4.2 | 6.2 | 6.3 | 4.0 | 5.7 | 9.6 | >3.6 |
| Potassium (mg) | 434.4 | 940.0 | 940.0 | 578.9 | 966.2 | 940.0 | >940 |
| Magnesium (mg) | 45.7 | 84.0 | 98.6 | 61.9 | 96.1 | 95.7 | >84 |
| Zinc (mg) | 2.2 | 4.2 | 3.8 | 2.4 | 3.8 | 4.7 | >2.2 |
© 2019 by the authors. Licensee MDPI, Basel, Switzerland. This article is an open access article distributed under the terms and conditions of the Creative Commons Attribution (CC BY) license (http://creativecommons.org/licenses/by/4.0/).
Share and Cite
Vieux, F.; Maillot, M.; D. Rehm, C.; Drewnowski, A. Designing Optimal Breakfast for the United States Using Linear Programming and the NHANES 2011–2014 Database: A Study from the International Breakfast Research Initiative (IBRI). Nutrients 2019, 11, 1374. https://doi.org/10.3390/nu11061374
Vieux F, Maillot M, D. Rehm C, Drewnowski A. Designing Optimal Breakfast for the United States Using Linear Programming and the NHANES 2011–2014 Database: A Study from the International Breakfast Research Initiative (IBRI). Nutrients. 2019; 11(6):1374. https://doi.org/10.3390/nu11061374
Chicago/Turabian StyleVieux, Florent, Matthieu Maillot, Colin D. Rehm, and Adam Drewnowski. 2019. "Designing Optimal Breakfast for the United States Using Linear Programming and the NHANES 2011–2014 Database: A Study from the International Breakfast Research Initiative (IBRI)" Nutrients 11, no. 6: 1374. https://doi.org/10.3390/nu11061374
APA StyleVieux, F., Maillot, M., D. Rehm, C., & Drewnowski, A. (2019). Designing Optimal Breakfast for the United States Using Linear Programming and the NHANES 2011–2014 Database: A Study from the International Breakfast Research Initiative (IBRI). Nutrients, 11(6), 1374. https://doi.org/10.3390/nu11061374