Consumption of Ready-to-Eat Cereal in Canada and Its Contribution to Nutrient Intake and Nutrient Density among Canadians

 ,
,  ,
, 
Abstract
:1. Background
2. Subject and Method
2.1. Data Source and Analyical Sample
2.1.1. Dietary Data Collection
2.1.2. Descriptive Characteristics
2.1.3. Daily Nutrients and Energy Intake
2.1.4. Consumption of Milk and RTEC
2.1.5. Diet Quality Index
2.2. Method
3. Results
3.1. Prevalence of RTEC Consumption at the National Level
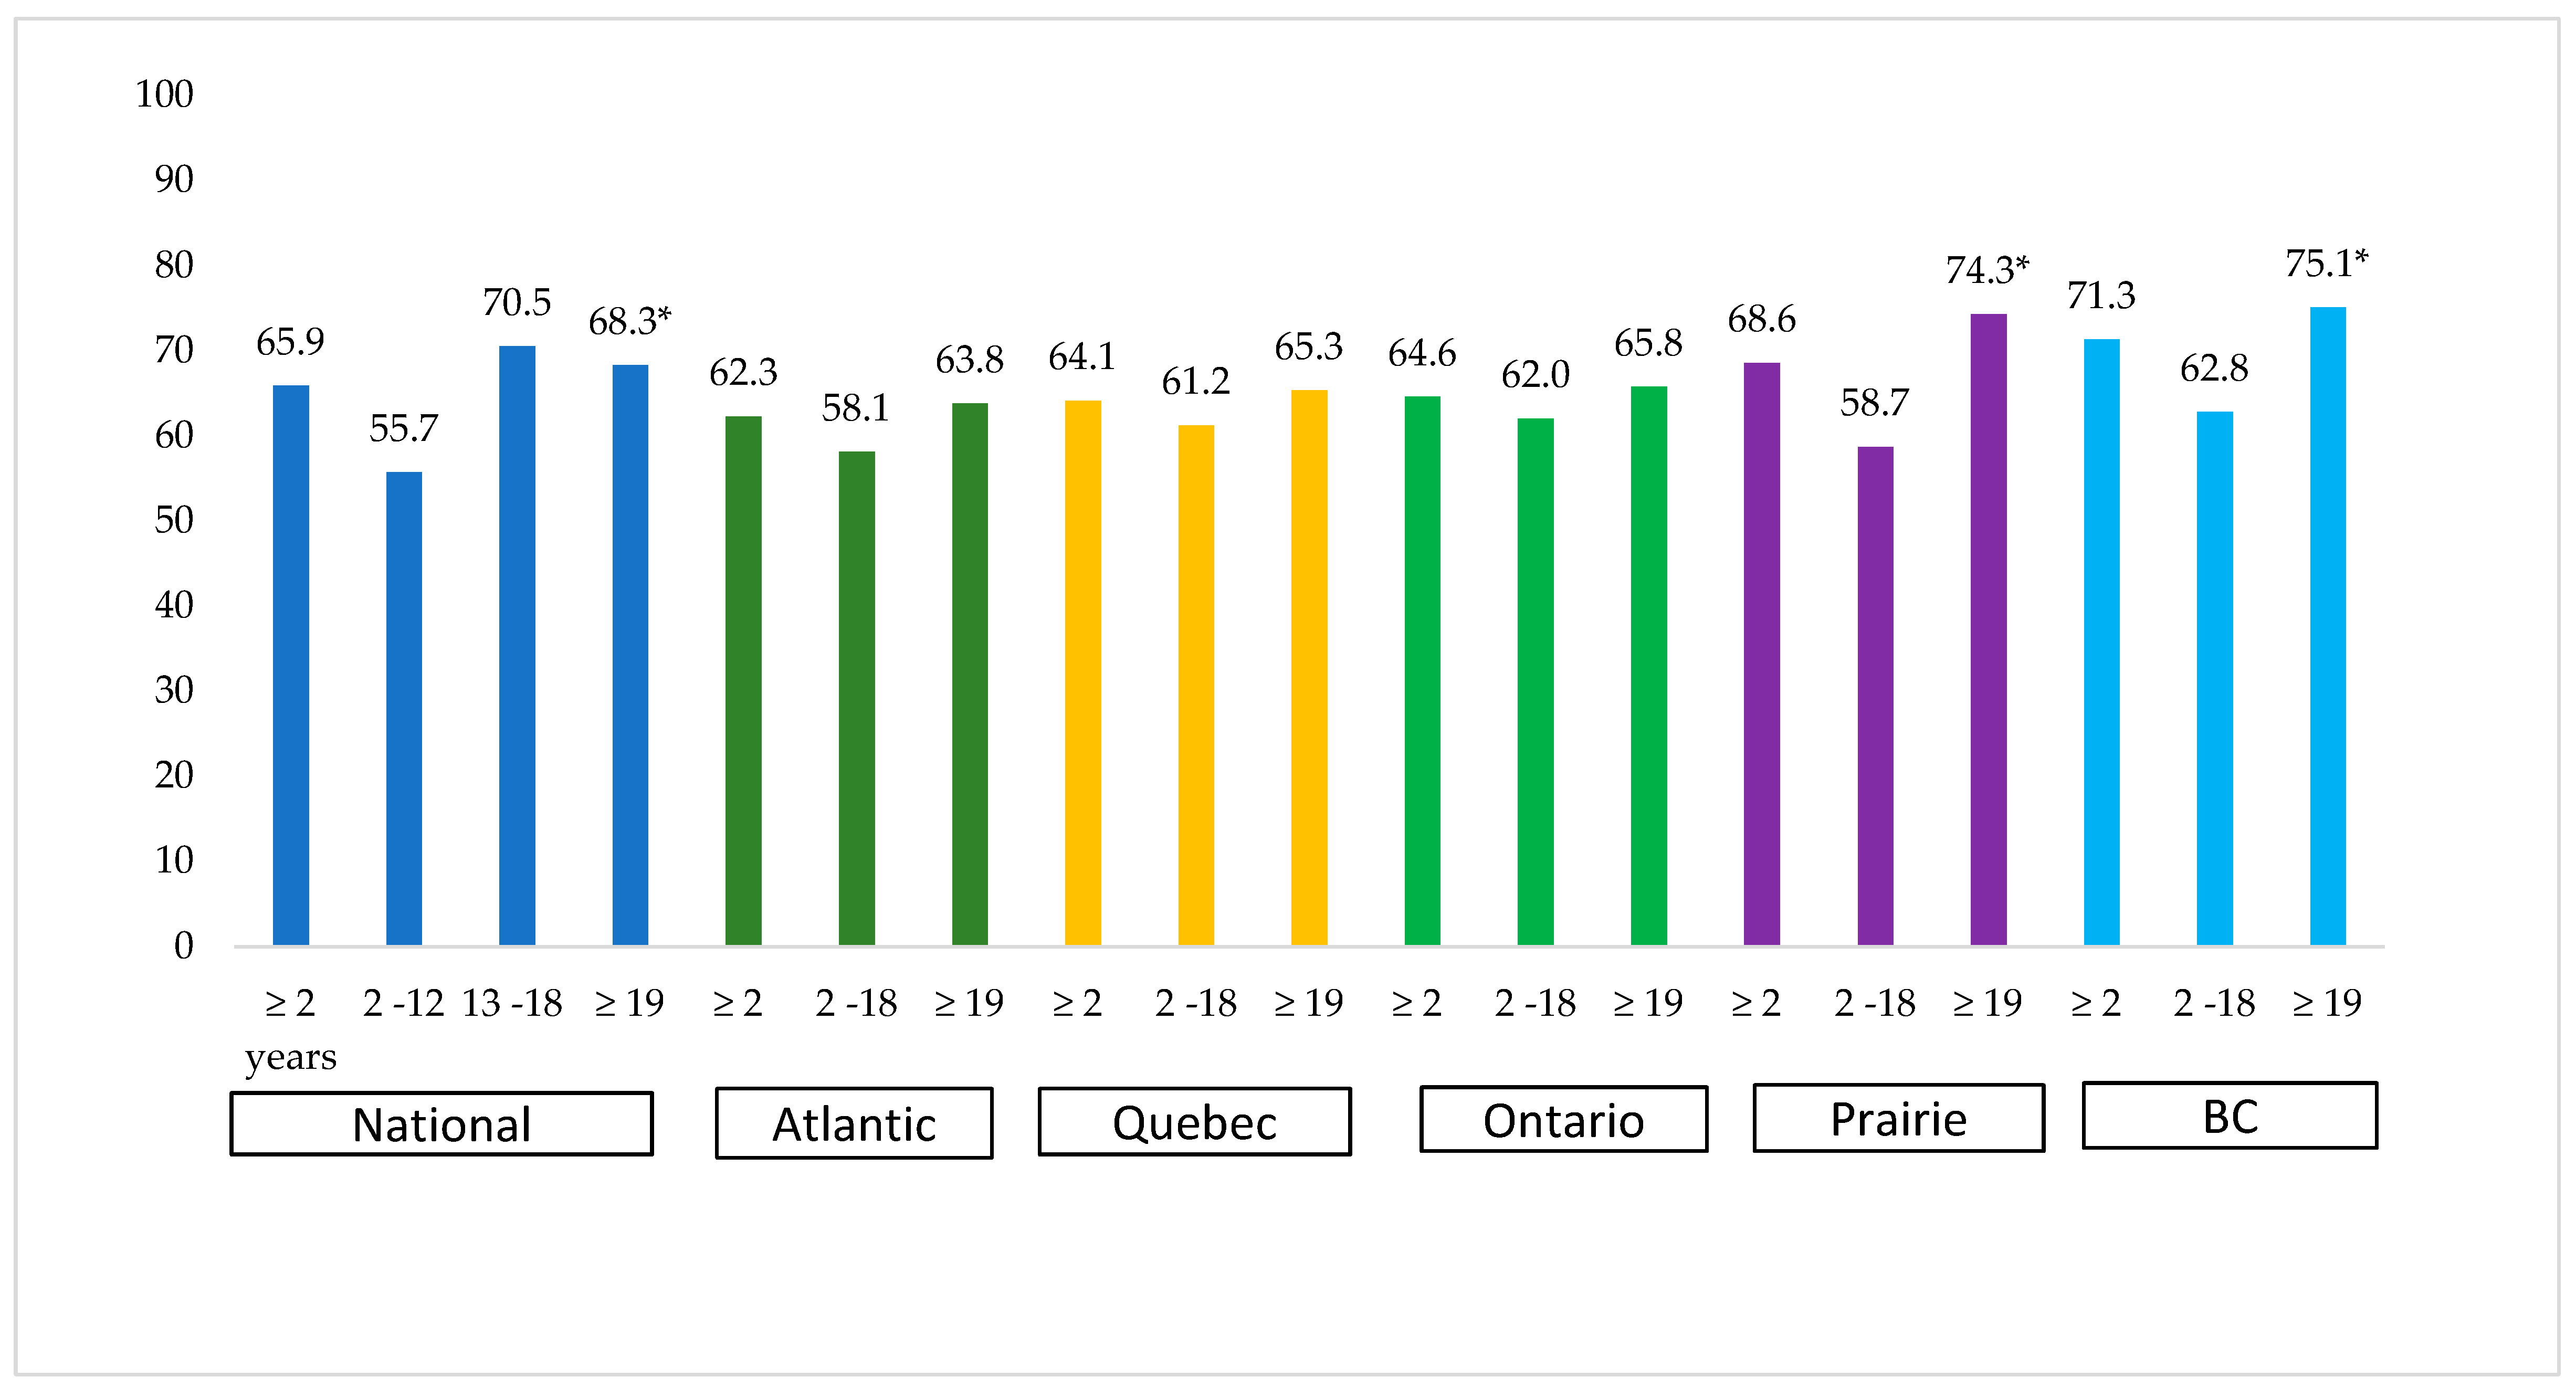
3.2. Prevalence of RTEC Consumption at Region Level
3.3. Daily Energy and Nutrient Intake Comparison between RTEC Consumers and Non-Consumers
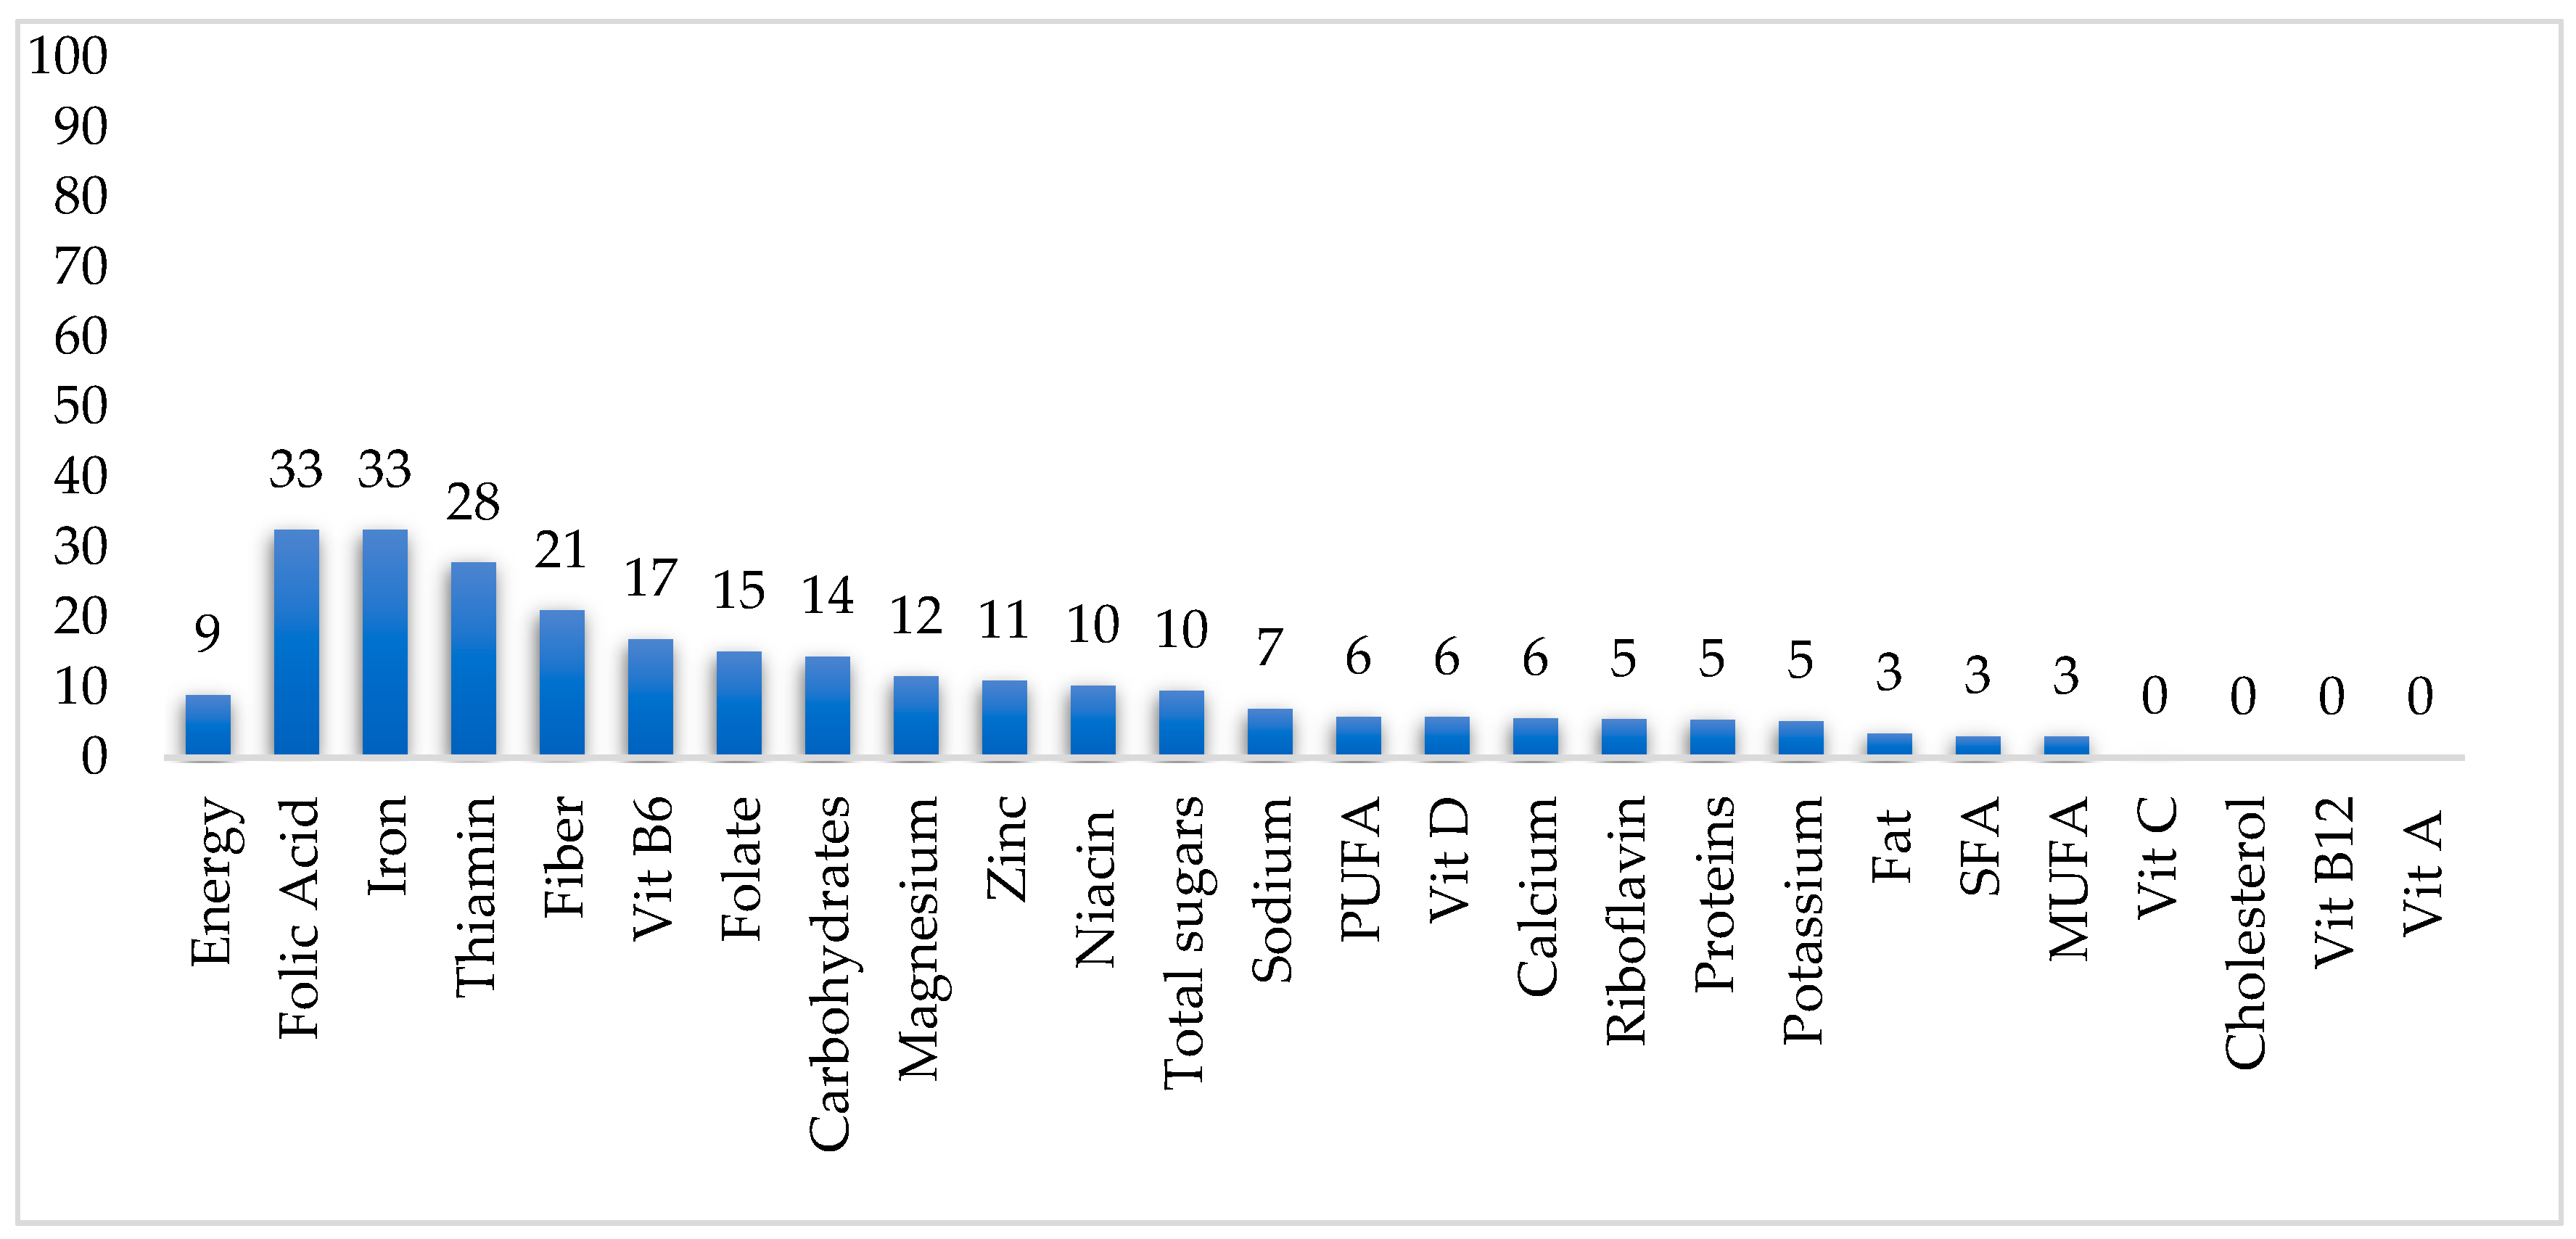
3.4. Nutrient Contribution of Ready-to-Eat Cereal to Daily Nutrient Intake
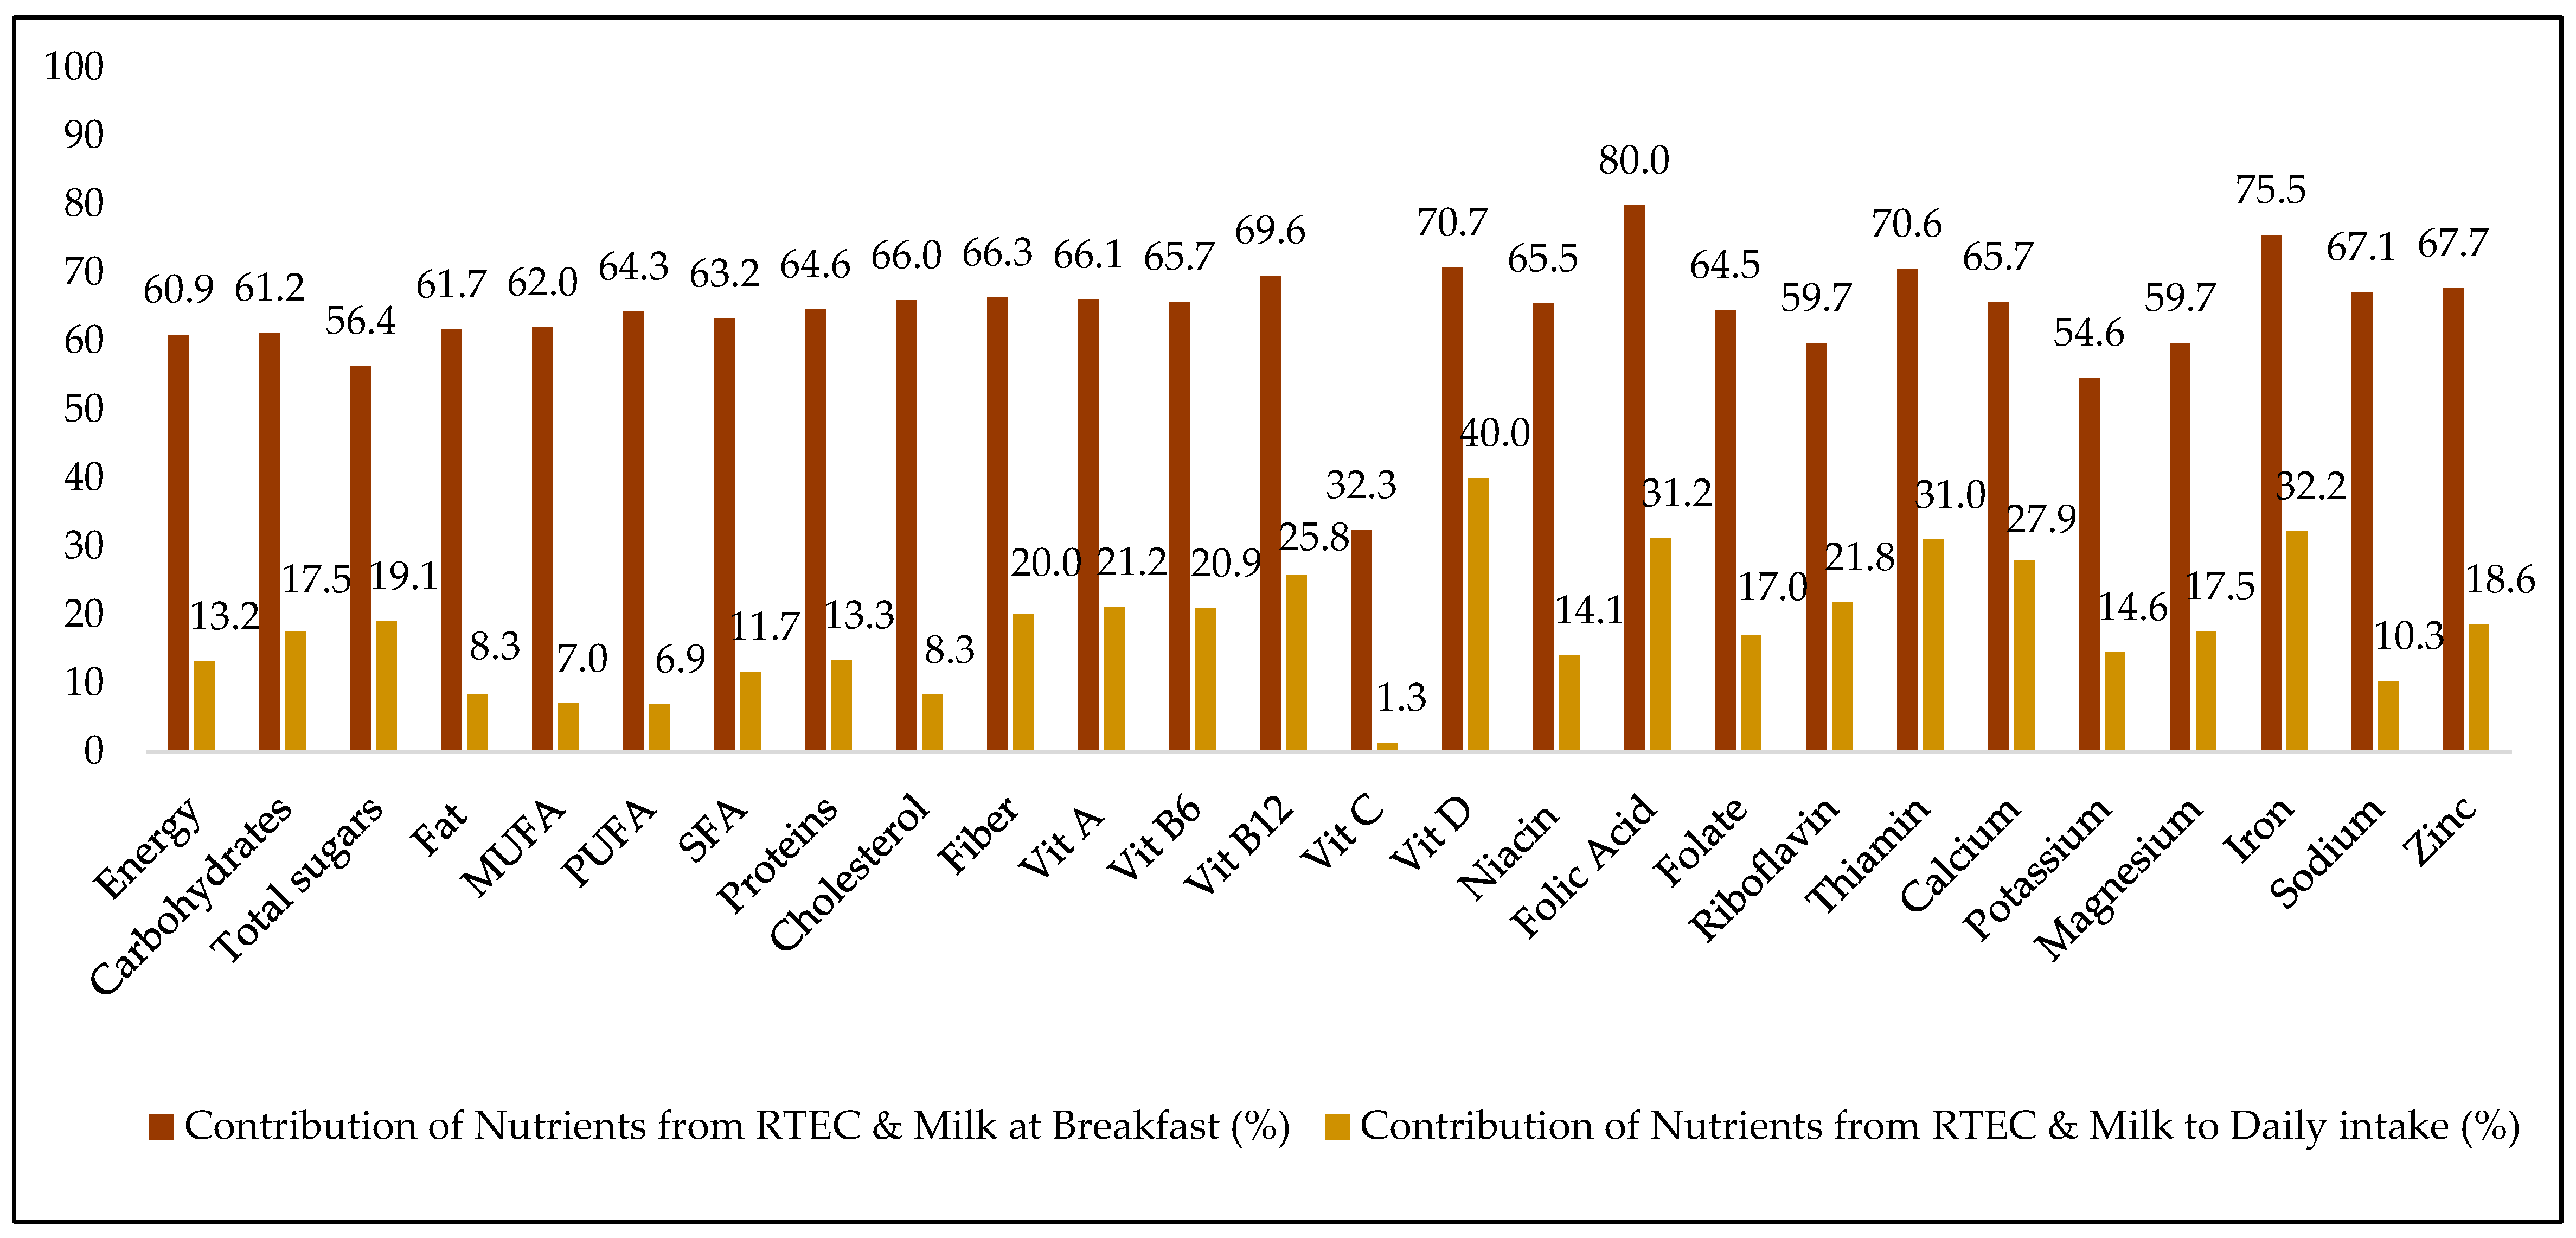
3.5. Contribution of Ready-To-Eat Cereal Co-Consumed with Milk to Nutrients at Breakfast and Daily
3.6. Contribution of Milk Consumed along with RTEC to Daily Milk Consumption
3.7. Differences in Nutrient Density among RTEC Consumers and Non-Consumers
3.8. Comparison of BMI between RTEC Consumers and Non-Consumers
3.9. Comparison of Grain Consumption between RTEC Consumers and Non-Consumers
4. Discussion
5. Conclusions
Author Contributions
Funding
Acknowledgments
Conflicts of Interest
Abbreviations
| AMPM | Automated multiple-pass method |
| BMI | Body mass index |
| BC | British Columbia |
| CCHS | Canadian Community Health Survey |
| CAPI | Computer-assisted personal interview |
| CATI | Computer-assisted telephonic interview |
| MUFA | Monounsaturated fatty acids |
| NRF 9.3 | Nutrient-Rich Food Index |
| PUFA | Polyunsaturated fatty acids |
| RTEC | Ready-to-eat cereal |
| SFA | Saturated fatty acids |
References
- Albertson, A.M.; Affenito, S.G.; Culp, J.M.; Buklis, P.; Joshi, N.A. The association between ready-to-eat cereal consumption, nutrient intakes of the Canadian population 12 years and older and body weight measures: Results from a nationally representative Canadian population. J. Food Res. 2013, 2. [Google Scholar] [CrossRef]
- Barr, S.I.; Vatanparast, H.; Smith, J. Breakfast In Canada: Prevalence Of Consumption, Contribution To Nutrient And Food Group Intakes, And Variability Across Tertiles Of Daily Diet Quality. A Study From The International Breakfast Research Initiative. Nutrients 2018, 10, 985. [Google Scholar] [CrossRef] [PubMed]
- Deshmukh-Taskar, P.R.; Nicklas, T.A.; O’neil, C.E.; Keast, D.R.; Radcliff, J.D.; Cho, S. The relationship of breakfast skipping and type of breakfast consumption with nutrient intake and weight status in children and adolescents: The National Health and Nutrition Examination Survey 1999–2006. J. Am. Diet. Assoc. 2010, 110, 869–878. [Google Scholar] [CrossRef]
- Statistics Canada. Archived-Health Indicators, Annual Estimates, 2003–2014. Available online: https://www150.statcan.gc.ca/t1/tbl1/en/tv.action?pid=1310045101 (accessed on 27 March 2019).
- Michels, N.; Henauw, S.D.; Beghin, L.; Cuenca-Garcia, M.; Gonzalez-Gross, M.; Hallstrom, L.; Kafatos, A.; Kersting, M.; Manios, Y.; Marcos, A.; et al. Ready-to-eat cereals improve nutrient, milk and fruit intake at breakfast in European adolescents. Eur. J. Nutr. 2016, 55, 771–779. [Google Scholar] [CrossRef] [PubMed]
- Canadian Food Inspection Agency (2018). Available online: http://www.inspection.gc.ca/food/requirements/labelling/industry/fortification/eng/1468504433692/1468504697186 (accessed on 27 March 2019).
- Gibson, S. Micronutrient intakes, micronutrient status and lipid profiles among young people consuming different amounts of breakfast cereals: Further analysis of data from the National Diet and Nutrition Survey of Young People aged 4 to 18 years. Public Health Nutr. 2003, 6, 815–820. [Google Scholar] [CrossRef] [PubMed]
- Streppel, M.T.; Sluik, D.; van Yperen, J.F.; Geelen, A.; Hofman, A.; Franco, O.H.; Witteman, J.C.; Feskens, E.J. Nutrient-rich foods, cardiovascular diseases and all-cause mortality: The Rotterdam study. Eur. J. Clin. Nutr. 2014, 68, 741–747. [Google Scholar] [CrossRef]
- Health Canada. Reference Guide to Understanding and Using The Data. Canada.Ca, 2018. Available online: https://www.canada.ca/en/health-canada/services/food-nutrition/food-nutrition-surveillance/health-nutrition-surveys/canadian-community-health-survey-cchs/reference-guide-understanding-using-data-2015.html?wbdisable=true (accessed on 27 March 2019).
- Statistics Canada. 2017. Available online: http://www23.statcan.gc.ca/imdb/p2SV.pl?Function=getSurvey&SDDS=5049 (accessed on 27 March 2019).
- Statistics Canada. The Research Data Centres (RDC) Program. 2017. Available online: http://www.statcan.gc.ca/eng/rdc/index (accessed on 27 March 2019).
- Statistics Canada Canadian Community Health Survey (CCHS): Nutrition-2015 (First Interview). Available online: http://www23.statcan.gc.ca/imdb/p3Instr.pl?Function=assembleInstr&lang=en&Item_Id=202664#qb210826 (accessed on 27 March 2019).
- Statistics Canada, RDC. The Research Data Centres (RDC) Program. 2018. Available online: http://www.statcan.gc.ca/eng/rdc/index (accessed on 27 March 2019).
- World Health Organization. WHO Anthro (Version 3.2.2, January 2011) and Macros. Available online: https://www.who.int/childgrowth/software/en/ (accessed on 27 March 2019).
- Statistics Canada. Adult Body Mass Index (BMI). 2016. Available online: https://www150.statcan.gc.ca/n1/pub/82-229-x/2009001/status/abm-eng.htm (accessed on 27 March 2019).
- Fulgoni III, V.L.; Keast, D.R.; Drewnowski, A. Development And Validation Of The Nutrient-Rich Foods Index: A Tool To Measure Nutritional Quality Of Foods. J. Nutr. 2009, 139, 1549–1554. [Google Scholar] [CrossRef]
- Government of Canada. Percent Daily Values. 2018. Available online: https://www.canada.ca/en/health-canada/services/understanding-food-labels/percent-daily-value.html (accessed on 27 March 2019).
- Horrace, W.C.; Schmidt, P. Multiple Comparisons With The Best, With Economic Applications. J. Appl. Econom. 2000, 15, 1–26. [Google Scholar] [CrossRef]
- Papanikolaou, Y.; Fulgoni, V.L. Grains Contribute Shortfall Nutrients and Nutrient Density to Older US Adults: Data from the National Health and Nutrition Examination Survey, 2011–2014. Nutrients 2018, 10, 534. [Google Scholar] [CrossRef] [PubMed]
- Sommerville, J.; O’Reagan, M. The contribution of breakfast to micronutrients adequacy of the Irish diet. J. Hum. Nutr. Diet. 1993, 6, 223–228. [Google Scholar] [CrossRef]
- Kafatos, A.; Linardakis, M.; Bertsias, G.; Mammas, I.; Fletcher, R.; Bervanaki, F. Consumption of ready-to-eat cereals in relation to health and diet indicators among school adolescents in Crete, Greece. Ann. Nutr. Metab. 2005, 49, 165–172. [Google Scholar] [CrossRef]
- Frary, C.D.; Johnson, R.K.; Wang, M.Q. Children and adolescents’ choices of foods and beverages high in added sugars are associated with intakes of key nutrients and food groups. J. Adol. Health 2004, 34, 56–63. [Google Scholar] [CrossRef]
- De la Hunty, A.; Gibson, S.; Ashwell, M. Does regular breakfast cereal consumption help children and adolescents stay slimmer? A systematic review and meta-analysis. Obes. Facts 2013, 6, 70–85. [Google Scholar] [CrossRef]
- Goglia, R.; Spiteri, M.; Menard, C.; Dumas, C.; Combris, P.; Labarbe, B.; Soler, L.G.; Volatier, J.L. Nutritional quality and labelling of ready-to-eat breakfast cereals: The contribution of the French observatory of food quality. Eur. J. Clin. Nutr. 2010, 64 (Suppl. 3), S20–S25. [Google Scholar] [CrossRef] [PubMed]
- Albertson, A.M.; Thompson, D.; Franko, D.L.; Holschuh, N.M.; Bauserman, R.; Barton, B.A. Prospective associations among cereal intake in childhood and adiposity, lipid levels, and physical activity during late adolescence. J. Am. Diet. Assoc. 2009, 109, 1775–1780. [Google Scholar] [CrossRef] [PubMed]
- Song, W.O.; Chun, O.K.; Kerver, J.; Cho, S.; Chung, C.E.; Chung, S.J. Ready-to-eat breakfast cereal consumption enhances milk and calcium intake in the US population. J. Am.Diet. Assoc. 2006, 106, 1783–1789. [Google Scholar] [CrossRef] [PubMed]
- Barton, B.A.; Eldridge, A.L.; Thompson, D.; Affenito, S.G.; Striegel-Moore, R.H.; Franko, D.L.; Crockett, S.J. The relationship of breakfast and cereal consumption to nutrient intake and body mass index: The National Heart, Lung, and Blood Institute Growth and Health Study. J. Am.Diet. Assoc. 2005, 105, 1383–1389. [Google Scholar] [CrossRef] [PubMed]
- Albertson, A.M.; Thompson, D.; Franko, D.L.; Kleinman, R.E.; Barton, B.A.; Crockett, S.J. Consumption of breakfast cereal is associated with positive health outcomes: Evidence from the National Heart, Lung, and Blood Institute Growth and Health Study. Nutr. Res. 2008, 28, 744–752. [Google Scholar] [CrossRef]
- Cho, S.; Dietrich, M.; Brown, C.J.; Clark, C.A.; Block, G. The effect of breakfast type on total daily energy intake and body mass index: Results from the Third National Health and Nutrition Examination Survey (NHANES III). J.Am. Coll. Nutr. 2003, 22, 296–302. [Google Scholar] [CrossRef]
- Barr, S.I.; DiFrancesco, L.; Fulgoni, V.L., III. Consumption of breakfast and the type of breakfast consumed are positively associated with nutrient intakes and adequacy of Canadian adults. J. Nutr. 2013, 143, 86–92. [Google Scholar] [CrossRef] [PubMed]
- Deshmukh-Taskar, P.R.; Radcliffe, J.D.; Liu, Y.; Nicklas, T.A. Do breakfast skipping and breakfast type affect energy intake, nutrient intake, nutrient adequacy, and diet quality in young adults? NHANES 1999–2002. J. Am. Coll. Nutr. 2010, 29, 407–418. [Google Scholar] [CrossRef] [PubMed]
- Sodium Reduction in Processed Foods in Canada: An Evaluation of Progress toward Voluntary Targets from 2012 to 2016. Available online: www.canada.ca/content/dam/hc sc/documents/services/food-nutrition/legislation-guidelines/guidance-documents/guidance-food industry-reducing-sodium-processed-foods-progress-report-2017/pub1-eng.pdf (accessed on 27 March 2019).
- United States Department of Health and Human Services and United States Department of Agriculture. 2015–2020 Dietary Guidelines for Americans. Available online: https://health.gov/dietaryguidelines/2015/resources/20152020_Dietary_Guidelines.pdf) (accessed on 27 March 2019).
- Health Canada. Canada’s Food Guide. 2011. Available online: https://www.canada.ca/content/dam/hc-sc/migration/hc-sc/fn-an/alt_formats/hpfb-dgpsa/pdf/food-guide-aliment/print_eatwell_bienmang-eng.pdf (accessed on 27 March 2019).
- Drewnowski, A.; Fulgoni, V.L.; Young, M.K.; Pitman, S. Nutrient-rich foods: Applying nutrient navigation systems to improve public health. J. Food. Sci. 2008, 73, H222–H228. [Google Scholar] [CrossRef] [PubMed]


| Characteristics | Children and Teens (2–18 years) (n = 6,463,895) | Adults ( ≥19 years) (n = 27,169,337) | ||
|---|---|---|---|---|
| RTEC Consumers | RTEC Non-Consumers | RTEC Consumers | RTEC Non-Consumers | |
| Mean age ± SE (year) | 9.1 ± 0.1 | 10.3 ± 0.1 * | 52.7 ± 0.6 | 48.5 ± 0.2 * |
| Sex (% male) | 50.7 ± 1.6 | 50.0 ± 1.1 | 48.7 ± 1.6 | 50.2 ± 0.4 |
| Smoker (% yes) 2 | 2.1 ± 0.8 | 4.6 ± 0.6 * | 15.3 ± 1.5 | 19.5 ± 0.8 * |
| Ethnicity (% Caucasian) | 70.2 ± 1.9 | 66.1 ± 1.5 * | 85.3 ± 1.3 | 72.6 ± 1.1 * |
| Education (% university grad) 3 | 44.5 ± 1.8 | 44.5 ± 1.4 | 34.7 ± 1.9 | 39.5 ± 1.0 * |
| Marital status (% married or co-habiting) 4 | n/a | n/a | 63.9 ±1.7 | 64.1 ± 1.0 |
| Food secure (% yes) | 85.0 ± 1.3 | 83.5 ± 1.0 | 90.8 ± 1.0 | 88.1 ± 0.6 |
| BMI (kg/m2) | n/a | n/a | 27.359 ± 0.2 | 27.358 ± 0.1 |
| BMI z-score (≥5 years and older) | 0.51 ± 0.06 | 0.44 ± 0.05 | n/a | n/a |
| Overweight/obese (% yes) 5 | 27.0 ± 1.9 | 26.2 ± 1.2 | 62.9 ± 1.8 | 61.6 ± 1.2 |
| Urban residence (% yes) | 82.8 ± 1.3 | 81.8 ± 1.2 | 81.8 ± 1.4 | 82.7 ± 0.9 |
| Immigrant to Canada (% yes) | 7.8 ± 1.0 | 9.7 ± 0.8 | 18.8 ± 1.3 | 29.5 ± 1.1 * |
| Regions | |||||
| Characteristics | Atlantic (n= 545,320) | Quebec (n = 1,720,854) | Ontario (n = 2,810,008) | Prairies (n = 1,339,848) | British Columbia (n = 938,168) |
| Ready-to-eat cereal consumers (% ± SE) * | 24.5 ± 1.0 | 21.9 ± 1.2 | 21.5 ± 1.1 | 22.1 ± 1.0 | 21.2 ± 1.3 |
| Ready to Eat Cereal Consumers | |||||
| Atlantic | Quebec | Ontario | Prairies | British Columbia | |
| Male RTEC consumers(% ± SE) | 24.2 ± 1.5 | 22.1 ± 1.8 | 20.1 ± 1.5 | 22.3 ± 1.4 | 22.6 ± 1.9 |
| Female RTEC consumers (% ± SE) | 24.8 ± 1.3 | 21.8 ± 1.7 | 22.8 ±1.4 | 22.0 ± 1.4 | 19.9 ± 1.8 |
| Ready to Eat Cereal Consumers | |||||
| Atlantic | Quebec | Ontario | Prairies | British Columbia | |
| Age 2–18 years RTEC consumers (% ± SE) | 25.24 ± 1.36 | 35.0 ± 2.4 | 33.9 ± 1.9 | 36.1 ± 1.8 | 32.5 ± 2.3 |
| Age ≥19 years RTEC consumers (% ± SE) ** | 15.23 ± 0.37 | 19.0 ± 1.4 | 18.4 ± 1.2 | 18.4 ± 1.1 | 18.8 ± 1.5 |
| Nutrients | All ages (n = 33,633,232) | 2–13 Years (n = 4,173,477) | 13–18 Years (n = 2,290,418) | ≥19 Years (n = 27,169,337) | ||||
|---|---|---|---|---|---|---|---|---|
| RTEC Consumer | RTEC Nonconsumer | RTEC Consumer | RTEC Nonconsumer | RTEC Consumer | RTEC Nonconsumer | RTEC Consumer | RTEC Nonconsumer | |
| Energy and Macronutrients | ||||||||
| Energy (kcal) | 1876.2 ± 21.6 | 1856.7 ± 13.8 | 1646.3 ± 24.8 | 1663.5 ± 22.53 | 2109.0 ± 50.8 | 2040.7 ± 32.12 | 1911.0 ± 28.5 | 1864.0 ± 15.9 |
| Carbohydrates (g) | 243.4 ± 2.8 | 221.4 ± 1.7 * | 230.0 ± 3.8 | 225.9 ± 3.39 * | 287.3 ± 7.1 | 263.2 ± 4.5 * | 241.6 ± 3.6 | 217.9 ± 1.9 * |
| % Energy from carbohydrates | 51.7 ± 0.3 | 48.0 ± 0.2 * | 55.2 ± 0.3 | 54.1 ± 0.03 * | 54.4 ± 0.5 | 51.4 ± 0.4 * | 50.3 ± 0.3 | 47.1 ± 0.2 * |
| Total sugars (g) | 102.0 ± 1.4 | 87.3 ± 0.9 * | 104.9 ± 2.1 | 101.9 ± 1.0 | 127.0 ± 4.0 | 111.0 ± 2.6 * | 97.9 ± 1.8 | 84.1 ± 0.9 * |
| Fat (g) | 65.5 ± 1.1 | 69.5 ± 0.7 * | 54.7 ± 1.07 | 58.7 ± 1.0 * | 72.1 ± 2.5 | 76.2 ± 1.5 * | 67.7 ± 1.4 | 70.2 ± 0.8 * |
| % Energy from fat | 30.1 ± 0.2 | 32.3 ± 0.1 * | 29.1 ± 0.3 | 30.7 ± 0.3 * | 29.4 ± 0.5 | 32.6 ± 0.3 * | 30.5 ± 0.3 | 32.5 ± 0.1 * |
| Dietary Fibers (g) | 19.1 ± 0.2 | 16.1 ± 0.1 * | 15.2 ± 0.3 | 14.0 ± 0.02 * | 18.1 ± 0.5 | 15.6 ± 0.3 * | 20.3 ± 0.3 | 16.3 ± 0.1 * |
| Protein (g) | 77.5 ± 1.01 | 77.6 ± 0.6 | 64.2 ± 1.1 | 62.8 ± 1.02 | 83.8 ± 2.7 | 80.2 ± 1.5 | 80.4 ± 1.3 | 78.9 ± 0.7 |
| % Energy from proteins | 16.5 ± 0.2 | 16.8 ± 0.1 | 15.5 ± 0.2 | 15.0 ± 0.2 | 15.9 ± 0.4 | 15.8 ± 0.2 | 16.8 ± 0.2 | 17.0 ± 0.1 |
| Monounsaturated Fatty Acids (g) | 23.6 ± 0.4 | 26.0 ± 0.3 * | 19.3 ± 0.4 | 20.7 ± 0.37 * | 25.9 ± 1.01 | 28.1 ± 0.6 * | 24.5 ± 0.6 | 26.4 ± 0.3 * |
| Polyunsaturated Fatty Acids (g) | 13.4 ± 0.3 | 14.5 ± 0.1 * | 10.1 ± 0.2 | 11.1 ± 0.3 * | 14.0 ± 0.5 | 15.1 ± 0.3 * | 14.2 ± 0.4 | 14.8 ± 0.2 * |
| Saturated Fatty Acids (g) | 22.6 ± 0.4 | 22.7 ± 0.2 | 20.3 ± 0.4 | 21.4 ± 0.4 * | 25.6 ± 1.02 | 26.0 ± 0.6 | 22.9 ± 0.5 | 22.6 ± 0.2 |
| Cholesterol (mg) | 217. 4 ± 4.9 | 270.7 ± 4.03 * | 170.0 ± 5.1 | 205.4 ± 4.04 * | 238.0 ± 11.8 | 265.0 ± 8.0 * | 228.1 ± 6.6 | 278.0 ± 4.7 * |
| Vitamins | ||||||||
| Vitamin B12 (mcg) | 4.3 ± 0.1 | 3.8 ± 0.06 * | 3.6 ± 0.09 | 3.3 ± 0.08 * | 5.0 ± 0.6 | 3.9 ± 0.1 | 4.4 ± 0.1 | 3.9 ± 0.07 * |
| Vitamin B6 (mg) | 1.7 ± 0.03 | 1.5 ± 0.01 * | 1.3 ± 0.03 | 1.2 ± 0.03 * | 1.8 ± 0.07 | 1.4 ± 0.03 * | 1.8 ± 0.03 | 1.6 ± 0.02 * |
| Vitamin C (mg) | 103.8 ± 2.7 | 100.1 ± 1.6 | 109.5 ± 3.9 | 116.9 ± 3.3 | 120.8 ± 6.6 | 111.3 ± 3.6 | 100.1 ± 3.7 | 97.4± 1.8 |
| Folate DFE (mcg) | 450.1 ± 6.2 | 434.1 ± 4.05 * | 391.8 ± 8.2 | 391.1 ± 8.5 | 527.1 ± 20.7 | 468.8 ± 11.4 | 456.5 ± 8.11 | 436.1 ± 4.6 * |
| Folic Acid (mcg) | 129.9 ± 2.4 | 111.6 ± 1.6 * | 123.7 ± 3.7 | 117.1 ± 3.5 * | 176.7 ± 9.6 | 139.0 ± 4.8 * | 125.6 ± 3.01 | 109.1 ± 1.8 * |
| Vitamin D (mcg) | 5.9 ± 0.1 | 4.5 ± 0.08 * | 6.0 ± 0.1 | 5.0 ± 0.13 * | 6.8 ± 0.2 | 4.9 ± 0.17 * | 5.8 ± 0.2 | 4.4 ± 0.09 * |
| Niacin (mg NE) | 38.1 ± 0.5 | 38. ± 0.3 | 29.6 ± 0.5 | 28.8 ± 0.5 | 41.1 ± 1.47 | 38.4 ± 0.7 | 40.1 ± 0.6 | 38.9 ± 0.4 |
| Vitamin A in RAE (mcg) | 653.4 ± 15.6 | 626.8 ± 9.8 | 595.4 ± 16.5 | 560.1 ± 14.5 | 759.8 ± 72.7 | 614.6 ± 16.3 | 656.0 ± 20.1 | 634.7 ± 11.2 |
| Riboflavin (mg) | 2.0 ± 0.02 | 1.8 ± 0.02 * | 1.7 ± 0.03 | 1.6 ± 0.03 * | 2.2 ± 0.07 | 1.8 ± 0.04 * | 2.0 ± 0.03 | 1.8 ± 0.02 * |
| Thiamin (mg) | 1.9 ± 0.03 | 1.4 ± 0.01 * | 1.6 ± 0.03 | 1.3 ± 0.03 * | 2.2 ± 0.06 | 1.6 ± 0.04 * | 2.0 ± 0.04 | 1.4 ± 0.02 * |
| Minerals | ||||||||
| Sodium (mg) | 2613.1 ± 38.6 | 2716.4 ± 25.3 * | 2284.6 ± 48.1 | 2290.9 ± 38.02 | 2851.2 ± 74.3 | 2944.4 ± 57.9 * | 2675.0 ± 52.3 | 2745.2 ± 29.1 * |
| Potassium (mg) | 2769.4 ± 32.7 | 2585.1 ± 19.03 * | 2357.9 ± 38.2 | 2210.1 ± 35.8 * | 2708.1 ± 67.41 | 2487.0 ± 42.7 * | 2893.6 ± 44.09 | 2632.0 ± 22.1 * |
| Zinc (mg) | 10.6 ± 0.1 | 10.1 ± 0.1 * | 8.5 ± 0.1 | 8.0 ± 0.14 * | 11.2 ± 0.3 | 10.3 ± 0.2 | 11.1 ± 0.2 | 10.3 ± 0.1 * |
| Calcium (mg) | 965.5 ± 14.1 | 766.6 ± 8.06 * | 1018.3 ± 18.8 | 859.2 ± 16.3 * | 1104.5 ± 35.1 | 921.9 ± 21.1 * | 932.7 ± 18.7 | 745.5 ± 9.08 * |
| Iron (mg) | 14.9 ± 0.1 | 11.5 ± 0.1 * | 12.7 ± 0.2 | 10.0 ± 0.2 * | 16.9 ± 0.5 | 12.0 ± 0.2 * | 15.2 ± 0.2 | 11.6 ± 0.1 * |
| Magnesium (mg) | 315.9 ± 3.8 | 292.1 ± 2.4 * | 248.1 ± 4.05 | 229.1 ± 3.5 * | 315.2 ± 10.2 | 275.8 ± 5.1 * | 335.2 ± 5.03 | 300.0 ± 2.8 * |
| Nutrients | 2–12 years | 13–18 years | ≥19 years |
|---|---|---|---|
| % Contribution from RTEC to Daily Nutrient Intake (n = 1,569,205) | % Contribution from RTEC to Daily Nutrient Intake (n = 659,855) | % Contribution from RTEC to Daily Nutrient Intake (n = 5,125,138) | |
| Energy and Macronutrients | |||
| Energy (%) | 7.6 ± 0.2 | 9.4 ± 0.4 | 9.3 ± 0.2 |
| Carbohydrates (%) | 11.4 ± 0.3 L | 14.2 ± 0.5 | 15.3 ± 0.4 * H |
| Total sugars (%) | 8.0 ± 0.3 L | 10.5 ± 0.5 H | 9.8 ± 0.4 * |
| Fat (%) | 2.7 ± 0.1 L | 3.5 ± 0.2 | 3.6 ± 0.2 * H |
| Dietary fibers (%) | 15.7 ± 0.5 L | 19.4 ± 0.8 | 22.7 ± 0.6 * H |
| Proteins (%) | 4.3 ± 0.2 L | 5.4 ± 0.3 | 5.7 ± 0.2 * H |
| Monounsaturated Fatty Acids (%) | 2.8 ± 0.1 L | 3.4 ± 0.3 H | 2.9 ± 0.1 * |
| Polyunsaturated Fatty Acids (%) | 4.9 ± 0.2 L | 5.8 ± 0.4 | 6.1 ± 0.2 * H |
| Saturated Fatty Acids (%) | 1.9 ± 0.1 L | 2.9 ± 0.3 | 3.4 ± 0.2 * H |
| Cholesterol (%) | 0.03 ± 0.0 L | 0.1 ± 0.0 | 0.1 ± 0.0 * H |
| Vitamins | |||
| Vitamin B12 (%) | 0.0 ± 0.0 | 0.0 ± 0.0 | 0.01 ± 0.0 |
| Vitamin B6 (%) | 17.2 ± 0.4 | 19.7 ± 0.8 H | 16.5 ± 0.5 * L |
| Vitamin C (%) | 0.0 ± 0.0 L | 0.1 ± 0.1 | 0.2 ± 0.1 * H |
| Folate DFE (%) | 14.3 ± 0.4 L | 15.9 ± 0.8 H | 15.3 ± 0.5 * |
| Vitamin D (%) | 6.1 ± 0.4 | 9.2 ± 1.0 H | 5.2 ± 0.4 * L |
| Folic Acid (%) | 29.8 ± 1.1 L | 30.3 ± 1.7 | 33.6 ± 1.1 * H |
| Niacin (%) | 9.4 ± 0.3 L | 10.5 ± 0.5 H | 10.5 ± 0.3 * |
| Vitamin A in RAE (%) | <.01 ± 0.0 | <0.01± 0.0 | <0.01± 0.0 |
| Riboflavin (%) | 3.7 ± 0.4 L | 8.2 ± 0.8 H | 5.6 ± 0.3 * |
| Thiamin (%) | 23.4 ± 0.8 L | 29.9 ± 1.2 H | 28.8 ± 0.8 * |
| Minerals | |||
| Sodium (%) | 7.1 ± 0.2 | 8.2 ± 0.4 H | 6.8 ± 0.2 * L |
| Potassium (%) | 3.5 ± 0.2 L | 4.9 ± 0.3 | 5.7 ± 0.2 * H |
| Zinc (%) | 8.9 ± 0.3 L | 10.3 ± 0.6 | 11.6 ± 0.4 * H |
| Calcium (%) | 5.6 ± 0.2 | 6.3 ± 0.4 H | 5.5 ± 0.2 * L |
| Iron (%) | 32.4 ± 0.7 | 35.4 ± 1.0 H | 32.2 ± 0.6 * L |
| Magnesium (%) | 9.1 ± 0.3 L | 10.6 ± 0.6 | 12.4 ± 0.4 * H |
| Age | Ready-to-Eat Cereal Consumer | Ready-to-Eat Cereal Non-Consumer |
|---|---|---|
| NRF 9.3 Score, SE | NRF 9.3 Score, SE | |
| National (n = 33,633,232) | ||
| ≥2 years (All Canadians) | 566.1 ± 3 | 504 ± 2.1 * |
| 2–12 years | 567.5 ± 4.4 | 513.9 ± 3.7 * |
| 13–18 years | 535.5 ± 7.9 | 468.4 ± 3.9 * |
| ≥19 years | 569.6± 4 | 505.5 ± 2.5 * |
| Atlantic (n = 2,228,012) | ||
| ≥2 years (All Atlantic residents) | 559.4 ± 5.1 | 478.2 ± 3.89 * |
| 2–18 years | 535.8 ± 7.3 | 471.2 ± 4.9 * |
| ≥19 years | 567.5 ± 6.6 | 479.5 ± 4.5 * |
| Quebec (n = 7,845,099) | ||
| ≥2 years (All Quebec residents) | 561.5 ± 6.7 | 506.9 ± 3.7 * |
| 2–18 years | 558.5 ± 6.4 | 504.1± 5.3 * |
| ≥19 years | 562.8 ± 9.3 | 507.4 ± 4.3 * |
| Ontario (n =13,086,112 ) | ||
| ≥2 years ( All Ontario residents) | 573.6 ± 5.6 | 508.9 ± 4.1 * |
| 2–18 years | 562.1 ± 8.4 | 496.5 ± 5.3 * |
| ≥19 years | 578.7 ± 7.4 | 511.5 ± 4.9 * |
| Prairie (n = 6,052,825) | ||
| ≥2 years (All Prairie residents) | 552.9 ± 6.4 | 489.6 ± 4.3 * |
| 2–18 years | 551.4 ± 6.2 | 467 ± 5.2 * |
| ≥19 years | 553.6 ± 8.8 | 494.4 ± 5.3 * |
| British Columbia (n = 4,421,184) | ||
| ≥2 years (All BC residents) | 574.9 ± 8.4 | 516.3 ± 5.4 * |
| 2–18 years | 550.1 ± 10.2 | 511.9 ± 5.9 * |
| ≥19 years | 584.4 ± 11.3 | 517.1 ± 6.3 * |
| Grain Consumption from RTEC | Age Groups | |||
|---|---|---|---|---|
| All Canadians (≥2 Years) (n = 7354198) | 2–12 Years (n = 1,569,205) | 13–18 Years (n = 659,855) | ≥19 Years (n = 5,125,138) | |
| Contribution of RTEC to total grain consumption (%) | 31.0 ± 0.6 | 25.8 ± 0.8 | 28 ± 1.0 | 32.8 ± 0.9 * |
| Whole grain consumption from RTEC (%) | 63.4 ± 1.42 | 63.7 ± 2.5 | 60.1 ± 3.6 | 63.7 ± 1.9 |
© 2019 by the authors. Licensee MDPI, Basel, Switzerland. This article is an open access article distributed under the terms and conditions of the Creative Commons Attribution (CC BY) license (http://creativecommons.org/licenses/by/4.0/).
Share and Cite
Vatanparast, H.; Islam, N.; Patil, R.P.; Shamloo, A.; Keshavarz, P.; Smith, J.; Chu, L.M.; Whiting, S. Consumption of Ready-to-Eat Cereal in Canada and Its Contribution to Nutrient Intake and Nutrient Density among Canadians. Nutrients 2019, 11, 1009. https://doi.org/10.3390/nu11051009
Vatanparast H, Islam N, Patil RP, Shamloo A, Keshavarz P, Smith J, Chu LM, Whiting S. Consumption of Ready-to-Eat Cereal in Canada and Its Contribution to Nutrient Intake and Nutrient Density among Canadians. Nutrients. 2019; 11(5):1009. https://doi.org/10.3390/nu11051009
Chicago/Turabian StyleVatanparast, Hassan, Naorin Islam, Rashmi Prakash Patil, Arash Shamloo, Pardis Keshavarz, Jessica Smith, Luan Manh Chu, and Susan Whiting. 2019. "Consumption of Ready-to-Eat Cereal in Canada and Its Contribution to Nutrient Intake and Nutrient Density among Canadians" Nutrients 11, no. 5: 1009. https://doi.org/10.3390/nu11051009
APA StyleVatanparast, H., Islam, N., Patil, R. P., Shamloo, A., Keshavarz, P., Smith, J., Chu, L. M., & Whiting, S. (2019). Consumption of Ready-to-Eat Cereal in Canada and Its Contribution to Nutrient Intake and Nutrient Density among Canadians. Nutrients, 11(5), 1009. https://doi.org/10.3390/nu11051009