Obesity Is Associated with Changes in Iron Nutrition Status and Its Homeostatic Regulation in Pregnancy

 , ,
, ,
Abstract
:1. Introduction
2. Materials and Methods
2.1. Study Design and Participants
2.2. Data Collection
2.3. Blood Sampling and Metabolite Analysis
2.4. Sample Size and Statistical Analyses
Model 1
Model 2
3. Results
3.1. Maternal Characteristics
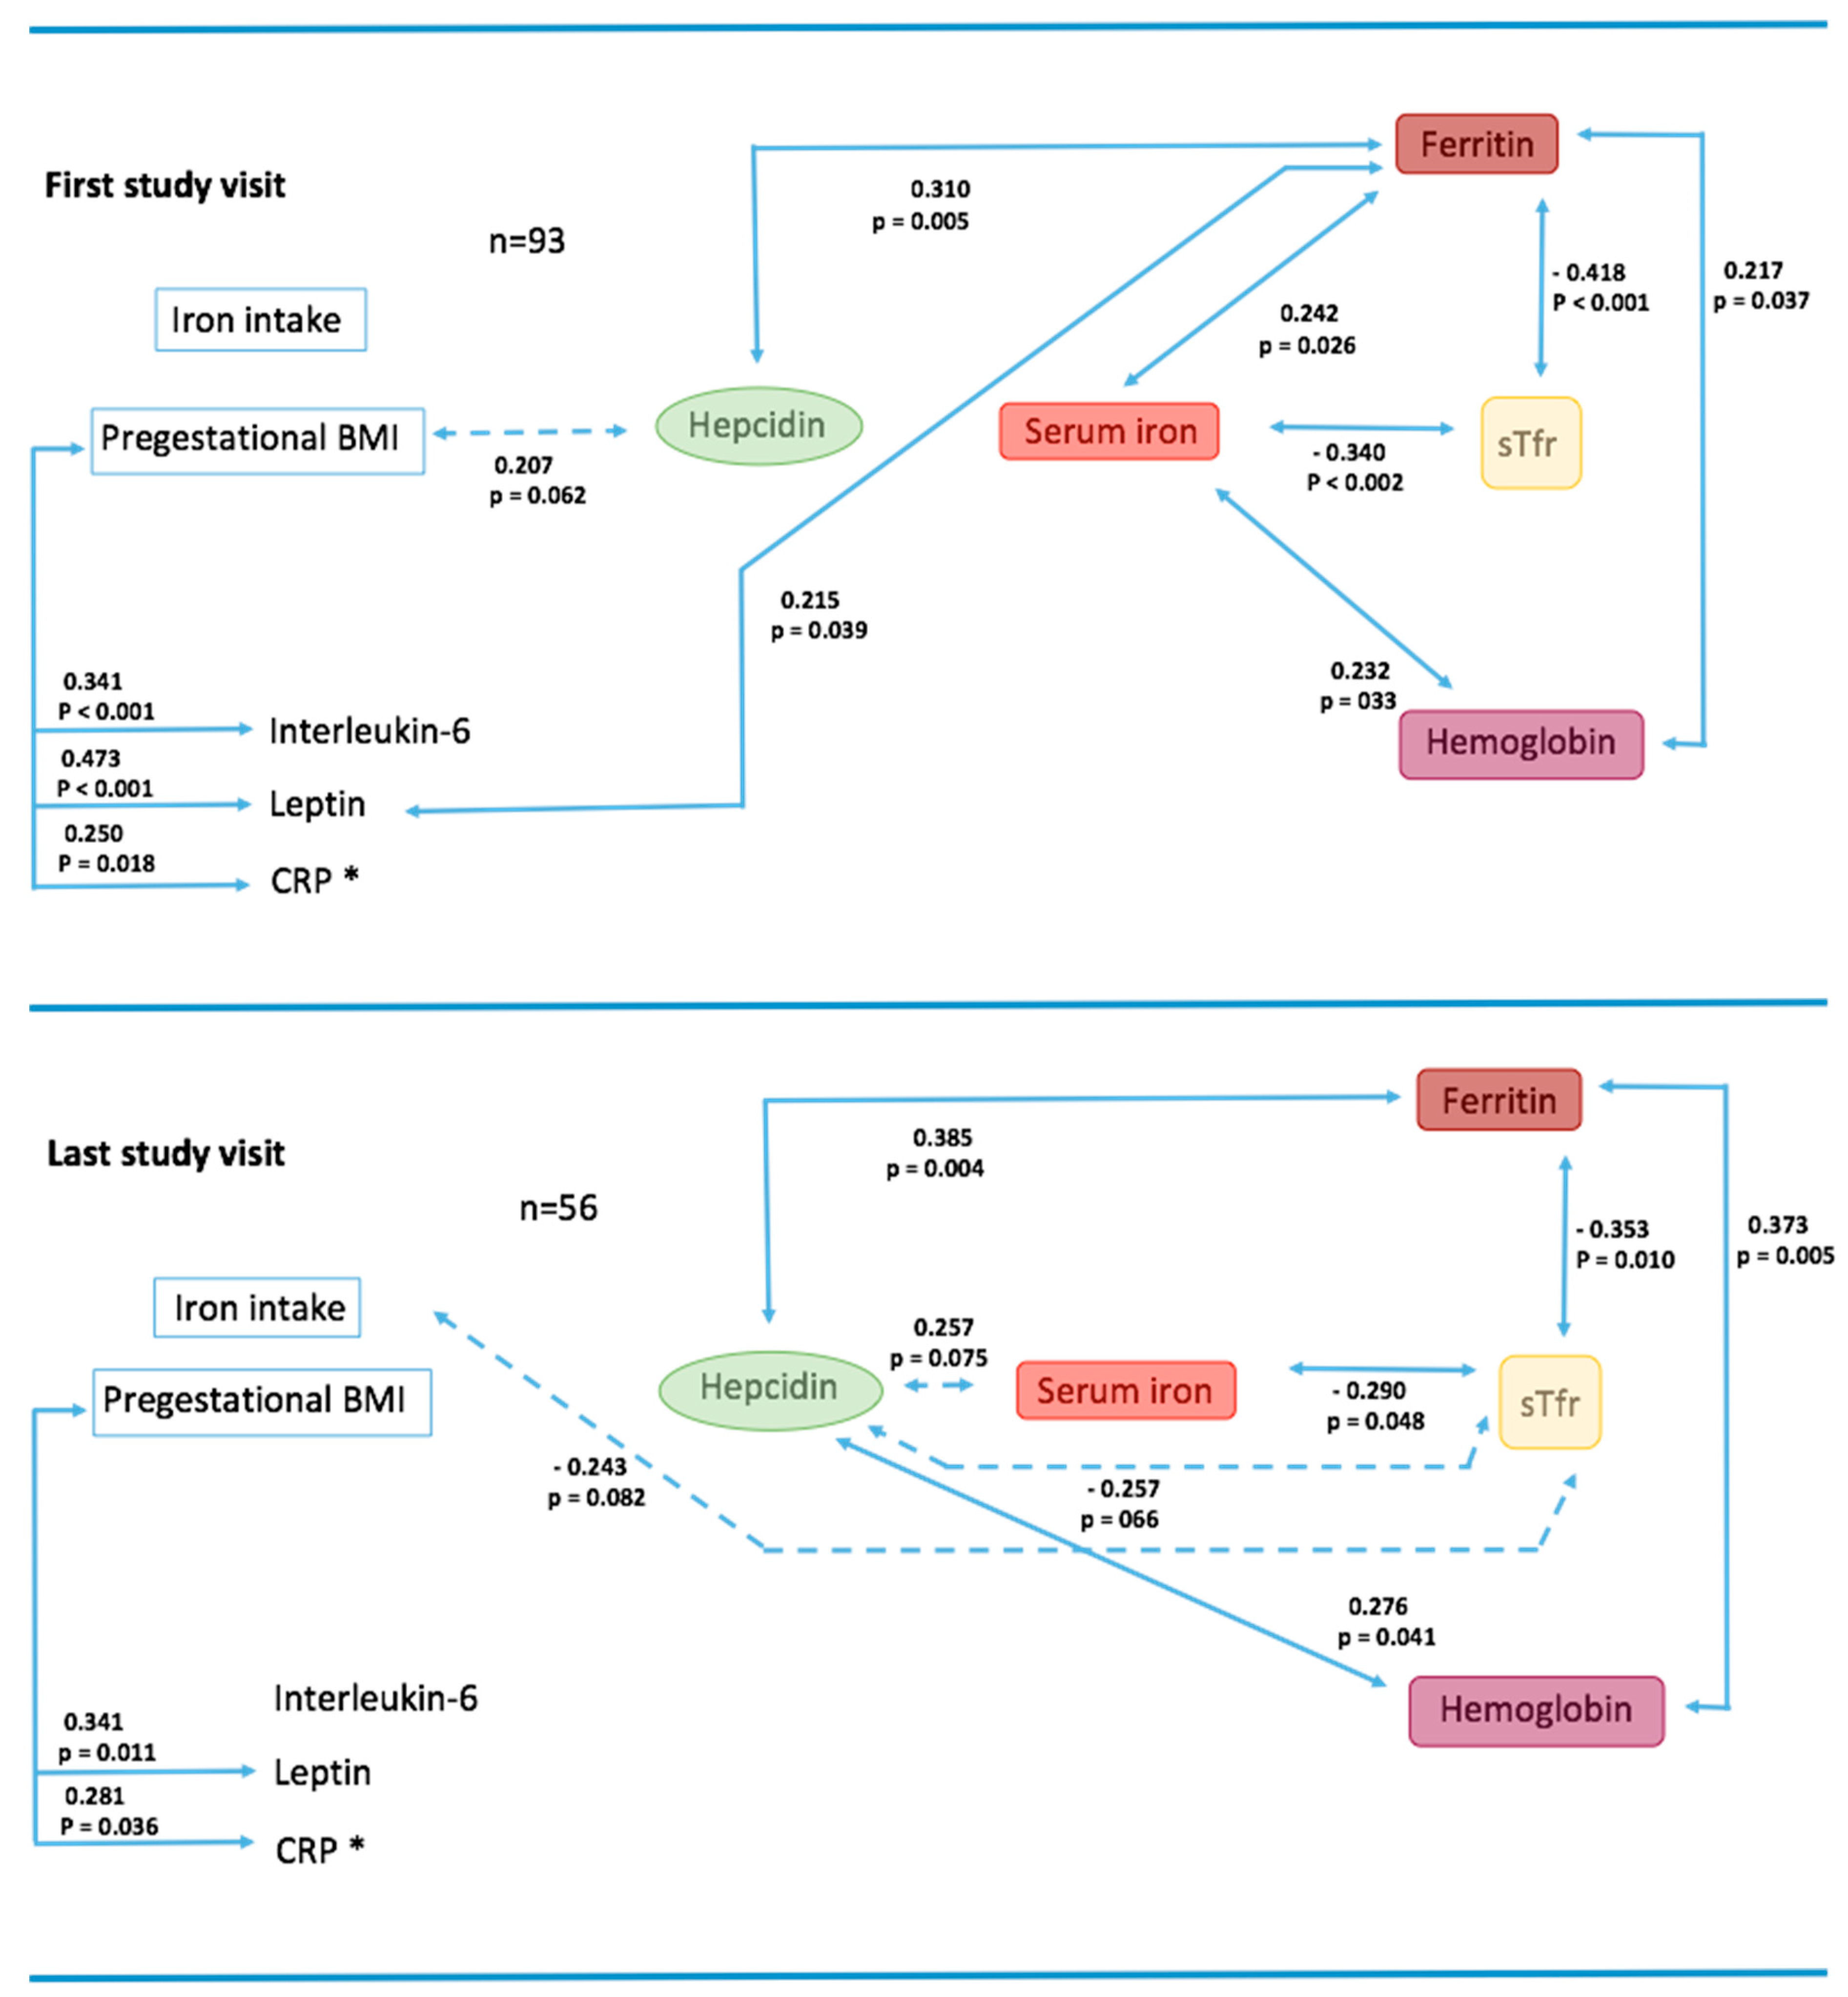
3.2. Bivariate Associations on First and Last Study Visits
3.3. Differences in Inflammatory Cytokines and Iron Status Biomarkers Between Obese and Normal Weight Pregnant Women
4. Discussion
5. Conclusions
Author Contributions
Funding
Acknowledgments
Conflicts of Interest
Appendix A. Intra-assay Coefficients of Variation for each Analyte

| Analyte | Coefficient of Variation (%) |
| Hemoglobin | <5.0 |
| CRP (ref: LKCRP1, Siemens) | 4.2–6.0 |
| IL-6 (ref: LK6P1, Siemens) | 3.5–6.2 |
| Ferritin (ref: LKFE1, Siemens) | 3.9–6.5 |
| Leptin (ref: DLP00, R&D Systems) | 3.0–3.3 |
| sTfr (ref: DTFR1, R&D Systems) | 4.3–7.1 |
| Hepcidin (ref: EIA-5258, DRG-Diagnostics) | 2.1–9.9 |
| Serum iron (acid digestion with the atomic absorption method) | <10 |
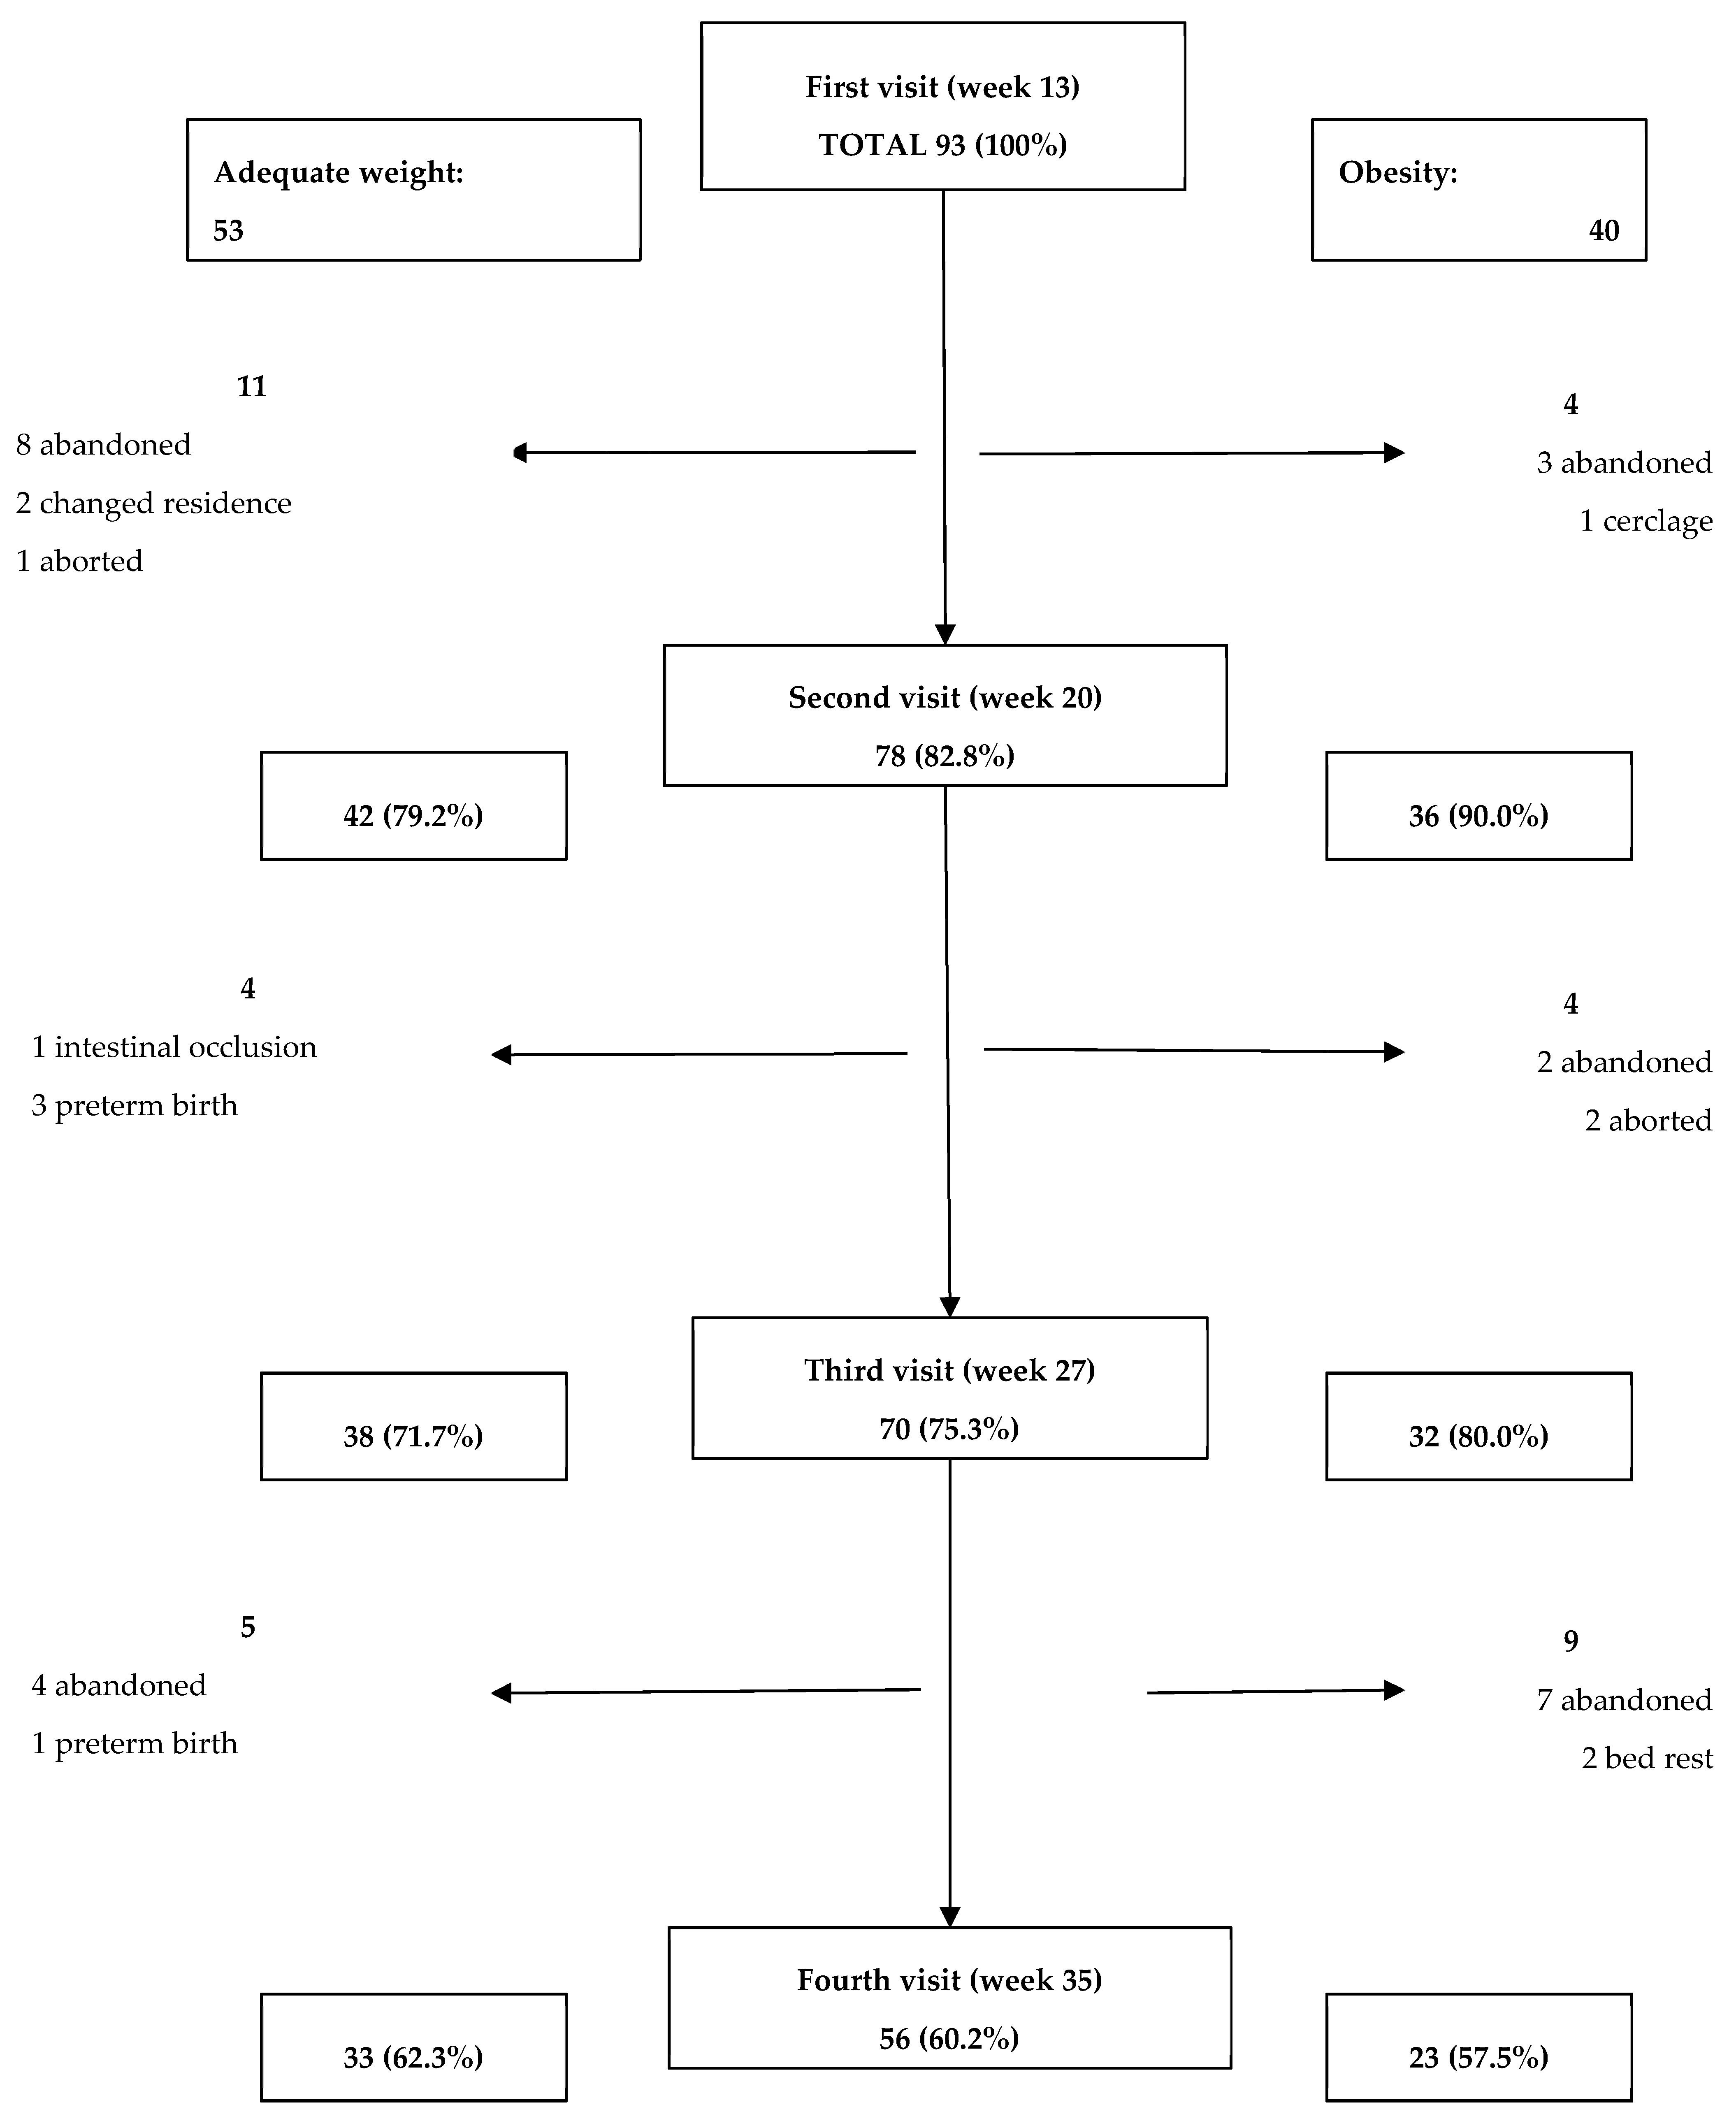
Appendix B. Included Participants and Attrition Rates
Appendix C. Concentrations of Iron Metabolism and Inflammation Markers
| Visit 1 | Visit 2 | Visit 3 | Visit 4 | |||||||||
| AW (n = 53) | Ob (n = 40) | p | AW (n = 42) | Ob (n = 36) | p | AW (n = 38) | Ob (n = 32) | p | AW (n = 33) | Ob (n = 23) | p | |
| Hepcidin (ng/mL) | 8.04 (5.88–11.86) | 9.58 (6.20–15.67) | 0.23 | 6.54 (4.63–8.20) | 8.12 (5.81–11.03) | 0.04 | 6.20 (4.16–8.29) | 7.02 (5.61–8.48) | 0.16 | 5.63 (4.50–6.94) | 6.47 (4.84–11.06) | 0.13 |
| Serum iron (µg/dL) | 162.45 (129.8–199.5) | 149.76 (113.6–199.7) | 0.47 | 156.60 (116.9–185.4) | 133.0 (105.3–177.4) | 0.13 | 146.4 (110.1–210.7) | 125.2 (93.7–148.7) | 0.01 | 145. 5 (102.3–180.7) | 127. 1 (106.1–174.4) | 0.75 |
| sTfr (mg/L) | 13.34 (11.30–16.08) | 13.98 (11.03–19.30) | 0.41 | 14.05 (10.93–16.40) | 16.49 (12.50–19.80) | 0.02 | 14.86 (12.99–19.35) | 16.75 (13.30–20.84) | 0.34 | 17.09 (14.39–21.42) | 16.44 (13.75–23.72) | 0.89 |
| Ferritin (mg/L) | 39.30 (27.60–65.05) | 40.60 (19.40–96.15) | 0.89 | 25.20 (16.55–33.80) | 26.05 (16.52–49.55) | 0.38 | 18.60 (12.55–26.05) | 17.40 (11.02–29.00) | 0.94 | 19.80 (13.25–30.35) | 21.30 (10.70–32.10) | 0.97 |
| Hemoglobin (g/dL) | 13.55 (13.18–14.45) | 13.39 (13.08–13.99) | 0.36 | 12.66 (12.06–13.39) | 12.90 (12.25–13.32) | 0.47 | 12.86 (12.27–13.49) | 12.71 (12.24–13.35) | 0.60 | 13.00 (12.60–13.91) | 13.21 (12.64–13.80) | 0.97 |
| CRP (mg/L) | 4.36 (3.04–8.58) | 10.65 6.84–15.40) | <0.01 | 5.55 (2.98, 9.23) | 11.30 (6.44, 15.70) | <0.01 | 5.77 (3.45, 8.82) | 10.51 (6.68, 15.57) | <0.01 | 4.04 (2.30, 8.49) | 9.36 (6.11, 13.80) | <0.01 |
| IL-6 (pg/mL) | 1.79 (1.63–2.10) | 2.15 (1.81–2.43) | <0.01 | 1.96 (1.74, 2.55) | 2.20 (1.89, 2.85) | 0.14 | 1.92 (1.73, 2.49) | 2.44 (1.93, 3.20) | 0.03 | 2.13 (1.80, 2.48) | 2.30 (1.87, 3.17) | 0.38 |
| Leptin (pg/mL) | 21.50 (15.11–26.25) | 44.48 (32.14–61.57) | <0.01 | 26.42 (18.36, 40.68) | 42.57 (28.72, 52.65) | <0.01 | 22.73 (20.04, 40.14) | 45.99 (35.81, 72.64) | <0.01 | 29.27 (16.43, 41.35) | 59.40 (34.57, 76.18) | <0.01 |
Appendix D. Inflammatory and Iron Biomarker Confounding Variables
| Adequate Weight | Obese | pa | |||
| Underlying health condition 1 | n | cases (%) | n | cases (%) | |
| Controlled hypothyroidism | 53 | 12 (22.6) | 40 | 10 (25.0) | 0.791 |
| Myomatosis | 53 | 9 (17) | 40 | 2 (5) | 0.077 |
| Previous infertility | 53 | 20 (37.7) | 40 | 10 (25) | 0.193 |
| Any underlying condition | 53 | 28 (52.2) | 40 | 18 (45) | 0.45 |
| Gestational age (weeks) 2 | n | Mean (SD) | n | Mean (SD) | |
| Visit 1 | 53 | 13.06 ± 1.15 | 40 | 13.50 ± 1.13 | 0.070 |
| Visit 2 | 41 | 20.68 ± 1.08 | 36 | 20.32 ± 1.03 | 0.133 |
| Visit 3 | 37 | 27.92 ± 1.23 | 32 | 27.61 ±1.16 | 0.287 |
| Visit 4 | 33 | 34.64 ± 1.00 | 23 | 34.37 ± 0.73 | 0.285 |
| Iron intake 3 | n | Median (IQR) | n | Median (IQR) | |
| Diet (mg/day) | 50 | 16.21 (13.43, 20.76) | 39 | 14.68 (11.38, 17.20) | 0.065 |
| Supplement (mg/day) | 50 | 27.50 (20.25, 35.92) | 39 | 25.72 (21.26, 36.81) | 0.877 |
| Total iron (mg/day) | 50 | 43.57 (36.53, 54.42) | 39 | 41.54 (33.41, 50.62) | 0.262 |
| Infection 1 | n | cases (%) | n | cases (%) | |
| Before Visit 1 | 41 | 18 (43.9) | 36 | 10 (27.8) | 0.142 |
| Between visits 1 and 2 | 41 | 12 (29.3) | 35 | 13 (37.1) | 0.226 |
| Between visits 2 and 3 | 37 | 10 (27.0) | 32 | 9 (28.1) | 0.919 |
| Between visits 3 and 4 | 33 | 6 (18.2) | 23 | 5 (21.7) | 0.742 |
| Pregnancy complications 1 | n | cases (%) | n | cases (%) | |
| Abortion | 52 | 1 (2) | 39 | 2 (5) | 0.400 |
| Gestational Diabetes | 52 | 1 (2) | 39 | 7 (18.4) | 0.009 |
| Preeclampsia | 52 | 2 (3.8) | 39 | 4 (10) | 0.236 |
| Any complications | 52 | 3 (5.8) | 39 | 10 (26.3) | 0.006 |
Appendix E. Generalized Linear Models for Iron and Inflammatory Biomarkers
| Hepcidin predictive parameters | ||||||
| Model 1 | Model 2 | |||||
| β | CI 95% | p | β | CI 95% | p | |
| Intercept | 2.775 | 2.08, 3.46 | <0.01 | 2.787 | 2.08, 3.49 | <0.01 |
| Ob a | 0.204 | 0.04, 0.35 | 0.01 | 0.200 | 0.03, 0.36 | 0.01 |
| Gestational Weeks | ||||||
| 1 b | 0.429 | 0.21, 0.64 | <0.01 | 0.407 | 0.190, 0.625 | <0.01 |
| 2 b | 0.138 | −0.07, 0.03 | 0.20 | 0.138 | −0.07, 0.35 | 0.20 |
| 3 b | 0.114 | −0.10, 0.33 | 0.30 | 0.117 | −0.10, 0.33 | 0.29 |
| Total iron intake | 0.000 | −0.00, 0.00 | 0.82 | 0.000 | −0.004, 0.004 | 0.91 |
| sTfr-Ln | −0.267 | −0.48, −0.05 | 0.01 | −0.276 | −0.49, −0.06 | 0.013 |
| Underlying c | −0.060 | −0.08, 0.20 | 0.42 | −0.049 | −0.19, 0.09 | 0.18 |
| Complication c | 0.146 | −0.06, 0.35 | 0.17 | 0.143 | −0.06, 0.35 | 0.18 |
| CRP-Ln | 0.015 | −0.06, 0.09 | 0.72 | |||
| R2 (R2 adjusted) | 0.145 (0.117) | 0.144 (0.112) | ||||
| Serum iron predictive parameters | ||||||
| Model 1 | Model 2 | |||||
| β | CI 95% | p | β | CI 95% | p | |
| Intercept | 117.81 | 78.32, 157.29 | <0.01 | 127.98 | 83.49, 172.47 | <0.01 |
| Ob a | −19.850 | 4.80, 34.89 | 0.01 | −17.37 | 1.22, 33.52 | 0.03 |
| Gestational Weeks | ||||||
| 1 b | 18.654 | −2.74, 40.05 | 0.08 | 19.55 | −2.09, 41.19 | 0.07 |
| 2 b | 5.532 | −15.28, 26.35 | 0.60 | 6.32 | −14.71, 27.36 | 0.55 |
| 3 b | 1.631 | −19.44, 22.70 | 0.87 | 2.63 | −18.65, 23.91 | 0.80 |
| Total iron intake | 0.048 | −0.34, 0.44 | 0.81 | 0.050 | −0.348, 0.448 | 0.80 |
| hepcidin-Ln | 12.548 | 0.06, 25.03 | 0.04 | 12.11 | −0.672, 24.89 | 0.06 |
| Underlying c | 0.955 | −15.08, 13.17 | 0.89 | 1.051 | −15.37, 13.27 | 0.88 |
| Complication c | 16.030 | −5.72, 37.78 | 0.14 | 16.96 | −38.93, 5.00 | 0.13 |
| CRP-Ln | −4.086 | −12.56, 4.39 | ||||
| R2 (R2 adjusted) | 0.076 (0.044) | 0.077 (0.041) | ||||
| sTfr predictive parameters | ||||||
| Model 1 | Model 2 | |||||
| β | CI 95% | p | β | CI 95% | p | |
| Intercept | 3.063 | 2.83, 3.28 | <0.01 | 2.96 | 2.71, 3.21 | <0.01 |
| Ob a | 0.115 | 0.02, 0.20 | 0.01 | 0.085 | −0.00, 0.17 | 0.07 |
| Gestational Weeks | ||||||
| 1 b | −0.201 | −0.32, −0.07 | <0.01 | −0.204 | −0.33, −0.07 | <0.01 |
| 2 b | −0.131 | −0.25, −0.00 | 0.03 | −0.121 | −0.24, 0.00 | 0.05 |
| 3 b | −0.061 | −0.18, 0.06 | 0.33 | −0.067 | −0.19, 0.05 | 0.29 |
| Total iron intake | −0.002 | −0.004, 0.000 | 0.12 | −0.002 | −0.004, 0.000 | 0.11 |
| hepcidin-Ln | −0.088 | −0.15, −0.01 | 0.05 | −0.091 | −0.16, −0.02 | 0.01 |
| Underlying c | −0.128 | −0.21, −0.04 | <0.01 | −0.132 | −0.21, 0.04 | <0.01 |
| Complication c | −0.039 | −0.16, 0.08 | 0.53 | −0.048 | −0.17, 0.07 | 0.44 |
| CRP-Ln | 0.044 | −0.00, 0.09 | 0.06 | |||
| R2 (R2 adjusted) | 0.149 (0.121) | 0.162 (0.131) | ||||
| Ferritin predictive parameters | ||||||
| Model 1 | Model 2 | |||||
| β | CI 95% | p | β | CI 95% | p | |
| Intercept | 2.713 | 2.27, 3.15 | <0.01 | 2.46 | 1.97, 2.95 | <0.01 |
| Ob a | −0.026 | −0.19, 0.14 | 0.76 | −0.082 | −0.26, 0.09 | 0.36 |
| Gestational Weeks | ||||||
| 1 b | 0.604 | 0.36, 0.84 | <0.01 | 0.610 | 0.36, 0.85 | <0.01 |
| 2 b | 0.242 | 0.00, 0.47 | 0.04 | 0.219 | −0.01, 0.45 | 0.06 |
| 3 b | −0.100 | −0.33, 0.13 | 0.41 | −0.112 | −0.35, 0.12 | 0.35 |
| Total iron intake | 0.000 | −0.005, 0.004 | 0.91 | 0.000 | −0.004, 0.004 | 0.96 |
| hepcidin-Ln | 0.333 | 0.19, 0.46 | <0.01 | 0.340 | 0.20, 0.47 | <0.01 |
| Underlying c | 0.287 | 0.12, 0.44 | <0.01 | 0.296 | 0.13, 0.45 | <0.01 |
| Complication c | 0.221 | −0.17, 0.45 | 0.06 | 0.200 | −0.03, 0.43 | 0.09 |
| CRP-Ln | 0.096 | 0.00, 0.18 | 0.04 | |||
| R2 (R2 adjusted) | 0.303 (0.281) | 0.320 (0.295) | ||||
| Hemoglobin predictive parameters | ||||||
| Model 1 | Model 2 | |||||
| β | CI 95% | p | β | CI 95% | p | |
| Intercept | 13.012 | 12.43, 13.59 | <0.01 | 12.73 | 12.08, 13.38 | <0.01 |
| Ob a | −0.165 | −0.39, 0.06 | 0.15 | −0.229 | −0.46, 0.01 | 0.06 |
| Gestational Weeks | ||||||
| 1 b | 0.177 | −0.14, 0.49 | 0.27 | 0.180 | −0.14, 0.50 | 0.26 |
| 2 b | −0.527 | −0.83, −0.21 | <0.01 | −0.538 | −0.14, −0.22 | <0.01 |
| 3 b | −0.447 | −0.76, −0.13 | <0.01 | −0.448 | −0.76, −0.13 | <0.01 |
| Total iron intake | −0.005 | −0.01, 0.001 | 0.13 | −0.004 | −0.010 | 0.002 |
| hepcidin-Ln | 0.262 | 0.81, 0.44 | <0.01 | 0.294 | 0.11, 0.47 | <0.01 |
| Underlyingc | −0.031 | −0.24, 0.18 | 0.77 | −0.050 | −0.26, 0.16 | 0.63 |
| Complicationc | 0.171 | −0.14, 0.48 | 0.28 | 0.150 | −0.16, 0.46 | 0.34 |
| CRP-Ln | 0.074 | −0.048, 0.195 | 0.23 | |||
| R2 (R2 adjusted) | 0.173 (0.147) | 0.186 (0.157) | ||||
| Inflammatory biomarkers | |||||||||
| Ln-CRP | Ln-Leptin | Ln-IL-6 | |||||||
| β | CI 95% | p | β | CI 95% | p | β | CI 95% | p | |
| Intercept | 2.282 | 1.85, 2.71 | <0.01 | 8.818 | 3.48, 4.14 | <0.01 | 0.882 | 0.65, 1.11 | <0.01 |
| Ob a | 0.600 | 0.36, 0.83 | <0.01 | 0.754 | 0.57, 0.93 | <0.01 | 0.104 | −0.01, 0.22 | 0.09 |
| Gestational Weeks | |||||||||
| 1 b | 0.192 | −0.12, 0.50 | 0.23 | −0.316 | −0.55, −0.07 | 0.01 | −0.043 | −0.20, 0.12 | 0.60 |
| 2 b | 0.063 | −0.25, 0.37 | 0.69 | −0.167 | −0.41, 0.07 | 0.18 | −0.020 | −0.18, 0.14 | 0.80 |
| 3 b | 0.119 | −0.21, 0.44 | 0.47 | −0.104 | −0.35, 0.14 | 0.43 | −0.020 | −0.18, 0.14 | 0.81 |
| Infection | −0.026 | −0.22, 0.27 | 0.83 | 0.073 | 0.11, 0.26 | 0.44 | −0.056 | −0.18, 0.07 | 0.41 |
| Underlying c | 0.032 | −0.25, 0.19 | 0.77 | −0.005 | −0.17, 0.16 | 0.95 | 0.028 | −0.08, 0.14 | 0.63 |
| Complication c | 0.175 | −0.53, 0.18 | 0.33 | −0.279 | −0.55, 0.00 | 0.04 | 0.051 | −0.13, 0.24 | 0.59 |
| R2 (R2 adjusted) | 0.132 (0.105) | 0.248 (0.224) | 0.022 (−0.009) | ||||||
References
- Viteri, F.E. Prevention of iron deficiency. In Micronutrient Deficiencies: A Toolkitfor Policymakers and Public Health Workers; Howson, C.P., Kennedy, E., Horwitz, A., Eds.; Institute of Medicine, National Academy Press: Washington, DC, USA, 1998; pp. 45–102. [Google Scholar]
- Failla, M.L. Trace elements and host defense: Recent advances and continuing challenges. J. Nutr. 2003, 133, 1443S–1447S. [Google Scholar] [CrossRef]
- Corwin, E.J.; Murray-Kolb, L.E.; Beard, J.L. Low hemoglobin level is a risk factor for postpartum depression. J. Nutr. 2003, 133, 4139–4142. [Google Scholar] [CrossRef]
- Perez, E.M.; Hendricks, M.K.; Beard, J.L.; Murray-Kolb, L.E.; Berg, A.; Tomlinson, M.; Irlam, J.; Isaacs, W.; Njengele, T.; Sive, A.; et al. Mother-infant interactions and infant development are altered by maternal iron deficiency anemia. J. Nutr. 2005, 135, 850–855. [Google Scholar] [CrossRef] [PubMed]
- Lozoff, B. Perinatal Iron Deficiency and the Developing Brain. Pediatr. Res. 2000, 48, 137–139. [Google Scholar] [CrossRef]
- Shamah-Levy, T.; Mejía-Rodríguez, F.; Méndez Gómez-Humarán, I.; De la Cruz-Góngora, V.; Mundo-Rosas, V.; Villalpando-Hernández, S. Trend in the prevalence of anemia in Mexican women of childbearing age from 2006–2016. Ensanut MC 2016. Salud Publica Mex. 2018, 60, 301–308. [Google Scholar] [CrossRef]
- Shamah-Levy, T.; Villalpando, S.; Mundo-Rosas, V.; De la Cruz-Góngora, V.; Mejía-Rodríguez, F.; Méndez Gómez-Humarán, I. Prevalence of anemia in reproductive-age Mexican women. Salud Publica Mex. 2013, 55 (Suppl. 2), S190–S198. [Google Scholar] [CrossRef]
- Villalpando, S.; García-Guerra, A.; Ramírez-Silva, C.I.; Mejía-Rodríguez, F.; Matute, G.; Shamah-Levy, T.; Rivera, J.A. Iron, zinc and iodide status in Mexican children under 12 years and women 12–49 years of age. A probabilistic national survey. Salud Publica Mex. 2003, 45 (Suppl. 4), S520–S529. [Google Scholar] [CrossRef]
- Casanueva, E.; de Regil, L.M.; Flores-Campuzano, M.F. Iron deficiency anemia among Mexican women on reproductive age. History of an unresolved problem. Salud Publica Mex. 2006, 48, 166–175. [Google Scholar] [CrossRef] [PubMed]
- Instituto Nacional de Salud Pública y Secretaría de Salud de México Encuesta Nacional de Salud y Nutrición de Medio Camino 2016 (ENSANUT 2016) Informe Final de Resultados. Available online: http://transparencia.insp.mx/2017/auditorias-insp/12701_Resultados_Encuesta_ENSANUT_MC2016.pdf (accessed on 20 February 2019).
- Bothwell, T.H. Iron requirements in pregnancy and strategies to meet them. Am. J. Clin. Nutr. 2000, 72, 257S–264S. [Google Scholar] [CrossRef]
- Hallberg, L.; Rossander-Hultén, L. Iron requirements in menstruating women. Am. J. Clin. Nutr. 1991, 54, 1047–1058. [Google Scholar] [CrossRef]
- Van Santen, S.; Kroot, J.J.C.; Zijderveld, G.; Wiegerinck, E.T.; Spaanderman, M.E.A.; Swinkels, D.W. The iron regulatory hormone hepcidin is decreased in pregnancy: A prospective longitudinal study. Clin. Chem. Lab. Med. 2013, 51, 1395–1401. [Google Scholar] [CrossRef]
- Miller, E.M. The reproductive ecology of iron in women. Am. J. Phys. Anthropol. 2016, 159, S172–S195. [Google Scholar] [CrossRef]
- Wrighting, D.M.; Andrews, N.C. Interleukin-6 induces hepcidin expression through STAT3. Blood 2006, 108, 3204–3209. [Google Scholar] [CrossRef]
- Chung, B.; Matak, P.; McKie, A.T.; Sharp, P. Leptin increases the expression of the iron regulatory hormone hepcidin in HuH7 human hepatoma cells. J. Nutr. 2007, 137, 2366–2370. [Google Scholar] [CrossRef] [PubMed]
- Tussing-Humphreys, L.; Pusatcioglu, C.; Nemeth, E.; Braunschweig, C. Rethinking iron regulation and assessment in iron deficiency, anemia of chronic disease, and obesity: Introducing hepcidin. J. Acad. Nutr. Diet. 2012, 112, 391–400. [Google Scholar] [CrossRef]
- Dao, M.C.; Sen, S.; Iyer, C.; Klebenov, D.; Meydani, S.N. Obesity during pregnancy and fetal iron status: Is Hepcidin the link? J. Perinatol. 2013, 33, 177–181. [Google Scholar] [CrossRef] [PubMed]
- Flynn, A.C.; Begum, S.; White, S.L.; Dalrymple, K.; Gill, C.; Alwan, N.A.; Kiely, M.; Latunde-Dada, G.; Bell, R.; Briley, A.L.; et al. Relationships between Maternal Obesity and Maternal and Neonatal Iron Status. Nutrients 2018, 10, 1000. [Google Scholar] [CrossRef]
- Cao, C.; Pressman, E.K.; Cooper, E.M.; Guillet, R.; Westerman, M.; O’Brien, K.O. Prepregnancy Body Mass Index and Gestational Weight Gain Have No Negative Impact on Maternal or Neonatal Iron Status. Reprod. Sci. 2016, 23, 613–622. [Google Scholar] [CrossRef]
- Garcia-Valdes, L.; Campoy, C.; Hayes, H.; Florido, J.; Rusanova, I.; Miranda, M.T.; McArdle, H.J. The impact of maternal obesity on iron status, placental transferrin receptor expression and hepcidin expression in human pregnancy. Int. J. Obes. 2015, 39, 571–578. [Google Scholar] [CrossRef]
- Jones, A.D.; Zhao, G.; Jiang, Y.-P.; Zhou, M.; Xu, G.; Kaciroti, N.; Zhang, Z.; Lozoff, B. Maternal obesity during pregnancy is negatively associated with maternal and neonatal iron status. Eur. J. Clin. Nutr. 2016, 70, 918–924. [Google Scholar] [CrossRef]
- Flores-Quijano, M.E.; Montalvo-Velarde, I.; Vital-Reyes, V.S.; Rodríguez-Cruz, M.; Rendón-Macías, M.E.; López-Alarcón, M. Longitudinal Analysis of the Interaction Between Obesity and Pregnancy on Iron Homeostasis: Role of Hepcidin. Arch. Med. Res. 2016, 47, 550–556. [Google Scholar] [CrossRef] [PubMed]
- Obesity and Overweight. Available online: http://www.who.int/mediacentre/factsheets/fs311/en/ (accessed on 28 August 2018).
- López-Olmedo, N.; Carriquiry, A.L.; Rodríguez-Ramírez, S.; Ramírez-Silva, I.; Espinosa-Montero, J.; Hernández-Barrera, L.; Campirano, F.; Martínez-Tapia, B.; Rivera, J.A. Usual Intake of Added Sugars and Saturated Fats Is High while Dietary Fiber Is Low in the Mexican Population. J. Nutr. 2016, 146, 1856S–1865S. [Google Scholar] [CrossRef] [PubMed]
- Batis, C.; Hernandez-Barrera, L.; Barquera, S.; Rivera, J.A.; Popkin, B.M. Food acculturation drives dietary differences among Mexicans, Mexican Americans, and Non-Hispanic Whites. J. Nutr. 2011, 141, 1898–1906. [Google Scholar] [CrossRef] [PubMed]
- Nutrient Data Laboratory: USDA ARS. Available online: https://www.ars.usda.gov/northeast-area/beltsville-md-bhnrc/beltsville-human-nutrition-research-center/nutrient-data-laboratory/ (accessed on 11 October 2018).
- Tussing-Humphreys, L.M.; Nemeth, E.; Fantuzzi, G.; Freels, S.; Guzman, G.; Holterman, A.-X.L.; Braunschweig, C. Elevated Systemic Hepcidin and Iron Depletion in Obese Premenopausal Females. Obesity 2009, 18, 1449–1456. [Google Scholar] [CrossRef]
- Schulze, K.J.; Christian, P.; Ruczinski, I.; Ray, A.L.; Nath, A.; Wu, L.S.-F.; Semba, R.D. Hepcidin and iron status among pregnant women in Bangladesh. Asia Pac. J. Clin. Nutr. 2008, 17, 451–456. [Google Scholar]
- World Health Organization. Hemoglobin Concentrations for the Diagnosis of Anemia and Assessment of Severity. Available online: https://www.who.int/vmnis/indicators/haemoglobin.pdf (accessed on 24 October 2018).
- Milman, N. Iron and pregnancy—A delicate balance. Ann. Hematol. 2006, 85, 559–565. [Google Scholar] [CrossRef] [PubMed]
- Human sTfR Quantikine IVD ELISA Kit. Available online: https://resources.rndsystems.com/pdfs/datasheets/dtfr1.pdf (accessed on 24 October 2018).
- Rawal, S.; Hinkle, S.N.; Bao, W.; Zhu, Y.; Grewal, J.; Albert, P.S.; Weir, N.L.; Tsai, M.Y.; Zhang, C. A longitudinal study of iron status during pregnancy and the risk of gestational diabetes: Findings from a prospective, multiracial cohort. Diabetologia 2017, 60, 249–257. [Google Scholar] [CrossRef]
- Hedengran, K.K.; Nelson, D.; Andersen, M.R.; Stender, S.; Szecsi, P.B. Hepcidin levels are low during pregnancy and increase around delivery in women without iron deficiency—A prospective cohort study. J. Matern. Fetal. Neonatal Med. 2016, 29, 1506–1508. [Google Scholar]
- Koenig, M.D.; Tussing-Humphreys, L.; Day, J.; Cadwell, B.; Nemeth, E. Hepcidin and iron homeostasis during pregnancy. Nutrients 2014, 6, 3062–3083. [Google Scholar] [CrossRef] [PubMed]
- Tussing-Humphreys, L.M.; Liang, H.; Nemeth, E.; Freels, S.; Braunschweig, C.A. Excess adiposity, inflammation, and iron-deficiency in female adolescents. J. Am. Diet. Assoc. 2009, 109, 297–302. [Google Scholar] [CrossRef]
- Del Giudice, E.M.; Santoro, N.; Amato, A.; Brienza, C.; Calabrò, P.; Wiegerinck, E.T.; Cirillo, G.; Tartaglione, N.; Grandone, A.; Swinkels, D.W.; et al. Hepcidin in Obese Children as a Potential Mediator of the Association between Obesity and Iron Deficiency. J. Clin. Endocrinol. Metab. 2009, 94, 5102–5107. [Google Scholar] [CrossRef] [PubMed]
- Rehu, M.; Punnonen, K.; Ostland, V.; Heinonen, S.; Westerman, M.; Pulkki, K.; Sankilampi, U. Maternal serum hepcidin is low at term and independent of cord blood iron status. Eur. J. Haematol. 2010, 85, 345–352. [Google Scholar] [CrossRef]
- Lee, S.; Guillet, R.; Cooper, E.M.; Westerman, M.; Orlando, M.; Pressman, E.; O’Brien, K.O. Maternal inflammation at delivery affects assessment of maternal iron status. J. Nutr. 2014, 144, 1524–1532. [Google Scholar] [CrossRef]
- Ganz, T.; Nemeth, E. Iron homeostasis in host defence and inflammation. Nat. Rev. Immunol. 2015, 15, 500–510. [Google Scholar] [CrossRef]
- Ikeda, Y.; Tajima, S.; Izawa-Ishizawa, Y.; Kihira, Y.; Ishizawa, K.; Tomita, S.; Tsuchiya, K.; Tamaki, T. Estrogen regulates hepcidin expression via GPR30-BMP6-dependent signaling in hepatocytes. PLoS ONE 2012, 7, e40465. [Google Scholar] [CrossRef]
- Li, X.; Rhee, D.K.; Malhotra, R.; Mayeur, C.; Hurst, L.A.; Ager, E.; Shelton, G.; Kramer, Y.; McCulloh, D.; Keefe, D.; et al. Progesterone receptor membrane component-1 regulates hepcidin biosynthesis. J. Clin. Investig. 2016, 126, 389–401. [Google Scholar] [CrossRef] [PubMed]
- Darshan, D.; Anderson, G.J. Interacting signals in the control of hepcidin expression. Biometals 2009, 22, 77–87. [Google Scholar] [CrossRef]
 ) and < 0.1 (
  ); * CRP was significantly associated to: First study visit: IL-6 (0.320, p = 0.002) and to leptin (0.320, p = 0.002); Last study visit: IL-6 (0.400, p = 0.003) and to leptin (0.356, p = 0.008).
) and < 0.1 ( ); * CRP was significantly associated to: First study visit: IL-6 (0.320, p = 0.002) and to leptin (0.320, p = 0.002); Last study visit: IL-6 (0.400, p = 0.003) and to leptin (0.356, p = 0.008).
); * CRP was significantly associated to: First study visit: IL-6 (0.320, p = 0.002) and to leptin (0.320, p = 0.002); Last study visit: IL-6 (0.400, p = 0.003) and to leptin (0.356, p = 0.008).
) and < 0.1 ( ); * CRP was significantly associated to: First study visit: IL-6 (0.320, p = 0.002) and to leptin (0.320, p = 0.002); Last study visit: IL-6 (0.400, p = 0.003) and to leptin (0.356, p = 0.008).
 ) and Ob (
  ). Graphs to the left show the results of generalized linear model (GLM) adjusted for study group (Ob and AW), gestational week, total iron intake, underlying health conditions, and pregnancy complications. Graphs to the right show the results of the same models adjusted for inflammation (adding C-reactive protein [CRP] as a covariable). In all models, hepcidin was considered as a covariable, except for the hepcidin model where sTfr was used. p-Values show the statistical difference between AW and Ob groups during pregnancy.
) and Ob ( ). Graphs to the left show the results of generalized linear model (GLM) adjusted for study group (Ob and AW), gestational week, total iron intake, underlying health conditions, and pregnancy complications. Graphs to the right show the results of the same models adjusted for inflammation (adding C-reactive protein [CRP] as a covariable). In all models, hepcidin was considered as a covariable, except for the hepcidin model where sTfr was used. p-Values show the statistical difference between AW and Ob groups during pregnancy.
). Graphs to the left show the results of generalized linear model (GLM) adjusted for study group (Ob and AW), gestational week, total iron intake, underlying health conditions, and pregnancy complications. Graphs to the right show the results of the same models adjusted for inflammation (adding C-reactive protein [CRP] as a covariable). In all models, hepcidin was considered as a covariable, except for the hepcidin model where sTfr was used. p-Values show the statistical difference between AW and Ob groups during pregnancy.
) and Ob ( ). Graphs to the left show the results of generalized linear model (GLM) adjusted for study group (Ob and AW), gestational week, total iron intake, underlying health conditions, and pregnancy complications. Graphs to the right show the results of the same models adjusted for inflammation (adding C-reactive protein [CRP] as a covariable). In all models, hepcidin was considered as a covariable, except for the hepcidin model where sTfr was used. p-Values show the statistical difference between AW and Ob groups during pregnancy.
| Adequate Weight (n = 53) | Obese (n = 40) | pa | |
|---|---|---|---|
| pgBMI, kg/m2 | 22.71 ± 1.95 | 34.81 ± 4.80 | <0.001 |
| Age, year | 31.68 ± 5.66 | 31.13 ± 5.89 | 0.647 |
| Parity | |||
| nulliparous | 33 (62.3) | 22 (55.0) | |
| primiparous | 18 (34) | 11 (27.5) | |
| multiparous | 2 (3.8) | 7 (17.5) | 0.080 |
| Lives with child’s father | 44 (83) | 35 (87.5) | 0.550 |
| Housewife | 31 (58.5) | 28 (70.0) | 0.254 |
| Socioeconomic level | |||
| Lowest two quintiles | 22 (42.3) | 24 (61.5) | 0.069 |
| Adequate Weight (n = 53) | Obese (n = 40) | pa | |
|---|---|---|---|
| Inflammatory biomarkers | |||
| IL-6 (pg/mL) | 1.79 (1.63, 2.10) | 2.15 (1.81, 2.43) | <0.01 |
| Leptin (pg/mL) | 21.50 (15.11, 26.25) | 44. 48 (32.14, 61.57) | <0.01 |
| CRP (mg/L) | 4.36 (3.04, 8.58) | 10.65 (6.84, 15.40) | <0.01 |
| Iron biomarkers | |||
| Hepcidin (ng/mL) | 8.04 (5.88, 11.86) | 9.58 (6.21, 15.67) | 0.23 |
| sTfr (mg/L) | 1.00 (0.84, 1.20) | 1.04 (0.82, 1.44) | 0.41 |
| Serum iron (μg/dL) | 162.45 (129.8, 199.5) | 149.76 (113.6, 199.7) | 0.47 |
| Ferritin (ng/mL) | 39.30 (27.60, 65.05) | 40.60 (19.40, 96.15) | 0.89 |
| Hemoglobin (g/dL) | 13.55 (13.18, 14.45) | 13.39 (13.08, 13.99) | 0.36 |
© 2019 by the authors. Licensee MDPI, Basel, Switzerland. This article is an open access article distributed under the terms and conditions of the Creative Commons Attribution (CC BY) license (http://creativecommons.org/licenses/by/4.0/).
Share and Cite
Flores-Quijano, M.E.; Vega-Sánchez, R.; Tolentino-Dolores, M.C.; López-Alarcón, M.G.; Flores-Urrutia, M.C.; López-Olvera, A.D.; Talavera, J.O. Obesity Is Associated with Changes in Iron Nutrition Status and Its Homeostatic Regulation in Pregnancy. Nutrients 2019, 11, 693. https://doi.org/10.3390/nu11030693
Flores-Quijano ME, Vega-Sánchez R, Tolentino-Dolores MC, López-Alarcón MG, Flores-Urrutia MC, López-Olvera AD, Talavera JO. Obesity Is Associated with Changes in Iron Nutrition Status and Its Homeostatic Regulation in Pregnancy. Nutrients. 2019; 11(3):693. https://doi.org/10.3390/nu11030693
Chicago/Turabian StyleFlores-Quijano, María Eugenia, Rodrigo Vega-Sánchez, Mari Cruz Tolentino-Dolores, Mardia Guadalupe López-Alarcón, Mónica Crissel Flores-Urrutia, Ana Daniela López-Olvera, and Juan O Talavera. 2019. "Obesity Is Associated with Changes in Iron Nutrition Status and Its Homeostatic Regulation in Pregnancy" Nutrients 11, no. 3: 693. https://doi.org/10.3390/nu11030693
APA StyleFlores-Quijano, M. E., Vega-Sánchez, R., Tolentino-Dolores, M. C., López-Alarcón, M. G., Flores-Urrutia, M. C., López-Olvera, A. D., & Talavera, J. O. (2019). Obesity Is Associated with Changes in Iron Nutrition Status and Its Homeostatic Regulation in Pregnancy. Nutrients, 11(3), 693. https://doi.org/10.3390/nu11030693