Article

A Dietary Pattern with High Sugar Content Is Associated with Cardiometabolic Risk Factors in the Pomak Population

1
Department of Nutrition and Dietetics, School of Health Science and Education, Harokopio University, 17671 Athens, Greece
2
MRC Unit for Lifelong Health & Ageing, Institute of Cardiovascular Science, University College London, London WC1E 7HB, UK
3
Institute of Translational Genomics, Helmholtz Zentrum Munchen, German Research Center for Environmental Health, D-85764 Neuherberg, Germany
4
Wellcome Trust Centre for Human Genetics, University of Oxford, Roosevelt Drive, Oxford OX3 7BN, UK
5
Oxford Centre for Diabetes, Endocrinology and Metabolism, Churchill Hospital, Headington, Oxford OX3 7LE, UK
6
Wellcome Sanger Institute, The Morgan Building, Wellcome Trust Genome Campus, Hinxton, Cambridge CB10 1HH, UK
7
Genomics England, Queen Mary University of London, Dawson Hall, Charterhouse Square, London EC1M 6BQ, UK
8
Echinos Medical Centre, Xanthi 67300, Greece
9
Dromokaiteio Psychiatric Hospital of Athens, Chaidari, Athens 12461, Greece
10
Medical School, National and Kapodistrian University of Athens, Goudi, Athens 11527, Greece
11
Department of Human Metabolism, University of Sheffield, Sheffield S10 2TN, UK
*
Author to whom correspondence should be addressed.
These authors contributed equally to this work.
Nutrients 2019, 11(12), 3043; https://doi.org/10.3390/nu11123043
Submission received: 20 November 2019 / Revised: 9 December 2019 / Accepted: 10 December 2019 / Published: 13 December 2019

Abstract

:
The present study describes the geographically isolated Pomak population and its particular dietary patterns in relationship to cardiovascular risk factors. We collected a population-based cohort in a cross-sectional study, with detailed anthropometric, biochemical, clinical, and lifestyle parameter information. Dietary patterns were derived through principal component analysis based on a validated food-frequency questionnaire, administered to 1702 adult inhabitants of the Pomak villages on the Rhodope mountain range in Greece. A total of 69.9% of the participants were female with a population mean age of 44.9 years; 67% of the population were overweight or obese with a significantly different prevalence for obesity between men and women (17.5% vs. 37.5%, respectively, p < 0.001). Smoking was more prevalent in men (45.8% vs. 2.2%, p < 0.001), as 97.3% of women had never smoked. Four dietary patterns emerged as characteristic of the population, and were termed “high in sugars”, “quick choices”, “balanced”, and “homemade”. Higher adherence to the “high in sugars” dietary pattern was associated with increased glucose levels (p < 0.001) and increased risk of hypertension (OR (95% CI) 2.61 (1.55, 4.39), p < 0.001) and nominally associated with high blood glucose levels (OR (95% CI) 1.85 (1.11, 3.08), p = 0.018), compared to lower adherence. Overall, we characterize the dietary patterns of the Pomak population and describe associations with cardiovascular risk factors.

1. Introduction

The World Health Organization reports that cardiovascular disease (CVD) is the number one cause of death globally and largely caused by risk factors that can be controlled, treated, or modified, such as high blood pressure, cholesterol, obesity, tobacco use, physical inactivity, an unhealthy diet, and diabetes [1]. The inverse relationship between the consumption of a plant-based diet and CVD prevalence has previously been established from cross-sectional, prospective, case-control [2,3], and clinical studies, an effect attributed to dietary fiber decreasing serum cholesterol levels [4,5] and the antioxidant compounds that predispose to lipoprotein oxidation [5,6]. On the other hand, compounds usually encountered in meat-based diets, such as saturated and trans fatty acids, are associated with increased risk of developing atherosclerosis [7].
Diet is generally regarded as a major contributing factor to CVD prevention and treatment, and is considered to be the most important environmental component affecting hypertension [8]. In this context, the DASH (Dietary Approaches to Stop Hypertension) diet, characterized by higher intake of fruits, vegetables, low-fat dairy, grains, fish, and poultry, has been shown to be effective in reducing both systolic and diastolic blood pressure levels [9,10]. The study of dietary patterns represents a more holistic approach to the investigation of exposure–disease associations, as nutrients are not consumed in isolation, but rather as part of many different meals consisting of foods with a variety of both micro- and macronutrients. Principal component analysis (PCA) is a data-driven approach that reduces the large number of food variables into a smaller set that captures the major dietary traits of a population [11].
The Pomaks have, for centuries, inhabited the mountains of Thrace, an area in the northeast of modern Greece. The Pomaks live across the Rhodope mountain range and, following World War II, their populations were split between Greece and Bulgaria. In Greece, Pomaks dwell in three main areas: villages to the north of Xanthi, Komotini, and Evros [12]. They represent a Muslim minority in Greece with uncertain origins [13]. According to the most dominant theory, the Pomaks are descendants of the natives of the Rhodope Mountains [14].
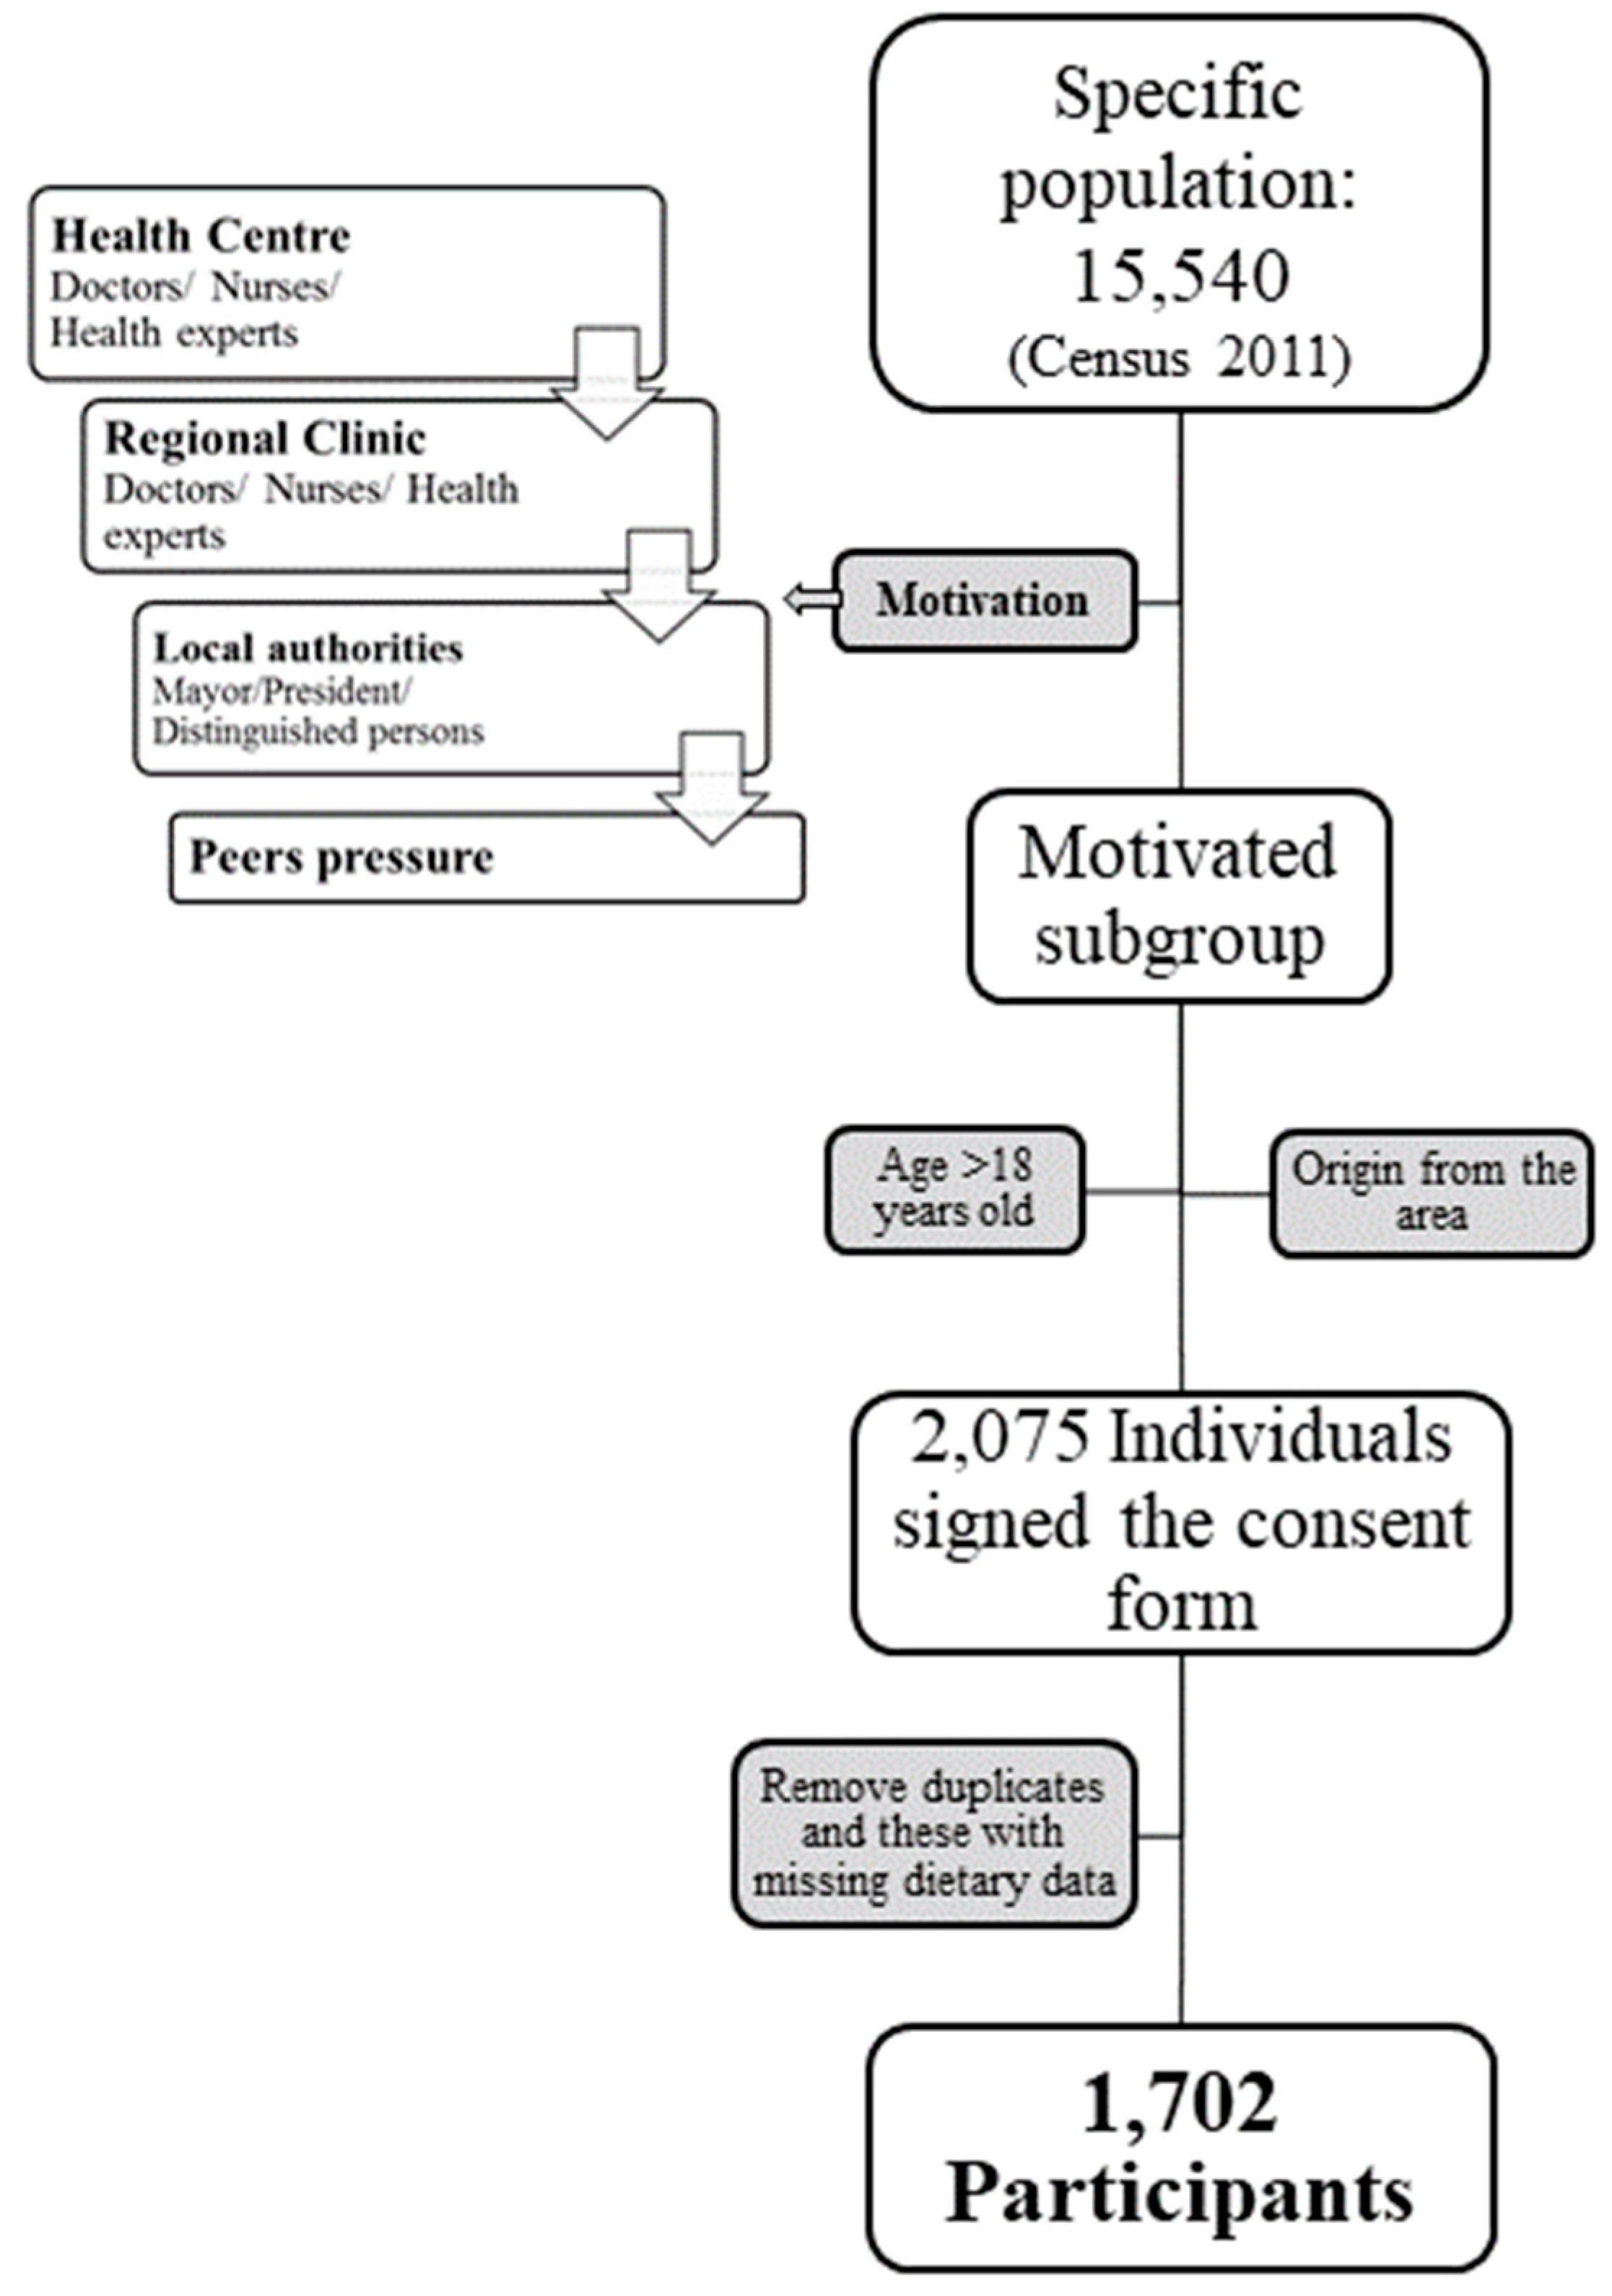
Although the population has been the object of extensive research, in terms of politics and folklore culture, to date there have not been any studies on their health and lifestyle. The main objective of this work was to conduct a well-phenotyped, population-based study in order to facilitate epidemiological analyses with respect to cardiovascular disease. The present study investigates the potential associations between dietary patterns derived from analyzing the eating habits of the local Pomak populations and cardiometabolic risk factors, as well as diabetes prevalence.

2. Materials and Methods

2.1. Study Population

The Pomak target population comprised adults originating from villages located in the regional unit of Xanthi (population estimated to be 25,000 in total).
We contacted the local Health Centre in Echinos and, with the cooperation of the local doctors and nurses, a total of 1702 volunteers were recruited between July 2010 and March 2013. The recruitment flowchart is summarized in Figure 1. The Bioethics Committee of Harokopio University of Athens approved the study protocol and all subjects signed a voluntary informed consent form, according to the standards of the World Medical Association’s Declaration of Helsinki for ethical principles for medical research involving human subjects. All participants were interviewed by trained personnel using a standardized questionnaire. The questionnaire included clinical assessment and anthropometric measurements, as well as questions on demographic and lifestyle characteristics, detailed self-reported medical history, physical activity, and dietary habits. The medical history and corresponding medication were cross-checked by trained clinicians.

2.2. Bioche Mical Analysis

In the regional medical centers, blood samples were collected from the antecubital vein by trained health professionals following blood pressure measurement. All blood draws were conducted in the morning after an overnight fast. Serum and plasma were isolated following centrifugation at 3000 rpm for 10 min and stored at −80 °C for future analyses. Biochemical factors were assessed by Bioiatriki Healthcare Group, Athens, using enzymatic colorimetric assays, including glucose (hexokinase method), total cholesterol (cholesterol oxidase–phenol aminophenazone method), high-density lipoprotein (HDL) cholesterol, and triglycerides (glycerol-3-phosphate oxidase–phenol aminophenazone). Insulin was measured via chemiluminescence and low-density lipoprotein (LDL) cholesterol levels were calculated according to the Friedewald equation [15].

2.3. Anthropometric Measurements

The anthropometric measurements, including weight, height, waist circumference (WC), and hip circumference, were collected by trained dietitians using standardized techniques and equipment [16]. Body weight was measured using calibrated analog scales. For height and other anthropometric measurements, a stable tape was used.
Body mass index (BMI) was calculated as weight (kg) divided by height2 (m2). BMI was used to classify subjects as underweight (BMI < 18.5 kg/m2), normal weight (18.5 < BMI < 24.9 kg/m2), overweight (25.0 < BMI < 29.9 kg/m2) and obese (BMI > 30.0 kg/m2). Waist-to-hip ratio (WHR) was also calculated.

2.4. Demographic and Lifestyle Information

Information on marital status (married, separated, divorced, single, or widowed) was collected. Educational level was defined as no education, primary, secondary, or tertiary education, and the total number of years in education was recorded. Information on smoking habits was also collected; subjects were classified as current smokers, ex-smokers, and those who had never smoked. Pack-year was used as the unit for measuring the amount a person smoked over a long period of time and calculated by multiplying the number of packs of cigarettes (20 cigarettes per pack) smoked per day by the number of years the person has smoked.

2.5. Physical Activity Assessment

Physical activity was evaluated using the Harokopio Physical Activity Questionnaire (HAPAQ) [17]. The questionnaire collects information on self-reported physical activity over the preceding week, and examines the time spent in light, moderate, and high-intensity activities as well as time asleep. The questionnaire is based on metabolic equivalents for all activities in the preceding week, including those at work, leisure, and at rest or asleep, thus allowing the estimation of a mean physical activity level (PAL) and a mean daily energy expenditure (EE). These were used to quantify the intensity of activity and consequently to calculate energy expenditure from the activities identified in the questionnaire using the method of metabolic equivalents (MET) [18].
Based on the HAPAQ and its corresponding calculations for estimating the variables from the data, a program entitled “the Physical Activity Program” was developed to automate and accelerate the calculations to derive these estimations (available online: http://www.well.ox.ac.uk/~wrayner/tools/). The program is written in Perl and can be used to transform physical activity data into PAL, total EE, and many of the other intermediate calculations.

2.6. Dietary Assessment

Dietary information was collected via a validated semiquantitative 76-item food-frequency questionnaire (FFQ) [19]. All participants reported their daily, weekly, and monthly average intake of a variety of foods during the past year. The former served as the basis for quantifying the frequency of the consumption of the food items, on the basis of servings per week and according to the dietary guidelines for adults in Greece [20].
The above-mentioned transformations (foods and food groups in servings) were calculated programmatically.
Energy intake (EI) was extracted from the FFQ [21]. In order to identify and exclude energy under-reporters, the Goldberg et al. method [21,22] was used, according to the equation:
E I : B M R   >   P A L   x exp [ 2     x   S 100 n   ]   where     S = C V w E I 2 d + C V w B 2 + C V t P 2
where C V w E I   : within-individual coefficient of variation for energy intake; d: the number of days of diet assessment (for FFQs, d approaches infinity and so C V w E I 2 d = 0); C V w B     : coefficient of variation of measured or predicted BMR; C V t P   : coefficient of variation for PAL; and n: number of individuals for which intake is examined. PAL is a multiple of BMR and therefore represents the activity level of each subject as a ratio of BMR (PAL = EE:BMR) [23]. The coefficient of variation (CV) for estimated BMR has been determined to be 8% [24] while the CV for the PAL is 12.5% [25]. Thus, the above equation for our study applies as follows:
C V w E I   = 0 ,   C V w B   = 8 ,   C V t P   = 12.5
E I : B M R > E E : B M R   x exp [ 2     x   S 100 n   ]   = >   E I : E E > exp [ 2     x   S 100 n   ] ,   where   S = ( 8 )   2 + ( 12.5 )   2
so EI:EE > 0.74 provided that evaluation is conducted on an individual basis (n = 1). Individuals whose energy intake to energy expenditure (EI/EE) ratio was below this cut-off point (0.74) were defined as under-reporters and excluded from subsequent dietary analyses (N final = 1513).

2.7. Statistical Analysis

The data handling, basic processing, and descriptive characteristic analysis were carried out in R [25,26,27]. Sex differences were assessed using the Wilcoxon test. Distribution normality was checked with the Shapiro–Wilk test applying sex stratification where needed. Hypothesis testing was performed using the chi-squared test for categorical variables and Student’s T test or Mann–Whitney for continuous variables in two different groups.
Outliers were defined as values that exceeded three (3) standard deviations (SD) from the mean and were removed from subsequent analyses. Binary variables were created dividing subjects into normal and pathological levels of anthropometric (WC, WHR) [28], clinical (systolic blood pressure-SBP, diastolic blood pressure-DBP), and biochemical (total cholesterol, LDL, glucose, insulin) indices [29], taking into account the corresponding diagnosis and medication information.
Principal component analysis (PCA) was undertaken to identify underlying dietary patterns [30]. In order for PCA to be effective in assessing food patterns, strong correlations between the predictive variables should exist. The Kaiser–Meyer–Olkin (KMO) criterion was calculated at 0.76, which is close to one implying high interrelationships between food variables and therefore suitability of the data set for PCA. The orthogonal rotation (varimax option) was used to derive optimal noncorrelated components (dietary patterns). Fifteen foods and food groups were used from the entire database. The Kaiser criterion was used in order to decide on the number of components to retain, according to which, the number of components that should be retained from PCA is equal to the number of Eigen values greater than 1. In our analysis, a four-component (food pattern) solution was selected. Based on the factor loadings/correlation coefficients that represent the correlation of each predicting variable with the dietary pattern score, higher absolute values indicate that the variable contributes more to the construction of a particular pattern. Dietary patterns were named according to the scores of the predicting variables with the highest correlation to the component/pattern (>|0.4|). The median was used to divide pattern scoring into two groups: low and high. The PCA was performed using SPSS [31] and four dietary patterns emerged: the “high in sugars”, the “quick choices”, the “balanced”, and the “homemade” patterns.
Multiple linear regression was used to examine the association between cardiometabolic indices and dietary patterns. In particular, four different models were applied: Model 1 was unadjusted; Model 2 included adjustment for age, sex, and BMI; Model 3, as per Model 2, with the additional adjustment for corresponding medication (for hypertension, hyperlipidemia, and diabetes), smoking in pack-years, and EI/EE ratio; and Model 4, as per Model 3 with the additional adjustment for the rest of the dietary patterns. As these patterns are statistically independent, it is possible for an individual to have high or low scores on more than one pattern at the same time and therefore all the patterns might act in concert [32]. The results from the linear regression models are presented as beta coefficients (β) and 95% confidence intervals (CI). Moreover, participants’ dietary component scores were categorized into tertiles so that, for each dietary component, the third quartile included individuals whose dietary habits were mostly adherent to that particular pattern. Based on the statistically significant relationships provided by the linear regression models tested, logistic regression analysis was further performed to evaluate the association between the tertiles of each dietary component and the probability of having pathological levels of various cardiometabolic indices, according to the Third Report of the National Cholesterol Education Program (NCEP) [18]. The results of the logistic regression models are presented as odds ratios (OR) and 95% CI. The linear and logistic regressions were performed in SPSS [31]. In all statistical analyses, the level of nominal significance was set at p = 0.05. The adjusted threshold after multiple testing was set to (0.05/4 parameters examined, i.e., dietary patterns =) 0.0125.

3. Results

The anthropometric and clinical characteristics of the population are presented in Table 1. Of the 1702 participants, 30.7% were male and 69.3% female. The mean age of the population was 44.9 years and male volunteers were on average 5.5 years older than women (p < 0.001). In addition, men were found to have greater WC (96.1 vs. 90.4 cm, p < 0.001) and WHR (0.94 vs. 0.84, p = 3.0E-80) than women. However, women showed a higher BMI compared to men (28 vs. 26.4 kg/m2, p < 0.001). A larger proportion of men were categorized as overweight (44.7% vs. 31.7%), while the proportion of obese women in the population was much greater than for men (25.9% vs. 5.5%, p < 0.001). The mean value for systolic blood pressure was 131.2 mmHg, with men presenting significantly higher levels than women (133.3 vs. 130.1 mmHg, p = 0.001). Refined cereals, dairy, vegetables, and sweets showed the greatest weekly consumption of all the food groups.
Hypertension and hyperlipidemia were the most prevalent disorders in the population (Table 2). A higher percentage of men had hyperlipidemia (19.5% vs. 15.4%, p = 0.036), presbyopia (11.1% vs. 6.2%, p < 0.001), type 2 diabetes (10.2% vs. 6.1%, p = 0.003), and coronary heart disease (11.7% vs. 4.6%, p < 0.001) compared to women, while depression (11.7% vs. 7.5%, p = 0.008), hypothyroidism (11.5% vs. 2.1%, p < 0.001), and migraine (8.8% vs. 4.8%, p = 0.004) were more prevalent in women.
Table 3 shows the sociodemographic and lifestyle characteristics of the Pomak population. The vast majority of the participants was married (86.7%) and reported primary education (72.2%). The proportion of illiteracy was higher in women than in men (13.2% vs. 5.8%, p < 0.001). The proportion of both current and former smokers was 20 and 40 times higher in men compared to women, respectively, while the vast majority of women (97.3%) and one third of men (35%) had never smoked (p < 0.001).
PCA highlighted four different dietary patterns (components), the factor loadings of which are presented in Table 4. Alcohol and pork consumption were excluded as their consumption in the Pomak population was insignificant due to religious reasons. Fifteen out of the 48 remaining foods or food groups were included in the PCA as highly intercorrelated. The KMO criterion was 0.72, and 52% of the total variance was explained by the four dietary components. The components were defined according to the higher absolute scores that indicate greater contribution to each component. Thus, there are: the “high in sugars” dietary pattern (component 1), which includes fresh fruits, milky sweets, chocolate, beverages, juices, and starchy sweets; the “quick choices” dietary pattern (component 2), which is composed of processed red meat, ready-made pies, refined breads, and fries; the “balanced” dietary pattern (component 3), that consists of refined pasta, white rice, vegetables, legumes, and red meat; and the “homemade” dietary pattern (component 4), that is characterized by homemade pies, full-fat cheese, and potato consumption. The median of the scores for each component was used to divide the population into two groups: low and high adherence to the particular pattern.
As presented in Table 5, women had significantly higher HDL cholesterol (p < 0.001) and lower triglyceride levels (p < 0.001) than men. The group with the higher scores in the “high in sugar” pattern and the balanced diet had elevated mean glucose levels. Mean HDL cholesterol was lower in the group with higher adherence scores to the “high in sugar” pattern, while LDL and total cholesterol levels were found to be higher in the group with lower adherence scores to the “quick choices” dietary pattern. The group with higher scores in the “high in sugar” pattern presented lower triglycerides levels compared to the group with lower scores in the same pattern.
The multiadjusted linear regression results are shown in Table 6. In particular, component 1 with the high sugar content was associated with higher SBP (β = 2.47, p < 0.001), DBP (β = 1.46, p < 0.001), and glucose levels (β = 3.44, p < 0.001). Additionally, the high in sugars diet was found to be significantly associated with increased LDL cholesterol but the association was found not significant after adjustment for the remaining components of the diet. Component 2, representing the quick choices/junk food pattern, was found to be associated with increased insulin levels, albeit without high statistical significance (β = 0.73, p = 0.025). Component 3, representing the balanced diet, was significantly associated with reduced SBP (β = −1.59, p = 0.001). Component 4, the homemade dietary pattern, was found to be significantly associated with higher HDL levels, after adjusting for confounders, but the effect was nonsignificant when the remaining dietary patterns were taken into account.
Logistic regression analyses, summarized in Table 7, showed that higher adherence to the high in sugars dietary pattern was nominally associated with increased risk of low HDL (OR [95%CI] 1.84 [1.24,2.75], p = 0.003) and systolic hypertension (OR [95%CI] 2.40 [1.38,4.17], p = 0.002) and statistically significantly associated with increased risk for diastolic hypertension (OR [95%CI] 2.61 [1.55,4.39], p < 0.001), compared to lower adherence (p-values are here compared to the adjusted cut-off of p = 0.0125.)

4. Discussion

This is the first report of a cross-sectional cohort that describes the geographically and religiously isolated, genetically homogeneous [33] population from the Pomak villages in Xanthi, as part of the HELIC-Pomak study (www.helic.org). One advantage of isolated populations is that they are characterized by environmental homogeneity [34] and thus a smaller sample size is required to detect an association with sufficient statistical power.
The Pomak population was found to be overweight, in keeping with observations from the general Greek population in the ATTICA study [35]. The ATTICA study is a population-based health and nutrition survey, which attempts to evaluate several cardiovascular risk factors in the greater urban area of Athens, Greece [36]. One third (31.3%) of the Pomak population was obese, while the corresponding percentage from the Greek Muslim community in the MetS-Greece study from the same area was 63.6% [37]. The discrepancy might be due to the sample size and the population origin, as the MetS study only included 300 individuals from inside and around the city of Xanthi, while in our study we included 1702 individuals from many different villages including Kentavros, Glafki, Echinos, Pachni, Dimario, Melivia, Sminthy, Thermes, Miki, Oreo, and other Pomak villages. Inhabitants of more distant villages have preserved traditional characteristics in many aspects of their lives, while the residents of more urbanized areas and cities conform more closely to the mainstream Greek lifestyle. Consumption of red meat, dairy, and sweets was 2–3 times higher in the Pomak population compared to that of the Attica general population [38], while vegetables, fruits, legumes, and potatoes intake was 2–4 times lower.
The proportion of individuals with hypertension (26.1%) found in the present study was comparable with that of other Greek studies [36,37,38], but much lower than the ones reported (80%) by other isolated, but older, populations, such as the one on the island of Vis in Croatia [39]. Occurrence of hyperlipidemia (16.7%) was in the same direction and magnitude compared to the ATTICA study [38] which found a higher prevalence of the disease (43%). The prevalence of type 2 diabetes (7.3%) was comparable to that of the general Greek population [36] and also to the one of the aforementioned isolated population from the island of Vis, Croatia [39], but half of that reported (14.6%) in the chronic disease records of the local medical center [40]. However, this apparent discrepancy may be due to the fact that these records only included three areas/villages.
The overwhelming majority of the population was married (86%), indicating the traditional position of the family within the society, a trend which is attenuated in more urban areas [36]. Most of the participants had attained primary education, with more men being educated than women, a characteristic unlike that of the urban Greek population [41] which reports almost double the number of total years in education. The smoking habits of men were similar to those of the general population of Attica [42], while almost all women (97%) had never smoked, hinting at the preservation of a past etiquette that indicates the traditional character of this tobacco farming population.
It is noteworthy that the traditional lifestyle of the populations inhabiting the Pomak villages has been extensively studied in various locations, usually referring to factors such as eating habits, which may differ slightly or considerably among the different villages.
In this study, the characterization of the unique diet of the Pomak population was achieved through a posteriori technique, PCA analysis, generating patterns using empirically obtained data [43]. Thus, the derived patterns reflect the most representative eating habits of the population.
The predominant dietary pattern is the “high in sugars” pattern (16.3% of the variance explained), and is very typical and closely connected with the sociocultural aspect of food in the Pomak population. Sweets, which are the main compound of the pattern, are offered after funerals in the form of chocolate or Turkish delight. In addition, increased sweets consumption is highlighted by the existence of a festival dedicated to the offering and the consumption of sweets, the “Seker Bayrami” or “Bayram of Sweets” [12]. Bayram is the word used for festivals or holidays and is applicable to secular and mainly religious celebrations in Islam. In the present study, this particular pattern, which was rich in sugars, was negatively associated with HDL cholesterol levels. A cross-sectional study evaluating data from the National Health and Nutrition Examination Survey 1999–2006 also reported similar findings [44]. The resulting low HDL cholesterol concentrations could be driven by the role of refined carbohydrates on the pathway that decreases insulin sensitivity, increases visceral adiposity, and stimulates hepatic de novo lipogenesis [45].
The former pattern was also found to be associated with increased systolic and diastolic blood pressure. According to a systematic review and meta-analysis of six prospective cohorts, sugar-sweetened beverage consumption was indeed found to be associated with a modest risk of developing hypertension [46]. A different systematic review and meta-analysis of eight studies further demonstrated statistically significant associations between sugary beverage consumption and hypertension [47]. Moreover, habitual consumption of fruit juice was found to be associated with higher central blood pressure and central pulse pressure [48], suggesting the overconsumption of added fructose as the main cause [49,50]. As expected, the “high in sugars” pattern was also associated with increased glucose levels. This is consistent with the results from the EPIC-InterAct study where sugar-sweetened soft drinks were associated with an increased prevalence of type 2 diabetes [51]. The European Prospective Investigation into Cancer and Nutrition (EPIC) study is one of the largest cohort studies in the world, with participants from 10 European countries, and is designed to investigate the relationships between dietary, environmental, and lifestyle factors, and the incidence of chronic diseases. The EPIC-Netherlands follow-up study stated that carbohydrate (hazard ratio 1.15) and starch (hazard ratio 1.25) intake was related to increased diabetes risk [52]. Bringing these together, it is apparent that dietary sugars have many unfavorable effects on a whole spectrum of metabolic disorders that take place in CVD and metabolic syndrome [53].
The “high in sugars” pattern observed in the Pomak population is associated with most of the components of metabolic syndrome, while in the ATTICA study, the “sweets” pattern was not associated with any aspect of metabolic syndrome [54]. One possible reason for this discrepancy could be the differencing tools used for dietary assessment (72 vs. 156 items FFQ) and the diversity of the compounds composing each particular pattern/component. The fat content of the milky sweets and chocolates in the “high in sugars” pattern of the Pomak population may intensify the negative effects on cardiovascular risk, while the specific food compounds of the “sweets” pattern of the ATTICA study are not known.
High fat consumption is mainly represented by the “quick choices pattern”, which includes processed meat, fries, and ready-made pies, as well as refined breads, comprising a fast/junk food pattern. This particular pattern was nominally associated with increased levels of insulin, a finding consistent with current literature, suggesting meat consumption to be associated with hyperinsulinaemia and type 2 diabetes [38,55]. The total fat, mainly consisting of the saturated fat of the meat and the trans fatty acids of the fried potatoes, is believed to contribute to the increased prevalence of insulin resistance and type 2 diabetes [56,57,58].
The “balanced pattern” represents the consumption of rice, pasta, red meat, vegetables, and legumes. Rice is a traditional food of the Pomak population which, in the form of pilaf, is the main dish at ceremonies and celebrations like funerals and weddings. Red meat, such as lamb and beef, has had a central role in the social life of the Pomaks throughout their history, with the dedication of an entire religious festival to its consumption, called “Kurban Bayramı” or “Sacrifice Bayram” [12]. The former represents a prudent dietary pattern that incorporates customs and traditions of Pomaks and is found to be associated with reduced systolic and diastolic blood pressure. Similar results have been reported by the ATTICA study [42], where the Mediterranean diet was associated with a lower risk of hypertension (OR = 0.74, p = 0.021). Pala et al. found that hypertension was associated with adherence to the pasta and meat pattern [59]. The opposite findings demonstrated in the present study could be attributed to the additional constituents of the pasta and meat pattern such as other animal fats, wine, bread, processed meat, and pork. Moreover, the presence of vegetables and legumes in the Pomak “balanced pattern” may play a protective role against CVD. The “balanced pattern” was also associated with lower LDL cholesterol levels, a finding consistent with current literature [60].
The cross-sectional nature of this study does not allow for cause/effect implications to be drawn or generalization of the results from this particular Pomak population. Selection bias should also be considered as a limitation of our study without any data for comparison between responders and nonresponders. Another limitation is that the medical history and medication information come from self-reported data, subjected to possible under-reporting or memory bias. In addition, the FFQ used has not been validated in this specific population, although it has been validated in the general Greek population [21]. Moreover, the principal component analysis is partly underpinned by subjective decisions like how many foods and/or food groups have been included, how many components have been retained, and/or the nomenclature of the patterns, which is also a potential limitation. Seven outcomes of interest have been tested, using the stringent Bonferroni corrected p-value of 0.0125. Using this significance threshold, the associations of the “high in sugar” dietary pattern with SBP, DBP, and glucose levels and the association of the “balanced” dietary pattern with SBP levels, are the only ones to remain significant. The association between the “quick choices” dietary pattern and insulin becomes suggestive as it no longer reaches nominal significance.

5. Conclusions

This study is the first to describe the relationship between the Pomak population dietary habits and cardiovascular risk factors. The subpopulation represented in this study is an isolated population with many traditions and customs preserved during their sociocultural evolution, driven by a strong adherence to the Muslim religion. The “high in sugars” and “balanced” characteristic dietary patterns, identified in our study, are associated with cardiovascular risk factors such as blood pressure, glucose, and cholesterol levels. Although the compounds of these patterns, such as red meat and sweets, have aggravating effects on cardiovascular risk, they play a central role in the social life of the community as part of several religious ceremonies. Thus, the guidelines to decrease the incidence of cardiovascular risk should be adjusted and applied with respect to the traditions of this population, perhaps by providing healthier alternatives and improving effective policy making.

Author Contributions

Data curation: A.-E.F., K.N., P.F., A.A., V.M., E.Z. (Eleni Zengini) and M.K. (Maria Karaleftheri); Formal analysis: A.-E.F., N.W.R., A.M. and A.G.; Funding acquisition: E.Z. (Eleftheria Zeggini); Investigation: A.-E.F., A.G., V.M., E.Z. (Eleni Zengini), E.Z. (Eleftheria Zeggini) and G.D.; Project administration: G.D.; Supervision: G.D.; Validation: M.K. (Maria Kafyra); Writing – original draft: A.-E.F.; Writing – review & editing: M.K. (Maria Kafyra), A.-E.F., E.Z. (Eleftheria Zeggini) and G.D.

Funding

This work was funded by the Wellcome Trust (098051) and the European Research Council (ERC-2011-StG 280559-SEPI).

Acknowledgments

We thank the residents of the Pomak villages for taking part. The HELIC study (www.helic.org) has been supported by many individuals who have contributed to sample collection (including Kiki Kaldaridou, Nilden Selim, Nesse Souloglou), data entry (Thanos Antonos, Dimitra Papagrigoriou, and Betty Spiliopoulou), sample logistics (Sarah Edkins and Emma Gray), research administration (Anja Kolb-Kokocinski, Carol Smee, and Danielle Walker) and informatics (Martin Pollard and Josh Randall). This work has taken place under the auspices of Alexander S. Onassis Public Benefit Foundation Scholarship Program for Hellenes (GZI 049/2012-2013).

Conflicts of Interest

The authors declare no conflict of interest.

References

  1. World Health Organization. Cardiovascular Diseases (CVDs). 2017. Available online: https://www.who.int/en/news-room/fact-sheets/detail/cardiovascular-diseases-(cvds) (accessed on 2 October 2019).
  2. Kim, H.; Caulfield, L.E.; Garcia-Larsen, V.; Steffen, L.M.; Coresh, J.; Rebholz, C.M. Plant-Based Diets Are Associated With a Lower Risk of Incident Cardiovascular Disease, Cardiovascular Disease Mortality and All-Cause Mortality in a General Population of Middle-Aged Adults. J. Am. Heart Assoc. 2019, 8, e012865. [Google Scholar] [CrossRef] [PubMed]
  3. Glenn, A.J.; Viguiliouk, E.; Seider, M.; Boucher, B.A.; Khan, T.A.; Blanco Mejia, S.; Kendall, C.W. Relation of Vegetarian Dietary Patterns With Major Cardiovascular Outcomes: A systematic Review and Meta-Analysis of Prospective Cohort Studies. Front. Nutr. 2019, 6, 80. [Google Scholar] [CrossRef] [PubMed] [Green Version]
  4. McRae, M.P. Dietary Fiber is Beneficial for the Prevention of Cardiovascular Disease: An Umbrella Review of Meta-analyses. J. Chiropr. Med. 2017, 16, 289–299. [Google Scholar] [CrossRef] [PubMed]
  5. Getz, G.S.; Reardon, C.A. Nutrition and cardiovascular disease. Arterioscler. Thromb. Vasc. Biol. 2007, 27, 2499–2506. [Google Scholar] [CrossRef] [Green Version]
  6. Aune, D.; Keum, N.; Giovannucci, E.; Fadnes, L.T.; Boffetta, P.; Greenwood, D.C.; Norat, T. Dietary intake and blood concentrations of antioxidants and the risk of cardiovascular disease, total cancer, and all-cause mortality: A systematic review and dose-response meta-analysis of prospective studies. Am. J. Clin. Nutr. 2018, 108, 1069–1091. [Google Scholar] [CrossRef]
  7. Torres, N.; Guevara-Cruz, M.; Velázquez-Villegas, L.A.; Tovar, A.R. Nutrition and Atherosclerosis. Arch. Med. Res. 2015, 46, 408–426. [Google Scholar] [CrossRef]
  8. Sacks, F.M.; Svetkey, L.P.; Vollmer, W.M.; Appel, L.J.; Bray, G.A.; Harsha, D.; Karanja, N. Effects on blood pressure of reduced dietary sodium and the Dietary Approaches to Stop Hypertension (DASH) diet. DASH-Sodium Collaborative Research Group. N. Engl. J. Med. 2001, 344, 3–10. [Google Scholar] [CrossRef]
  9. Schwingshackl, L.; Chaimani, A.; Schwedhelm, C.; Toledo, E.; Pünsch, M.; Hoffmann, G.; Boeing, H. Comparative effects of different dietary approaches on blood pressure in hypertensive and pre-hypertensive patients: A systematic review and network meta-analysis. Crit. Rev. Food Sci. 2019, 59, 2674–2687. [Google Scholar] [CrossRef]
  10. Saneei, P.; Salehi-Abargouei, A.; Esmaillzadeth, A.; Azadbakht, L. Influence of Dietary Approaches to Stop Hypetension (DASH) diet on blood pressure: A systematic review and meta-analysis on randomized controlled trials. Nutr. Metab. Cardiovasc. Dis. 2014, 24, 1253–1261. [Google Scholar] [CrossRef]
  11. Thorpe, M.G.; Milte, C.M.; Crawford, D.; McNaughton, S.A. A comparison of the dietary patterns derived by principal component analysis and cluster analysis in older Australians. Int. J. Behav. Nutr. Phys. Act. 2016, 13, 30. [Google Scholar] [CrossRef] [Green Version]
  12. Varvounis, M.G. Traditional Culture of Thrace Pomaks-Folklore Essays, 1st ed.; Odysseas: Athens, Greece, 2000. [Google Scholar]
  13. Asimakopoulou, F.C.-L.S. The Muslim Minority of Thrace and Greek–Turkish Relations. 2002. Available online: https://www.tandfonline.com/doi/abs/10.1080/13602000902726723 (accessed on 2 October 2019).
  14. Weekes, R.V. Muslim Peoples: A World Ethnographic Survey Greenwood; Greenwood Press: Westport, CT, USA, 1984. [Google Scholar]
  15. Friedewald, W.T.; Levy, R.I.; Fredrickson, D.S. Estimation of the concentration of low-density lipoprotein cholesterol in plasma, without use of the preparative ultracentrifuge. Clin. Chem. 1972, 18, 499–502. [Google Scholar] [PubMed]
  16. Farmaki, A.E.; Rayner, N.W.; Matchan, A.; Spiliopoulou, P.; Gilly, A.; Kariakli, V.; Dedoussis, G. The mountainous Cretan dietary patterns and their relationship with cardiovascular risk factors: The Hellenic Isolated Cohorts MANOLIS Study. Public Health Nutr. 2017, 20, 1063–1074. [Google Scholar] [CrossRef] [PubMed] [Green Version]
  17. Yannakoulia, M.; Melistas, L.; Solomou, E.; Yiannakouris, N. Association of eating frequency with body fatness in pre- and postmenopausal women. Obesity 2007, 15, 100–106. [Google Scholar] [CrossRef] [PubMed] [Green Version]
  18. Ainsworth, B.E.; Haskell, W.L.; Herrmann, S.D.; Meckes, N.; Bassett, D.R., Jr.; Tudor-Locke, C.; Greer, J.L.; Vezina, J.; Whitt-Glover, M.C.; Leon, A.S. Compendium of Physical Activities: A second update of codes and MET values. Med. Sci. Sports Exerc. 2011, 43, 1575–1581. [Google Scholar] [CrossRef] [Green Version]
  19. Bountziouka, V.; Bathrellou, E.; Giotopoulou, A.; Katsagoni, C.; Bonou, M.; Vallianou, N.; Panagiotakos, D.B. Development, repeatability and validity regarding energy and macronutrient intake of a semi-quantitative food frequency questionnaire: Methodological considerations. Nutr. Metab. Cardiovasc. Dis. 2011, 22, 659–667. [Google Scholar] [CrossRef]
  20. Institute of Preventive Medicine, Environmental and Occupational Health, PROLEPSIS. National Dietary Guidelines for Adults. 2014. Available online: http://www.diatrofikoiodigoi.gr/files/html/adults/files/assets/basic-html/index.html#1 (accessed on 3 October 2019).
  21. Black, A.E. Critical evaluation of energy intake using the Goldberg cut-off for energy intake:basal metabolic rate. A practical guide to its calculation, use and limitations. Int. J. Obes. Relat. Metab. Disord. 2000, 24, 1119–1130. [Google Scholar] [CrossRef] [Green Version]
  22. Goldberg, G.R.; Black, A.E.; Jebb, S.A.; Cole, T.J.; Murgatroyd, P.R.; Coward, W.A.; Prentice, A.M. Critical evaluation of energy intake data using fundamental principles of energy physiology: 1. Derivation of cut-off limits to identify under-recording. Eur. J. Clin. Nutr. 1991, 45, 569–581. [Google Scholar]
  23. Hills, A.P.; Mokhtar, N.; Byrne, N.M. Assessment of Physical Activity and Energy Expenditute: An Overview of Objective Measure. Front. Nutr. 2014, 1, 5. [Google Scholar] [CrossRef]
  24. World Health Organization. Report of a joint FAO/WHO/UNU expert consultation. In Energy and Protein Requirements; World Health Organization: Geneva, Switzerland, 1985; Volume 724, pp. 1–206. Available online: http://www.fao.org/3/AA040E/AA040E00.htm (accessed on 4 October 2019).
  25. Revelle, W. Procedures for Personality and Psychological Research; Northwestern University: Evanston, IL, USA, 2014; Available online: http://CRAN.R-project.org/package=psych Version=1.4.8 (accessed on 4 October 2019).
  26. Team, R.C. A Language and Environment for Statistical Computing; Foundation for Statistical Computing: Vienna, Austria, 2008; ISBN 3-900051-07-0. Available online: https://www.r-project.org/ (accessed on 4 October 2019).
  27. Warnes, G.R.; Bolker, B.; Lumley, T.; Johnson, R.C. Contributions from Randall C. Johnson are Copyright SAIC-Frederick, Inc. Funded by the Intramural Research Program, of the NIH, National Cancer Institute and Center for Cancer Research under NCI Contract NO1-CO-12400. Gmodels: Various R Programming Tools for Model Fitting. R Package Version 2.15.4.1. 2013. Available online: http://CRAN.R-project.org/package=gmodels (accessed on 4 October 2019).
  28. World Health Organisation. Waist Circumference and Waist–Hip Ratio: Report of a WHO Expert Consultation, Geneva, 8–11 December 2008; World Health Organisation: Geneva, Switzerland, 2011. [Google Scholar]
  29. National Cholesterol Education Program (NCEP) Expert Panel on Detection, Evaluation, and Treatment of High Blood Cholesterol in Adults (Adult Treatment Panel III). Third Report of the National Cholesterol Education Program (NCEP) Expert Panel on Detection, Evaluation, and Treatment of High Blood Cholesterol in Adults (Adult Treatment Panel III) final report. Circulation 2002, 106, 3143–3421. [Google Scholar] [CrossRef]
  30. Martin, N.; Maes, H. Multivariate Analysis; Academic Press: New York, NY, USA, 1979. [Google Scholar]
  31. Statistics IS. SPSS, IBM Corp. Released 2012. IBM SPSS Statistics for Windows, Version 21.0; IBM Corp.: Armonk, NY, USA, 2012. [Google Scholar]
  32. Reedy, J.; Subar, A.; George, S.; Krebs-Smith, S. Extending Methods in Dietary Patterns Research. Nutrients 2018, 10, 571. [Google Scholar] [CrossRef] [Green Version]
  33. Panoutsopoulou, K.; Hatzikotoulas, K.; Xifara, D.K.; Colonna, V.; Farmaki, A.E.; Ritchie, G.R.; Matchan, A. Genetic characterization of Greek population isolates reveals strong genetic drift at missense and trait-associated variants. Nat. Commun. 2014, 5, 5345. [Google Scholar] [CrossRef] [PubMed] [Green Version]
  34. Kristiansson, K.; Naukkarinen, J.; Peltonen, L. Isolated populations and complex disease gene identification. Genome Biol. 2008, 9, 109–117. [Google Scholar] [CrossRef] [PubMed]
  35. Panagiotakos, D.B.; Pitsavos, C.; Chrysohoou, C.; Skoumas, I.; Stefanadis, C. Five-year incidence of cardiovascular disease and its predictors in Greece: The ATTICA study. Vasc. Med. 2008, 13, 113–121. [Google Scholar] [CrossRef] [PubMed] [Green Version]
  36. Pitsavos, C.; Panagiotakos, D.B.; Chrysohoou, C.; Stefanadis, C. Epidemiology of cardiovascular risk factors in Greece: Aims, design and baseline characteristics of the ATTICA study. BMC Public Health. 2003, 3, 32. [Google Scholar] [CrossRef] [PubMed] [Green Version]
  37. Athyros, V.G.; Bouloukos, V.I.; Pehlivanidis, A.N.; Papageorgiou, A.A.; Dionysopoulou, S.G.; Symeonidis, A.N.; MetS-Greece Collaborative Group. The prevalence of the metabolic syndrome in Greece: The MetS-Greece Multicentre Study. Diabetes Obes. Metab. 2005, 7, 397–405. [Google Scholar] [CrossRef] [PubMed]
  38. Panagiotakos, D.B.; Tzima, N.; Pitsavos, C.; Chrysohoou, C.; Papakonstantinou, E.; Zampelas, A.; Stefanadis, C. The relationship between dietary habits, blood glucose and insulin levels among people without cardiovascular disease and type 2 diabetes; The ATTICA study. Rev. Diabet. Stud. 2005, 2, 208–215. [Google Scholar] [CrossRef] [Green Version]
  39. Missoni, S. Metabolic syndrome among the inhabitants of the island of Vis. Coll. Antropol. 2009, 33, 1281–1287. [Google Scholar]
  40. Athanasiadis, A. Morbidity and Mortality of Four Commune Area of the Echinos Medical Centre. Epidemiological Map of the Cross-border Area of the Region of Eastern Macedonia-Thrace. 2012. Available online: http://www.2040.syzefxis.gov.gr/images/athanasiadis.pdf (accessed on 4 October 2019).
  41. Panagiotakos, D.B.; Pitsavos, C.; Chrysohoou, C.; Skoumas, J.; Stefanadis, C. Status and management of blood lipids in Greek adults and their relation to socio-demographic, lifestyle and dietary factors: The ATTICA Study. Blood lipids distribution in Greece. Atherosclerosis 2004, 173, 353–361. [Google Scholar] [CrossRef]
  42. Panagiotakos, D.B.; Pitsavos, C.H.; Chrysohoou, C.; Skoumas, J.; Papadimitriou, L.; Stefanadis, C.; Toutouzas, P.K. Status and management of hypertension in Greece: Role of the adoption of a Mediterranean diet: The Attica study. J. Hypertens. 2003, 21, 1483–1489. [Google Scholar] [CrossRef]
  43. Trichopoulos, D.; Lagiou, P. Dietary patterns and mortality. Br. J. Nutr. 2001, 85, 133–134. [Google Scholar] [CrossRef] [Green Version]
  44. Welsh, J.A.; Sharma, A.; Abramson, J.L.; Vaccarino, V.; Gillespie, C.; Vos, M.B. Caloric sweetener consumption and dslipidemia among US adults. JAMA 2010, 303, 1490–1497. [Google Scholar] [CrossRef] [PubMed]
  45. Stanhope, K.L.; Schwarz, J.M.; Keim, N.L.; Griffen, S.C.; Bremer, A.A.; Graham, J.L.; McGahan, J.P. Consuming fructose-sweetened, not glucose-sweetened, beverages increases visceral adiposity and lipids and decreases insulin sensitivity in overweight/obese humans. J. Clin. Investig. 2009, 119, 1322–1334. [Google Scholar] [CrossRef] [PubMed] [Green Version]
  46. Jayalath, V.H.; de Souza, R.J.; Ha, V.; Mirrahimi, A.; Blanco-Mejia, S.; Di Buono, M.; Kendall, C.W. Sugar-sweetened beverage consumption and incident hypertension: A systematic review and meta-analysis of prospective cohorts. Am. J. Clin. Nutr. 2015, 102, 914–921. [Google Scholar] [CrossRef] [PubMed] [Green Version]
  47. Cheungpasitporn, W.; Thongprayoon, C.; Edmonds, P.J.; Srivali, N.; Ungprasert, P.; Kittanamongkolchai, W.; Erickson, S.B. Sugar and artificially sweetened soda consumption linked to hypertension: A systematic review and meta-analysis. Clin. Exp. Hypertens. 2015, 37, 587–593. [Google Scholar] [CrossRef] [PubMed]
  48. Pase, M.P.; Grima, N.; Cockerell, R.; Pipingas, A. Habitual intake of fruit juice predicts central blood pressure. Appetite 2015, 84, 68–72. [Google Scholar] [CrossRef] [PubMed]
  49. Brown, C.M.; Dulloo, A.G.; Yepuri, G.; Montani, J.P. Fructose ingestion acutely elevates blood pressure in healthy young humans. Am. J. Physiol. Regul. Integr. Comp. Physiol. 2008, 294, R730–R737. [Google Scholar] [CrossRef]
  50. Klein, A.V.; Kiat, H. The mechanisms underlying fructose-induced hypertentsion: A review. J. Hypertens. 2015, 33, 912–920. [Google Scholar] [CrossRef] [Green Version]
  51. InterAct Consortium. Consumption of sweet beverages and type 2 diabetes incidence in European adults: Results from EPIC-InterAct. Diabetologia 2013, 56, 1520–1530. [Google Scholar] [CrossRef]
  52. Sluijs, I.; van der Schouw, Y.T.; van der, A.D.L.; Spijkerman, A.M.; Hu, F.B.; Grobbee, D.E.; Beulens, J.W. Carbohydrate quantity and quality and risk of type 2 diabetes in the European Prospective Investigation into Cancer and Nutrition-Netherlands (EPIC-NL) study. Am. J. Clin. Nutr. 2010, 92, 905–911. [Google Scholar] [CrossRef]
  53. Martinez-Gonzalez, M.A.; Martin-Calvo, N. The major European dietary patterns and metabolic syndrome. Rev. Endocr. Metab. Disord. 2013, 14, 265–271. [Google Scholar] [CrossRef]
  54. Panagiotakos, D.B.; Pitsavos, C.; Skoumas, Y.; Stefanadis, C. The association between food patterns and the metabolic syndrome using principal components analysis: The ATTICA Study. J. Am. Diet. Assoc. 2007, 107, 979–987. [Google Scholar] [CrossRef] [PubMed]
  55. Barnard, N.; Levin, S.; Trapp, C. Meat Consumption as a Risk Factor for Type 3 Diabetes. Nutrients 2014, 6, 897–910. [Google Scholar] [CrossRef] [PubMed] [Green Version]
  56. Cascio, G.; Schiera, G.; Di Liegro, I. Dietary fatty acids in metabolic syndrome, diabetes and cardiovascular diseases. Curr. Diabetes Rev. 2012, 8, 2–17. [Google Scholar] [CrossRef] [PubMed]
  57. Angelieri, C.T.; Barros, C.R.; Siqueira-Catania, A.; Ferreira, S.R.G. Trans fatty acid intake is associated with insulin sensitivity but independently of inflammation. Braz. J. Med. Biol. Res. 2012, 45, 625–631. [Google Scholar] [CrossRef] [Green Version]
  58. Guasch-Ferré, M.; Becerra-Tomas, N.; Ruiz-Canela, M.; Corella, D.; Schröder, H.; Estruch, R.; Serra-Majem, L. Total and subtypes of dietary fat intake and risk of type 2 diabetes mellitus in the Prevencion con Dieta Mediterranean (PREDIMED) study. Am. J. Clin. Nutr. 2017, 105, 723–735. [Google Scholar] [CrossRef] [Green Version]
  59. Pala, V.; Sieri, S.; Masala, G.; Palli, D.; Panico, S.; Vineis, P.; Ceroti, M. Associations between dietary pattern and lifestyle, anthropometry and other health indicators in the elderly participants of the EPIC-Italy cohort. Nutr. Metab. Cardiovasc. Dis. 2006, 16, 186–201. [Google Scholar] [CrossRef]
  60. Miller, V.; Mente, A.; Dehghan, M.; Rangarajan, S.; Zhang, X.; Swaminathan, S.; Bangdiwala, S.I. Fruit, vegetable and legume intake and cardiovascular disease and deaths in 18 countries (PURE): A prospective cohort study. Lancet 2017, 390, 2037–2049. [Google Scholar] [CrossRef] [Green Version]
Figure 1. Recruitment flowchart.
Nutrients 11 03043 g001
Table 1. Anthropometric, clinical, and dietary characteristics of the study population by sex.
TotalMenWomenp
nMean (sd)nMean (sd)nMean (sd)
%1702 522(30.7)1180(69.3)
Age (years)166444.87 (15.48)51948.71 (15.89)114543.13 (14.97)<0.001
Current weight (kg)163872.8 (14.35)51078.63 (13.42)112870.16 (13.98)<0.001
Standing height (cm)1635162.97 (9.62)508172.62 (7.89)1127158.61 (6.73)<0.001
Waist circumference (cm)158892.17 (15.1)49696.14 (12.35)109290.37 (15.87)<0.001
WHR15860.87 (0.1)4940.94 (0.08)10920.84 (0.1)<0.001
BMI (kg/m2)163227.52 (5.42)50826.37 (4.14)112428.03 (5.83)<0.001
BMI status1632 508(31.1)1124(68.9)
Underweight52(3.2)7(1.4)45(4.0)<0.001
Normal weight486(29.8)185(36.4)301(26.8)
Overweight583(35.7)227(44.7)356(31.7)
Obese511(31.3)89(17.5)422(37.5)
SBP (mmHg)1265131.21 (16.63)433133.27 (15.73)832130.14 (16.98)0.001
DBP (mmHg)127283.12 (11.01)43683.47 (10.38)83682.94 (11.32)0.398
Food consumption (servings/week)
  Refined cereals160729.6 (9.2)50030.2 (9.2)110729.3 (9.2)0.090
  Full fat dairy162518.2 (7.3)50418.8 (7.9)112117.9 (7.0)0.026
  Vegetables162416.5 (6.3)50416.8 (6.4)112016.4 (6.3)0.310
  Sweets161014.2 (6.2)49714.7 (5.8)111314.0 (6.4)0.031
  Coffee162610.7 (4.9)50411.5 (4.3)112210.3 (5.1)<0.001
  Fresh fruits16269.5 (8.5)5049.4 (8.6)11229.5 (8.5)0.784
  Red meat16247.5 (3.6)5037.7 (4.0)11217.5 (3.3)0.190
  Fish16212.7 (1.8)4992.7 (1.8)11222.7 (1.8)0.456
  Potatoes16262.6 (1.5)5042.7 (1.6)11222.6 (1.5)0.292
  Legumes16261.8 (1.1)5041.8 (1.1)11221.8 (1.1)0.975
Table 2. The most prevalent diseases by sex.
Disease N (%)Total 1702Men 522 (30.7)Women 1180 (69.3)p
Hypertension444 (26.1)139 (26.6)305 (25.8)0.735
Hyperlipidemia284 (16.7)102 (19.5)182 (15.4)0.036
Hypothyroidism147 (8.6)11 (2.1)136 (11.5)<0.001
Diabetes mellitus II125 (7.3)53 (10.2)72 (6.1)0.003
Coronary heart disease (CHD)115 (6.8)61 (11.7)54 (4.6)<0.001
Heart failure112 (6.6)41 (7.9)71 (6.0)0.159
Arthritis127 (7.5)39 (7.5)88 (7.5)0.992
Presbyopia131 (7.7)58 (11.1)73 (6.2)<0.001
Migraines129 (7.6)25 (4.8)104 (8.8)0.004
Mental Health Issues
Depression177 (10.4)39 (7.5)138 (11.7)0.008
Table 3. Sociodemographic and lifestyle characteristics by sex.
TotalMenWomenp
n(%)n(%)n(%)
Marital status1629 506(31.1)1123(68.9)
  Married1413(86.7)439(86.8)974(86.7)<0.001
  Single 153(9.4)61(12.1)92(8.2)
  Widowed63(3.9)6(1.2)57(5.1)
Educational attainment1625 499(30.7)1126(69.3)
  No education 178(10.9)29(5.8)149(13.2)<0.001
  Primary1174(72.2)348(69.6)826(73.3)
  Secondary237(14.6)100(20.0)137(12.2)
  Tertiary36(2.2)22(4.4)14(1.2)
Total years of education *, mean (SD)9676.86 (2.42)3037.45 (2.99)6646.59 (2.06)<0.001
Smoking habits1621 506(31.2)1115(68.8)
  Current smokers257(15.9)232(45.8)25(2.2)<0.001
  Former smokers103(6.4)98(19.4)5(0.5)
  Never smokers1261(77.8)176(34.8)1085(97.3)
Mean (SD) Mean (SD) Mean (SD)
Smoking starting age34016.72 (3.79)31516.61 (3.72)2518.08 (4.45)0.062
Quit smoking age10941.5 (12.44)10541.87 (12.25)432 (15.6)0.120
Total smoking years30425 (14.07)28025.8 (14.02)2415.67 (11.25)0.001
Pack-years *27430.5 (24.7)25131.9 (24.8)2315.5 (18.3)<0.001
PAL *16001.06 (0.13)4991.12 (0.19)11011.03 (0.09)<0.001
ee16261864.4 (467.4)5022120.1 (523.6)11241750.2 (389.3)<0.001
EI/EE15701.24 (0.44)4821.09 (0.37)10881.31 (0.45)<0.001
ei16072199.2 (618.05)4952215.59 (649.31)11122191.91 (603.78)0.479
* Mann–Whitney test.
Table 4. Factor loadings derived from principal component analysis conducted with dietary variables (N = 1513).
Principal Components
Predicting variables1234
Fresh fruits0.768−0.0740.192−0.143
Sweets with fat0.7220.027−0.065−0.059
Beverages and juices0.6940.147−0.047−0.154
Starchy sweets0.5890.1650.0370.142
Processed meat0.0490.7390.0020.002
Ready pies−0.0650.678−0.0480.123
Refined breads0.1670.6780.0410.391
Fried potatoes0.1900.4900.128−0.278
Pasta and rice−0.052−0.1060.7160.133
Vegetables0.2060.0240.6390.247
Legumes−0.4050.0730.5710.014
Red meat0.3500.2780.533−0.192
Homemade pies−0.277−0.0300.2190.706
Full-fat cheese0.1550.4930.0420.597
Potatoes−0.0410.0570.0560.569
Variance explained (%)16.314.011.010.7
Table 5. Biochemical analyses by dietary pattern.
Pattern Adherence
High in Sugar DietQuick Choices DietBalanced DietHomemade Pattern
TotalLowHighPLowHighPLowHighPLowHighP
nMean(sd)Mean(sd)Mean(sd) Mean(sd)Mean(sd) Mean(sd)Mean(sd) Mean(sd)Mean(sd)
Glucose (mg/dl)164693.620.590.121.297.219.3<0.00194.521.192.819.90.12992.320.095.121.00.01393.720.193.621.00942
HDL Cholesterol (mg/dl)167045.211.846.612.343.711.2<0.00145.311.945.011.70.58445.411.644.912.00.49244.711.745.611.90.197
LDL Cholesterol (mg/dl)1663118.534.2116.634.8120.233.30.054120.435.0116.332.90.032118.533.6118.334.50.901117.734.0119.134.20.453
Triglycerides (mg/dl)1652137.568.9142.972.1131.763.90.003137.266.2137.270.40.998136.569.6137.966.90.713137.470.7137.065.60.909
Insulin (uIU/ml)162913.19.713.010.113.19.20.82412.89.813.39.50.41612.69.113.510.10.09813.19.413.19.80.962
Total Cholesterol (mg/dl)1668192.539.0193.138.9191.738.10.517194.639.4190.137.40.032192.037.9192.839.10.728191.639.0193.338.00.432
Low versus high as defined by the median of the corresponding pattern score; P: p-value, HDL: High density lipoprotein, LDL: Low density lipoprotein, In bold: p -value < 0.05.
Table 6. Results from multiple linear regression analysis of data from POMAK-HELIC study that evaluated the association between dietary patterns and cardiometabolic indices (N = 1513).
Model 1Model 2Adj-R sqModel 3Adj-R sqModel 4Adj-R sq
βCIpβCIpβCIpβCIp
HDL (mg/dL)0.16
  High sugar−1.39−2.03,−0.75<0.001−1.03−1.64,−0.420.0010.15−1.28−2.02,−0.550.0010.16−1.18−1.99,−0.360.005
  Quick−0.43−1.07,0.210.1900.16−0.46,0.780.6040.150.23−0.45,0.910.5080.15−0.02−0.75,0.700.949
  Balanced−0.23−0.87,0.410.4850.35−0.26,0.950.2620.150.40−0.27,1.070.2440.150.19−0.52,0.900.597
  Homemade0.35−0.30,0.990.2890.680.08,1.280.0260.150.690.07,1.310.0300.150.62−0.01,1.250.054
SBP (mmHg)0.49
  High sugar2.871.84,3.89<0.0013.632.85,4.41<0.0010.473.362.42,4.30<0.0010.492.741.71,3.77<0.001
  Quick−1.10−2.14,−0.060.037−0.11−0.93,0.710.7910.43−1.02−1.90,−0.140.0230.46−0.53−1.45,0.390.260
  Balanced0.74−0.30,1.780.163−1.00−1.80,−0.200.0140.43−2.10−2.96,−1.24<0.0010.47−1.59−2.50,−0.690.001
  Homemade1.060.02,2.100.045−0.02−0.81,0.780.9680.43−0.31−1.12,0.510.4590.46−0.26−1.06,0.540.527
DBP (mmHg)0.28
  High sugar1.650.99,2.32<0.0011.941.35,2.54<0.0010.271.560.84,2.28<0.0010.281.460.67,2.26<0.001
  Quick0.20−0.48,0.870.5690.710.10,1.320.0230.250.20−0.47,0.860.5620.260.46−0.25,1.170.208
  Balanced0.37−0.30,1.050.278−0.48−1.08,0.110.1120.24−1.22−1.87,−0.56<0.0010.27−0.85−1.54,−0.150.017
  Homemade0.51−0.17,1.180.141−0.01−0.61,0.580.9650.24−0.23−0.84,0.380.4630.26−0.17−0.79,0.450.587
Cholesterol (mg/dL)0.11
  High sugar0.06−2.03,2.150.9560.51−1.56,2.570.6290.090.76−1.72,3.230.5500.11−0.43−3.17,2.300.756
  Quick−2.63−4.71,−0.540.014−1.29−3.37,0.790.2240.09−1.65−3.91,0.620.1530.11−2.05−4.49,0.390.100
  Balanced0.31−1.78,2.400.771−1.41−3.44,0.620.1730.09−1.46−3.71,0.780.2010.11−1.88−4.27,0.520.124
  Homemade0.61−1.48,2.710.565−0.41−2.42,1.610.6910.09−0.14−2.22,1.950.8970.11−1.40−2.52,1.710.710
LDL (mg/dL)0.11
  High sugar2.100.25,3.950.0262.210.37,4.060.0190.072.700.50,4.900.0160.101.45−0.97,3.890.240
  Quick−1.92−3.78,−0.070.042−1.47−3.34,0.400.1220.07−2.10−4.12,−0.090.0410.10−2.04−4.20,0.130.065
  Balanced−0.37−2.22,1.480.695−1.80−3.61,0.020.0530.07−2.16−4.16,−0.170.0330.10−2.15−4.28,−0.030.047
  Homemade0.46−1.39,2.310.627−0.36−2.17,1.440.6930.07−0.16−2.02,1.700.1690.09−0.31−2.18,1.570.748
Glucose0.30
  High sugar3.112.00,4.22<0.0013.372.30,4.43<0.0010.173.382.20,4.57<0.0010.293.442.14,4.75<0.001
  Quick−1.09−2.21,0.040.058−0.72−1.81,0.360.1920.14−1.35−2.44,−0.260.0150.28−0.35−1.51,0.810.557
  Balanced2.171.06,3.29<0.0010.98−0.08,2.040.0700.140.36−0.72,1.450.5110.280.99−0.15,2.130.090
  Homemade−0.06−1.18,1.070.922−0.80−1.85,0.250.1340.14−1.25−2.26,−0.240.0150.28−0.95−1.95,0.060.066
Insulin (μIU/mL)0.05
  High sugar0.11−0.42,0.640.675−0.19−0.73,0.340.4790.05−0.19−0.84,0.460.5660.050.09−0.62,0.810.799
  Quick0.580.05,1.110.0320.550.01,1.090.0440.050.680.09,1.270.0250.050.730.09,1.370.025
  Balanced0.29−0.24,0.820.2880.04−0.48,0.570.8770.050.12−0.46,0.710.6790.050.24−0.39,0.860.461
  Homemade−0.07−0.60,0.460.790−0.19−0.71,0.330.4730.05−0.17−0.71,0.380.5500.05−0.11−0.66,0.440.697
Model 1: unadjusted; Model 2: Adjusted for age, sex, BMI; Model 3: Adjusted for age, sex, BMI, medication (where applicable), smoking and energy intake to energy expenditure ratio; Model 4: Adjusted for age, sex, BMI, medication (where applicable), smoking, energy intake to energy expenditure ratio, the remaining food patterns scores; CI: confidence interval, P: p-value, Adj-R sq: adjusted R square, BMI: Body mass index, SBP: Systolic blood pressure, DBP: Diastolic blood pressure, HDL: High density lipoprotein, LDL: Low density lipoprotein; In bold: p-value < 0.0125.
Table 7. Logistic regression analysis results of the association of quartiles of dietary components with pathological groups of low HDL, SBP, DBP, LDL cholesterol, and glucose levels (N = 1513).
MODEL 1MODEL 2
1st2nd3rd2nd3rd
Ref.OR (95%CI)–POR (95%CI)–P
High in Sugars Diet Score Tertiles
Low HDL1.001.51 (1.09,2.09)–0.0132.00 (1.38,2.90)–<0.0011.42 (1.01,2.00)–0.0431.84 (1.24,2.75)–0.003
SBP groups1.002.27 (1.50,3.44)–<0.0012.87 (1.74,4.72)–<0.0012.07 (1.32,3.23)–0.0012.40 (1.38,4.17)–0.002
DBP groups1.001.85 (1.25,2.73)–0.0022.55 (1.60,4.07)–<0.0011.87 (1.23,2.84)–0.0032.61 (1.55,4.39)–<0.001
LDL groups1.001.19 (0.85,1.66)–0.3211.71 (1.14,2.55)–0.0091.06 (0.74,1.54)–0.7571.47 (0.96,2.27)–0.079
Glucose groups1.001.50 (1.00,2.25)–0.0521.64 (1.03,2.62)–0.0371.64 (1.06,2.55)–0.0251.85 (1.11,3.08)–0.018
Balanced Diet Score Tertiles
SBP groups 1.000.57 (0.38,0.85)–0.0060.63 (0.42,0.97)–0.0350.56 (0.37,0.86)–0.0070.72 (0.46,1.13)–0.153
DBP groups 1.000.84 (0.57,1.22)–0.3500.84 (0.56,1.25)–0.3870.86 (0.58,1.27)–0.4330.96 (0.63,1.48)–0.857
LDL groups1.000.82 (0.59,1.15)–0.2590.62 (0.43,0.88)–0.0080.81 (0.58,1.15)–0.2400.62 (0.43,0.89)–0.010
P: p-value; OR: odds ratio, CI: confidence interval; In bold: p-value < 0.013; Ref.: reference category for both models; MODEL1 adjusted for age, sex, BMI, physical activity level, smoking, and energy intake; MODEL2 adjusted for age, sex, BMI, physical activity level, smoking, energy intake, and the remaining food components; HDL: high-density lipoprotein—low: <40 mg/dL; SBP: systolic blood pressure—threshold: 140 mmHG; DBP: diastolic blood pressure—threshold: 90 mmHG; LDL: low-density lipoprotein—threshold: 100 mg/dL; glucose threshold: 110 mg/dL.

